1. Introduction
The extensive use of traditional fossil energy has aroused people’s concerns about environmental issues [
1,
2]. The optimal utilization of renewable energies is a crucial factor toward the realization of sustainability and zero carbon in a future energy system [
3]. In fact, researchers are also looking for a variety of clean energy alternatives, and tidal current energy is one of them. In recent years, the development and utilization of tidal current energy resources have received more and more attention from countries around the world [
4]. Due to its uneven distribution in time and space, it is necessary to understand the tidal and current characteristics of the target sea area and evaluate the level of tidal current energy resources before developing it. According to Atlantis Energy, there is more than 120 GW of tidal current energy resources in storage worldwide [
5]. China’s coastal areas are rich in tidal current energy resources, among which the resources off the coast of Zhejiang are the most abundant, with a theoretical average power of 7.09 × 10
6 kW, exceeding half of the total tidal energy resources in the country. The tidal current energy resources in the Zhoushan sea area account for more than 80% of the total resources in Zhejiang Province [
6], with considerable development prospects.
As early as 1993, the Energy Technology Support Unit (ETSU) began a study of tidal currents along the UK coast, using tidal data from the UK Admiralty’s tide tables [
7]. Based on this, Black & Veatch Consulting Company evaluated the tidal current energy resources in the UK, Europe, and worldwide in 2004 [
8]. During the same period, the American Electric Power Research Association (AEPRA) assessed tidal energy resources off the coast of North America [
9], and the Canadian Water Resources Centre (CWRC) assessed tidal energy resources off the coast of Canada [
10,
11]. Tidal current energy resource assessment work has been carried out on a large scale in previous studies during this period, but all of them used a large amount of tidal forecast data. Since then, in the research of Wang [
12], Jin [
13], and M Thiébaut et al. [
14], the recorded data of multiple observation stations and ADCP-measured tidal current data have been used to more accurately evaluate tidal current energy resources in the corresponding regions. With the development of numerical simulation, high-precision ocean numerical models are widely used in the assessment of tidal current energy exploitability, which can effectively make up for the shortcomings of the scarce measured data and small coverage. For example, Wang et al. [
15] applied the MIKE21 two-dimensional hydrodynamic numerical model and calculated the statistics for the exploitable amount of 10 specific sections in Zhoushan; Wu et al. [
16] analyzed the exploitable amount of tidal energy in the Putuo–Huludao Waterway in Zhoushan based on the finite-volume, primitive equation community ocean model (FVCOM); Zhang et al. [
17] established a high-resolution numerical model of Zhoushan based on the FVCOM and evaluated the exploitable amount of tidal energy in the Xihoumen Waterway in Zhoushan. The tidal energy resources in the Jiaozhou Bay region were estimated based on the Princeton Ocean Model (POM) by Lv et al. [
18]. Guo et al. [
19] estimated the exploitable volume near the large and small Changshan Islands using the tidal flow development (TFD) numerical assessment model. It can be seen that although these studies on tidal current energy resource assessment at this stage have achieved a relatively good accuracy, they often only obtain the results of resource reserves or exploitable quantities, which rarely affect the specific results. There is little analysis of the tidal current characteristics that specifically affect tidal current energy development. In the study of G. Iglesias et al. [
20], an attempt was made to combine bathymetry and current velocity with tidal stream exploitability (TSE) to select suitable tidal current energy development sites; Soheil Radfar et al. [
21] proposed a linear equation to calculate the energy capture in the tidal stream arrays. However, tidal currents are a complex hydrodynamic process, and there are many other key factors affecting tidal current energy development. It is important to mention that only a small number of studies have concentrated specifically on the economic feasibility of the systems in question or on how to estimate that feasibility, in spite of the fact that this renewable energy source has many potential benefits [
22].
Based on a numerical hydrodynamic simulation of the Zhoushan sea area, this paper comprehensively evaluates the tidal energy resources in the Guishan Channel and nearby areas by analyzing the critical influencing factors of tidal energy exploitation, such as the tidal current velocity symmetry, flow direction rotation, and annual available effective flow time, and provides a reference for local resource exploitation.
2. Numerical Model and Regional Flow Field Analysis
2.1. Regional Introduction
Zhoushan is an important port area facing the world in China and the fourth new national area. The coastline in the region has a complex topography and numerous waterways. Among them, the study area, i.e., the GCA, is shown in
Figure 1, which is located in the middle of Zhoushan City, between Guanshan Island and Xiushan Island in Daishan County, directly facing the Hangzhou Bay export; it is an important part of the Zhoushan port area and Hangzhou Bay export. There are many waterways in the vicinity of the area, with the Gaoting Waterway in the north and the Guanmen Waterway below Xiushan Island in the south, and the flow velocity is generally high. The regional shoreline is mainly N–E, and the coastline is mostly straight and has a regular semi-daily tide; the maximum width of the area is about 3054 m, the length is about 13.65 km, and the water depth is 23~96 m. The water depth near the coast of Guanshan Island and Xiushan Island is relatively shallow and gradually becomes deeper in the central area. The water depth in the middle part of the east exceeds 90 m, with a complicated underwater terrain. As a famous strong tidal area, the GCA is classified as a tidal energy class I resource area in the results of China’s coastal rural marine energy zoning work [
23], with great potential for tidal energy exploitation. However, a specific assessment of the tidal energy resources in this area is still lacking.
2.2. Model Hydrodynamic Equations
MIKE21 FM HD is a two-dimensional non-constant flow dynamics model developed by the Danish Institute for Water Resources and Water Environment. The model is based on the Navier–Stokes equation with two-dimensional incompressibility and a uniform distribution of Reynolds values, and it obeys the Boussinesq assumption and the assumption of hydrostatic pressure. Two-dimensional shallow water equations are solved by using the finite volume method to discretize the space of the calculation area and the low-order explicit Euler method to integrate time:
where
is time; x and y are Cartesian coordinate system coordinates;
is the tide level;
is the distance from the seawater to the reference surface;
is the total water depth;
is the average velocity along the water depth;
is the local Koch force coefficient,
;
is the angular velocity of the Earth’s rotation;
is the acceleration of gravity, taken as 9.8 m/s
2;
is the local latitude;
is the density of water;
is the relative density of seawater;
are the wind stress components;
are the bottom stress components;
is the local atmospheric pressure;
is the source–sink term;
are the viscous force, turbulent stress, and horizontal convection terms, which are derived from the eddy viscosity equation based on the velocity gradient averaged along the water depth:
,
, and
; and
is the horizontal eddy viscosity coefficient.
2.3. Model Setup
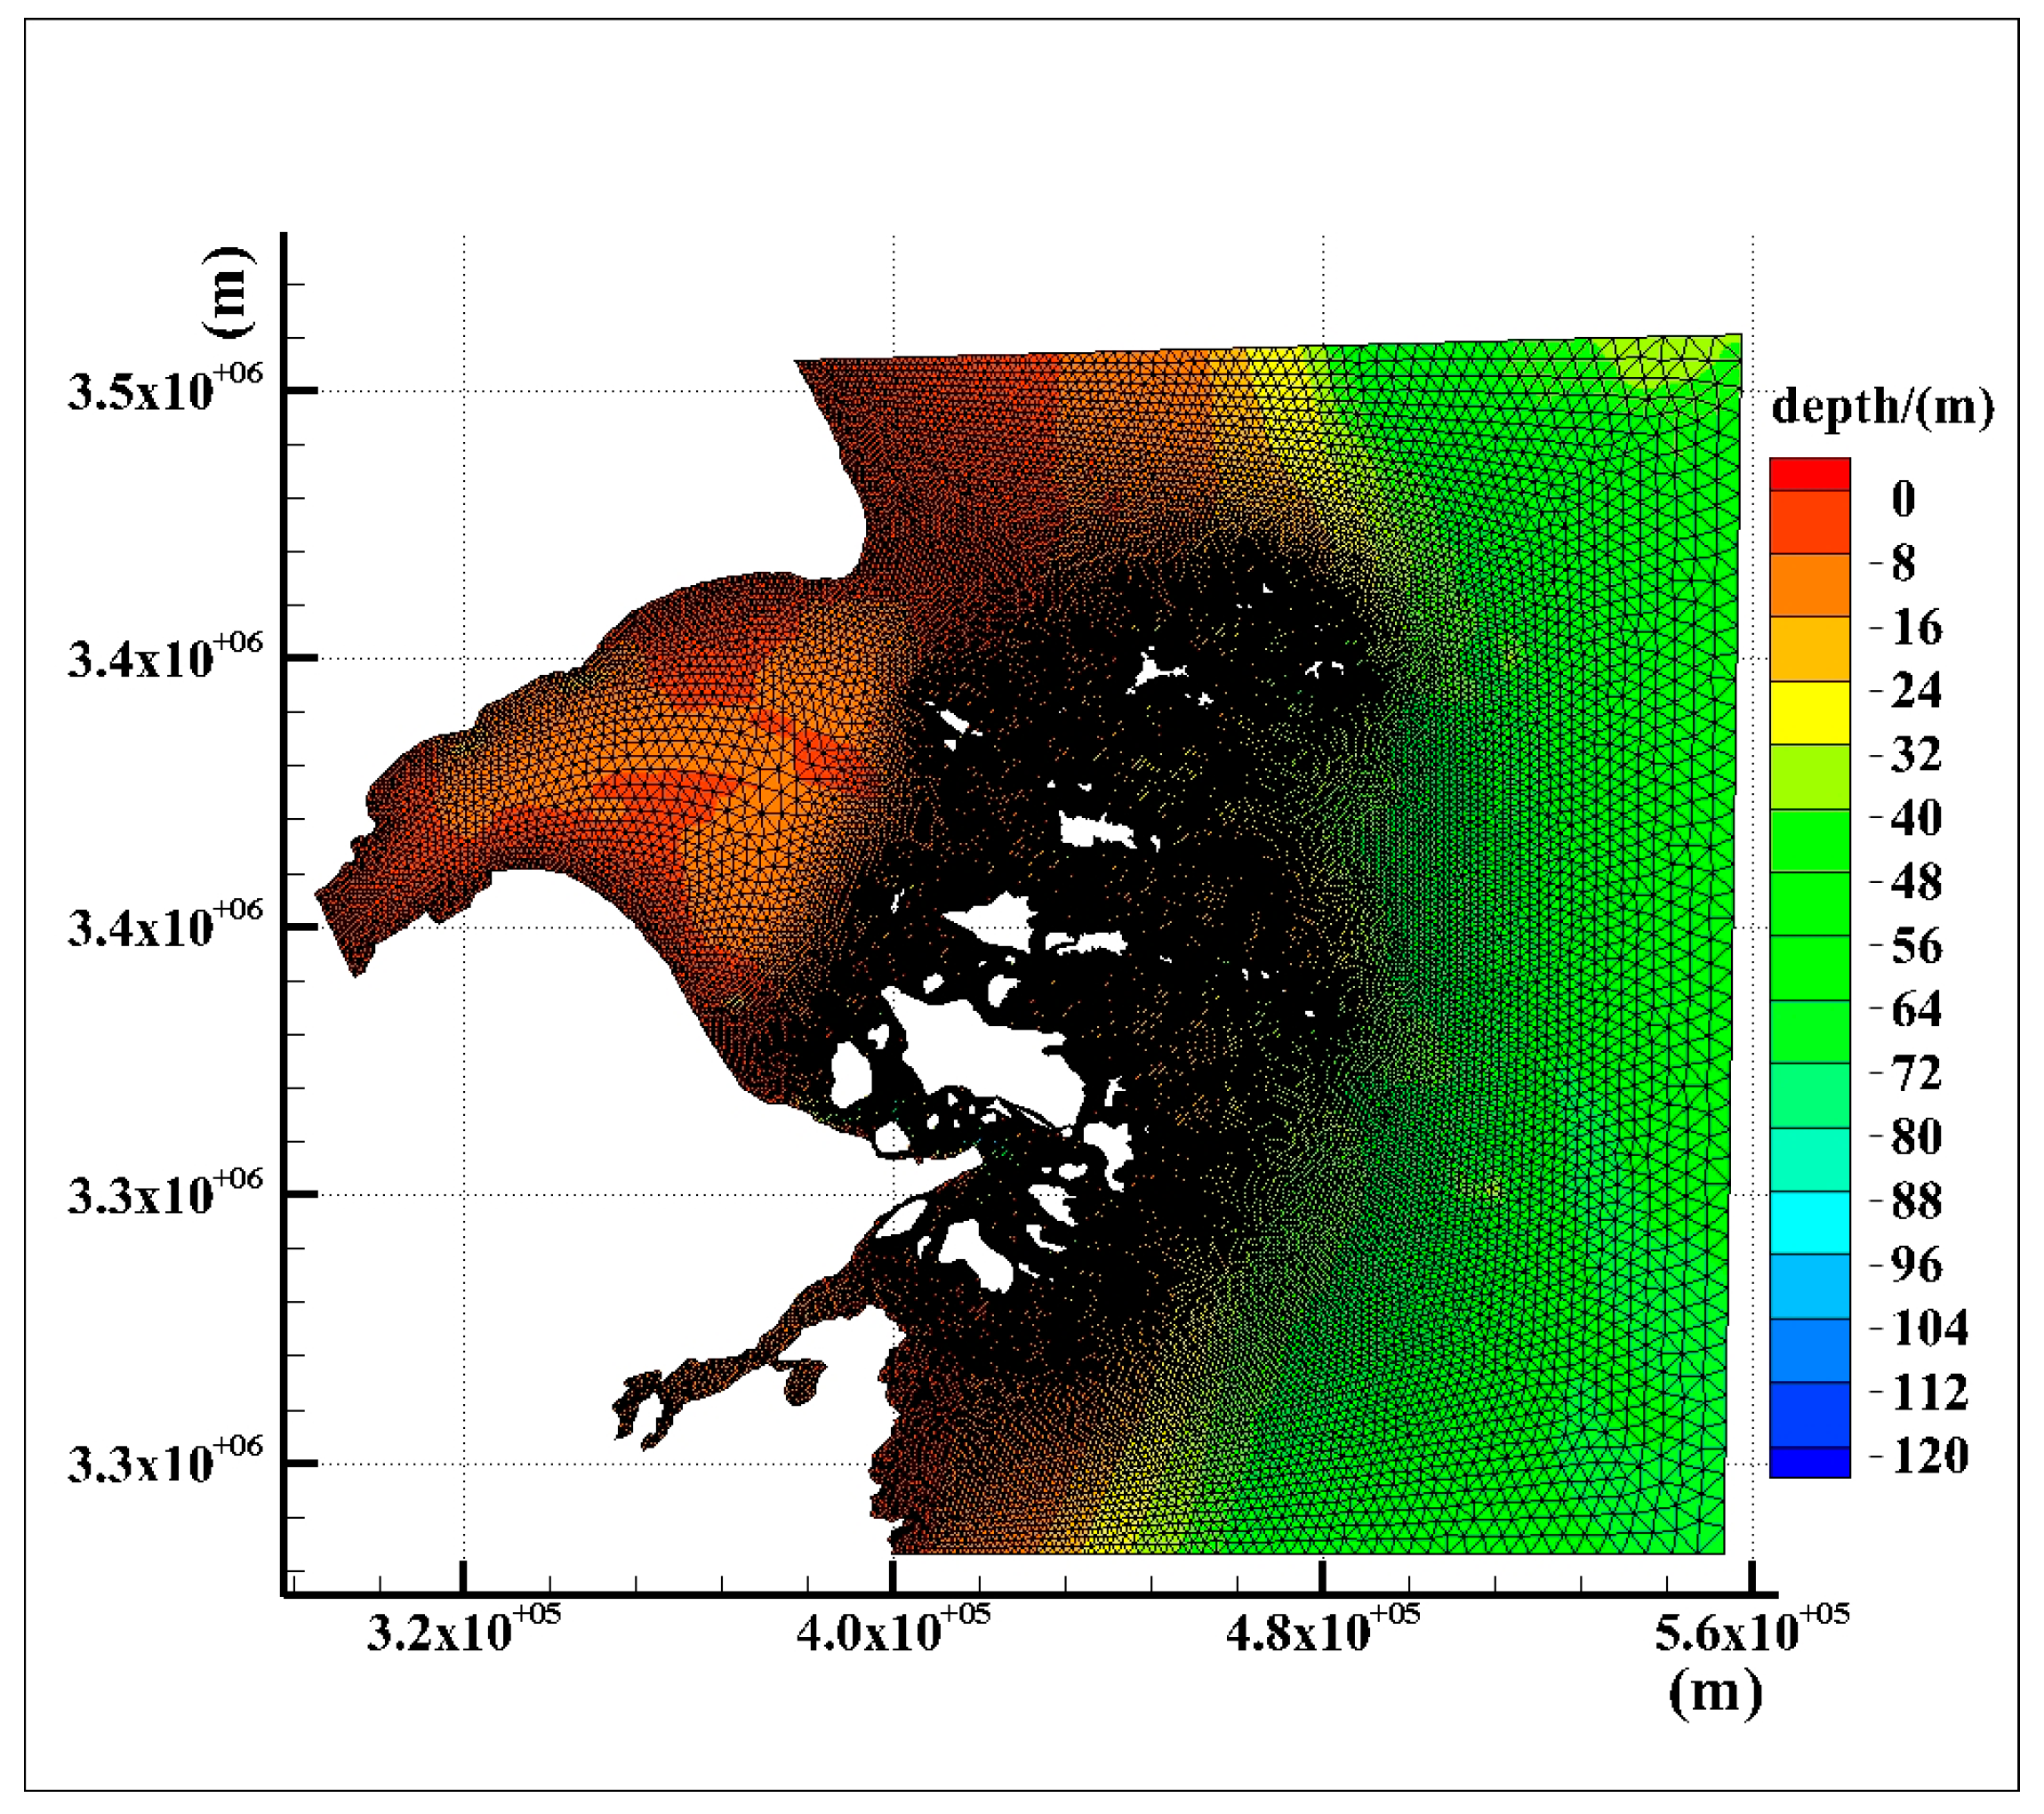
The tidal field of the Zhoushan sea area is mainly influenced by tidal waves from the outer Pacific Ocean, and it is close to the mouth of Hangzhou Bay. It is influenced by the topography, and the role of shallow sea parting is obvious. In order to eliminate the influence caused by the small boundary of the model and better reflect the tidal current characteristics of the region, this paper regards Hangzhou Bay and the surrounding waters of Zhoushan Island as a whole. The simulation range was set as a rectangular area with an east longitude of 120°54′10″~123°46′54″ and a north latitude of 29°31′3″~31°18′3″, where the x and y axes are 3 degrees with a Gaussian projection under the coordinates. Topographic and bathymetric data were obtained from the 3rd edition of the 2020 nautical charts published by the Maritime Administration of the People’s Republic of China. The maximum water depth within the range is 114 m below mean sea level, with significant changes in water depth stratification. The model uses unstructured triangular meshes for meshing to better fit the local terrain, with a total of 112,960 triangles and 58,184 triangle nodes. The grid division encrypts the grid of the Zhoushan Island boundary and Hangzhou Bay inlet. Referring to the relevant literature [
21], the grid of the boundary area in the outer sea is appropriately sparse, and the maximum grid size is about 3000 m after debugging, which can reduce the computational volume of the model without affecting the accuracy. The minimum grid size is controlled at about 150 m, which can reflect relatively more realistic changes in the fine flow field over the study area. The open boundary was set as a tidal boundary driven by the reconciliation constants of M
2, O
1, S
2, K
2, N
2, K
1, P
1, Q
1, M
f, M
m, and S
sa for a total of 11 major divisions of the tide. The closed boundary has zero normal velocity. The horizontal turbulence diffusion coefficient is based on Smagorinsky’s formula, and the value of Cs is 0.28. Manning’s roughness coefficient was chosen for the effect of riverbed roughness and interpolated between 0.012 and 0.025 depending on the water depth. The simulation did not consider wind, waves, and storm surges or other complex ocean hydrographic conditions. The time step was set to 30 s, the simulation time was from 1 January 2022 0:00:00 to 31 December 2022 0:00:00, and the simulation results were output once every hour.
Figure 2 shows the schematic diagram of the grid of the simulation area.
2.4. Model Verification
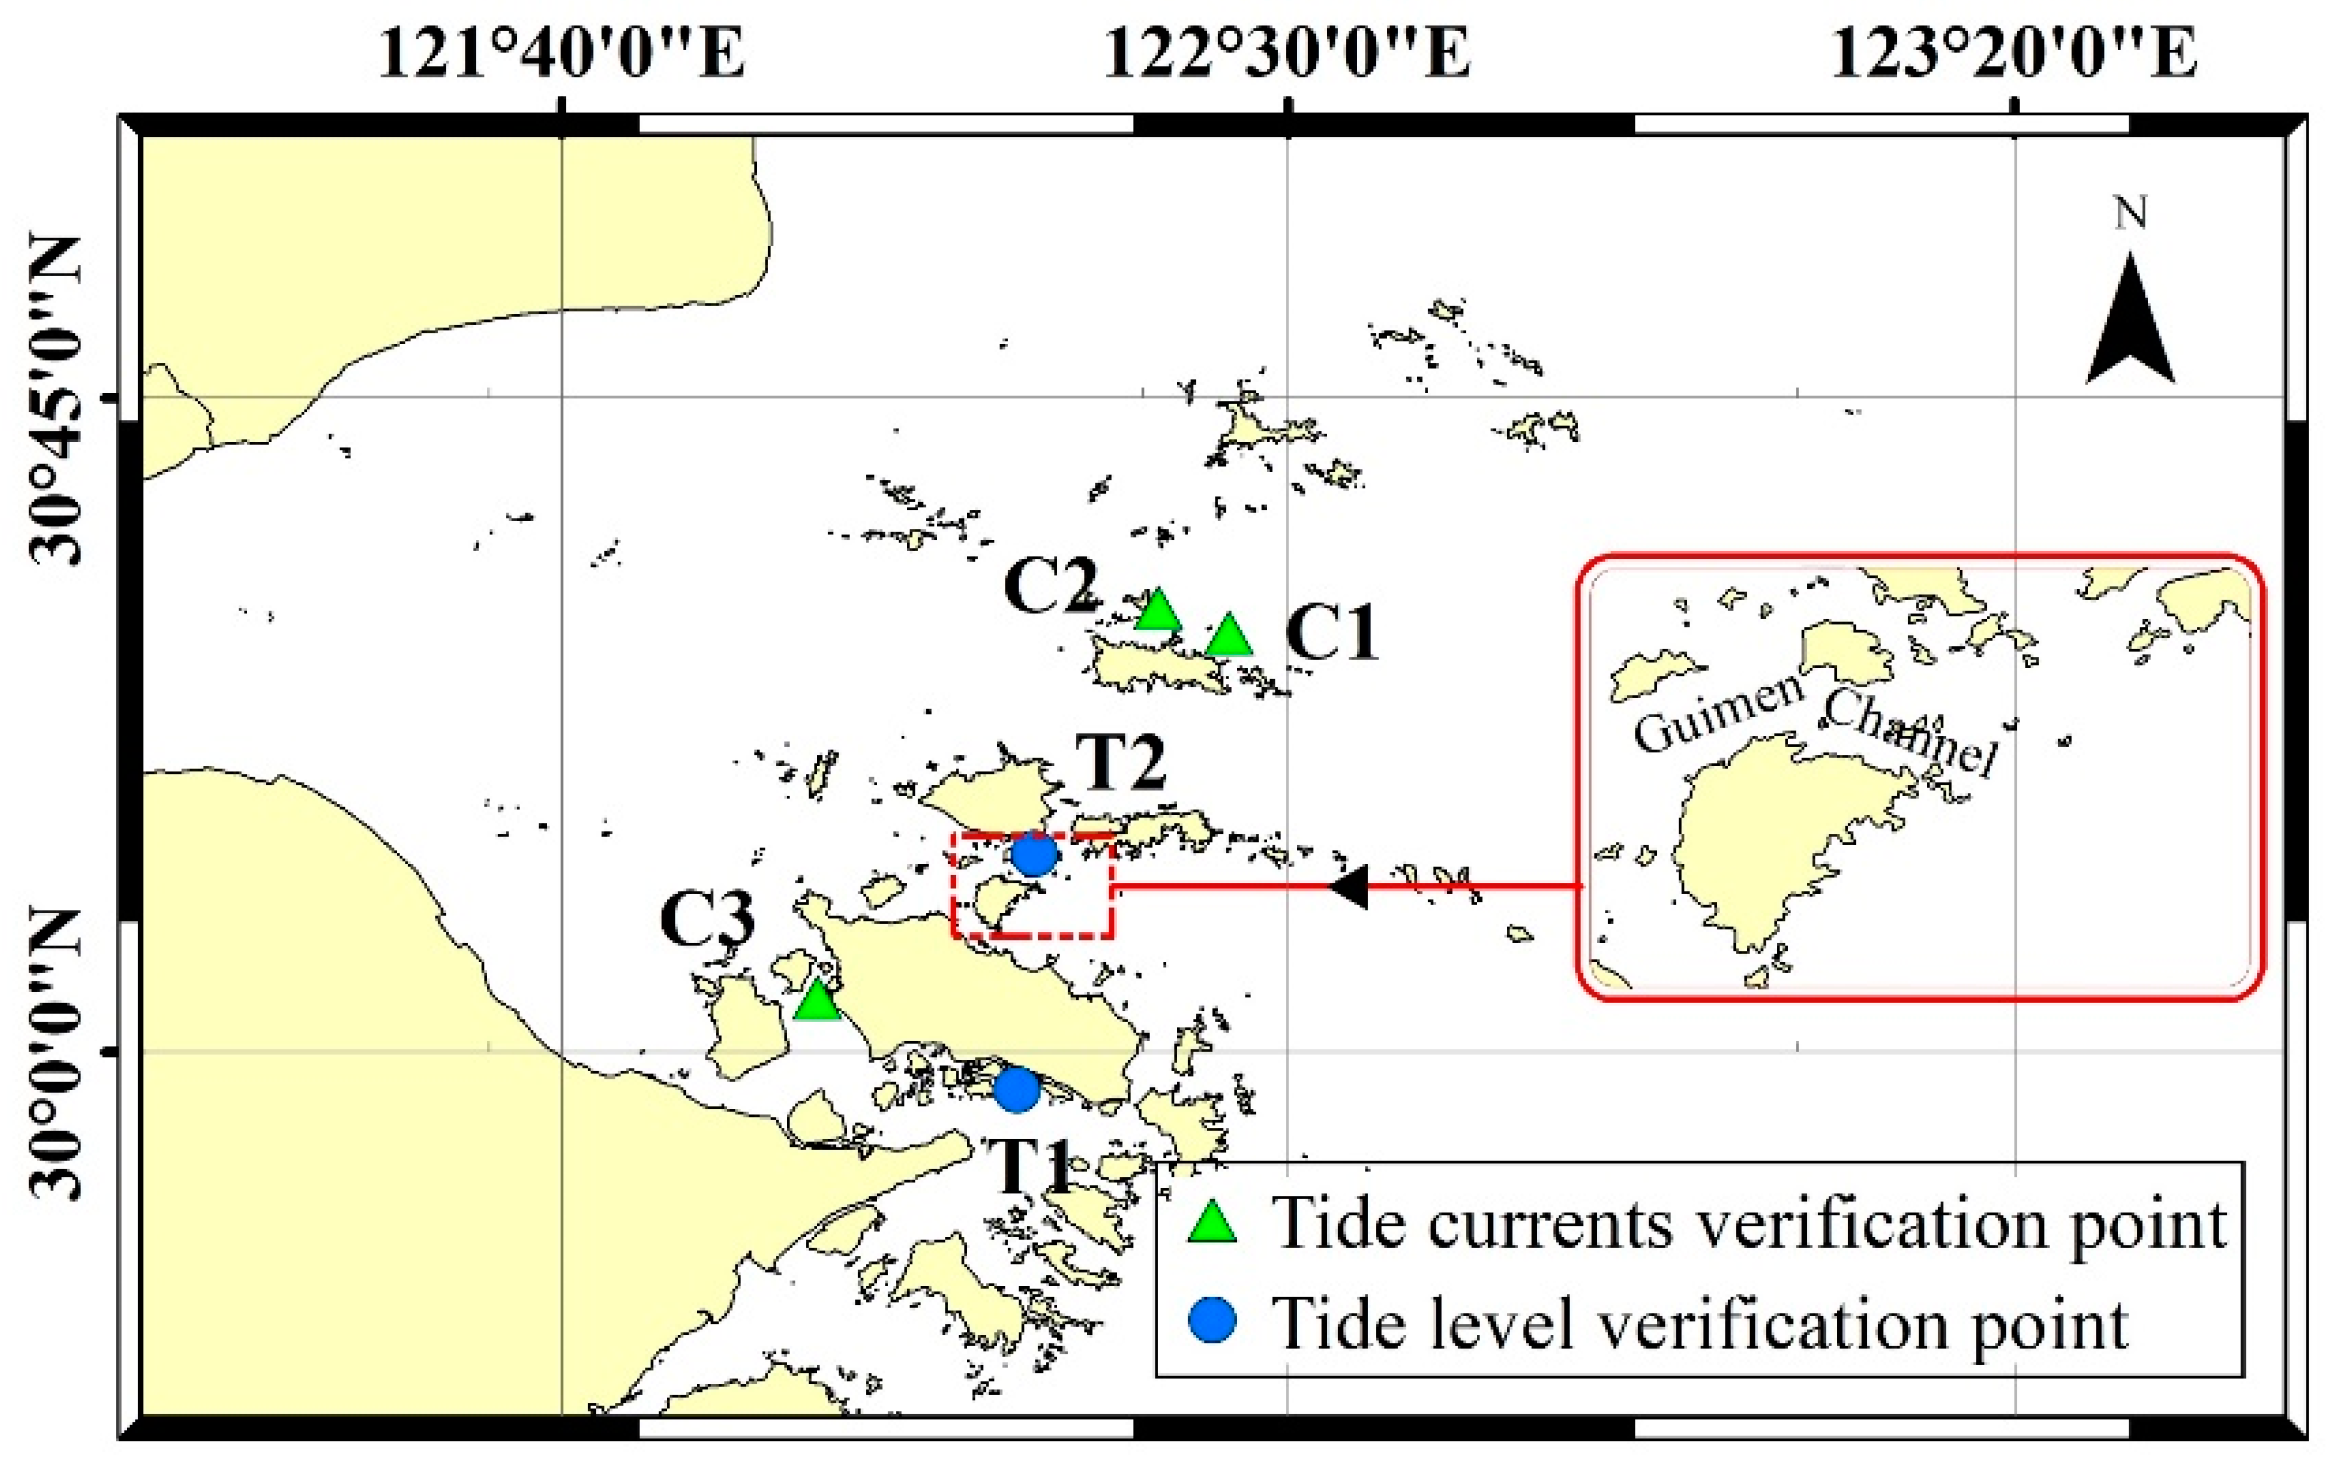
In order to ensure the simulation accuracy, we used the total of 14 days of hourly tide level observation data (from 00:00 on 4 March 2022 to 00:00 on 16 March 2022) from T1 (122°10.949′ E, 29°57.394′ N) and T2 (122°12.521′ E, 30°13.610′ N) stations provided by the Zhoushan Maritime Safety Administration and the total of 3 days of hourly tidal current observation data (from 00:00 on 6 March to 00:00 on 9 March 2022), from stations C1 (122°25.939′ E, 30°28.85′ N), C2 (122°21.045′ E, 30°30.609′ N), and C3 (121°57.535′ E, 30°3.776′ N) to verify the model. The location distribution of the measured points is shown in
Figure 3. The tide level verification results are shown in
Figure 4, the flow velocity verification results are shown in
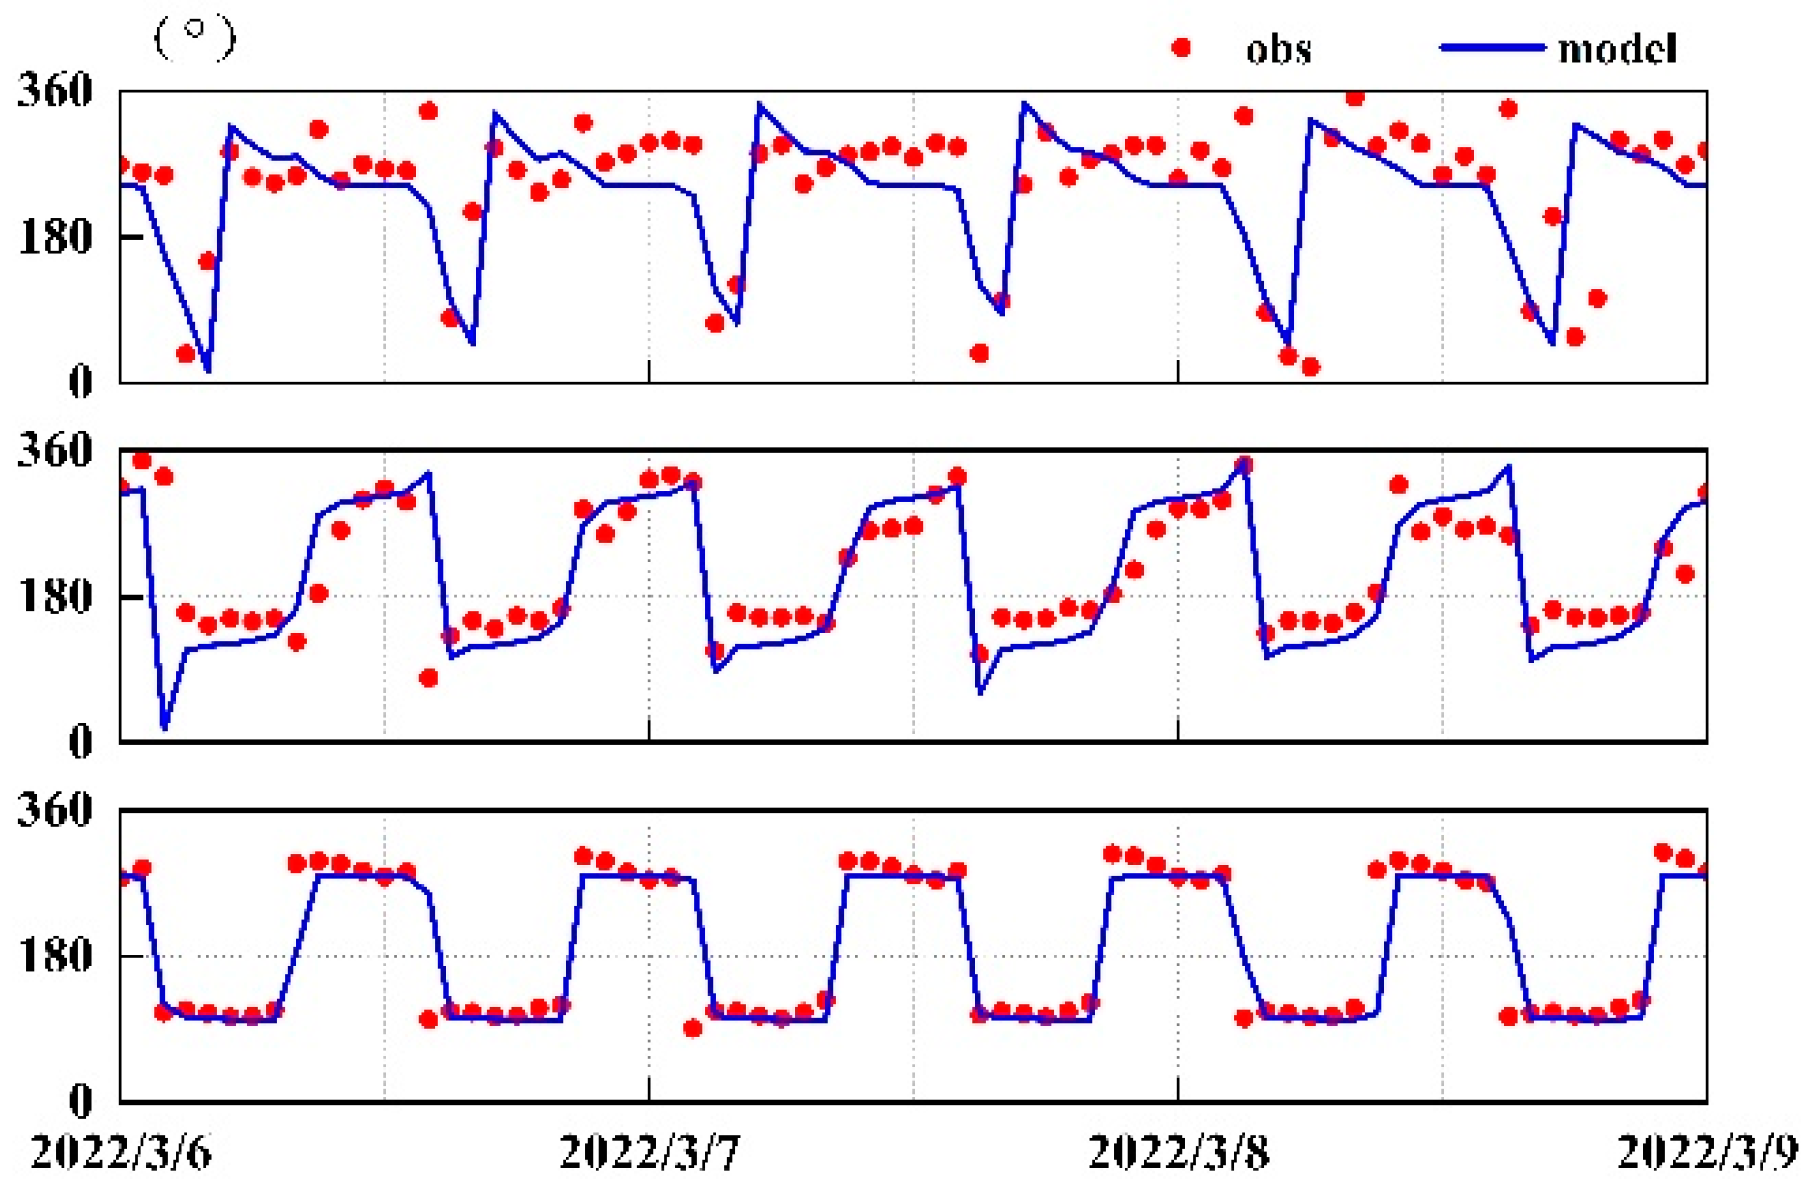
Figure 5, and the flow direction verification results are shown in
Figure 6.
From the tide level verification results, the simulated amplitude and phase of the two stations are essentially consistent with the measured values, and the correlation coefficients between the simulated and measured values of the two stations are above 0.90. From the flow velocity verification results, the simulated flow velocity and direction are in good agreement with the measured data at the open sea station, while in some narrow waterways, the simulated flow velocity at individual points deviates slightly from the measured results, but it still shows a general trend. The error phenomenon may be caused by the fact that the simulation did not remove the effect of the residual flow and ignored the complex wind and wave effects in the marine environment. In general, this simulation can sufficiently reflect the characteristics of the flow field in the studied area.
2.5. Flow Field Analysis
According to the simulation results, the characteristics of the flow field and the vector diagram of the rising and falling rapid flow field in the vicinity of the GCA were obtained. As shown in
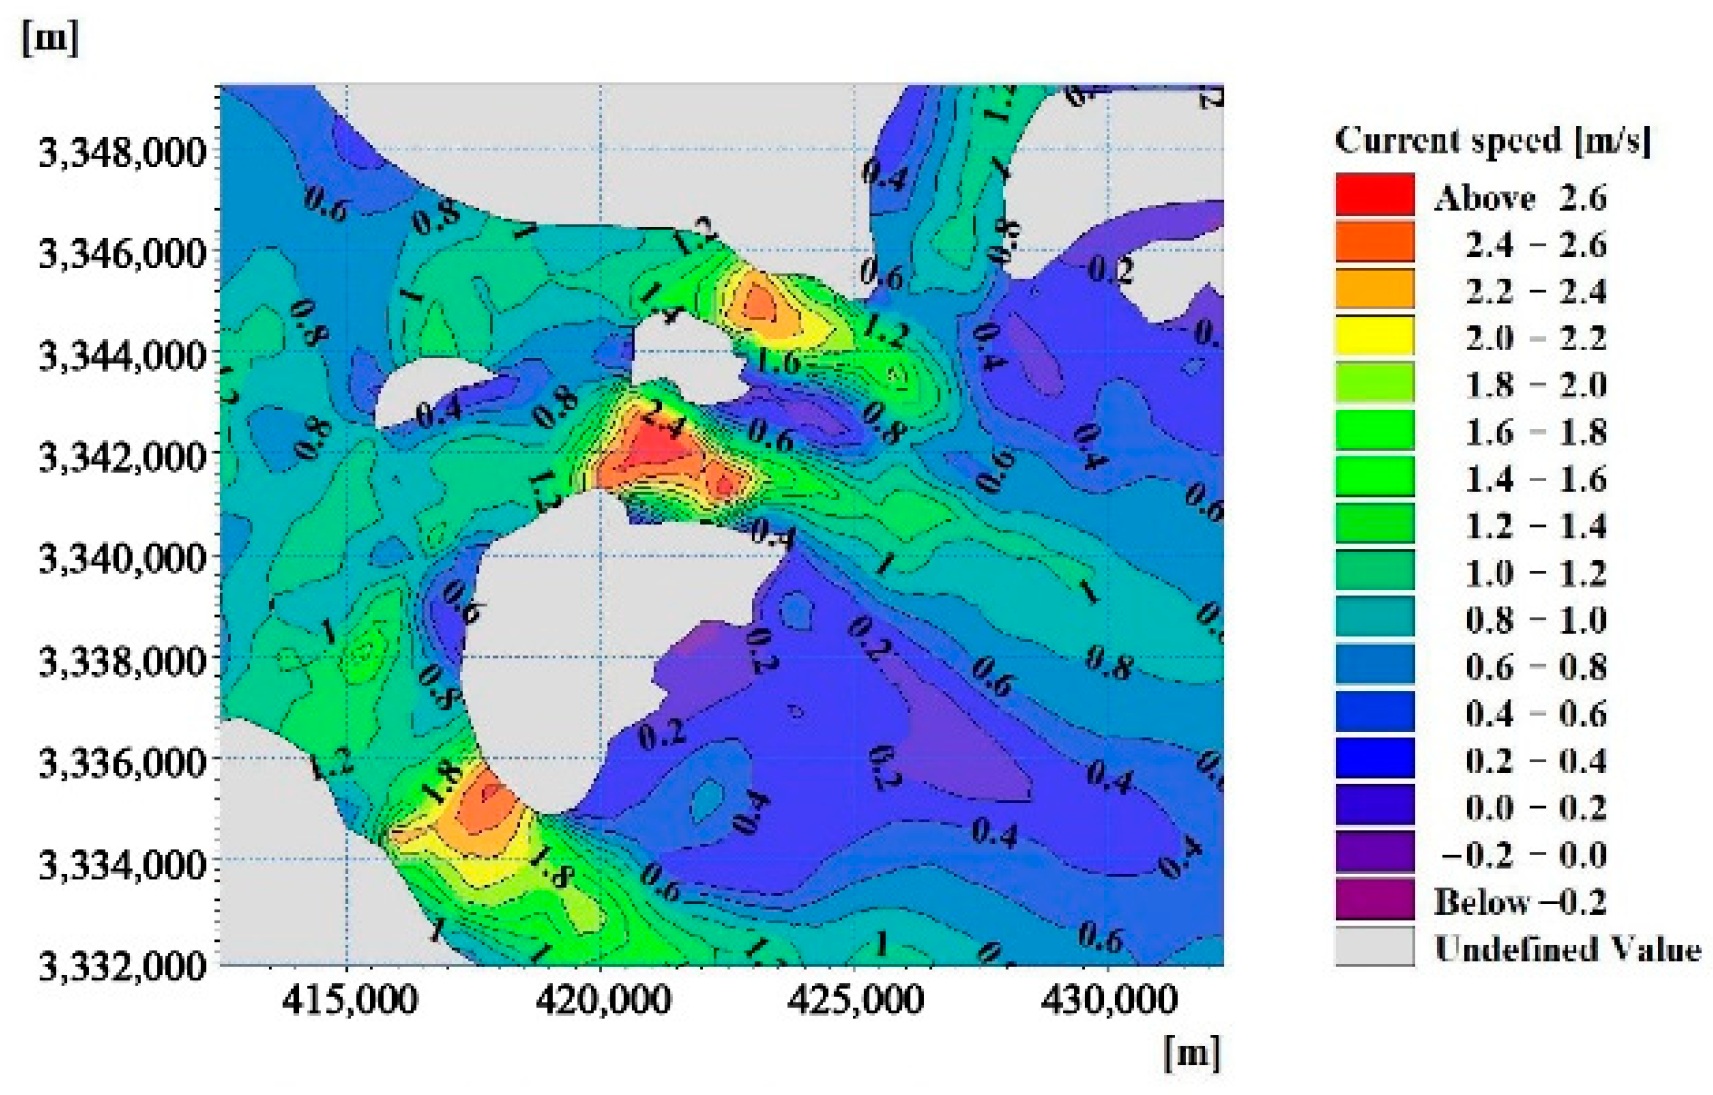
Figure 7, at high tide, the tidal wave from the eastern side of the outer sea enters the Yellow Ocean and is divided into three streams due to the barrier between the two islands of Guanshan and Xiushan, flowing through the Gaoting Waterway, Gushan Navigation Gate, and Guimen Channel. The whole area is open at both ends and has a narrow Venturi-like topography in the middle. The tide current is essentially the same as the shoreline of the islands, and the flow is accelerated in the waterway. A high current velocity is mainly concentrated in the middle of the GCA. The annual average current velocity in the middle of the waterway is 1.2~2.08 m/s, and the annual average current velocity at both ends is about 0.8 m/s. The regional high and low tides are in the southeast–northwest direction. The maximum high-tide current velocity is 4.17 m/s, and the maximum low-tide current velocity is 4.48 m/s. The range of high-velocity areas at low tide with velocities of 1.5 m/s and above is greater than that at high tide. The average high-tide velocity is lower than the low-tide velocity, and the high-tide duration is shorter than the low-tide duration. The main characteristics of the regional tide are shown in
Table 1. The highest tide level is 2.12 m, and the lowest tide level is −5.28 m. Except for a small part near the island boundary, the water depth of the region is mostly below −12 m, with large-scale tidal energy exploitation installation conditions. Compared with the neighboring Gaoting Channel and Guanmen Waterway, the overall tidal flow velocity in the GCA is greater, the area of high velocity is larger, and the tidal vector is more concentrated in the area.
3. Analysis of Key Factors for Tidal Energy Exploitation
The development and utilization of tidal energy are complex processes influenced by multiple factors, mainly environmental factors, economic factors, technical factors, etc. From the tidal hydrodynamic point of view, the most important element for the exploitation of tidal energy is the tidal current velocity in the region. The velocity directly determines the size of the tidal energy resources in the region, where the greater the velocity, the greater the kinetic energy carried by the tidal wave at high and low tide. In this paper, we analyze the tidal energy exploitation in the GCA by considering the energy density, frequency of tidal current speeds, flow asymmetry, flow rotation, and effective flow time available for exploitation.
3.1. Energy Flow Density
For exploitable energy sources, the most important concern is, first of all, the distribution of their resources. The power density of the tidal current when passing through the section can reflect the tidal energy resource endowment of the section. The distribution of the energy density
in a certain area reflects the distribution of tidal energy resources in that area, which is calculated as follows:
where
is the seawater density, usually taken as 1025 kg/m
3, and
is the local tidal current velocity. In the actual calculation, since the tidal current velocity constantly changes with time and its magnitude and direction have instantaneous values, the average current velocity
over a period of time is often used to calculate the average energy density
over that period of time.
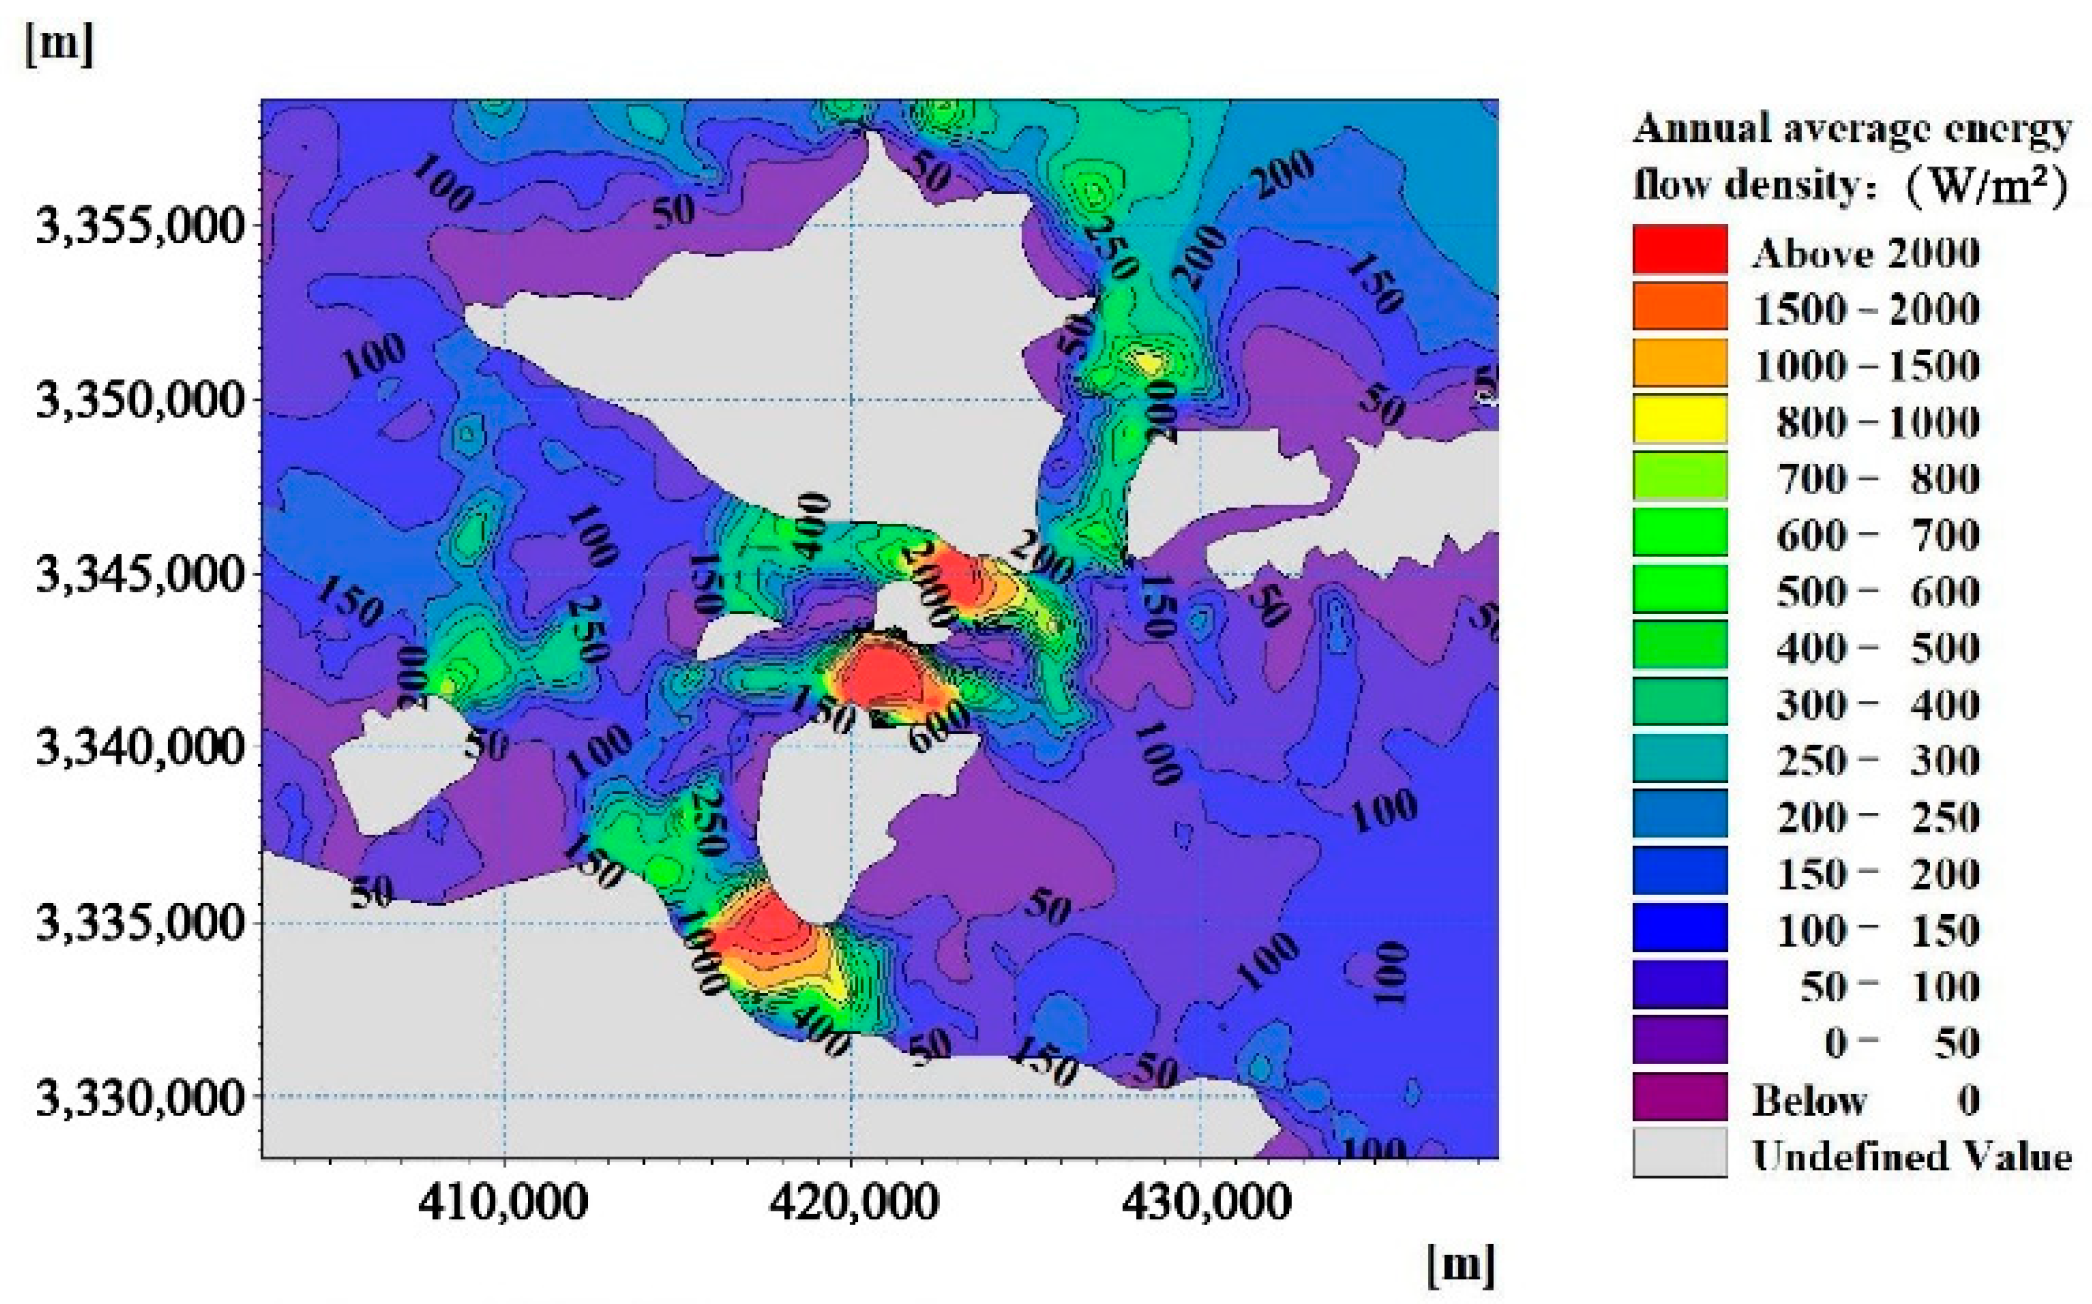
The annual average energy density distribution of the GCA is used to represent the tidal energy resource endowment of the region, as shown in
Figure 8. From the figure, it can be seen that the annual average energy current density of the GCA is unevenly distributed in space, and the average energy current density in the central region is the highest, up to 4520 W/m
2; meanwhile, it is relatively low at both ends of the waterway, with average annual energy flow densities at both ends of 300 to 500 W/m
2, with a large difference in magnitude. The average energy density of the sea plane above 500 W/m
2 is about 10.88 square kilometers, and that of the sea plane above 1000 W/m
2 is about 7.1 square kilometers. In addition, an annual average energy density of more than 1500 W/m
2 is also found in the central part of the Gaoting Channel and Guanmenn Waterway in the north and south, but both the peak value and the area of high energy density are not as extensive as those of the GCA.
3.2. Frequency of Flow Rate Occurrence
The GCA is a regular half-day tide area; two high tides and two low tides occur every day. The characteristics of the flow velocity change between the two high and low tides are not the same, and there are also great changes in small and large tidal cycles. The average energy density or power amount cannot clearly show the spatial and temporal distribution characteristics of the local tidal energy. The tidal current is not sufficient for the turbine to operate steadily to generate electricity when it reaches the diverted flow of high and low tide and other low flow moments. It is generally believed that only a flow rate of 0.8 m/s and above can be exploited. The 30-day probability distribution of the tidal velocity including a full-size tidal cycle was calculated, and the characteristics of the tidal velocity variation and spatial distribution of tidal energy in the region were analyzed using the frequency of each interval of tidal velocity in the region and the main distribution of the tidal velocity exhibited in each place in the region.
Figure 9 shows the frequency of occurrence of each flow velocity interval in the region, where the length of individual velocity intervals is 0.1 m/s.
Figure 10 shows the distribution of the location of the highest-frequency flow velocity in the region. From
Figure 9, it is easy to see that the flow velocity in the GCA is in the range of 0.2~4.5 m/s, and the frequency of occurrence is greater than 2% for each velocity ≤1.7 m/s. The frequency of occurrence of high flow velocities above 0.8 m/s is more than 0.59 cumulatively, the overall tide availability is high, and the frequency of occurrence of adjacent velocities is not very different. From the distribution of the highest frequency of flow velocities occurring in the area shown in
Figure 10, the central part of the GCA shows the most flow velocities between 1.8 and 2.4 m/s in a large area, and the prevailing flow velocities in a large area in the southeast are between 1 and 1.8 m/s, with a cumulative horizontal area of about 13.49 square kilometers, which is suitable for tidal energy exploitation. Low flow velocities of less than 1.2 m/s occur mainly at high frequencies near the southern part of Guanshan Island, a small inshore area in the northern part of Xiushan Island, and the two ends of the GCA.
3.3. Flow Rate Asymmetry
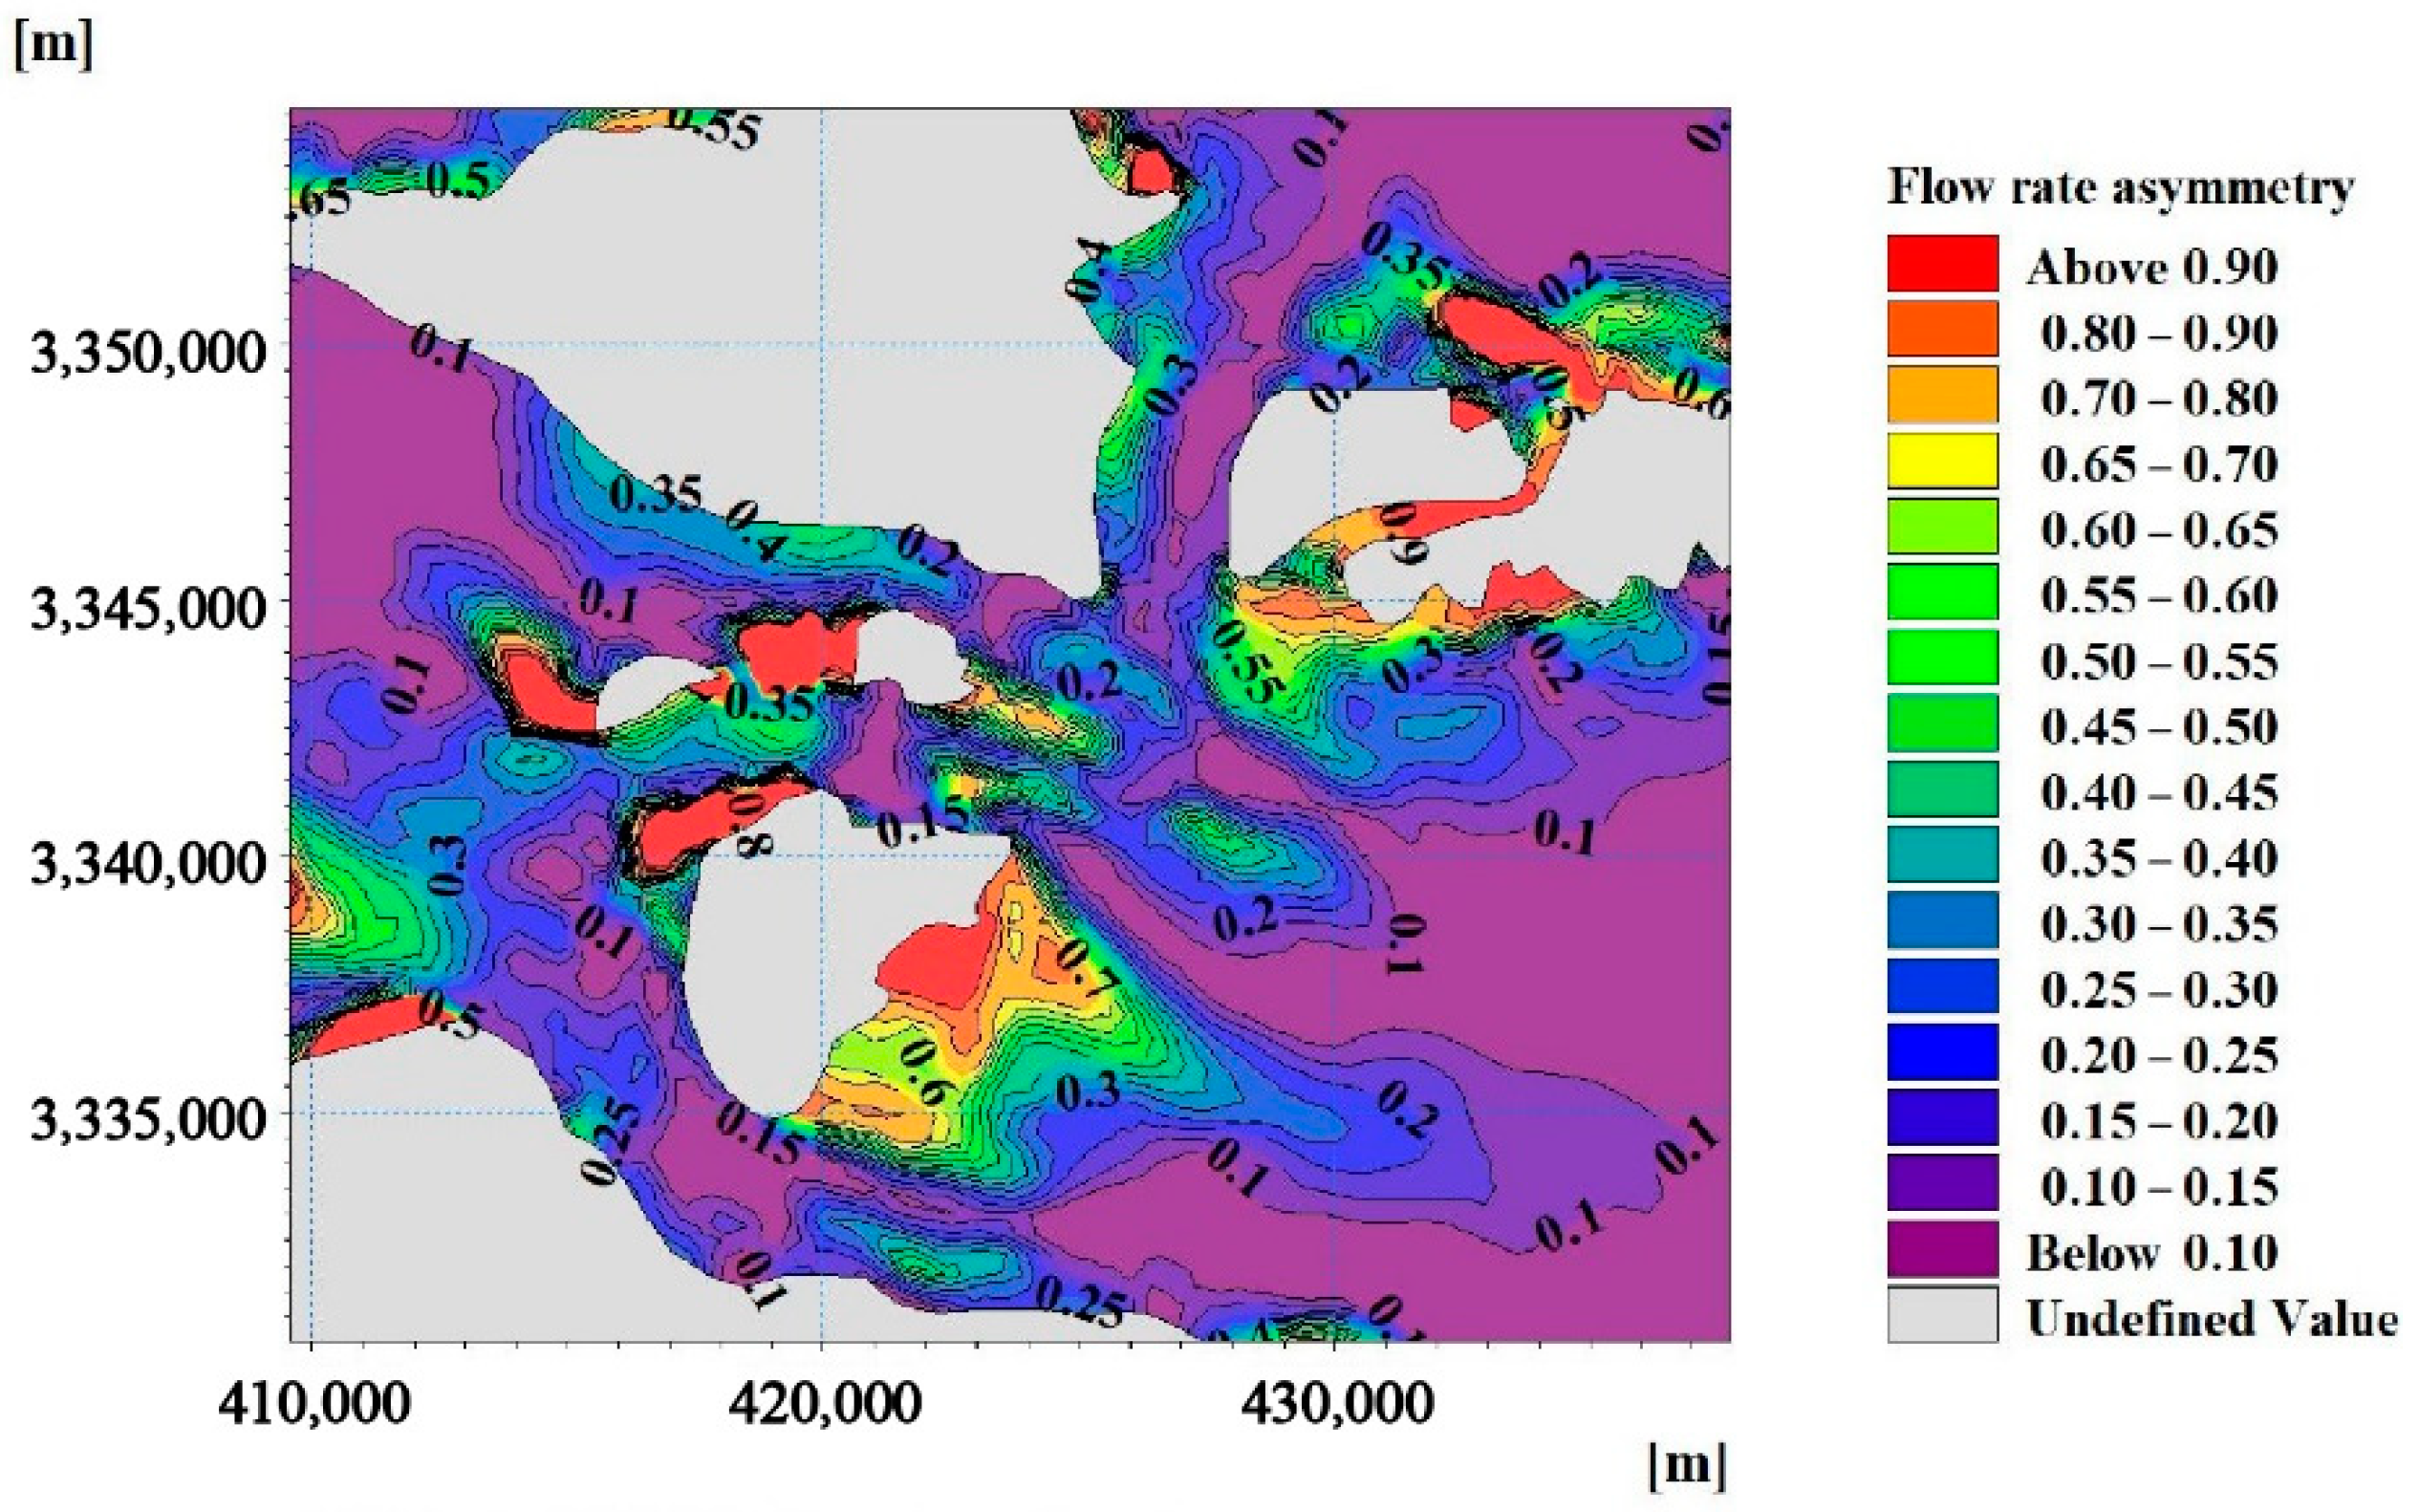
The final use of tidal energy is to convert the kinetic energy of the tide into the grid-connected power generation of a turbine, which requires consistency and stability in the energy output, so the difference between the high- and low-tide velocities in the same tidal cycle of the exploited area should not be too large. The average flow velocities in high- and low-tide periods are recorded as
, respectively, using the flow asymmetry
to portray the variability in the velocity change at high and low tide:
The value of
reflects the magnitude of the kinetic energy change during the period of high and low tides. The larger the
, the greater the difference between the speed of high and low tides, and the more unstable the energy output.
Figure 11 shows the distribution of current velocity asymmetry coefficients in the vicinity of the GCA. Different from the frequency distribution of the current velocity occurrence, the distribution of the current velocity asymmetry at the eastern high-tide entrance of the GCA is more variable, ranging from 0.15 to 0.65, and the closer to the shoreline, the higher the current velocity asymmetry. In the west of the GCA at the outlet of the high tide, and on the east side of Guanshan Island, the phenomenon of an unequal velocity of the rising and falling tide is most obvious and concentrated, and the asymmetry of the velocity reaches 0.8 or more. In the middle of the channel, the asymmetry of the flow velocity can reach 0.1, and the rising and falling tide velocity is essentially unchanged and the most stable.
3.4. Flow Direction Rotatability
The two high and low tides in a day in the half-day tidal waters will make the change in the tidal flow more complicated, and the tidal flow at each point is variable, while the existing tidal turbines generally do not have the ability to actively change direction, so it is difficult to adapt to the change in the tidal flow. If the machine placement area ignores the consideration of the flow direction, this will lead to a significant loss of energy conversion efficiency. Therefore, the tide of the exploitation area should be as close as possible to the standard reciprocal flow (i.e., the rising and falling tide changes to 180°). In this paper, Equation (7) is used to characterize the proximity of tidal currents to the standard reciprocal flow:
where
and
are the rising and falling tide directions, respectively, and
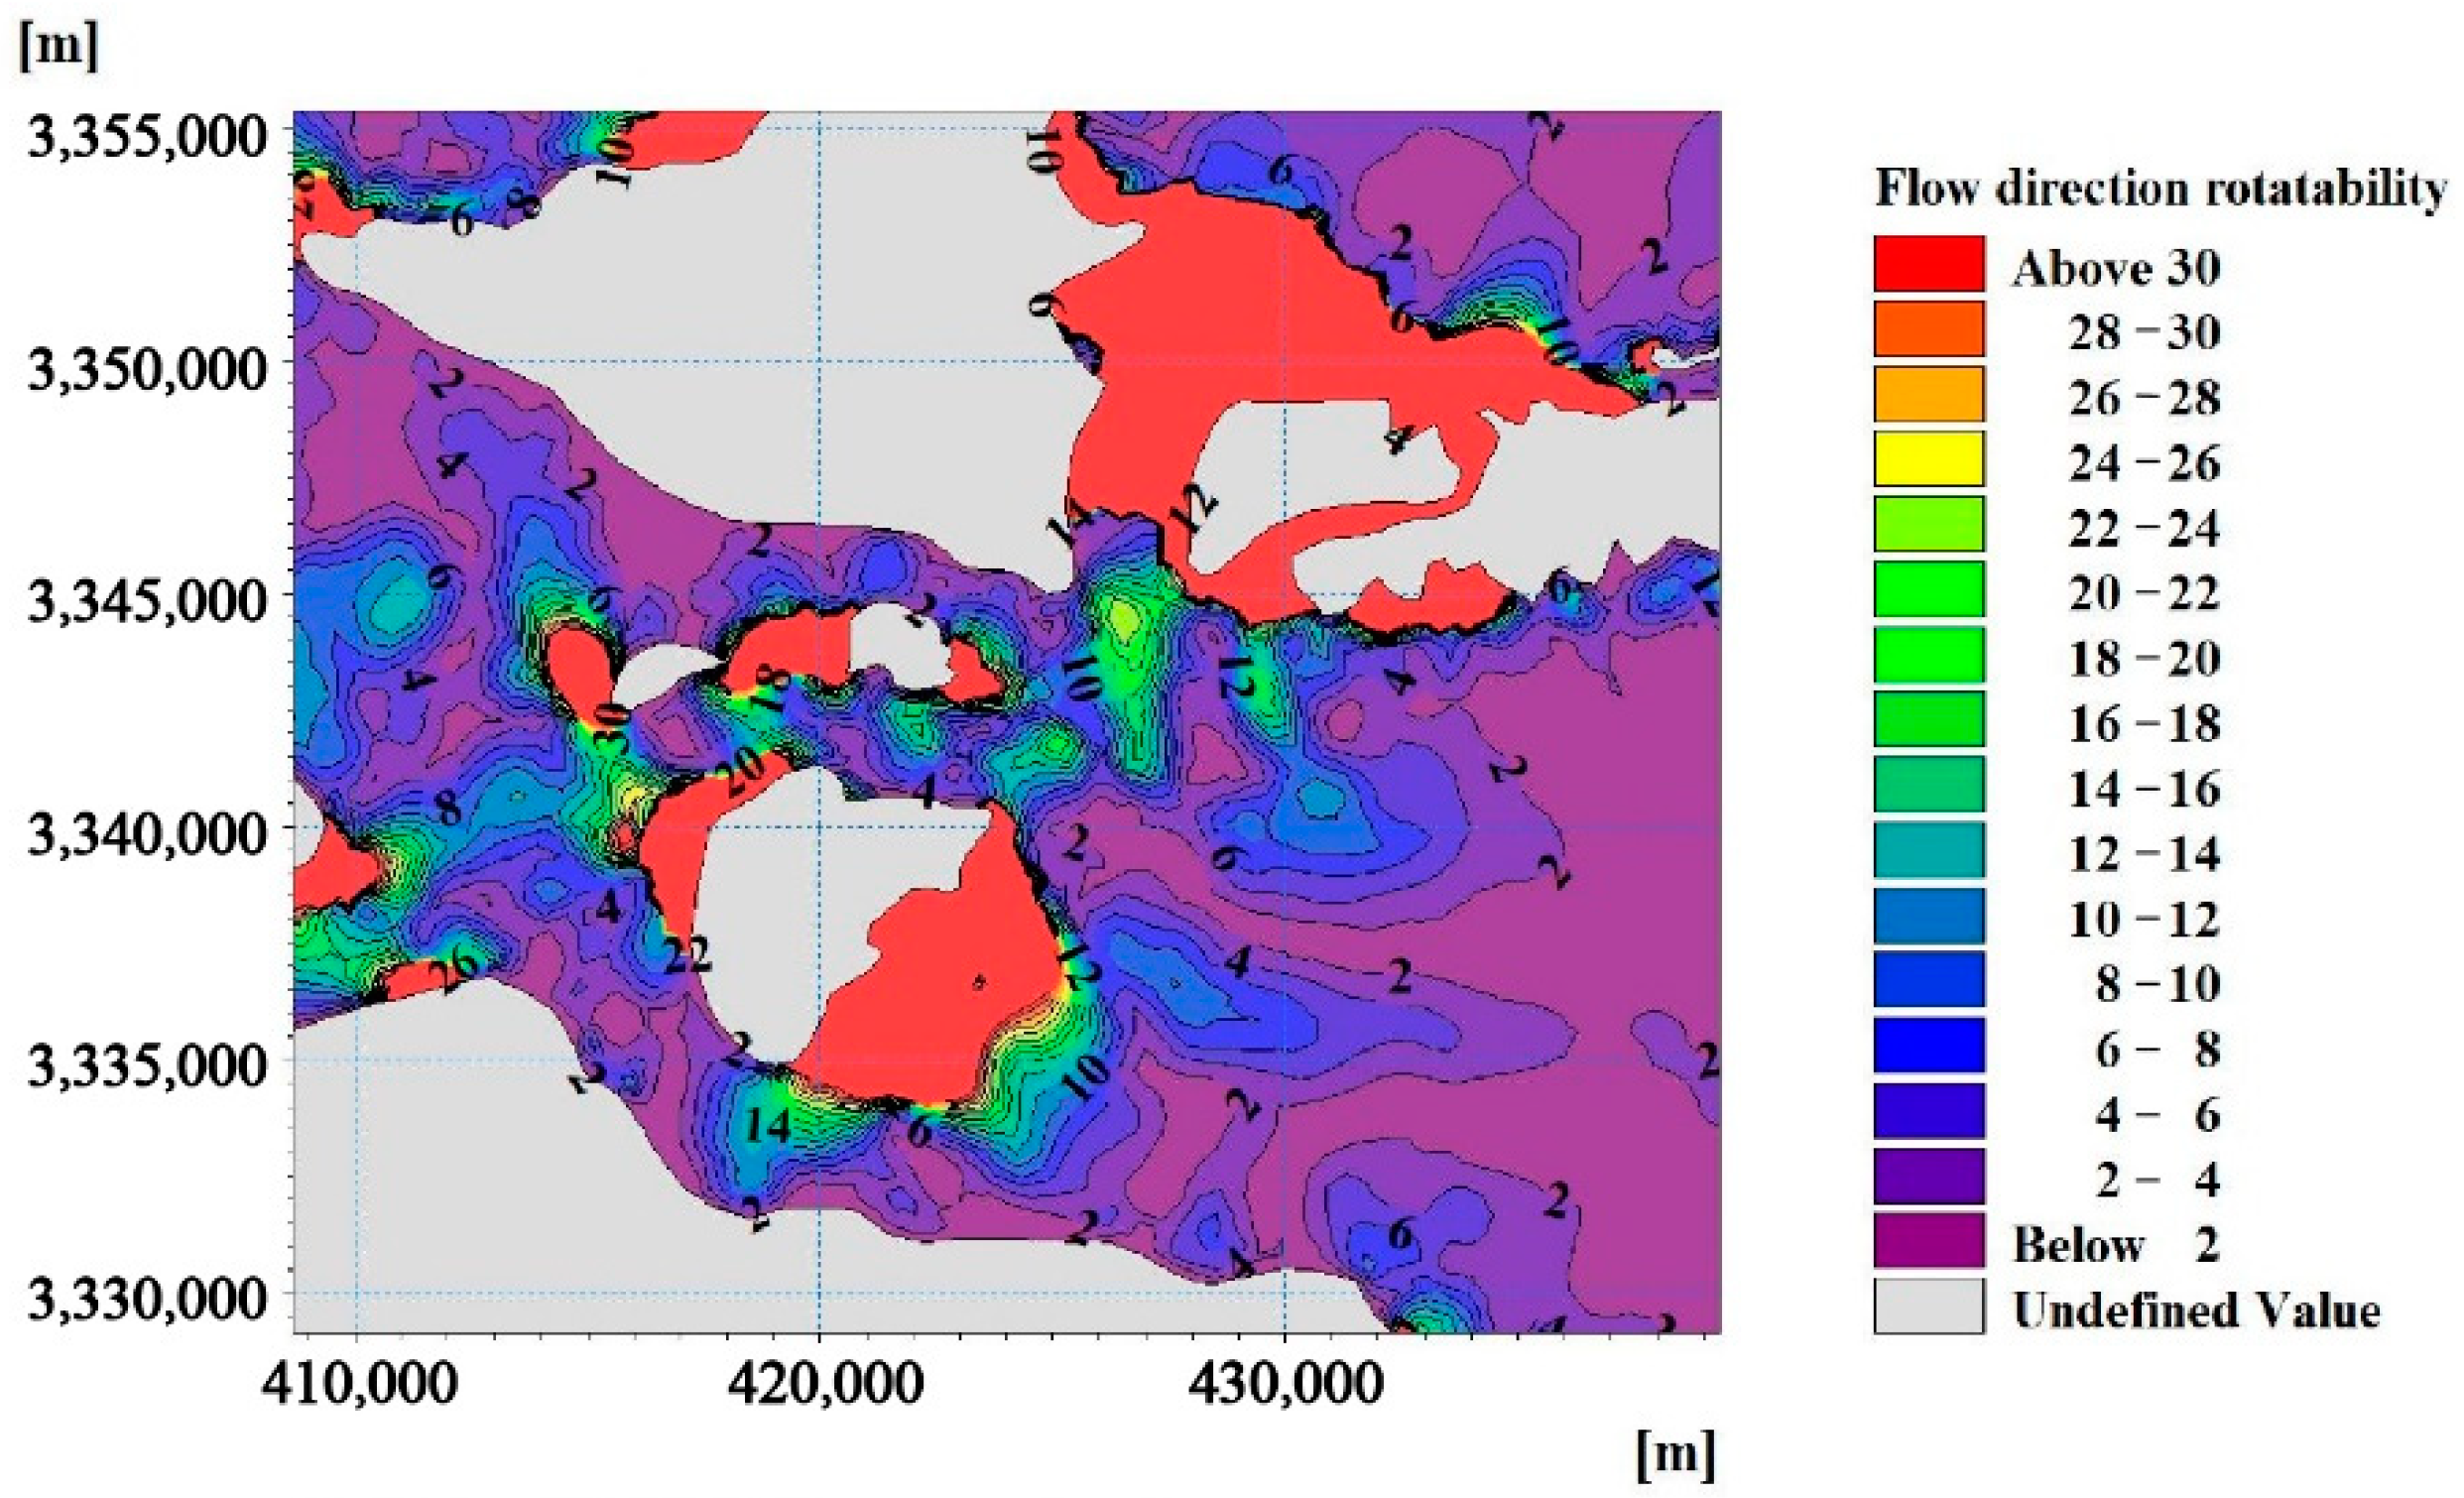
is the flow directional rotativity coefficient of the tide. The distribution of the flow direction rotativity in the region is shown in
Figure 12. The overall rotativity of the regional tide is in the range of 2 to 24 and is asymmetric along the central axis of the waterway. The
on both sides of Xiushan Island and in the northwestern region is above 20, and the flow reciprocity is not strong. The area close to the standard reciprocal flow, i.e., with a
lower than 10, is distributed in the offshore area directly north of Xiushan Island and at the entrance of the high and low tides at both ends of the waterway, and the rotational flow in the middle area of the waterway is around 2, which is the most stable, but the range is not large, accounting for only about 3.1 square kilometers, and the distribution is not concentrated.
3.5. Available Flow Time for Exploitation
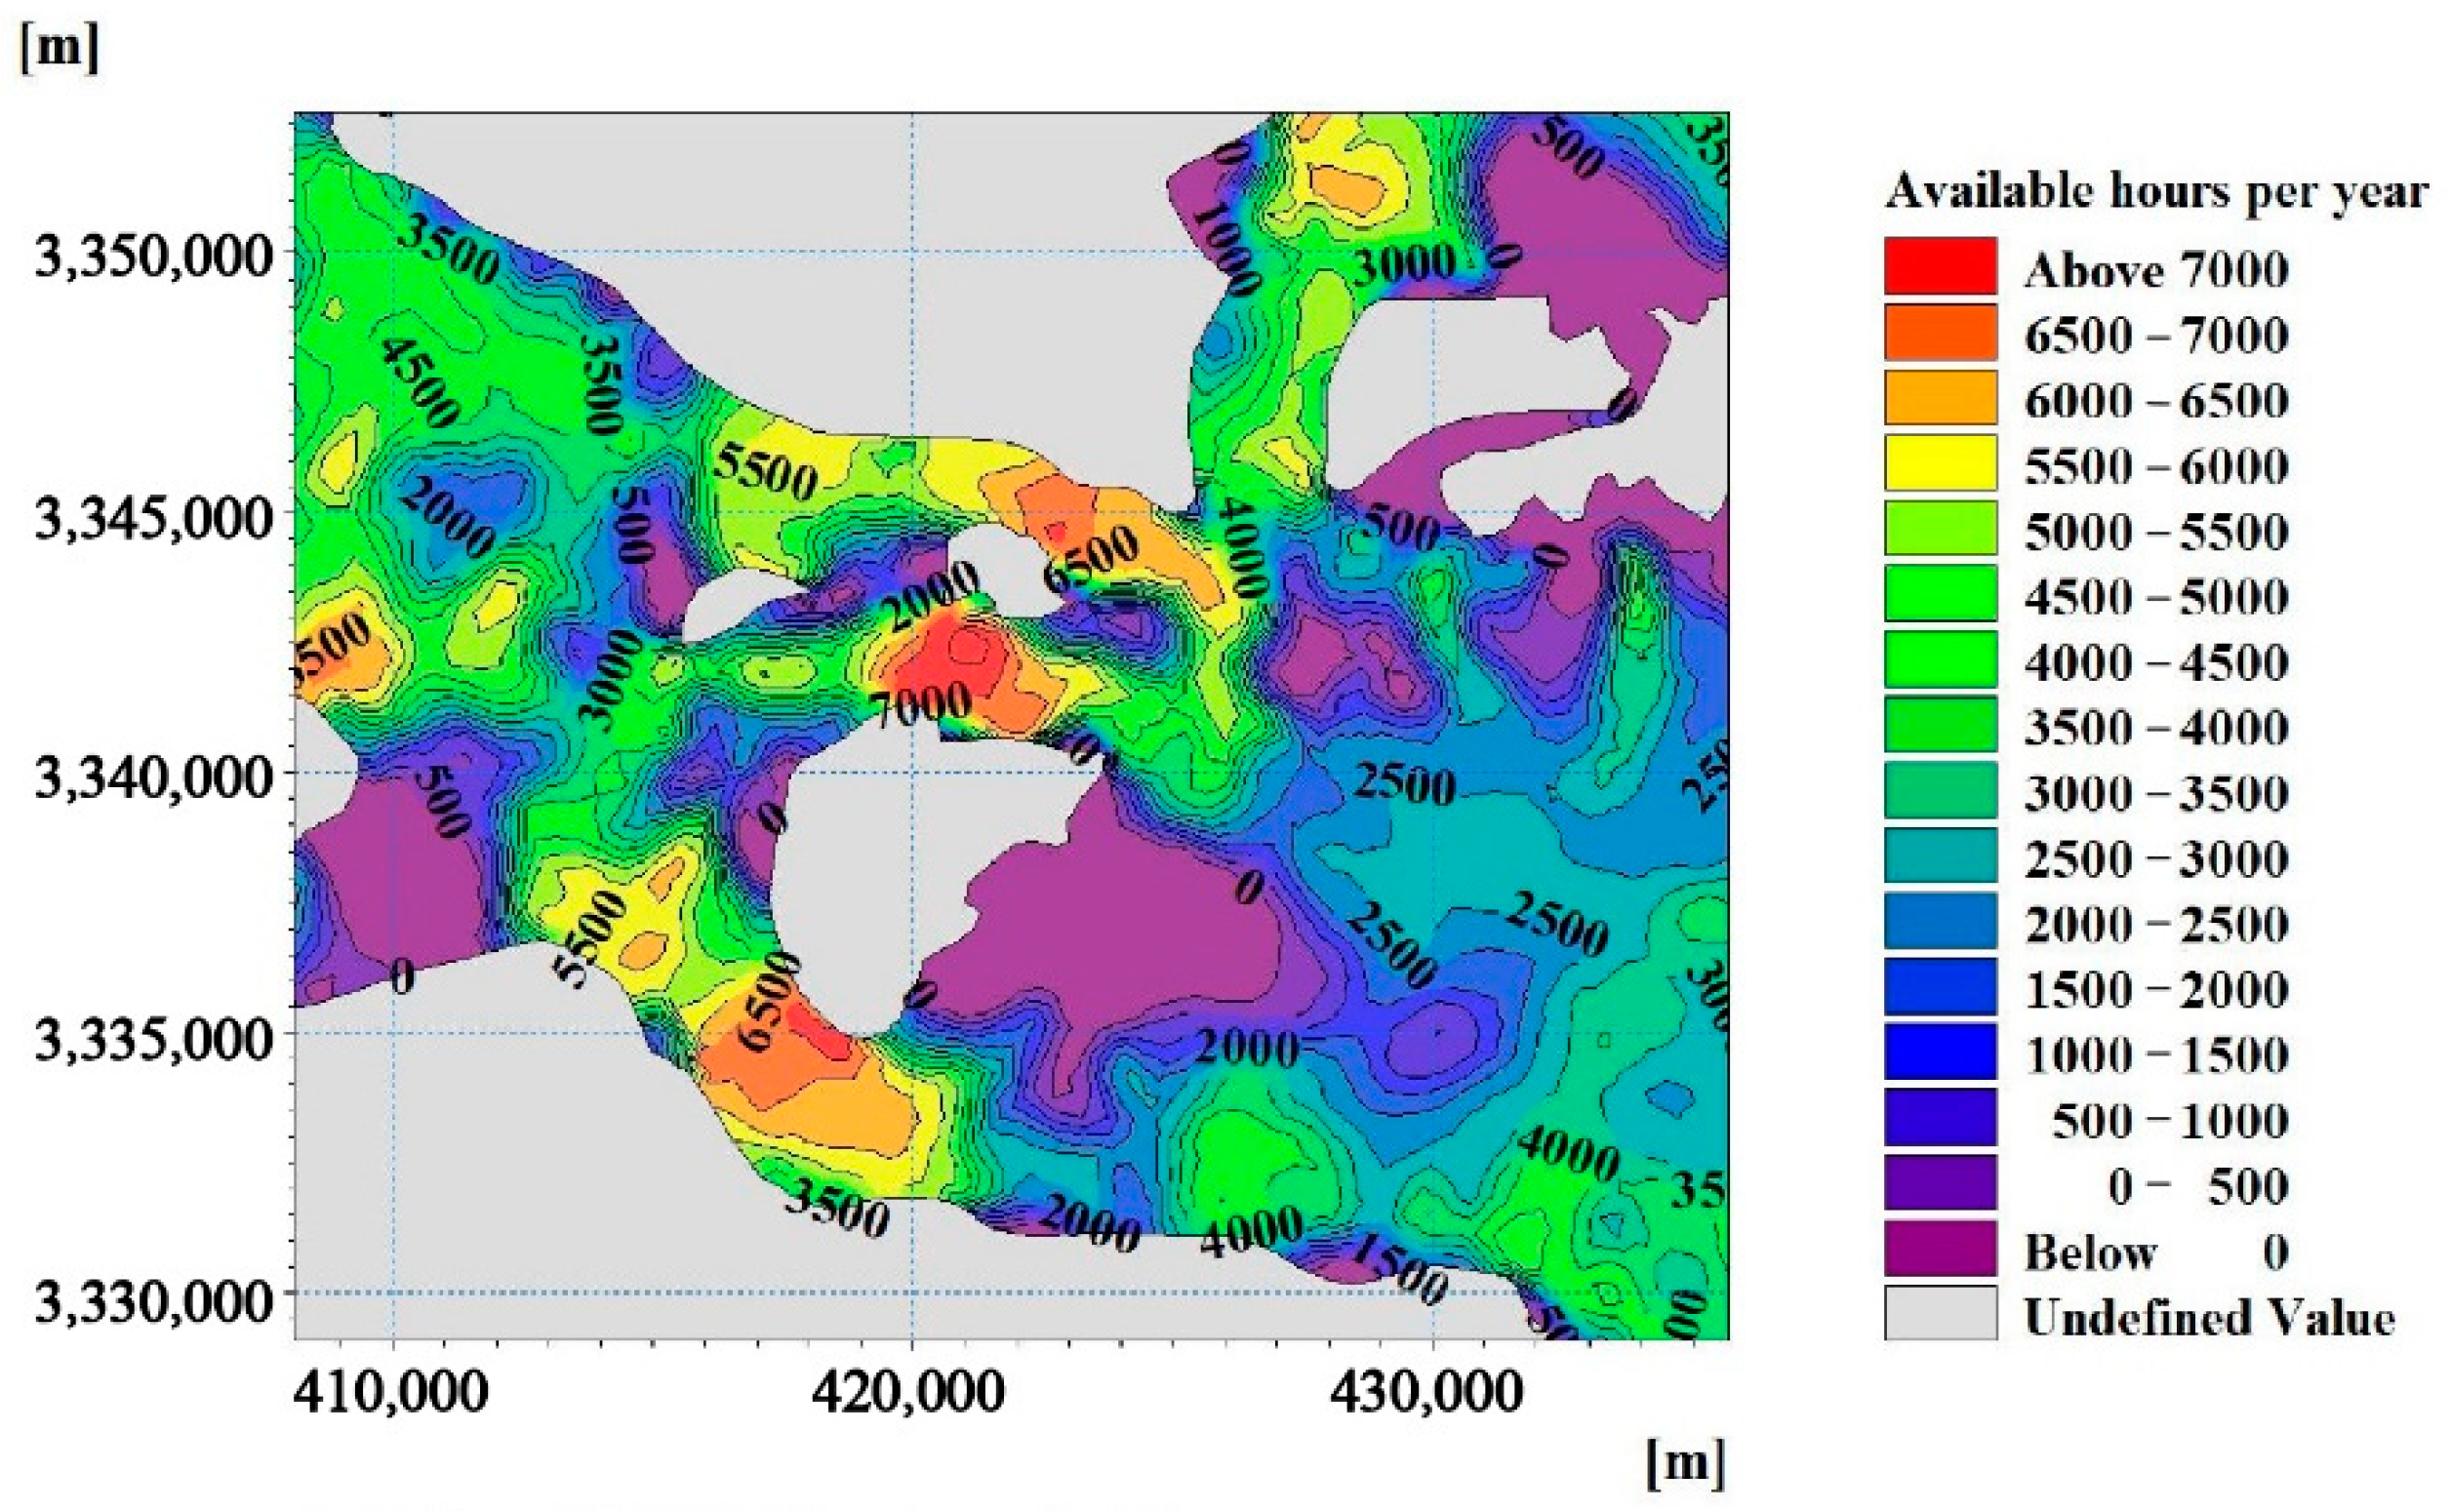
Referring to the concept of annual effective power generation hours in wind power generation, the cumulative effective power generation hours with a flow velocity greater than 0.8 m/s in a year are counted to show the distribution pattern of tidal energy exploitation in the region over time, where the longer the effective flow hours, the greater the final annual power generation capacity under the condition of power determination. As shown in
Figure 13, the annual generatable available flow hours in the GCA are long overall, ranging from 3500 to 7500 h, and the distribution is roughly the same as that of the annual average energy flow density. The central part of the waterway has an area of 12.8 square kilometers, with more than 5500 h of developable effective flow time, and it has at least 15 h of stable power generation time per day, which is 15~27% greater than the annual developable effective flow time of the Gaoting Channel and Guanmen Waterway. The available flow hours at the two ends of the waterway should be slightly shorter, with the annual developable available flow hours ranging from 3000 to 5500 h.
4. Evaluation of the Theoretical Exploitable Amount of Tidal Energy
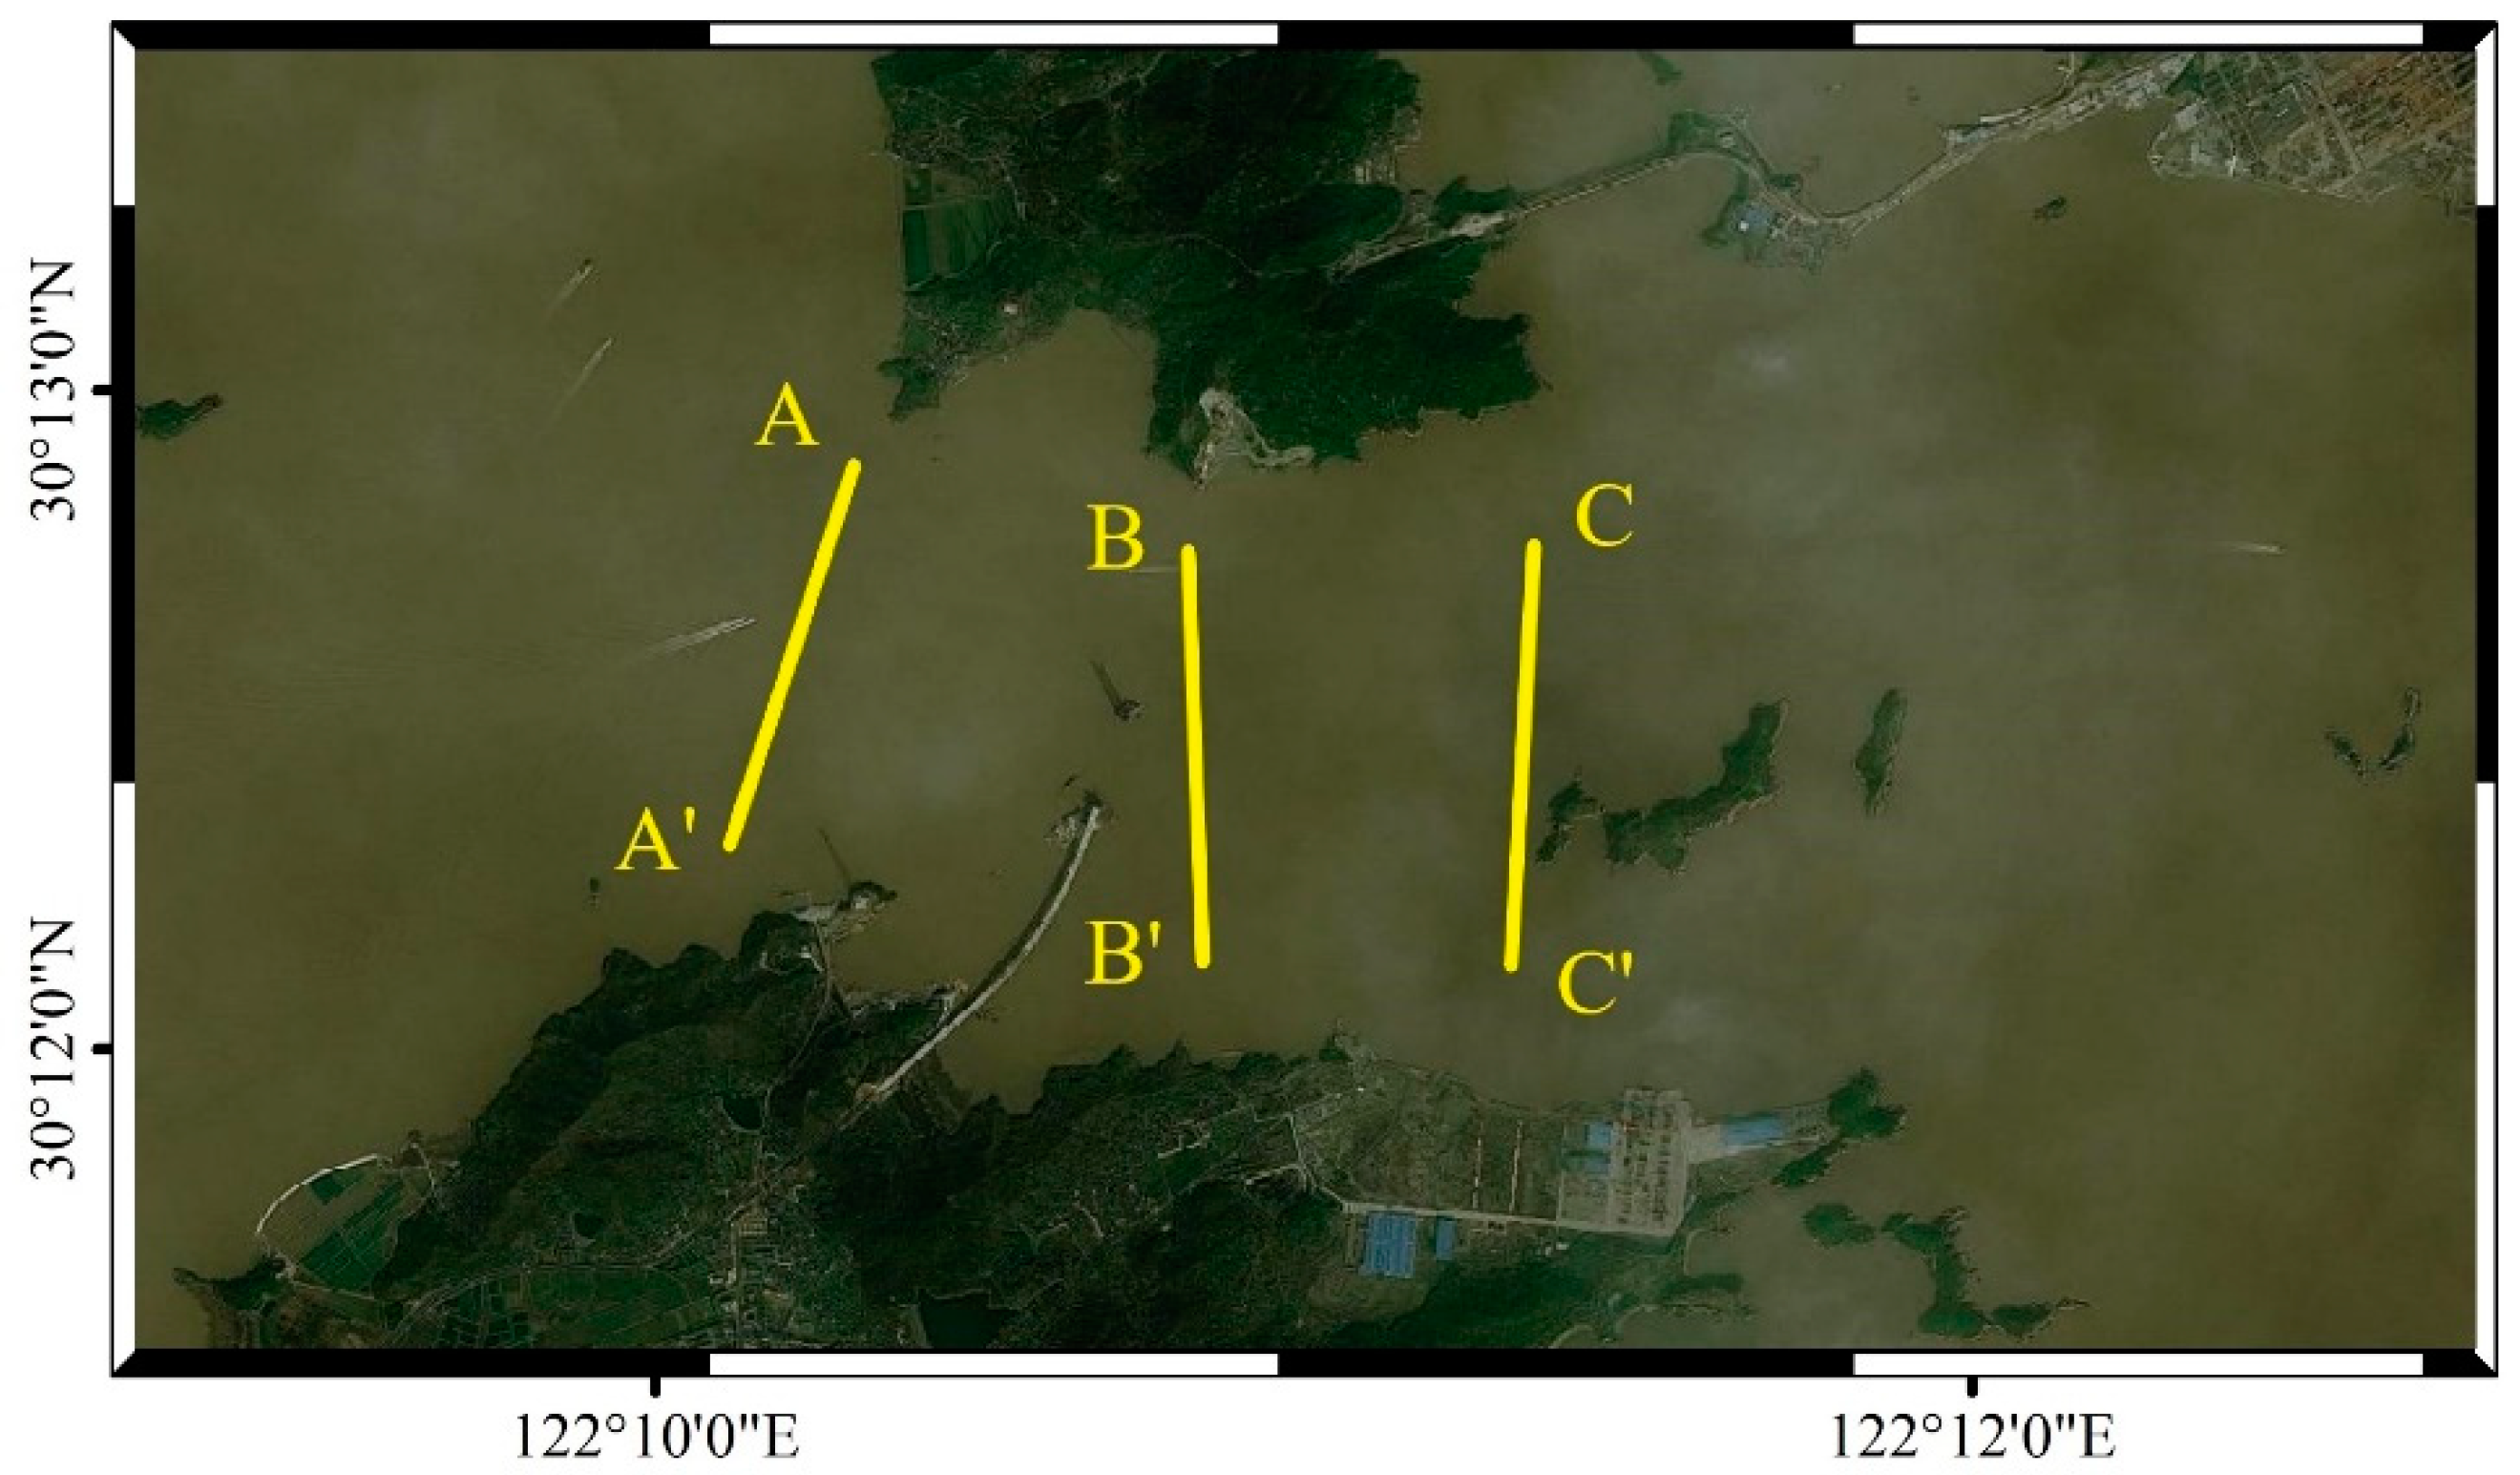
Through the analysis results of the above key influence factors of tidal energy exploitation, three typical sections, namely, A-A′, B-B′, and C-C′, with energy densities above 800 W/m
2 were selected according to different key influence factors of tidal energy exploitation to discuss their respective theoretical exploitable amounts of tidal current energy. In order to facilitate a comparison and eliminate the differences caused by the different areas of developed sections, the length of all three sections is 1500 m, and the water depth is 25 m. The location of the sections is shown in
Figure 14, and the parameters of each section are shown in
Table 2.
The main methods currently used to calculate the developable amount of tidal energy are the Farm method [
24,
25,
26] and the Flux method [
27]. Among them, the main idea of the Farm method is to calculate the developable power of a single turbine in the exploited site and then find the sum of the developable amount of all turbines in the plane; the calculated amount depends on the arrangement and selection of turbines, and the exploitable amount will be different for different models and different arrangements of turbines. Therefore, in this paper, we chose the Flux method, which has a relatively simple calculation using the cross-sectional energy flux, proposed by B&V and Robert Gordon University. This method considers that the tidal energy can develop a portion of the energy flux of the tidal current through a certain cross-section. The significant impact factor
SIF is the percentage of the total tidal energy resources that can be exploited without any significant impact on the surrounding environment and economy of the exploited area. The exploitable power of waterway tidal energy is equal to the product of the average energy flow density and the area of the waterway section perpendicular to the tidal direction:
where
is the exploitable amount of tidal energy;
SIF is the effective impact factor, which is topography-dependent;
is the total average power of tidal energy in the waterway;
is the average energy density; and
is the area of the channel section perpendicular to the tidal direction. Generally, the value of
SIF is 10–20% in waterways, open waters, and cape areas, and the middle value of 15% was taken in this paper.
The exploitable power of tidal energy is mainly influenced by the density of the energy flow; the asymmetry of the flow velocity and the rotation of the flow direction affect the technical difficulty of tidal energy exploitation in the region; and the frequency distribution of the flow velocity and the effective flow time affect the final power generation capacity of tidal energy. The energy density of the A-A′ section is 2200 W/m2, which corresponds to an average annual flow velocity of 1.63 m/s, while the highest-frequency flow velocity occurring in the section is 1.8 m/s, indicating that the flow velocity in the region is higher than the average annual flow velocity most of the time, so the actual developable power should be slightly higher than the theoretical developable power. The flow velocity asymmetry of the A-A′ section is 0.25, and the flow direction rotation is 6. The tidal energy will not have high technical exploitation difficulty. The annual effective flow time is 6800 h, and the theoretical developable volume is 12.38 MW. The exploitation potential is large in a comprehensive way. The average annual energy density of the B-B′ section is 4300 W/m2, and the daily flow velocity is around 2.4 m/s. It has the smallest flow velocity asymmetry and flow direction rotation. The annual effective flow hours for power generation total 7300 h, and the developable power is 24.19 MW. These exploitation conditions of tidal energy are the best among the three cross-sections. The annual average energy flow density of the C-C′ section is 860 W/m2, and the exploitable power is about 6.75 MW. Although the daily performance of the flow velocity is high, the resource is still relatively small, and the flow velocity asymmetry and flow direction rotation are high, at 0.38 and 11, respectively, which makes the actual exploitation of tidal energy more difficult. The annual average effective flow time is 6000 h, and the total exploitable power is relatively low.
5. Conclusions
This paper simulated the GCA based on a numerical marine model and validated the model by using the measured data. After integrating the characteristics of the flow field, resource size, flow frequency distribution, flow asymmetry, flow direction rotation, and available flow time to analyze the elements of tidal energy exploitation and resource assessment in this region, the conclusions are as follows:
(1) The highest current velocity near the GCA is 4.48 m/s, the average high-tide velocity is lower than the low-tide velocity, and the high-tide calendar time is smaller than the low-tide calendar time. The energy density is mainly concentrated in the middle of the waterway, where the highest annual average energy density is up to 4520 W/m2, and the peak energy density is greater than 500 W/m2 in the area, compared to the adjacent Gaoting Channel and Guanmen Waterway.
(2) The flow velocity interval with the highest frequency in the central and southeastern parts of the region is large, between 1.8 and 2.4 m/s. The rising and falling tidal velocity in the central part is essentially unchanged, and the flow velocity inequality between the western and eastern locations near the shoreline is significant. The overall rotatability of the tide is between approximately 2 and 24, being asymmetric along the central axis of the waterway, and the tidal flow in a small area of the central waterway is very close to the reciprocal flow. The exploitable annual effective flow hours range from 3000 to 7500 h, and the annual exploitable effective flow hours in a large area of the central channel total more than 5000 h.
(3) Near the middle of the GCA (122°11′03.72″ E, 30°12′51.00″ N~122°10′53.95″ E, 30°12′03.01″ N), the power flow density of the tidal current can reach 4520 W/m2, the flow velocity distribution is mainly between 1.8 and 2.4 m/s, and the velocity asymmetry is only 0.1. The flow velocity is high and essentially unchanged. The rotation of the flow direction is about 2, showing a typical reciprocating flow, and the annual effective flow time exceeds 5500 h. By combining these key factors for the development of tidal current energy, there is an excellent development prospect here. The tidal current energy calculated using the Flux method can develop a power of about 24.19 MW.
The key factors affecting the development of tidal current energy proposed in this paper have been clearly and gradually applied and explained for the case of the GCA in Zhoushan, and they provide a certain reference for the development of tidal current energy in local and other regions. These influencing factors can also be used in studies on the suitability of tidal current energy development in other regions. In addition, the tidal current will also be affected by more specific environmental effects such as wind and waves, and these factors that have not been considered in this paper can be explored in further research.
Author Contributions
Conceptualization, Z.Y. and W.G.; methodology, W.G. and Q.J.; software, W.G.; validation, Z.Y. and W.G.; formal analysis, W.G. and Q.J.; investigation, W.G.; resources, Z.Y.; writing—original draft preparation, W.G.; writing—review and editing, Z.Y. and W.G.; supervision, Z.Y.; project administration, Z.Y. All authors have read and agreed to the published version of the manuscript.
Funding
This research was funded by National Natural Science Foundation of China, grant number 51979249.
Institutional Review Board Statement
Not applicable.
Informed Consent Statement
Not applicable.
Data Availability Statement
The data used to support the findings of this study are included within the article.
Conflicts of Interest
The authors declare that they have no competing financial and non-financial interests.
References
- Li, H. SCADA data based wind power interval prediction using LUBE-based deep residual networks. Front. Energy Res. 2022, 10, 920837. [Google Scholar] [CrossRef]
- Li, H. Short-term Wind Power Prediction via Spatial Temporal Analysis and Deep Residual Networks. Front. Energy Res. 2022, 662. [Google Scholar] [CrossRef]
- Khan, M.Z.A.; Khan, H.A.; Aziz, M. Harvesting Energy from Ocean: Technologies and Perspectives. Energies 2022, 15, 3456. [Google Scholar] [CrossRef]
- Sokulski, C.C.; Barros, M.V.; Salvador, R.; Broday, E.E.; de Francisco, A.C. Trends in Renewable Electricity Generation in the G20 Countries: An Analysis of the 1990–2020 Period. Sustainability 2022, 14, 2084. [Google Scholar] [CrossRef]
- Zhang, J.; Wang, G.; Lin, X. A review of the current situation and key scientific and technological issues in the development and utilization of tidal wave energy. J. River Sea Univ. Nat. Sci. Ed. 2021, 49, 13. [Google Scholar]
- Wang, C.K.; Lu, W. Marine Energy Resources Analysis Methods and Reserve Assessment; Ocean Press: Beijing, China, 2009. [Google Scholar]
- Energy Technology Support Unit. DTI. Tidal Stream Energy Review. ETSU T-05/00155/REP[R]; Binnie and Partners, Sir Robert McAlpine & Sons Ltd.; IT Power Ltd.: London, UK, 1993. [Google Scholar]
- Black&Veatch Consulting, Ltd. UK, Europe, and Global Tidal Energy Resource; Assessment. Marine Energy Challenge Report No. 107799/D/2100/05/; Carbon Trust: London, UK, 2004. [Google Scholar]
- Hagerman, G.; Polagye, B. Methodology for Estimating Tidal Current Energy Resources and Power Production by Tidal In-Stream Energy Conversion (TISEC) Devices; Electric Power Research Institute: Washington, DC, USA, 2006. [Google Scholar]
- Cornett, A. Inventory of Canadian Marine Renewable Energy Resources. 2006. Available online: http://www.researchgate.net/profile/Andrew_Cornett/publication/228642186_Inventory_of_Canadian_Marine_Renewable_Energy_Resources/links/0c960525d3c12b0fc5000000.pdf (accessed on 20 October 2022).
- Tarbotton, M.; Larson, M. Canada Ocean Energy Atlas (Phase 1) Potential Tidal Current Energy Resources Analysis Background; Triton Consultants Ltd.: Vancouver, BC, USA, 2006. [Google Scholar]
- Wang, Z.; Zhou, L.; Zhang, G.; Wang, A. Estimation of tidal energy of specific waterways in Zhoushan Sea. J. Ocean. Univ. China (Nat. Sci. Ed.) 2010, 40, 27–33. [Google Scholar] [CrossRef]
- Jin, Y.D.; Zhao, X. Estimation of tidal energy in the sea near Nanri Island, Putian, Fujian. Mar. Lake Marsh Bull. 2019, 7–12. [Google Scholar] [CrossRef]
- Thiébaut, M.; Sentchev, A. Tidal stream resource assessment in the Dover Strait (eastern English Channel). Int. J. Mar. Energy 2016, 16, 262–278. [Google Scholar] [CrossRef]
- Wang, W.; Yang, J. Assessment of tidal energy resources in Zhoushan sea area. Ocean. Dev. Manag. 2017, 34, 54–60. [Google Scholar]
- Wu, Y.; Wu, H.; Feng, Z. Assessment of tidal energy resources in Putuoshan-Huludao waterway. Renew. Energy 2017, 35, 1566–1573. [Google Scholar] [CrossRef]
- Zhang, J.; Ji, Q.Y.; Zuo, J.; Peng, T.; Su, Y.; Sun, Y. Assessment of tidal energy resources and site selection of power station in Xihoumen waterway, Zhoushan. Adv. Mar. Sci. 2022, 40, 327–341. [Google Scholar]
- Lv, X.; Qiao, F.L.; Zhao, C.; Xia, C.S. Numerical estimation of ocean tidal energy resources--Jiaozhou Bay mouth as an example. J. Sol. Energy 2010, 31, 137–143. [Google Scholar] [CrossRef]
- Guo, W.; Kang, H.; Wang, Q.; Yu, T. Tidal energy estimation based on TFD model for large and small Changshan Island waters. J. Sol. Energy 2016, 37, 1057–1063. [Google Scholar]
- Iglesias, G.; Sanchez, M.; Carballo, R.; Fernández, H. The TSE index—A new tool for selecting tidal stream sites in depth-limited regions. Renew. Energy 2012, 48, 48350–48357. [Google Scholar] [CrossRef]
- Radfar, S.; Panahi, R.; Majidi Nezhad, M.; Neshat, M. A Numerical Methodology to Predict the Maximum Power Output of Tidal Stream Arrays. Sustainability 2022, 14, 1664. [Google Scholar] [CrossRef]
- Segura, E.; Morales, R.; Somolinos, J.A. Influence of Automated Maneuvers on the Economic Feasibility of Tidal Energy Farms. Sustainability 2019, 11, 5965. [Google Scholar] [CrossRef]
- Wang, C.; Shi, W. The reserves of China’s ocean energy resources and their evaluation. In Proceedings of the Inaugural Meeting and Symposium of the Ocean Energy Committee of the China Renewable Energy Society, Hangzhou, China, 27 March 2008. [Google Scholar]
- Jo, C.H.; Kang, H.L.; Lee, J.H.; Nichita, C. Multi-arrayed tidal current energy farm and the integration method of the power transportation. In Proceedings of the Power Electronics, Electrical Drives, Automation and Motion (SPEEDAM), Sorrento, Italy, 13 August 2012; IEEE: Piscataway Township, NJ, USA, 2012. [Google Scholar]
- Khan, M.J.; Bhuyan, G.; Iqbal, M.T.; Quaicoe, J.E. Hydrokinetic energy conversion systems and assessment of horizontal and vertical axis turbines for river and tidal applications: A technology status review. Appl. Energy 2009, 86, 1823–1835. [Google Scholar] [CrossRef]
- Karsten, R.H.; Mcmillan, J.M.; Lickley, M.J.; Haynes, R.D. Assessment of tidal current energy in the Minas Passage, Bay of Fundy. Proc. Inst. Mech. Eng. Part A J. Power Energy 2008, 222. [Google Scholar] [CrossRef]
- Bryden, I.G.; Couch, S.J. MEI—Marine energy extraction: Tidal resource analysis. Renew. Energy 2006, 31, 133–139. [Google Scholar] [CrossRef]
| Publisher’s Note: MDPI stays neutral with regard to jurisdictional claims in published maps and institutional affiliations. |
© 2022 by the authors. Licensee MDPI, Basel, Switzerland. This article is an open access article distributed under the terms and conditions of the Creative Commons Attribution (CC BY) license (https://creativecommons.org/licenses/by/4.0/).

