Article

De-Risking the Energy Efficient Renovation of Commercial Office Buildings through Technical-Financial Risk Assessment

1
EURAC Research, Viale Druso 1, 39100 Bolzano, Italy
2
ABC Department, Politecnico di Milano, Via Ponzio 31, 20133 Milano, Italy
3
Sinloc Sistema Iniziative Locali, Via Gozzi 2/G, 35131 Padova, Italy
*
Author to whom correspondence should be addressed.
Sustainability 2022, 14(2), 1011; https://doi.org/10.3390/su14021011
Submission received: 4 November 2021 / Revised: 26 December 2021 / Accepted: 29 December 2021 / Published: 17 January 2022

Abstract

:
Energy efficiency in the building sector plays a key role in supporting European and global commitments against the current climate crisis. A massive adoption of deep renovation measures would allow a global reduction of energy need up to 36%, based on estimations. However, the market for building renovation is still limited, due to uncertainties associated with risk evaluation. This paper aims to suggest a method to evaluate the financial impacts of technical risks related to energy efficiency investments. Key performance indicators (KPIs) necessary to evaluate the investment risk associated with energy renovation have been defined based on an analysis of the correlation between technical and financial risks, and their originating factors or root causes. The evaluation has been carried out thanks to the EEnvest tool: a web-based search and match platform, developed within the EEnvest collaborative research project funded by the European Commission (EC). This evaluation methodology has then been applied to a case study, an office building located in Rome, for whom an energy efficient renovation project was already in place to reduce energy needs. The investment risk of the renovation project is calculated for two different scenarios: with and without risk mitigation measures being applied during the design, installation and operation phases. The results show the different technical and financial risk trends of these two scenarios, highlighting the benefits obtained by the implementation of mitigation measures.

1. Introduction

The European Union (EU) set a range of commitments with regards to climate action, in line with the Paris climate conference in 2015. The above range from: (i) greenhouse gas reduction equalling at least 40% before 2030 compared to levels registered in 1990; (ii) increased use of renewable energy sources equal to at least 40%; and (iii) improved energy security, competitiveness and overall sustainability of all Union member states. In this scenario, the EU Directive 2018/2002 [1] sets ambitious energy efficiency targets and is supported by the EU Directive 2018/2001 that establishes a 32% binding target for the integration of energy generated by renewable sources [2].
Several studies have underlined the role of energy efficiency measures in the building sector to achieve such objectives. The European Building Stock Observatory has defined three different energy renovation levels for the building stock, based on the primary energy savings achieved after renovation: light, below 30%; medium, between 30 and 60%; and deep, above 60%. Massive adoption of deep renovation measures would allow an average reduction of energy need in the range of 36% globally [3], also reducing reliance on energy import while creating economic growth, innovation, and job opportunities. Asides from these, it would also contribute to transforming buildings into more comfortable and healthier indoor spaces.
The building sector, given its inherent energy-saving potential demonstrated by several studies, is a priority intervention area in the global effort towards sustainability. Several regulations are nowadays in place at both the European and national level, to ensure quality and efficiency of energy renovation, whose rhythm is still below 1.2% yearly average [4]. Studies performed by the Building Performance Institute Europe (BPIE) based on energy performance certificates (EPC) demonstrated that 97.5% of the built environment is ranked below A class [5]. As a consequence, the application of energy efficiency measures to both passive and active building elements are deemed to play a fundamental role in a successful energy transition to support climate objectives at a European and global level [5].
Despite a registered growth in the last decades, the market for building energy renovation is still prevented from a wider diffusion by a set of obstacles. These can be summarized as: (i) lack of adequate and market specific financial instruments; (ii) uncertainty on the final financial return and energy yield; (iii) undefined investment risk; (iv) lack of standardized approaches to risk assessment, and (v) lack of a virtual space in which to match demand and offer energy renovation services. The above turn into a single functional barrier to the expansion of deep energy retrofits in the building sector: uncertain risk perception. Stakeholders along the construction value chain related to building renovation are currently not able to identify and quantify the impact of risk on final achieved savings, and so hesitate to undertake such actions [6].
To overcome this cultural barrier and mainstream those investments for the financial sector three projects have been financed by the Horizon 2020 framework programme, funded by the European Commission: EEnvest, Triple-A and QUEST [7].
The EEnvest research project, financed by the European Commission in July 2019 and continuing for 36 months, aims to provide the market with a thorough risk assessment methodology focused on building energy renovation and a search and match investment evaluation platform to connect offers with demands for energy renovation investments. The final goal of the project is to attract private capital into the renovation sector, at present stage heavily grounded on state incentives. Within EEnvest, a framework for evaluating financial impacts of technical risks related to energy efficient renovation projects has been developed with the purpose of fitting into investors’ decision-making processes. As financial evaluation of technical risks is a rather complex matter, the first application of the EEnvest method has focused on commercial office buildings, which are the ones showing the highest potential in terms of energy and cost savings in relation to business impact.

2. Background on De-Risking Energy Efficiency in the Building Renovation Sector

Construction projects are normally initiated in complex and dynamic environments, resulting in circumstances of high uncertainty and risk, which are compounded by demanding time constraints. Being able to identify and manage risks, from the technical and economic point of view, is crucial for investors and designers [8]. The word “risk” has many different meanings in literature. One of the most general defines a risk as any factor, event that threatens the successful completion of a project in terms of time, cost, or quality. Focusing on the construction industry, risk is identified by technical factors that might negatively affect the quality and performance of the building. The risk is the effect of uncertainty on the achievement of the objectives intended as a state, even partial, of lack of information related to the knowledge of an event [9].
In the building renovation process, it is quite common to find a difference between planned building energy performance, as calculated during the design phase and measured energy consumption during the actual building operation phase. This represents an inherent risk of energy renovations, which may lead to a mismatch between foreseen and actual financial indicators, such as payback time. This difference is called energy performance gap [10,11,12,13] and can be generated by a variety of root causes. These can be divided in two main groups: those that are calculation driven and those that are component driven. Calculation driven gaps are generated by a mismatch between the simulated model of the building and its actual configuration. Root causes can be ascribed to errors in model construction or in model application, as well as to installation inadequacy that triggers component underperformance. Component driven gaps are related to component technical failure (or damages) [14]. Damages are deemed to generate part of the energy gap, as well as additional incurred costs for component reparation or substitution. Despite the root causes of risks associated with energy renovation actions being clear at a high level, there is a lack of structured literature in the field. In the last decade, the European Commission has highlighted the importance of de-risking energy efficiency for investors, with the aim to attract private capital in the sector and multiply actions that have been based on public incentive schemes since the early 2000s. In this frame, research in the field of financial risk associated with energy efficiency actions has been promoted at policy level, providing space to several call topics under the Horizon 2020 research framework program [15]. According to the International Standard Organization (ISO), as per their ISO 31,000 standard [9], risk management is based on a sequence of steps: context definition, risk identification, analysis process and mitigation measures identification. In the context of energy efficiency in the building renovation sector, there is an interest on the side of several stakeholders to de-risk investments to secure their capital, their future expenditure in energy bills, and their comfort levels in indoor spaces. The main stakeholders involved in de-risking are investors/financers, building owners and tenants. Several studies have demonstrated that energy efficiency generally adds commercial value to real estate assets [16]. However, as the guarantee for achieved energy performance results is not provided except in the case of energy performance contract procurement types, stakeholders often doubt whether to accept the extra costs related to the adoption of a deep energy renovation approach, rather than opting out of those risks and choosing basic light energy renovation approaches [17,18,19].
Most recently, the Energy Efficient Mortgages Initiative has developed a thorough evaluation of mortgages across EU member states, demonstrating a promisingly negative correlation between energy efficiency features of a building and the probability of default associated with the mortgage [20].

3. EEnvest Evaluation Methodology for Energy Efficient Renovation Projects

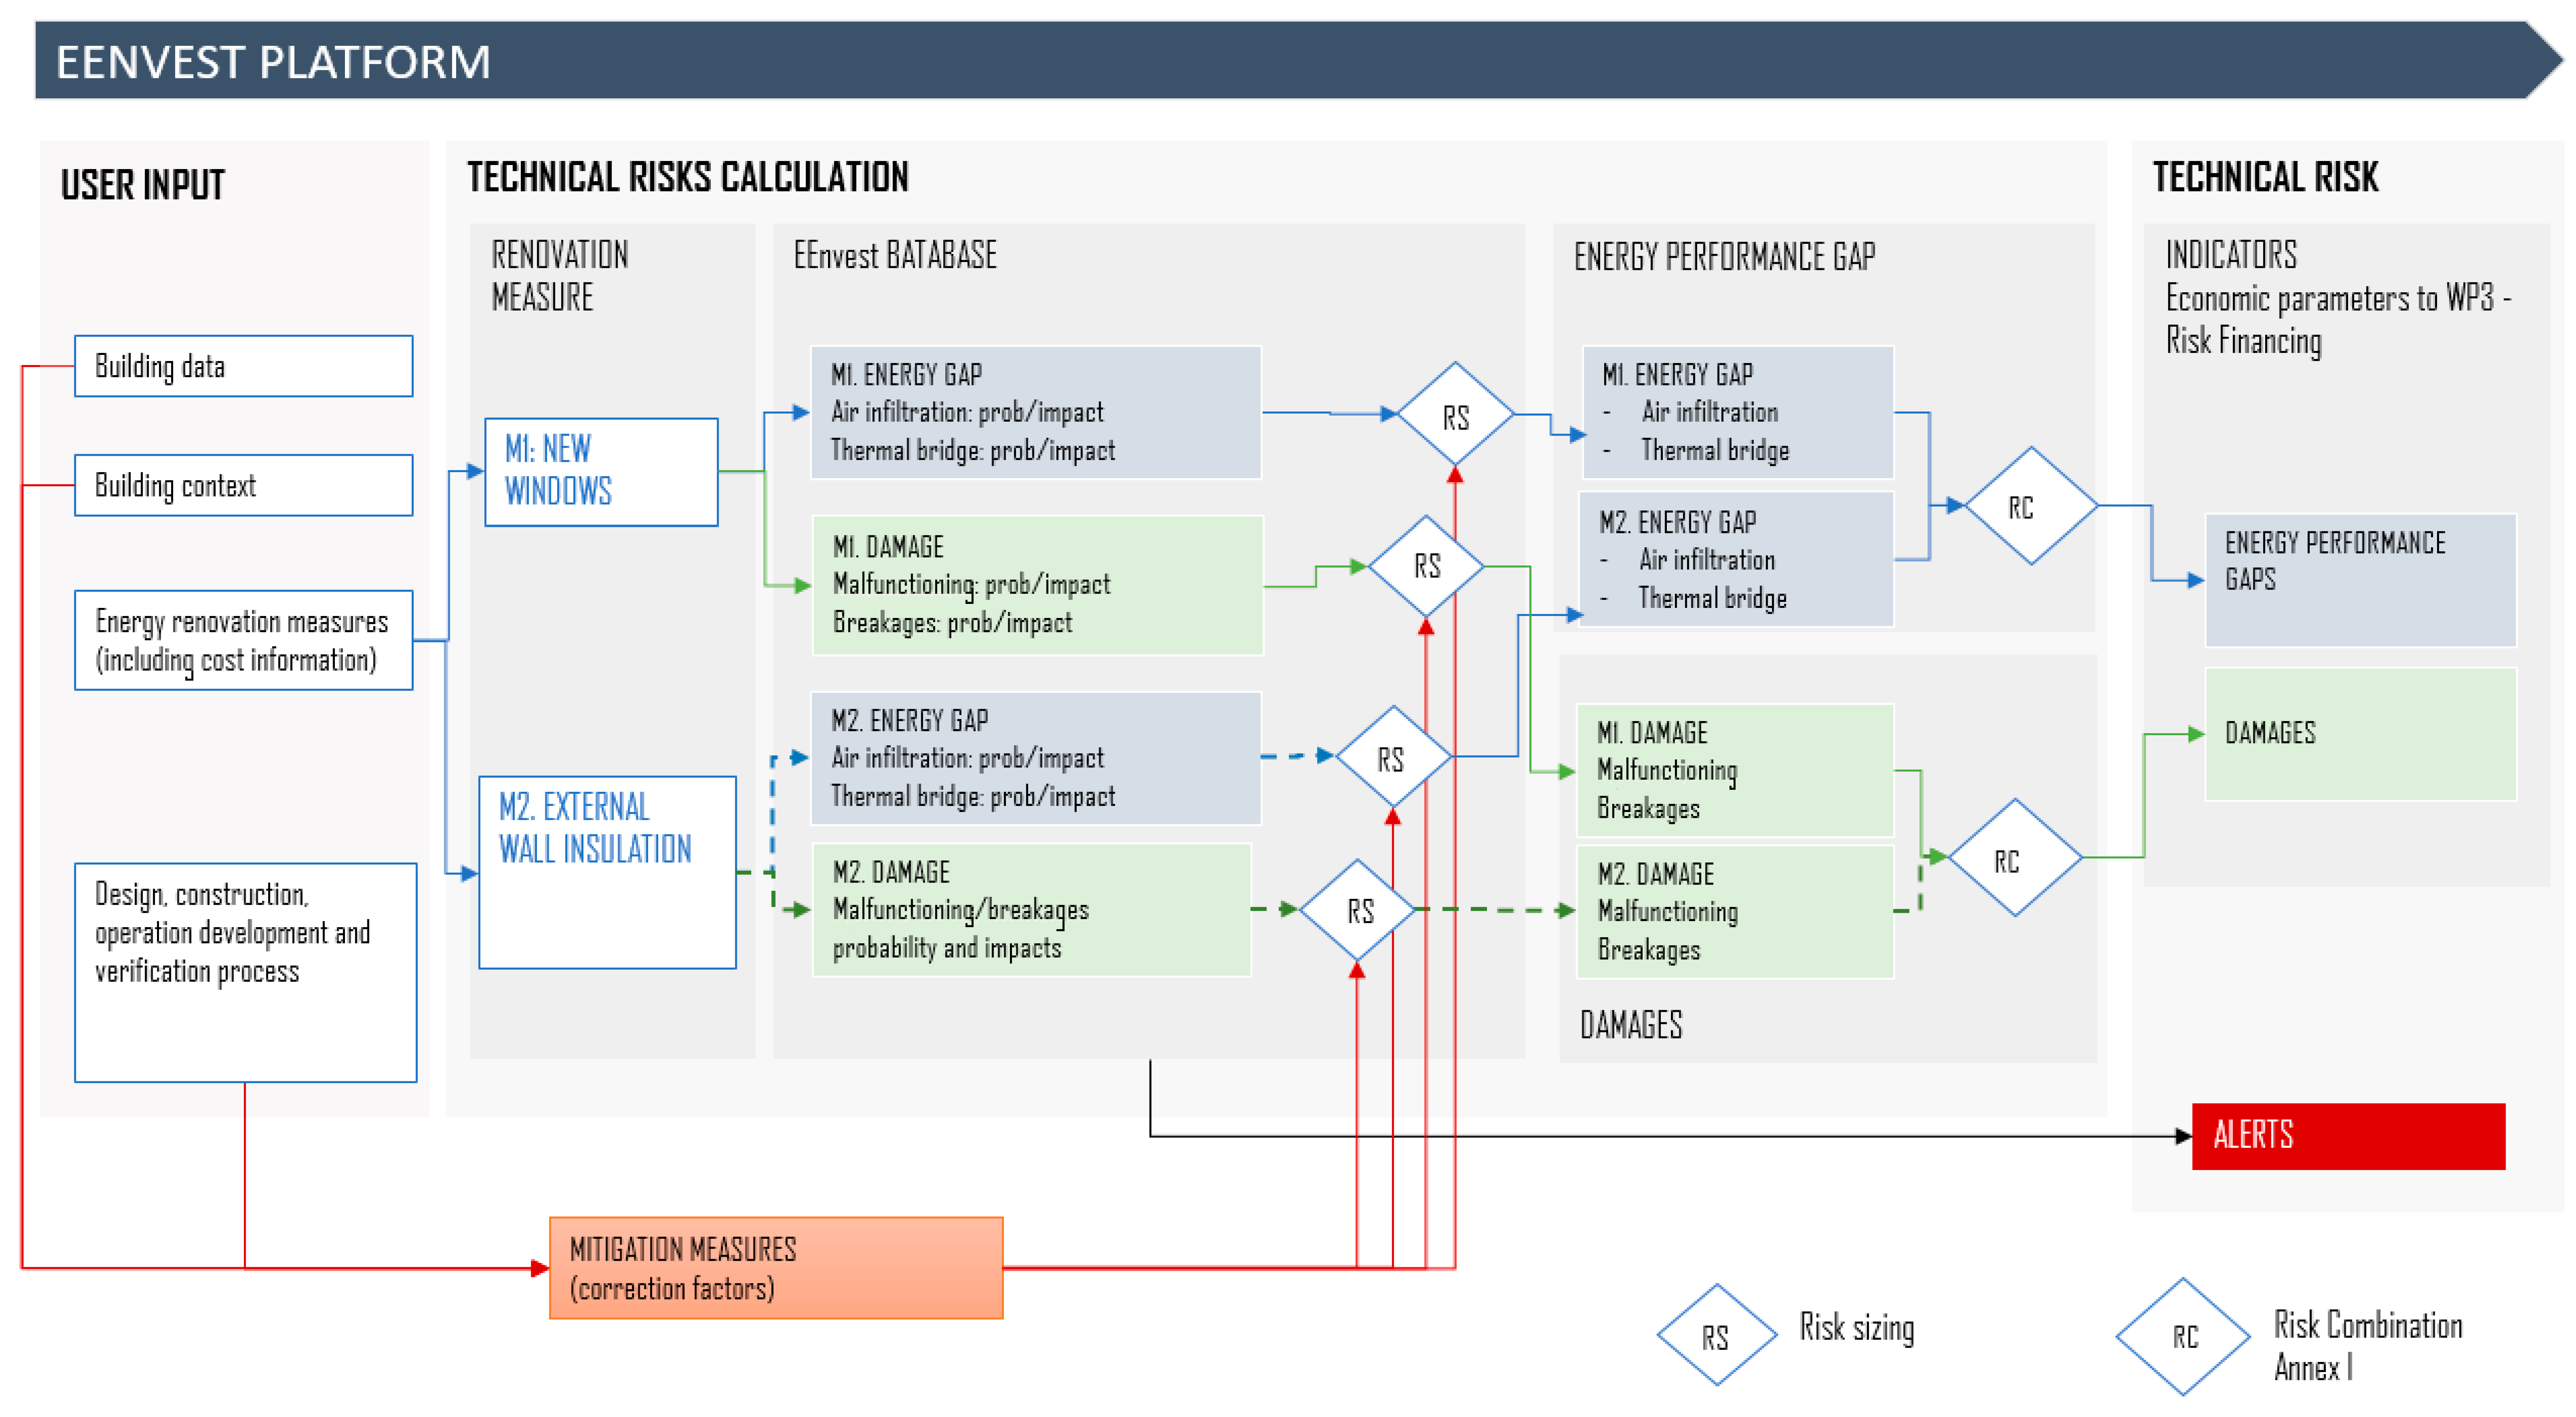
3.1. Definition of Technical Risk

Within the EEnvest project, risk is identified by analysing the energy consumption deviation from the expected energy performance, as well as the possible negative consequences due to the implementation of the renovation action or of a set of actions. During the building renovation project, technical risks can negatively affect the economic trend of the investment, producing some deviations from the expected business plan. These differences depend on several factors (errors or technical failures) and occur in different phases of the renovation project (design, installation, or operation phase). The EEnvest technical risk definition includes the occurrences that arise occasionally (such as extraordinary maintenance), but does not consider ordinary maintenance, since that is part of the life cycle cost analysis of each renovation project. The EEnvest technical risk is generated by possible errors generated during the design phase (presented as “calculation-driven gaps” in the following section) and/or construction and operation phases (“component-driven gaps”) of the building. Breakages and failures covered by the constructor’s warranty are not accounted for in EEnvest technical risk definition, as they would normally be repaired or replaced by the warranty provider at no cost for the owner or tenant. Starting from these considerations, the EEnvest approach identifies the financial impact of technical risk introducing two specific indicators that directly link technical and economic issues: (i) the energy performance gap and (ii) the damage, both strictly connected to the decision-making process, with a direct influence on the economic investment.
The energy performance gap (as a percentage of the energy performance) is one of the most complex and common issues of energy performance deviation between predicted and real measurement of a building energy consumption, analysed in numerous articles [21,22,23,24] and considered an important part of the technical risk [25]. It can depend on several matters: (i) mismatch between design, construction, and operation phase; (ii) differences between input data sets of the calculation phase (planning, modelling) and real building use, in terms of working hours, occupancy, lighting condition, temperature, etc.; (iii) external conditions, such as climate (temperature, solar radiation, humidity, wind, etc.); or (iv) differences between building code requirements and final use/implementation.
On the other side, the damage indicator (as a percentage on the investment—%, as mentioned for the previous indicator) includes the investment deviation due to technical failures, malfunctions, or breakages of the building elements. These two indicators are independent from each other and non-exhaustive if considered separately.
The EEnvest platform also provides users with both indicators in terms of respective economic values (€), in order to make them easier to understand as well as to increase their market uptake.

Technical Risk Calculation Methodology

The EEnvest technical risks calculation method allows for the matching of several probability–impact data distributions of possible occurrences extracted from the data inputs of the building project. In the EEnvest web-platform, the EEnvest technical risk database is uploaded together with (i) several probabilistic impact data of possible occurrences and failures that can happen to the building elements and technical systems, (ii) correction factors (mitigation measures) used to modulate the effect of a risk, and (iii) alerts. The technical risk calculation process runs online on the EEnvest web-platform extracting from the EEnvest technical risk database all the technical risk combinations specific to a renovation strategy elaborated for a building, producing a technical risks probabilistic trend of impact and probability for both energy gap deviation and damage indicators. An overview of the technical risk calculation process in the EEnvest web-platform is reported in Figure 1.
Figure 1, shows how the technical risk calculation method works. Input data, inserted by the users based on their own renovation scenario and building features, activate the risk calculation process, extracting the probabilistic impact of the occurrences of the energy renovation measures implemented from the EEnvest technical risk database. In the case of Figure 1 the renovation project is characterized by two energy renovation measures: M1 substitution of the windows and M2 installation of the thermal insulation in the external wall. The technical risk amounts of both indicators (energy gap and damage) are sized (RS calculation) on (i) building dimension (project building data inputs), (ii) features of building boundary condition as climate severity, and (iii) mitigation measures implemented, as certification protocols or verification procedures. The output, for both technical risk indicators, is a complete probabilistic trend of technical risks of technical malfunctioning (including both impact and probability) determined through a Monte Carlo simulation.

3.2. Definition of Financial Risk Associated with Technical Risk

Financial risk can be defined, in general terms, as the possibility of losing money on an investment. In the context of energy efficiency and for the purpose of our work, financial risk can be defined as the possibility of losing money or, better, not achieving the expected return on an investment for the energy efficiency renovation of a building. There are many variables that can affect financial performance of an investment. In our case, following the approach of Jackson [26], we consider three main variables:
i.
Technical performance: if the renovation measures do not perform as expected, then the financial performance of the investment will also be directly affected. In the case of energy performance gap, lower energy savings means lower economic and financial savings, while in the case of damage, an additional investment is required in order to achieve the expected results;
ii.
Climate: warm winters and cold summers affect the overall economic convenience of an energy efficiency investment, as they imply lower energy requirement for the building. This means, compared with the baseline of historical energy consumption, that the real amount of energy saved will be lower than expected, implying a lower return on the investment;
iii.
Energy price: the variation of the cost of energy also affects the economic convenience of an investment, as the same amount of energy saved in terms of kWh will correspond to a different Euro amount.
For each variable, the model estimates a probability distribution. As refers to the technical performance, the probability distributions for energy gap and damage are calculated as shown in the previous paragraph. The probability distributions for climate and energy prices, instead, are calculated based on historical series available from external data providers. The calculation of the financial impact of technical risks is therefore calculated based on the following assumptions:
  • The event of damage causes an additional investment for extraordinary maintenance/repair. As a consequence, in order to estimate its impact on the financial performance, the probability distribution of the damage random variable, expressed as a percentage, is applied to the investment cost, and considered as a negative economic component for the calculation of financial indicators.
  • The event of underperformance causes a reduction of energy savings compared to expectations. As a consequence, in order to estimate its impact on the financial performance, the probability distribution of the energy gap random variable is applied to the expected value of energy savings and considered as a negative economic component for the calculation of financial indicators.
It is also assumed that the event of damage is not correlated to the event of underperformance. This means that the two probability distributions are calculated, treated, and applied independently. Moreover, while the damage event is only related to technical risks, energy performance is affected by all three variables, namely energy gap, climate, and energy price. Provided that the three variables are assumed to be stochastically independent, the EEnvest model calculates the overall financial risk as the combination of the probability distributions of each of the three variables concerned through a Monte Carlo simulation. This method consists in drafting one random value from the probability distribution of each variable and then inputting those values into a formula in order to find one expected value of the cash flow, that is, in our case, the monetary value of the expected energy savings generated each year. The formula used to calculate the cash flow is the following:
CashFlow = EES × EP × (1 − EnergyGap) × HDD − Investment × Damage
where:
  • EES = Expected Energy Saving, expressed in kWh, provided by the user as input;
  • EP = Energy Price, expressed in €/kWh, provided by the user as input (based on actual prices observed for the energy audit) and linked to a probability distribution based on the analysis of historical series;
  • EnergyGap = Risk of technical underperformance as explained above, expressed as a probability distribution in terms of % of EES;
  • HDD = Heating Degree Days, representing the climate risk in terms of a probability distribution calculated on the basis of the historical series;
  • Investment = Investment cost
  • Damage = Risk of technical damage as explained above, expressed as a probability distribution in terms of % of the investment cost.
This is a simplified formula, which only considers the thermal energy consumption affected by HDD. In case of building renovation including electric components, the formula shall also be extended to consider the different electric energy price). Repeating the Monte Carlo simulation for a large enough number of times (i.e., more than 100,000), results in a series of values for cash flow that can be used to draft a probability distribution of the variable. The same series of values can be further exploited in order to calculate a series and a probability distribution of the relevant outputs of the financial analysis, such as the payback time and the Internal Rate of Return (IRR) of the investment.

3.3. Financial Evaluation of Energy Efficient Building Renovation Based on the Occurrence of Technical Risk: The EEnvest Evaluation Methodology

The evaluation of the energy efficient building renovation investment, a core result of the EEnvest search and match platform, is done according to seven different key performance indicators (KPIs) that refer, respectively, to the technical risk (Table 1) and to the financial risk (Table 2) of the investment.
When reporting indicators, a mix of graphs and commentary is generally the most effective option rather than presenting only large amounts of commentary or, likewise, only condensed representations in graph form. Considering the multivariate data output of the EEnvest project, the radar chart (also known as spider chart, polar chart, star chart or Kiviat diagram) is a suitable solution for data representation. The radar chart is represented by a two-dimensional chart containing three or more variables, with axes starting from the same point and arranged radially. The data length of the different spokes is proportional to the magnitude of the variable and the variables are represented by decimal numbers with the same scale between all axes. Each variable value is plotted along its individual axis and all the variables in a dataset are connected together to form a polygon. The radar chart can be used to visualize and analyse the quality of data and specifically to show:
  • Similarity between observations.
  • Comparison between observations.
  • Presence of outlier variables.
Many variables can be easily compared, each one along its own axis, and overall differences are identified by the size and shape of the polygons. The results can be used individually or by defining clusters with similar features. The radar chart representation is also useful for detecting which variables are scoring high or low within a dataset, making them ideal for displaying performance. In general, there are pros and cons to almost any type of report or data visualization. Spider graphs offer an interesting way of looking at several variables at the same time, and they provide the great advantage of being fast and easy to understand.
The radar visualization shows different constraints, such as:
  • Using multiple polygons in the same radar chart makes it hard to read.
  • Representing too many variables creates too many axes and can also make the chart more complicated and harder to read.
  • The variables on the different axes are usually nominally independent, therefore it can be hard to compare values across each variable.
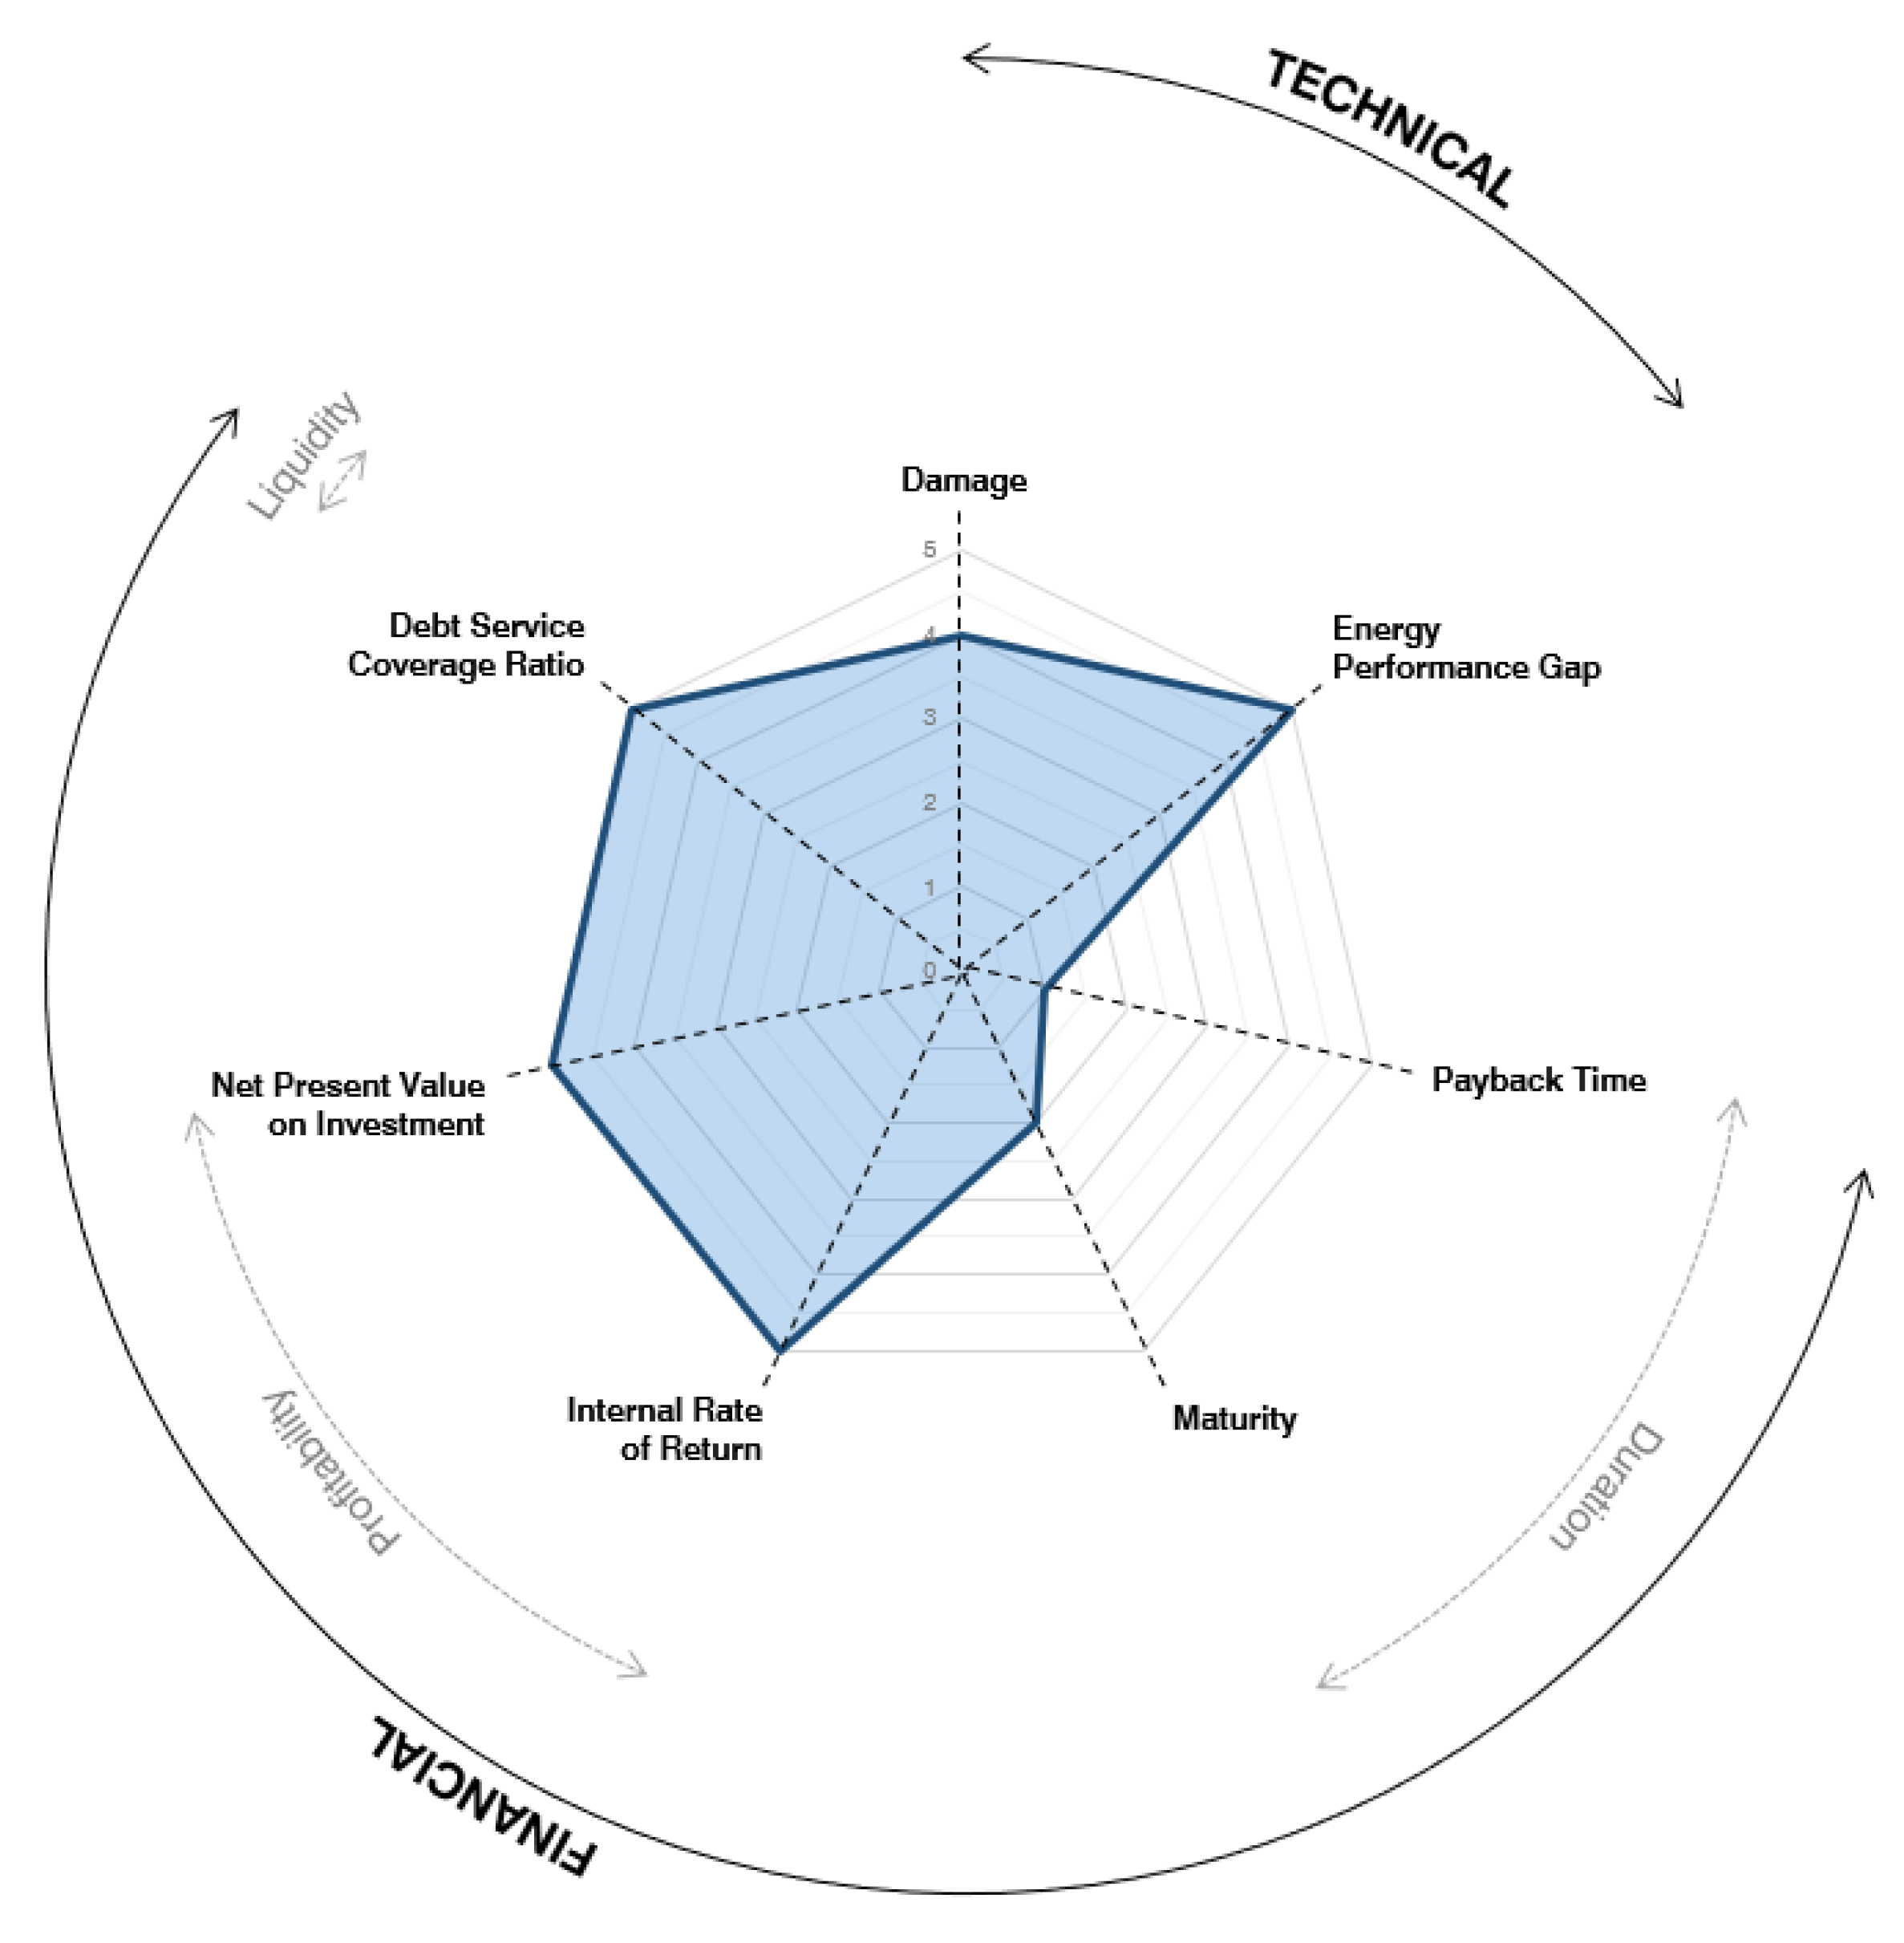
  • The main pros of the radar visualization are:
  • Overlaying multiple “webs” on a radar graph allows a very easy visual comparison against reference data sets.
  • A reference polygon can be used as a benchmark for easy comparison.
  • Deficiencies or strengths in performance are easy to visualize.
For all these reasons, the evaluation of the investment—a core result of the EEnvest search and match platform—has also been summarized by the EEnvest Radar graph and by the associated average performance of the investment, as presented in Figure 2. The average performance is calculated as a simple average of the rating that the investment has obtained in each KPI, separately for each of the two categories (technical and financial risk). As shown in Figure 2, the radar graph is composed of several convergent axes, each of which represents one variable. Axes are divided in a range of values, bigger as one moves farther from the centre of the graph. On each axis, one data point will show the variables value, and the connection of all the data points will consequently draw the area of the polygon.
The dimension and the shape of the polygon will be analysed for the comparison of different case studies. The overall quality or desirability of the energy renovation investment is evaluated according to five levels, where 1 is the lowest and 5 is the highest (Figure 3).
This type of visualization and evaluation is very promising, considering also the possibility to easily compare multiple radar graphs by simply overlapping them, and can therefore work as a very powerful tool during the investment decision-making process.

4. Case Study: Renovation of an Office Building

This paragraph shows the EEnvest technical risk evaluation process presenting an energy renovation strategy at a selected office building, located in Rome (Italy), and shown in Table 3. Italian pilot is the headquarters of the International Fund for Agricultural Development (IFAD), an international financial institution and specialized United Nations agency that works to address poverty and hunger in rural areas of developing countries. The IFAD building is located in Via Paolo di Dono 44, Rome (IT) and it is managed by Prelios SGR. The office building was built in 2001, for a total gross surface area of more than 46,000 square meters. It is composed of ten floors, eight above-ground and two below-ground storeys. The net heating area is about 24,470 m2 with a net heating volume of 97,000 m3.
In 2010, the building was the first building to achieve the Leadership in Energy and Environmental Design certification for Existing Buildings: Operations and Maintenance (LEED EB:O&M). In 2015, the IFAD building was the first Italian building and the first United Nation (UN) entity to become LEED certified, and it achieved the Platinum level, the highest level of LEED certification awarded by the United States Green Building Council (USGBC).
The IFAD building’s baseline energy consumption and building managing costs before the renovation (in 2017) were in the range of 1.4 Mil € (see Table 4), and included:
-
Natural gas consumption for thermal energy equal to approximately 1.5 M kWh/year, with an associated cost up to about 50,000 € (with a price of natural gas of 0.03 €/kWh).
-
Electric consumption about 3.2 M kWh/year, with associated costs up to 420,000 € (considering the electric price of 0.13 €/kWh).
-
Operation and maintenance (O&M) cost of the whole building, close to 316,000 € (this data includes the costs of maintenance contracts of the building construction, thermal and electric systems, operation and replacement and substitution of the materials or components).
IFAD and Prelios SGR decided to renovate this building in 2019 with the support of Prelios Integra SpA. The annual amount of the energy costs was about 470,000 €/year, respectively 11% for natural gas and 89% for electric demand. Systems performance improvement was the main driver of this renovation, based on the need to reduce electric consumption of the building. The building envelope was excluded from this round of renovation, as it had already been refurbished in 2015. The proposed renovation strategy (see Table 5) aimed to increase the energy performance and to produce as much electric energy as possible. For the heating generation system, the gas boiler was substituted by a new co-generator (a system able to produce thermal and electric energy from natural gas) and a photovoltaic system to supply energy to the co-generator. The mechanical air ventilation system was substituted by a more performing system using a multi-purpose air-conditioning system, and the lighting systems were replaced by LED technology.
The energy renovation project aims to achieve a reduction equal to about 37% of the energy consumption of the building from 2019 to 2021. Table 6 shows the energy consumption and related costs, estimated after the renovation project. The natural gas demand increased from 1,468,243 kWh/year at pre-renovation to 1,890,243 kWh/year at post-renovation, because the co-generator system uses natural gas to produce thermal and electric energy. Conversely, the electric consumption (as electricity delivered form the grid) is reduced by 55%, from 3,286,000 kWh/year to 1.806.000 kWh/year. The IFAD energy cost after the renovation was estimated at 295,436 €, respectively 22% for natural gas, and 78% for electric energy. Operation and maintenance costs (O&M), including contracts, operations, replacement materials, are not expected to vary significantly after the renovation so the same amount is considered.
The EEnvest testing process confronts two different renovation strategies (Table 7) with the same solution set (renovation measures adopted) and the same energy performance (building energy demand for heating, cooling, ventilation, etc.) but with different mitigation measures:
-
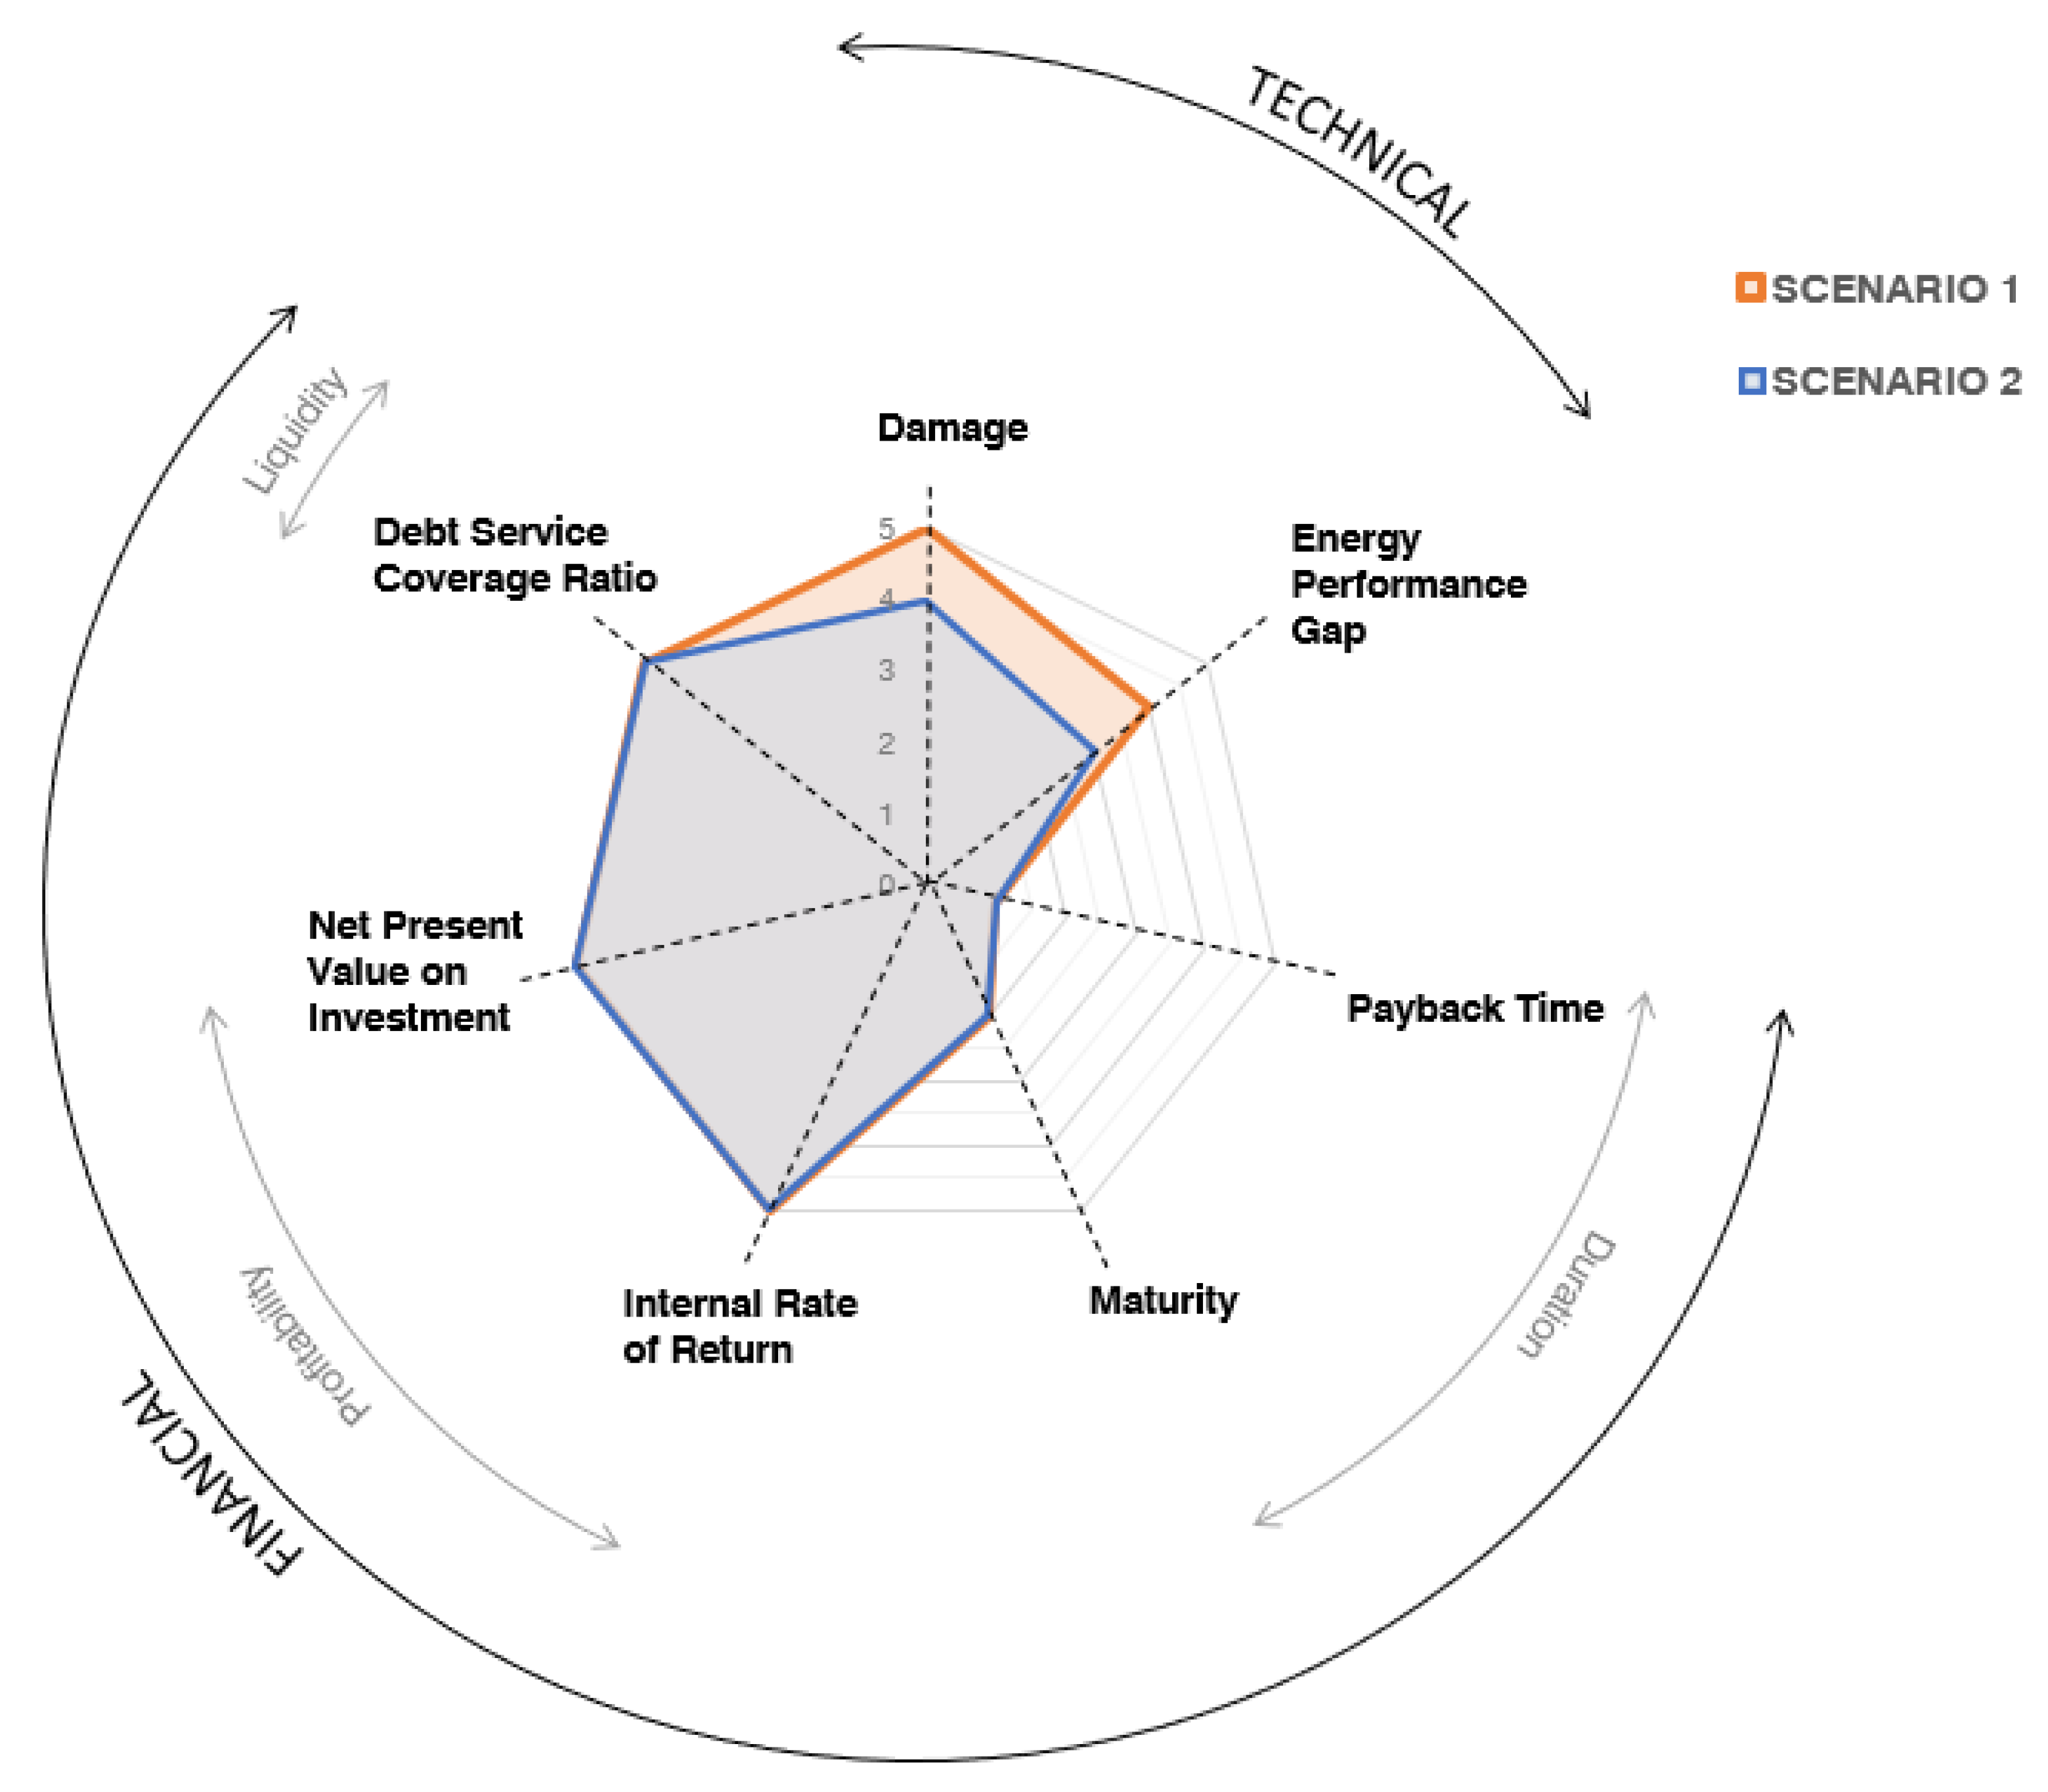
Scenario 1 includes the mitigation measures, such as the LEED certification and the energy performance monitoring; according to this, the investment is slightly higher, with a payback time of 7.46 years.
-
Scenario 2 does not include any mitigation measure; the investment is lower, and the payback time is reduced to 7.26 years.

4.1. Technical Risk Evaluation

EEnvest technical risk calculation method is directly connected to the solution sets identified in the energy renovation strategy, both for the energy renovation measures and mitigation measures adopted. EEnvest technical method extracts and sizes the impact risks from the database (assigning weights). In this pilot we have tested two different scenarios, including the same renovation measures applying to building systems (heating and cooling system, ventilation, and lighting) but differing based on the application of mitigation measures. The trend of the damage, energy performance gap and payback time indicators has been calculated for both scenarios through the EEnvest technical risk calculation method, the results are reported in Table 8.
From the results reported in Table 8, in Scenario 2 the technical risk probabilistic calculation shows the following:
-
damage indicators double the investment deviation from scenario 1;
-
energy gap indicator doubles the (annual) energy costs of scenario 1;
-
payback time indicator with technical risk is higher than scenario 1.
The mitigation measures implemented in Scenario 1 reduce the economic impact of technically non-compliant situations. Furthermore, the trend of payback time indicator calculated with and without technical risks (Table 7 and Table 8) highlights that the impact of technical risk is quite significant, with the scenario 1 increase equal to about 1.47% (from 7.46 to 7.57 years) while in scenario 2 the increase is equal to about 6.61% (from 7.26 to 7.74 year).

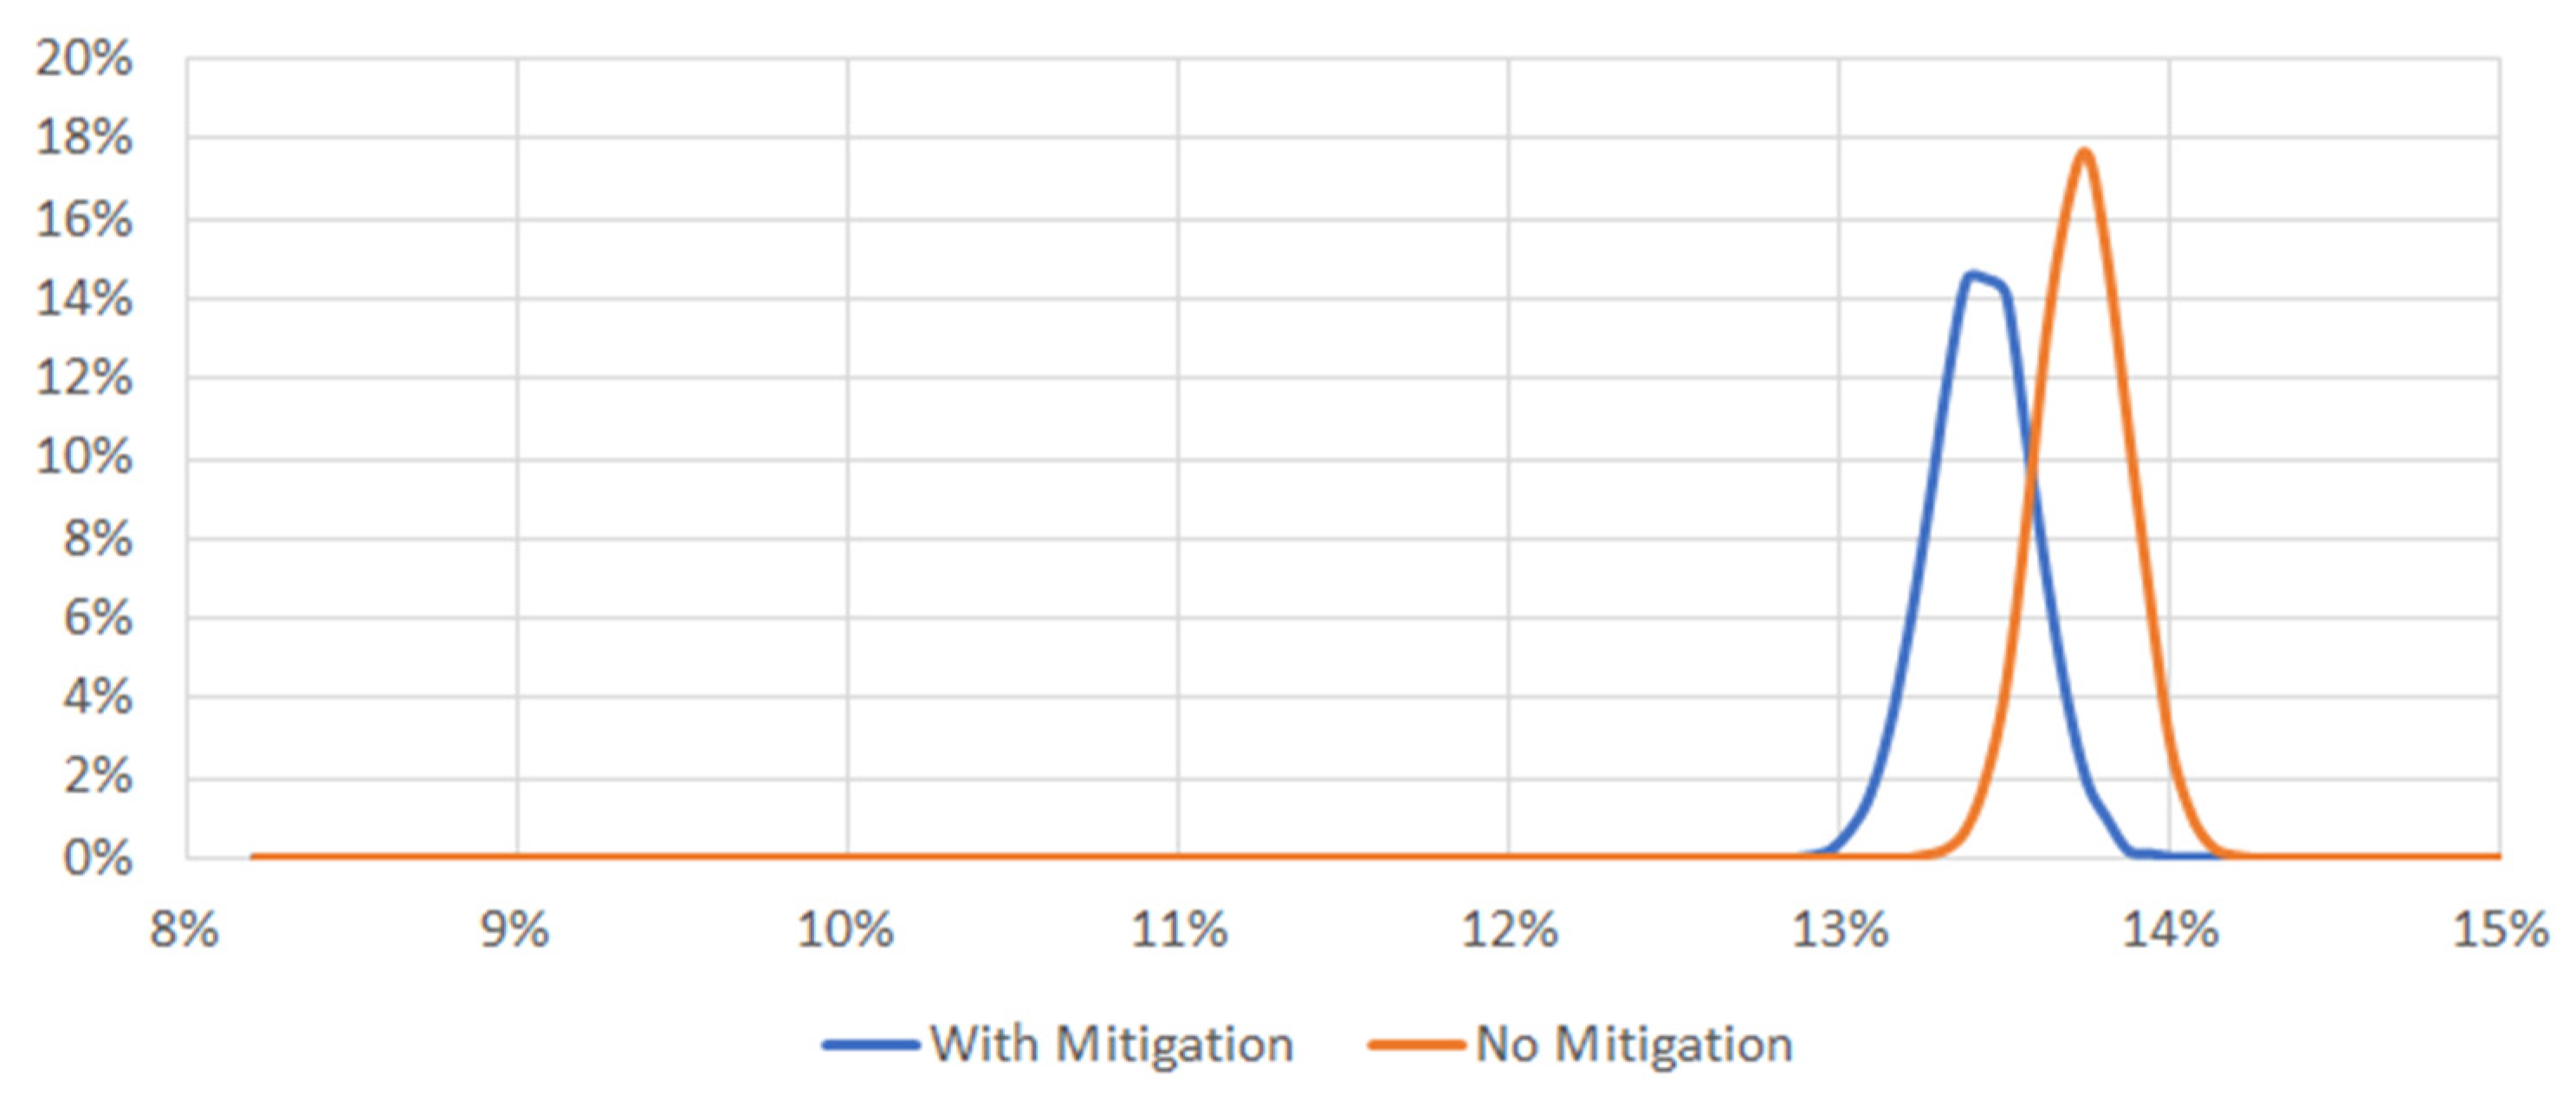
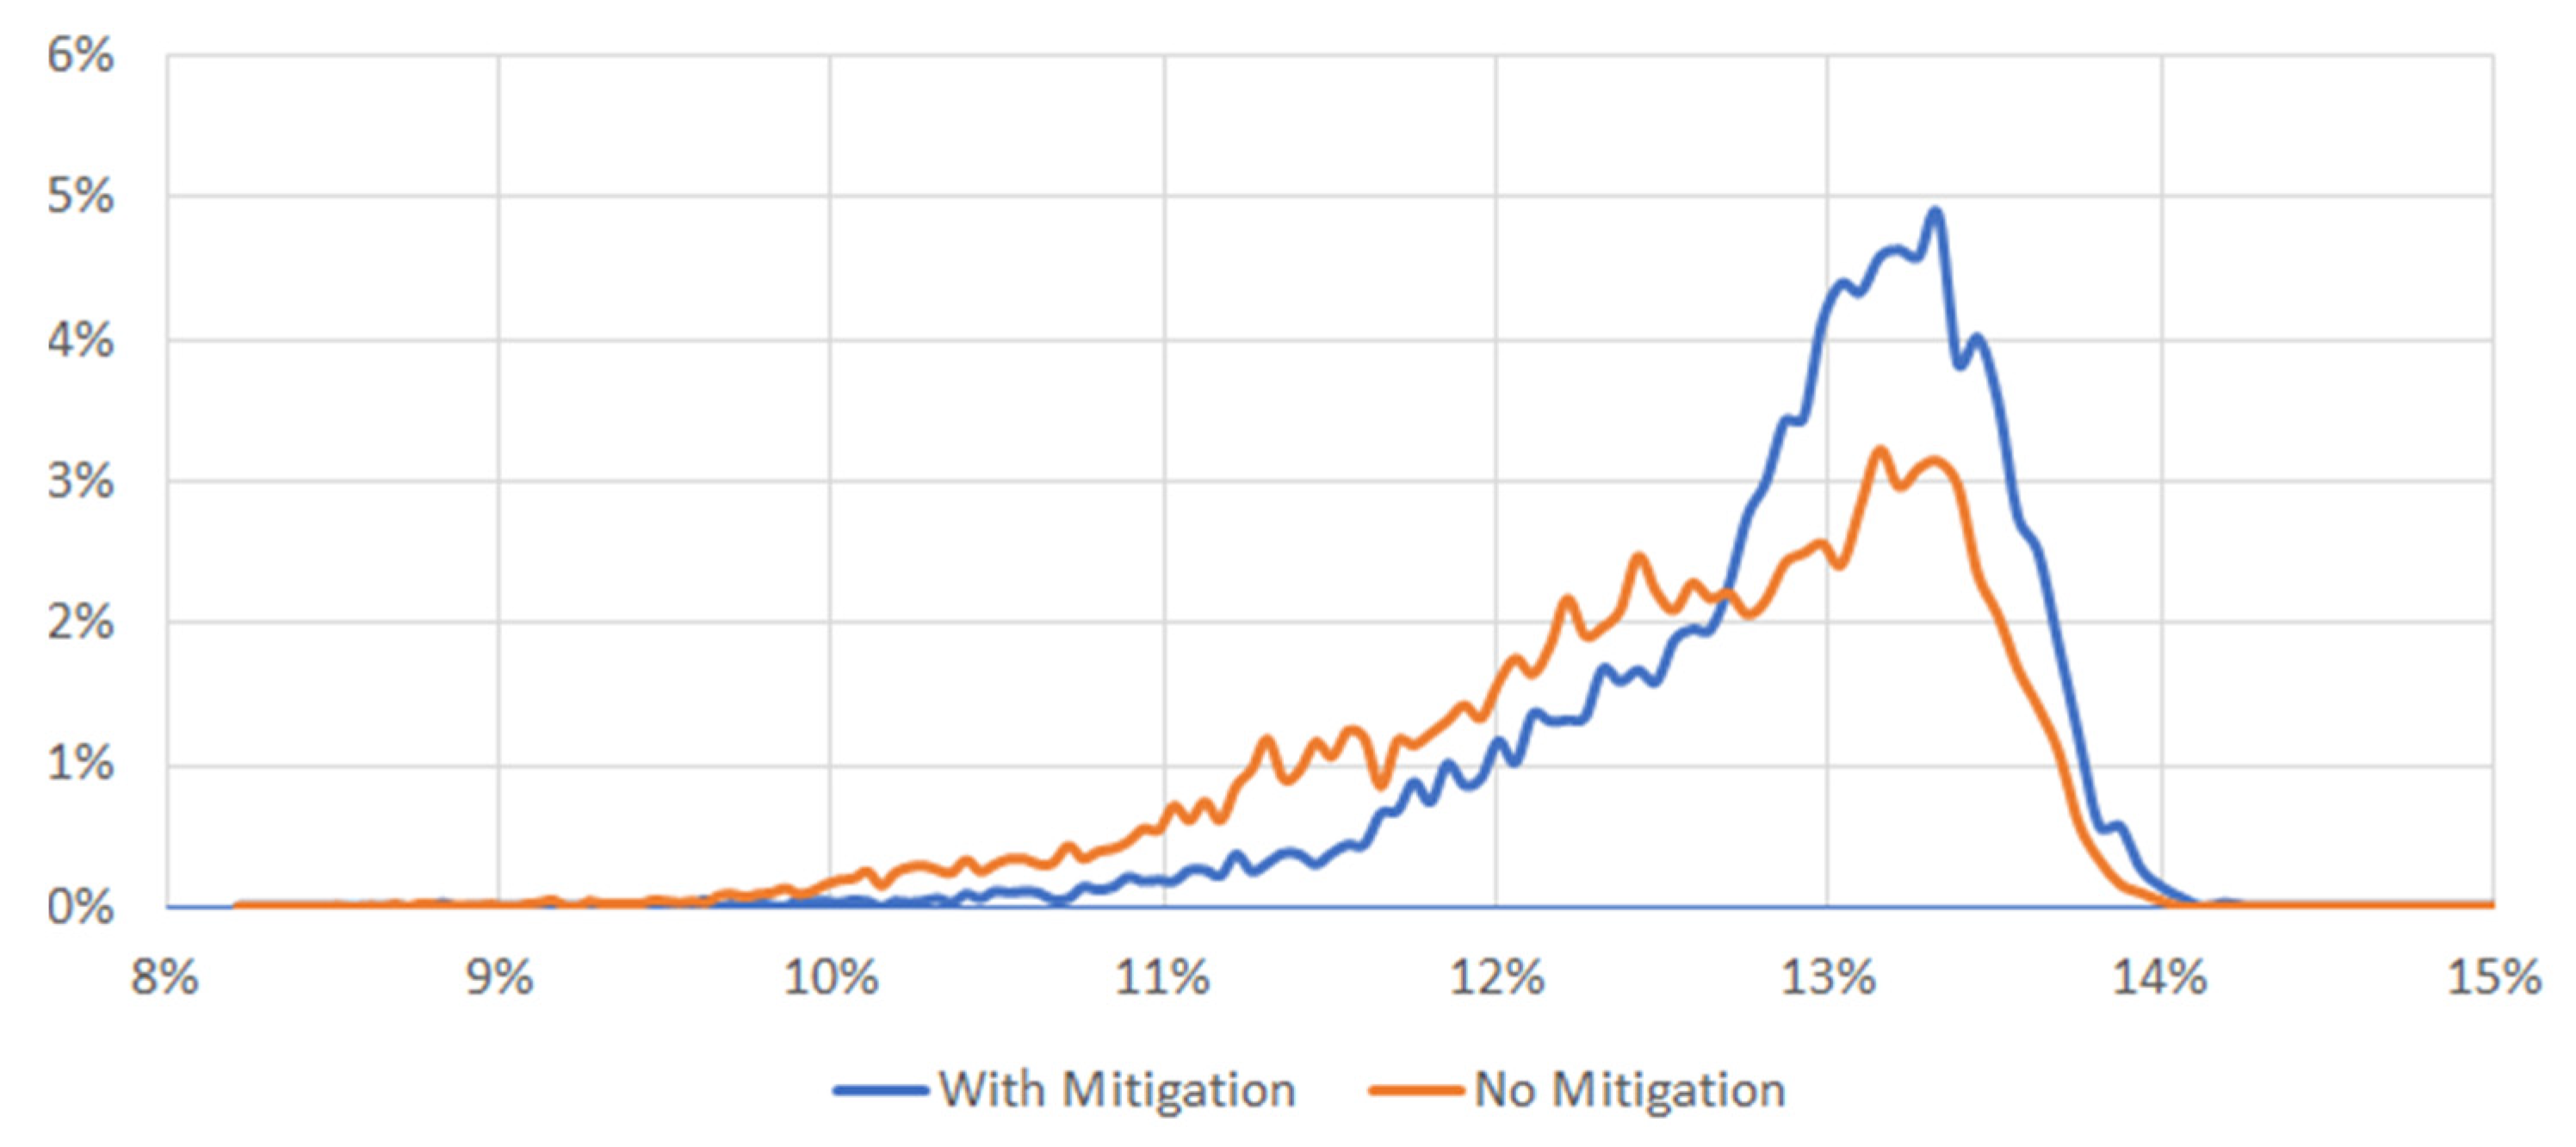
4.2. Financial Risk Associated to the Occurrence of Technical Risks in Window Substitution

As stated in Paragraph 3.2, the financial risk is assessed through the probability distribution of relevant financial KPIs as a consequence of the probability distribution of the technical risk factors affecting energy savings (energy gap) and investment cost (damage). The model also adds the effects of other risky variables affecting economic values of the investments, such as energy prices and climate (Heating Degree Days—HDD). The following figures show the results of the financial risk analysis, in terms of probability distribution of the Project Internal Rate of Return (IRR) (calculated on a 20-year time horizon), in the case of mitigation measures activation (Scenario 1). The orange line represents the probability distribution of the IRR considering only the risks related to the variation of energy prices and climate conditions (Figure 4). Since these two variables are assumed to be normally distributed with a mean of zero, the overall probability distribution of the IRR is also normally distributed, with a mean equal to the expected value. In this case, the distribution is quite narrow (concentrated between 12.8% and 13.7%, with a mean value of 13.3%), meaning that energy price and climate have little effect on overall financial KPIs. The blue line instead represents the probability distribution of the IRR considering all risks, including the technical ones. The inclusion of technical risks in the calculation makes the overall probability distribution wider (ranging from about 11% to about 14%) and, since the effects of the risky technical events always have negative impacts on cash flows, the mean of the distribution is moved to the left towards a lower value (about 12.9%).
The effect of the mitigation measures on the financial results are shown in Figure 5 and Figure 6. Since mitigation measures have a cost, not considering technical risk into impact calculation, would imply that the only effect on financial result is a translation of the probability distribution (in this case, of the IRR) towards left. This is mainly due to the higher investment cost, directly affecting the IRR of the project.
However, if technical risk variations due to mitigation measures are also taken into consideration in the calculation, then the overall impact of the mitigation measures themselves appears evidently. As shown in Figure 6, the inclusion of mitigation measure changes the shape of the probability distribution of Project IRR, moving the mass and the mean value of the distribution towards higher values (mean value shifting from 12.5% to 12.9%). This means that even if the mitigation measure increases the overall investment cost, their positive effect on the expected value of cash flows offset the higher cost, bringing an added value to the project in terms of lower riskiness and improved project quality.
Figure 7 shows the results of the two compared renovation scenarios as extracted from the platform, with technical and financial KPIs.

5. Discussion

The EEnvest—Risk reduction for building energy efficiency investments—project aims to develop a web-based investment evaluation platform for building owners and private investors. One which validates the investment security level of an energy renovation project for commercial buildings through a solid and structured assessment method. The EEnvest web-based investment platform will determine different risk levels analysing a series of economic indicators coming from technical and financial risk-evaluation models. In the following, findings on the effectiveness of technical and financial risk models will be presented.

5.1. Technical Risk

The technical risk connected to the building sector and in particular to the energy renovation processes is a complex theme because it includes a wide number of topics, issues and parameters, spanning from building physics to design, construction, and operation phase. The technical risks negatively affect the economic trend of the investment, producing some deviation from the expected business plan in terms of energy performance between predicted and real measurement of energy consumption or due to damages as failure, malfunctioning or breakages. Technical risk is considered “an exposure to loss arising from activities such as design and engineering, manufacturing, technological processes and test procedures”. This definition is based on a deep analysis of literature and results coming from field experiences, as well as knowledge of technical experts involved in the process. Currently there are several studies on identification of the “energy gap” [27] and related barriers to implementation of building energy-efficient technologies [28], analysis on the process used to determine the technical risks following a decomposition of the topic based on “project phases” [22] or in other cases on “building elements” [23] through an identification of Occurrence Frequency of Quality Failures. This kind of analysis takes steps from the investigation method developed to evaluate failure risks in the engineering sector, known as Failure Mode and Effect Analysis (FMEA) [29]. FMEA is a structured systematic procedure approach to identify the reliability, the safety and quality of specific components. FMEA method has been tested on an energy renovation measure, the insulation of an external wall, and the results obtained confirm the high complexity level of implementation for such method in failure analysis for buildings. Based on this evidence, EEnvest project extracts and builds on two aspects derived from the FMEA approach: (i) the failure concept, as one indicator of the technical risk, later called damage, and (ii) the systematic approach integrated in the technical risk evaluation process. Thanks to the latter, a deep work on definition of a technical risk database was started, and through a decomposition process of the building in elements, each energy renovation measure (building component) has been associated with its related problems (occurrences) with its unique effects (impacts-probability) and mitigation measures. Subsequently, the identification of the impact and probability of each occurrence has been addressed. The Analytic Hierarchy Process [30] has been implemented as a response measure to missing data in the process, which was a frequent case due to lack of dedicated literature in the field. The Analytic Hierarchy Process is a qualitative decision-making approach, which permits quantification of some issues, in our case technical risk frequency, through a risk score obtained from several opinions of experts in the building construction sector, and to classify the level of probability, based on design and construction best practices [31,32]. At the end of these considerations, technical risk assessment was developed using the International Organization for Standardization publication ISO 31,000 (2009)/ISO Guide 73:2002 that defines the risk as the “effect of uncertainty on objectives”. In this definition, uncertainties include events caused by ambiguity or a lack of information. The events could have both negative and positive impacts on the objectives. The formula adopted to calculate the risk is:
Risk = Probability ∗ Consequence (Impact)
where “probability” is the frequency of an event occurrence, times the “consequence” of this event, considered as the outcome of an event with a negative or a positive impact. The technical risk database (impact and probability) has been built through an extensive literature review, interviews to building experts manufacturers and building managers, and estimated by energy performance simulation.

5.2. Financial Risk

The proposed financial risk evaluation model is a tool that can support the decision-making process of an investment in energy efficiency.
In fact, one of the main issues in this sector, preventing large investments to be deployed by financial institutions, is the lack of necessary information to assess the actual riskiness of these projects. This is also stated as an assumption in the topic of the call for proposals under which the EEnvest project was financed: “the lack of statistical data on the actual energy and costs savings achieved by energy efficiency investment projects, as well as on payment default rates, results in financial institutions attributing high risk premiums to energy efficiency investments” [15]. With this in mind, and with the aim of providing a significant contribution to accelerating private finance to energy efficiency, in 2013 the European Commission established the Energy Efficiency Financial Institutions Group (EEFIG), featuring members from public and private financial institutions, industry representatives and sector experts. EEFIG’s activities brought to several results, such as the “EEFIG Underwriting tool” and the “De-Risking Energy Efficiency Platform (DEEP)”. The first of these is basically a walk-through guide to assess energy efficiency projects while the second is an open-source database for energy efficiency investments performance monitoring and benchmarking. Both tools are important sources for the evaluation of energy efficiency projects but require the investor to perform a very detailed analysis on the project (Underwriting tool) and then benchmarking it with the market (through the DEEP database). This may be the case of large-scale energy efficiency investments, where investors can afford to invest resources in technical and financial due-diligence, but is hardly applicable to small to medium-size investments (i.e., under 1 Mln Euro). The EEnvest model is an additional tool that will become available for financial institutions through a platform at the end of the project, complementing the existing ones with specific features. Though its approach is simplified and based on standard assumptions for the quantification of technical risks, its main advantage is that the user can have a quick and hands-on simulation and assessment of the project under evaluation. As it is standardized and only requires the user to fill in a list of technical and financial inputs, the model is suitable also for small-scale projects. As shown in Paragraph 4.2, the results of the calculations of the model provide a preliminary and rough estimate that give the user an overall idea about risk connected to the project, also as supporting tool for the decision to go or not with further analysis. A financial institution evaluating the project may still need further analysis based on internal models. Banks, in particular, will still likely build their evaluations on the creditworthiness of the borrower, without paying particular attention to the actual capacity of the project to generate savings/cash flows. In fact, the project financing principle that the loan is paid back by the cash flows generated by the project with limited recourse on the partners is only applied to large-scale projects where a Special Purpose Vehicle (SPV) is set up. However, the availability of more information about the technical and financial risk of a project may assure the lender about the quality and the financial sustainability of the investment project and lead to lower-risk premiums applied by financial institutions to the borrowers.

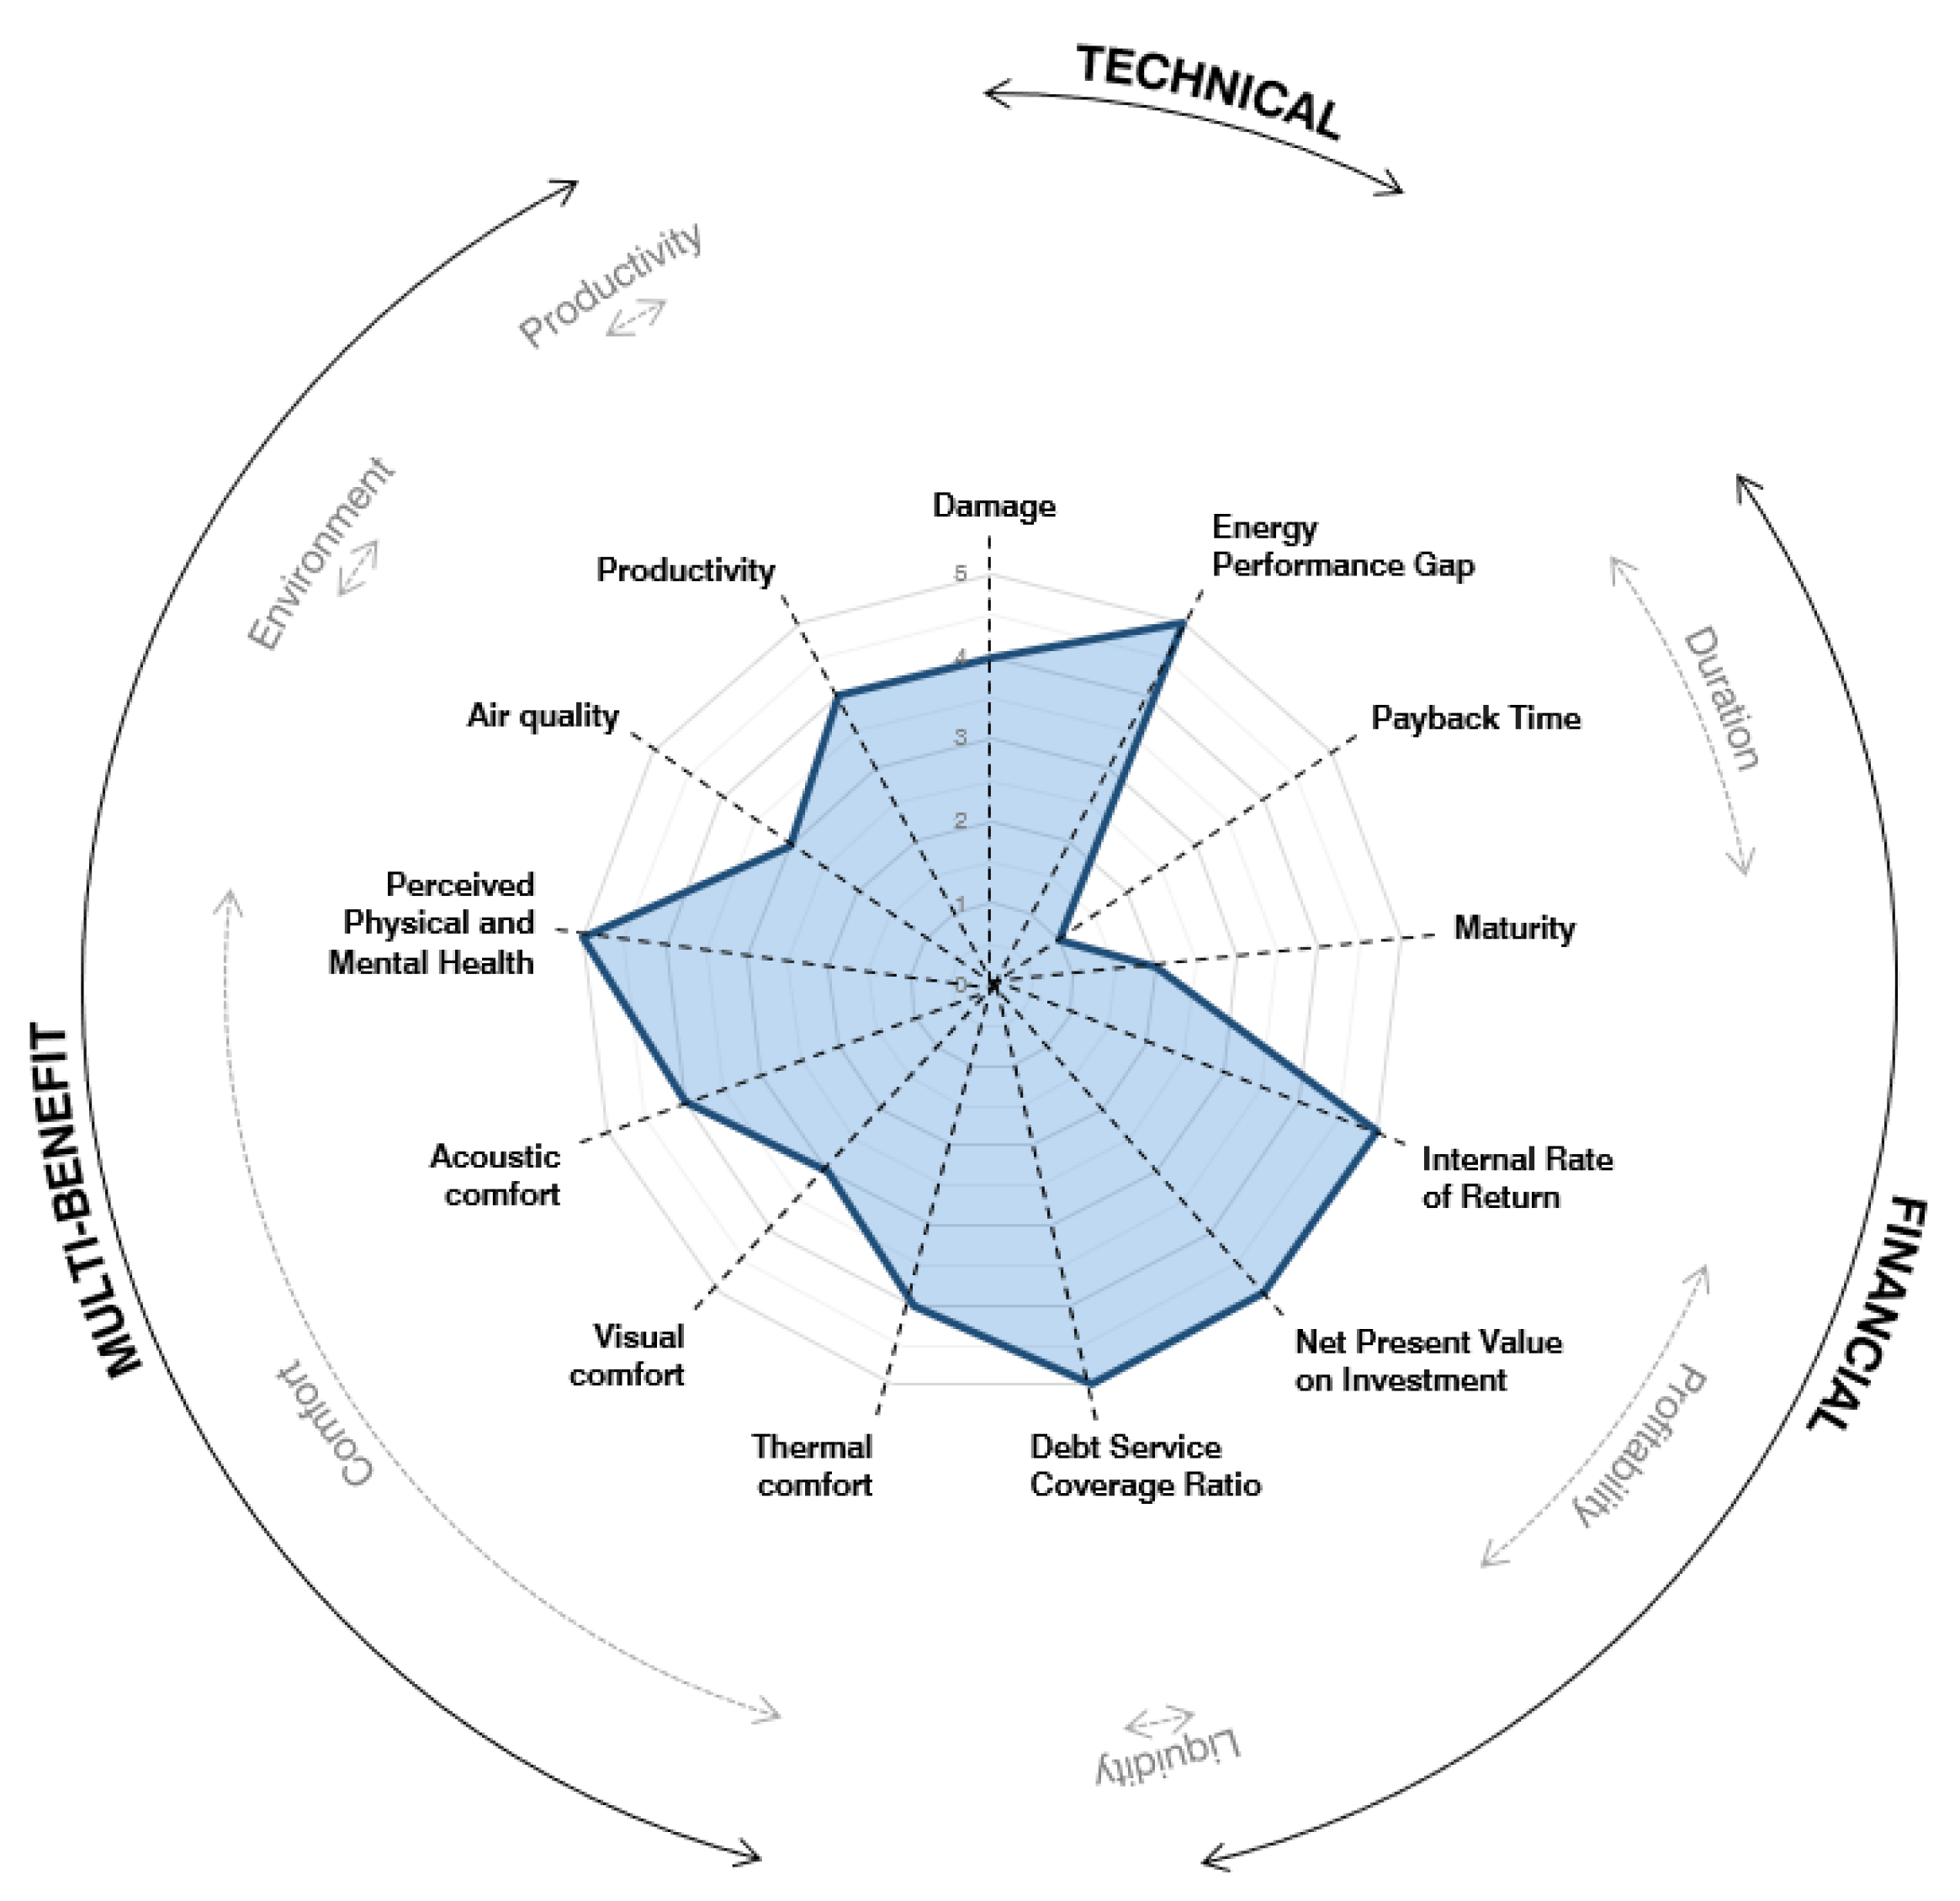
5.3. EEnvest Combined Evaluation and Progress against the State of the Art

As shown in Figure 8 the EEnvest vision includes multiple KPIs in a structured framework for technical, financial and multi-benefit evaluation. The approach promotes energy efficiency investments (increasing investors’ confidence) leveraging the use of solid knowledge based economic models for translating the building technical features into measurable risk indicators. The developed method is also supported by a clear and easy-to-read risk evaluation for a building’s energy efficiency throughout the web based EEnvest search and match platform. To date, there are no other web-based platforms that are able to provide investors and other relevant actors along the construction value-chain with a set of complete and solid technically grounded information on financial impacts foreseen by risk deriving from energy efficiency investments. The topic of technical risk evaluation is still rather unexplored, and the EEnvest project is aiming at enlarging its platform database in the months ahead.

6. Conclusions and Further Research

As the majority of building firms considers energy efficiency as moderately important in their general investment decisions and energy costs are affected by high uncertainty and thus not considered as important for adopting energy-efficiency investments, there is a need to mainstream private capital into the energy efficiency sector [33]. Whereas energy efficiency investments are usually expected to be paid back exclusively through the reduction of energy bills, there is increasing evidence that non-energy benefits play a key role in the decision to invest in energy efficiency. This includes, for instance, increased thermal comfort, reduced productivity cost, higher air quality level, lower vacancy rates etc. Quantifying non-energy benefits can show the financial possibilities of energy-efficient technologies and increase the probability of adopting these investments [34].
In this respect, this paper presented the current state of development for the EEnvest technical and financial risk evaluation model, and an approach that considers multiple driving factors such as financial-technical and non-energy benefits at the same time (the multi benefit KPI calculation is still under development and will be part of a future publication). The multi-variables approach goes beyond the established decision-making process based on a distinct evaluation of traditional indicators such as Net Present Value (NPV) or Payback time. To date, the assumptions of the technical and financial risk evaluation model have been successfully tested on a case study building located in Rome, which is part of the demonstration activities of the research project. Results show that accounting for context risks, such as energy price and climate variability, as well as technical risk, such as energy gap and damage, has an impact on project financials, such as IRR. For this reason, the authors believe that the model is a valuable instrument to support investors’ decision making when dealing with energy renovation of commercial office buildings. The EEnvest model is also being developed to enrich its current risk evaluation methodology with the impact of the so-called non-energy benefits, such as increased thermal comfort, reduced productivity cost, higher air quality level, lower vacancy rates. Further research will be focusing on quantifying the financial impact of such benefits, to integrate them in the model and enable more informed decisions by the community of investors, owners and tenants.
Currently, EEnvest platform is not online yet, as its database is still being populated and case studies are still being developed. However, the web-based search and match platform will be going live in 2022Q2 and be available for commercial use to all actors along the construction value chain.

Author Contributions

Data curation, G.F., L.T. and G.P.; formal analysis, G.F. and L.T.; funding acquisition, A.A.; investigation, A.A., G.S. and G.P.; methodology, A.A., G.S. and G.P.; project administration, A.A.; resources, G.S., G.F. and L.T.; supervision, A.A. and G.S.; writing—original draft, G.P.; writing—review & editing, A.A., G.S., G.F., L.T. and G.P. All authors have read and agreed to the published version of the manuscript.

Funding

The work is part of the research project EEnvest, funded by the Horizon 2020 research and innovation program of the European Union, Grant N. 833112.

Institutional Review Board Statement

Not applicable.

Informed Consent Statement

Not applicable.

Data Availability Statement

Not applicable.

Acknowledgments

Authors kindly acknowledge Prelios Integra S.p.A. for providing data about the case study office building described in this paper and investing time in testing and validating the EEnvest risk model. In particular, we offer heartfelt thanks to Sara Canepa for being such an enthusiastic and forward-thinking contributor to such an ambitious project. The authors would also like to thank Diego Tamburrini, Federico Garzia, and Martino Gubert for support for the technical risk database development, and Ulrich Filippi Oberegger and Adalberto Guerra Cabrera for support in the probabilistic trend of Monte Carlo simulation. Authors also kindly acknowledge Marta Maria Sesana and Diletta Brutti for supporting the execution of several activities within the frame of technical-financial risk model development.

Conflicts of Interest

The authors declare no conflict of interest.

Abbreviations

KPIKey Performance Indicators
ECEuropean Commission
EUEuropean Union
ISOInternational Standard Organization
EPCEnergy Performance Certificates or Contracts
IFADInternational Fund for Agricultural Development
UNUnited Nations
LEED EB:O&MLeadership in Energy and Environmental Design certification for Existing Buildings: Operations and Maintenance
LEEDLeadership in Energy and Environmental Design
USGBCUnited States Green Building Council
HDDHeating Degree Days
IRRInternal Rate of Return
FMEAFailure Mode and Effect Analysis
SPVSpecial Purpose Vehicle
NPVNet Present Value

References

  1. European Parliament. Directive (EU) 2018/2002 of the European Parliament and of the Council of 11 December 2018 Amending Directive 2012/27/EU on Energy Efficiency, Official Journal of the European Union. Available online: https://eur-lex.europa.eu/legal-content/EN/TXT/HTML/?uri=CELEX:32018L2002&from=EN (accessed on 28 December 2021).
  2. European Parliament. Directive (EU) 2018/2001 of the European Parliament and of the Council of 11 December 2018 on the Promotion of the Use of Energy from Renewable Sources, Official Journal of the European Union. Available online: https://eur-lex.europa.eu/legal-content/EN/TXT/HTML/?uri=CELEX:32018L2001&from=EN (accessed on 28 December 2021).
  3. BPIE—Building Performance Institute Europe Renovating the EU Building Stock. Available online: http://bpie.eu/focus-areas/renovating-the-eu-building-stock (accessed on 28 December 2021).
  4. EURIMA Deep Renovation. Available online: https://www.eurima.org/energy-efficiency-in-buildings/deep-renovation.html (accessed on 28 December 2021).
  5. BPIE—Building Performance Institute Europe. 97% of Buildings in the EU Need to Be Upgraded. 2019. Available online: http://bpie.eu/wp-content/uploads/2017/12/State-of-the-building-stock-briefing_Dic6.pdf (accessed on 28 December 2021).
  6. Billio, M.; Costola, M.; Hristova, I.; Pelizzon, L. Final Report on Correlation Analysis between Energy Efficiency and Risk (D5.7); Energy efficiency Data Protocol and Portal: Bruseel, Belgium, 2020. [Google Scholar]
  7. Loureiro, T.; Gil, M.; Desmaris, R.; Andaloro, A.; Karakosta, C.; Plesser, S. De-Risking Energy Efficiency Investments through Innovation. Proceedings 2020, 65, 3. [Google Scholar] [CrossRef]
  8. Wiguna, I.P.A.; Scott, S. Nature of the critical risk factors affecting project performance in Indonesian building contracts, Association of Researchers in Construction Management. In Proceedings of the 21st Annual ARCOM Conference, London, UK, 7–9 September 2005. [Google Scholar]
  9. ISO—The International Organization for Standardization. ISO 31000:2009-Risk Management-Principles and Guidelines; ISO 310002009; ISO—The International Organization for Standardization: Geneva, Switzerland, 2009. [Google Scholar]
  10. Turner, C.; Analyst, S.; Frankel, M. Energy Performance of LEED® for New Construction Buildings; New Buildings Institute: White Salmon, WA, USA, 2008. [Google Scholar]
  11. Carbon Trust. Closing the Gap: Lessons Learned on Realizing the Potential of Low Carbon Building Design Sharing; Carbon Trust: London, UK, 2011. [Google Scholar]
  12. Zero Carbon Hub. A Review of the Modelling Tools and Assumptions: Topic 4, Closing the Gap between Designed and Built Performance; Zero Carbon Hub: London, UK, 2010. [Google Scholar]
  13. Menezes, A.C.; Cripps, A.; Bouchlaghem, D.; Buswell, R. Predicted vs. actual energy performance of non-domestic buildings: Using post-occupancy evaluation data to reduce the performance. Gap. Appl. Energy 2012, 97, 355–364. [Google Scholar] [CrossRef] [Green Version]
  14. Douglas, J.; Ransom, B. Understanding Building Failures, 3rd ed.; Taylor & Francis Group: Oxfordshire, UK, 2007. [Google Scholar]
  15. European Commission. Financing for Energy Efficiency Investments—Smart Finance for Smart Buildings. 2020. Available online: https://ec.europa.eu/info/funding-tenders/opportunities/portal/screen/opportunities/topic-details/lc-sc3-b4e-11-2020 (accessed on 28 December 2021).
  16. Ankamah-Yeboah, I.; Rehdanz, K. Explaining the Variation in the Value of Building Energy Efficiency Certificates: A Quantitative Meta-Analysis; Kiel Institute for the World Economy (IfW): Kiel, Germany, 2014. [Google Scholar]
  17. Ayikoe Tettey, U.Y.; Gustavsson, L. Energy savings and overheating risk of deep energy renovation of a multi-storey residential building in a cold climate under climate change. Energy 2020, 202, 117578. [Google Scholar] [CrossRef]
  18. Semprini, G.; Gulli, R.; Ferrante, A. Deep regeneration vs. shallow renovation to achieve nearly Zero Energy in existing buildings: Energy saving and economic impact of design solutions in the housing stock of Bologna. Energy Build. 2017, 156, 327–342. [Google Scholar] [CrossRef]
  19. Krizmane, M.; Borodinecs, A.; Dzelzitis, E. Enabling the Landscape for Deep Green Renovations. Energy Procedia 2016, 96, 404–412. [Google Scholar] [CrossRef] [Green Version]
  20. Energy Efficient Mortgages Initiative. Energy Efficient Mortgages Initiative (EEMI): EeDaPP Confirms Negative Correlation Between Energy Efficiency and Risk (Press Release), Brussel, 31 August 2020. Available online: https://www.energy-efficient-mortgage-label.org/open-file/3/Energy-Efficient-Mortgages-Initiative-EEMI-EeDaPP-confirms-negative-correlation-between-energy-efficiency-and-risk (accessed on 28 December 2021).
  21. International Partnership for Energy Efficiency Cooperation (IPEEC). Building Energy Performance Gap Issues. An International Review. 2019. Available online: https://www.energy.gov.au/sites/default/files/the_building_energy_performance_gap-an_international_review-december_2019.pdf (accessed on 28 December 2021).
  22. Van Dronkelaar, C.; Dowson, M.; Burman, E.; Spataru, C.; Mumovic, D. A Review of the Regulatory Energy Performance Gap and Its Underlying Causes in Non-domestic Buildings. Front. Mech. Eng. 2016, 1, 17. [Google Scholar] [CrossRef] [Green Version]
  23. Qi, Y.; Qian, Q.K.; Meijer, F.M.; Visscher, H.J. Identification of Quality Failures in Building Energy Renovation Projects in Northern China. Sustainability 2019, 11, 4203. [Google Scholar] [CrossRef] [Green Version]
  24. Grillone, B.; Mor, G.; Danov, S.; Cipriano, J.; Lazzari, F.; Sumper, A. Baseline Energy Use Modeling and Characterization in Tertiary Buildings Using an Interpretable Bayesian Linear Regression. Methodol. Energ. 2021, 14, 5556. [Google Scholar] [CrossRef]
  25. Cuerda, E.; Guerra-Santin, O.; Sendra, J.J.; Neila, F.J. Understanding the performance gap in energy retrofitting: Measured input data for adjusting building simulation models. Energy Build 2020, 209, 109688. [Google Scholar] [CrossRef]
  26. Jackson, J. Energy Budgets at Risk (EBaR): A Risk Management Approach to Energy Purchase and Efficiency Choices; John Wiley & Sons, Inc.: Hoboken, NJ, USA, 2008. [Google Scholar]
  27. Mahdavinejad, M.; Silvayeh, S.; Nourian, Y. Review on Shifting to Energy Efficiency in Recent Architectural Studies in Iran. Arman Archit. Urban Dev. 2017, 10, 69–77. [Google Scholar]
  28. Cristino, T.M.; Lotufo, F.A.; Delinchant, B.; Wurtz, F.; Faria Neto, A. A comprehensive review of obstacles and drivers to building energy-saving technologies and their association with research themes, types of buildings, and geographic regions. Renew. Sustain. Energy Rev. 2021, 135, 110191. [Google Scholar] [CrossRef]
  29. Mecca, S.; Masera, M. Technical risk analysis in construction by means of FMEA methodology. Liverp. John Moores Univ. Assoc. Res. Constr. Manag. 1999, 2, 425–434. [Google Scholar]
  30. Saaty, R.W. The analytic hierarchy process-what it is and how it is used. Math. Model. 1987, 9, 3–5. [Google Scholar] [CrossRef] [Green Version]
  31. Roberti, F.; Oberegger, U.F.; Lucchi, E.; Troi, A. Energy retrofit and conservation of a historic building using multi-objective optimization and an analytic hierarchy process. Energy Build 2017, 138, 1–10. [Google Scholar] [CrossRef]
  32. Andaloro, A.; Paoletti, G.; Garzia, F.; Gubert, M.; Oberegger, U.F. Report on Technical Risks in Renovation (D2.1). 2020. Available online: http://www.EEnvest.eu/wp-content/uploads/2021/09/EEnvest_D2.1_FINAL.pdf (accessed on 28 December 2021).
  33. De Groot, H.L.F.; Verhoef, E.T.; Nijkamp, P. Energy saving by firms: Decision-making, barriers and policies. Energy Econ. 2001, 23, 717–740. [Google Scholar] [CrossRef] [Green Version]
  34. Rasmussen, J. Energy-efficiency investments and the concepts of non-energy benefits and investment behaviour. ECEEE Ind. Summer Study Proc. 2014, 2, 733–744. [Google Scholar]
Figure 1. Overview of technical risk process assessment in EEnvest platform.
Sustainability 14 01011 g001
Figure 2. Definition of the radar graph with comprehensive view of the KPIs.
Sustainability 14 01011 g002
Figure 3. Likert scale applied to the selected KPIs.
Sustainability 14 01011 g003
Figure 4. Project IRR distribution, considering all risks (blue line) and without technical risks (orange line)—Scenario 1.
Sustainability 14 01011 g004
Figure 5. Project IRR distribution, excluding technical risk, in the case of mitigation measures (blue line) and without mitigation measures (orange line).
Sustainability 14 01011 g005
Figure 6. Project IRR distribution, including mitigation measures (blue line) and without mitigation measures (orange line).
Sustainability 14 01011 g006
Figure 7. Results of the two scenarios of the technical and financial KPIs on the radar graph.
Sustainability 14 01011 g007
Figure 8. Full implementation of different EEnvest KPIs (e.g., multi-benefit) on the radar graph.
Sustainability 14 01011 g008
Table 1. Technical risk key performance indicators with relative scale of evaluation.
Indicators CodeScale 1
DamageDamage indicator quantifies the investment deviation due to possible malfunctioning or failures of the energy renovation measures adopted in the renovation project.T.11. D > 3%
2. 2% < D < 3%
3. 1% < D < 2%
4. 0.5% < D < 1%
5. D < 0.5%
Energy
performance gap
Energy gap indicator quantifies the energy performance deviationT.21. EPG > 10%
2. 5% < EPG < 10%
3. 2% < EPG < 5%
4. 1% < EPG < 2%
5. EPG < 1%
1 As previously mentioned in Section 3.1, the two technical risk KPIs are expressed and evaluated as a percentage of the investment (%), but subsequently converted also in a monetary value (€) in order to make them easier to understand.
Table 2. Financial risk key performance indicators with relative scale of evaluation.
Indicators CodeScale
Payback timePayback time is the amount of time that the investment will take to recover the initial cost, when the length of the investment time reaches a breakeven point.F.11. PT > 12 y
2. 10 y < PT < 12 y
3. 7 y < PT < 10 y
4. 5 y < PT < 7 y
5. PT < 5 y
MaturityMaturity is defined as the total duration of the project needed to achieve a zero NPV (IRR equal to cost of capital).F.21. M > 25 y
2. 20 y < M < 25 y
3. 15 y < M < 20 y
4. 10 y < M < 15 y
5. M < 10 y
Internal Rate of ReturnInternal Rate of Return (IRR) is the discount rate that makes the net present value (NPV) of a specific project equal to zero.F.31. IRR < 2%
2. 2% < IRR < 4%
3. 4% < IRR < 6%
4. 6% < IRR < 10%
5. IRR > 10%
Net Present Value on InvestmentNet Present Value (NPV) is the value of all future cash flows (positive and negative) over the entire life of an investment discounted to the present.
The NPV/investment ratio gives a measure of profitability of the project.
F.41. NPV < 10%
2. 10% < NPV < 20%
3. 20% < NPV < 30%
4. 30% < NPV < 40%
5. NPV > 40%
Debt–Service Coverage RatioDebt–Service Coverage Ratio (DSCR) is an indicator of the project’s ability to repay a debt. It is calculated as the ratio between the operative cash flows generated by the project and the cash flows for debt, lease or other obligations (debt service, both for interests and principal payment) due in one year.F.51. DSCR < 1.1
2. 1.1 < DSCR < 1.2
3. 1.2 < DSCR < 1.3
4. 1.3 < DSCR < 1.4
5. DSCR > 1.4
Table 3. General data of the case study.
General Project Data
Building Use/TypologyOffice
Building construction year2001
Building renovation year2019
Net Floor Area NFA24,470 m2
Net Volume NV97,000 m3
Heating Degree Days (20 °C)1415
Table 4. IFAD building baseline energy consumption and costs before the renovation.
BaselineEnergy Consumption *Costs
Natural gas1,468,243 kWh/a49,920 €
Electricity3,286,000 kWh/a420,608 €
Energy consumption total. annual 470,528 €
O&M cost ** 316,162 €
Total. Annual
(Energy consumption + O&M)
786,690 €
* Average annual energy consumption of natural gas/electricity of the last 3 years (2016–2019). For electric energy, in case of existing renewable energy plants (i.e., PV) or cogeneration plants, this only considers the energy bought from the grid and not self-consumption. ** Total cost of maintenance: contracts + operations + replaced/substituted materials.
Table 5. Renovation measures for the IFAD office building.
Building ServicesCosts
Heating SystemHeat Pump (water)190,000 €
Distribution systemCompleted for pipes, fittings/valves/circulators/expansion vessel37,000 €
Mechanical ventilation system (VMC)VMC
(Air handler/Ventilation duct/Built-in components/Outlets/diffuser)
112,500 €
Lights typeLow power consumption lights, LED403,787 €
Building Energy Management System (BEMS)BEMS project by an expert certified
UNI-EN 15232
190,000 €
Building automation system of:
Lighting
Thermal system (heating and cooling)
Monitoring system of energy consumption
Photovoltaic systemProduction: 43,200 kWh/year
PV Installed: 38 kWp
156,731 €
Other costs for the projects, management, experts, administrative procedures, mitigation measures, etc. 215,991 €
Total investment (VAT excluded) 1,306,009 €
Table 6. IFAD building post-renovation energy consumption and costs.
Renovation ScenarioEnergy Consumption *Costs
Natural gas1,890,243 kWh/a64,268 €
Electricity1,806,000 kWh/a231,168 €
Energy consumption total. annual 295,436 €
O&M costs ** 316,162 €
Total. Annual (Energy consumption + O&M) 611,598 €
* Average annual energy consumption of natural gas/electricity of the last 3 years (2016–2019). For electric energy, in case of existing renewable energy plants (i.e., PV) or co-generation plants, this only considers the energy bought from the grid and not self-consumption. ** Total cost of maintenance: contracts + operations + replaced/substituted materials.
Table 7. General data of the case study.
Renovation ProjectRenovation MeasuresMitigation MeasuresCosts of Energy SavingsInvestmentPayback Time
(€)(%)(€)(Year)
SCENARIO 1Heating, cooling, ventilation,
lighting system
LEED,
Energy
performance monitoring
175,092 €37%1,306,009 €7.46
SCENARIO 2Heating, cooling, ventilation,
lighting system
-175,092 €37%1,270,862 €7.26
Table 8. Results of technical risk impacts of IFAD building for two different scenarios.
DamageEnergy Performance Gap Payback timewith Technical Risks
Increased Investment Increase of Energy Cost
% % (Year)
SCENARIO 13982 € 0.30% 3073 € 1.04% 7.57
SCENARIO 27762 € 0.61% 7422 € 2.51% 7.74
Publisher’s Note: MDPI stays neutral with regard to jurisdictional claims in published maps and institutional affiliations.

