1. Introduction
In Europe, buildings are responsible for ~40% of energy consumption and 36% of CO
2 emissions [
1]. In line with the Paris Agreement objectives [
2], the EU long-term strategic plan considers possible paths to accelerate the transition towards a climate-neutral built environment by 2050. One of these paths is based on net-positive approaches [
3]. Such positive approaches involve buildings, building blocks and districts, introducing new design considerations and possibilities [
4,
5] based on advanced managerial and energy technology [
6].
It is expected that the development of net-positive approaches will involve existing buildings and their urban patterns rather than new buildings, since the number of new buildings is extremely undersized to affect energy consumption trends on short–medium terms [
7]. However, the concept of effective retrofitting strategies for net-positive approaches is crucial, since most of the existing building stock is characterized by low energy efficiency [
8] and socio-technical implications [
9].
Furthermore, net-positive approaches are also related to a high degree of penetration of renewable energy sources (RES) within urban patterns, involving the re-definition of the flexibility concept [
10]. Flexibility has been a concept mainly related to energy exchange management with a specific focus on energy market rules [
11]. Now, net-positive approaches require an extension of the flexibility concept, including the spatial and managerial organisation of the energy network composed of an aggregation of buildings [
4]. Thus, flexibility is expected to be a parameter to assess the extent to which an urban pattern can afford a net-positive approach. Furthermore, net-positive approaches call for synchronising energy retrofit strategies and RES integration, taking a cluster of buildings into account rather than at the building level [
12].
Therefore, in preparation for further analysis of positive energy approaches, this paper focuses on a Positive Energy Block (PEBlock), which is an emergent paradigm in Europe [
13]. The assumption is that PEBlockis a feasible and reliable new form of infrastructure to synchronise social and technical transformations. However, the organization of an energy infrastructure based on a new generation of buildings requires profound innovations from architectural, planning and construction points of view [
14]. Indeed, the organisation of a PEBlock as a socio-technical system advocates the integration of a multitude of criteria. These criteria not only come from different silos, but they are also highly variable, depending on the level of detail and the level of information locally available.
Thus, it can be difficult for decision-makers to choose between the numerous retrofit and RES integration options available in this scenario. For this reason, an adaptable model that allows stakeholders and decision-makers to manage possible solutions efficiently is needed.
In this regard, multi-criteria analysis (MCA) is a proper approach that can help produce better decisions [
15]. It is based on a wide range of approaches, which allow decision-makers to combine the data available and their subjective preferences in an organized way [
16]. In addition, it evaluates a well-defined number of possibilities applied in combination with specific scenarios, establishing a foundation for making well-informed decisions [
17].
Several studies explored the applications of multi-criteria analysis in sustainable energy planning, focusing on energy transition [
18,
19,
20,
21,
22,
23,
24] characterized by a set of conflicting parameters [
25]. For example, Connolly et al. [
19] reviewed approaches for evaluating the integration of renewable energy into urban planning practices. However, the authors stressed that these evaluations traditionally were focused on large-scale applications (i.e., country and regional scale). Other studies took into account district-scale analysis [
20,
21].
However, district-scale studies focused on sectorial aspects of the energy transition, such as the evaluation of different electricity production scenarios [
22], emission reduction targets [
23] and the integration of renewable energy mix [
26,
27]. About the sectorial aspects, Lund et al. [
24] highlighted the relevance of multi-criteria decision making optimisation for integrating synergies between sectors in organising smart energy systems at the local level. However, this study mainly refers to the concept of district heating. In addition, Höfer and Madlener [
18] individuated a challenging situation in the fact that different stakeholders have diverging interests and opinions on how the energy transformation should take place. The authors stressed the usability of a decision making optimisation framework to discuss with stakeholders about indicators and alter them if requested.
From these studies, socio-technical difficulties for decision-makers to evaluate potential energy transition scenarios emerge. It appears essential to develop a methodology focused on transforming existing buildings into positive ones, supported by MCA to make the approach scalable and replicable. This is particularly true in the case of the PEBlock, since its properties and functionalities have not been codified yet. At our current knowledge, there are no studies concerning a multi-criteria decision making optimisation in the realm of PEBlocks.
Therefore, without the presumption to reveal all properties and functionalities concerning PEBlocks, it would be interesting to explore PEBlocks’ organisation procedures, taking into account the level of detail and information available (i.e., levels of uncertainty). The Preference Ranking Organisation Method for Enrichment Evaluation (PROMETHEE) is a possible solution to manage this exploration. This methodology can be used to find the best alternative based on assessing specified criteria within a pre-determined scenario [
28].
Thus, this study proposes an approach to identify a sequence of phases that provide a concise and quantitative pre-assessment of the theoretical flexibility of a building block to act as an energy net component. These phases are planned to be managed within an optimisation procedure, which quantifies various flexibility metrics, such as energy consumption and production targets, energy balance constraints at the building level and positive energy block scenarios, taking into account different levels of information and detail. This multi-criteria decision making optimisation framework for PEBlocks for cities is offered as a contribution to operationalise PEBlocks according to a new generation of urban planning practices and buildings. It invites scholars to think about a new set of criteria that can drive the innovation in planning practices and approval processes, promoting PEBlocks as a common practice. This paper is the first contribution in this direction, developing and testing a workflow structure to transform a group of three buildings in a PEBlock.
The paper is organised as follows: the next section reviews the concept of PEBlock;
Section 2 describes the workflow structure and its application through a case study; then,
Section 3 presents the main results from a multi-criteria decision making optimisation framework for PEBlocks; finally,
Section 4 discusses PEBlock features, stressing implications and pointing out some limitations and future research.
Positive Energy Block
The first definition of aPEBlock was provided under Horizon 2020. Itis described as a group of at least three connected neighbouring buildings producing more energy yearly than they consume [
29]. As reported by the Strategic Energy Technology (SET) Plan, a PEBlock can be considered the smallest component of a Positive Energy District (PED), which is described as a well-defined urban area in which a group of different building typologies actively manage the energy flow between them in order to achieve an annual positive energy balance [
3].
Therefore, both PEBlock and PED concepts are focused on net-positive approaches, which involve re-thinking buildings as energy service [
30]. In this regard, Cole [
31] suggested moving the debate from defining energy-positive buildings to defining energy-positive building contexts to add an ecological perspective to the energy transition. Similarly, Sibilla and Kurul [
32] emphasised the key role of buildings and their surroundings as components of a distributed renewable and interactive energy system as an opportunity to re-introduce the local geographical conditions in designing buildings and cities. In addition, Kolokotsa et al. [
33] pointed out that the successful implementation of positive energy buildings requires thermal simulation models integrated with intelligent sensors, enabling interacting in real-time to support new functionalities (e.g., energy exchanges). However, although it is expected that interactivity will bring significant advancement in positive approaches, the diffusion of sensors at the district scale is rare.
Furthermore, several studies have embraced net-positive approaches at the district scale. For example, Bossi et al. [
34] collected energy transition urban practices across Europe based on the concept of PEDs. The authors pointed out that at the early implementation stages, the actual feasibility of many PEDs is not yet measurable. They stressed the need for an open framework to facilitate the comparison of the results achieved so far to emphasise local differences and diverse approaches in defining PEBlocks/PEDs. In this direction, Alpagut et al. [
35] developed a methodology to improve the scalability of PEDs at the local level. The proposed methodology combines district and city scales, including technical and non-technical parameters, to select a range of appropriate technologies for a specific urban area. However, this methodology was carried out at the feasibility study level. Thus, a procedure to transform buildings into new energy network components was not investigated. Sibilla and Kurul [
36] investigated this through a procedure to define a hierarchical organisation of positive, neutral and passive nodes of a distributed renewable and interactive energy infrastructure as a form of PEBlock. However, the authors proposed a simplified procedure based on solar access assessment that failed to consider other relevant parameters, such as building energy consumption. By contrast, the study elaborated by Sougkakis et al. [
37] was based on building energy consumption, exploring energy retrofit strategies at the district level to reduce energy demand and promote positive energy communities. The authors stressed that moving from building to district level is an opportunity to engage local communities in the process of transition. However, further studies are needed to establish suitable socio-technical criteria and appropriate methods at the building block scale.
Regarding these methods, Hyytinen and Toivonen [
38] investigated the concept of flexibility and its relationships to net-positive approaches. However, the authors stressed that innovation management practices should be developed in future energy services at the local level to operationalise an energy system based on buildings’ nets. Rehman et al. [
39] tested a multi-objective optimisation approach in organising a PED. However, this study is focused on a flexible combination of solar and wind installations to achieve positive energy production in a specific climate situation. In this study, the role of energy retrofit and the RES integration feasibility were not considered.
Furthermore, Good et al. [
40] contributed to defining a smart district, posing a set of questions about how technologies may be optimally exploited and how optimisation should be carried out across time and space. However, this study is focused on flexibility in future energy systems to establish rules for energy markets. Ala-Juusela et al. [
41] proposed key performance indicators for PEDs. They developed a decision support tool designed to evaluate the energy positivity level of neighbourhoods. However, the indicators for measuring energy positivity need further work in relation to targets and threshold values concerning the dimension and typology of a block.
Therefore, what emerges is that transforming an existing building block into a positive one is a complex process, requiring a dedicated approach to manage the progress of a block toward becoming energy positive. In addition, metrics and tools to quantify the energy positivity level are open issues. Therefore, managing flexibility to achieve a net-positive balance needs an adaptable approach related to the level of detail and level of information locally available.
2. Materials and Methods
The method adopted to explore positive energy scenarios concerning a group of three buildings in a PEBlock was based on PROMETHEE procedure. This procedure was adopted for its simplicity in establishing weights for each criterion. In addition, it allowed us to offer the optimisation framework as an open-ended structure, becoming a platform to discuss with stakeholders how to optimise energy retrofit strategy and RES integration, considering that a group of buildings can act as a whole.
In order to develop and test a workflow structure to organise a PEBlock, this study developed a building model based on the variability of the level of detail and informationconcerning various building components. These components include the opaque construction systems’ thermal properties, BIPV system performance and heating demand. Similar to prior studies [
42,
43,
44], varying the levels of detail (LoD) and information (LoI) is possible to explore the relationships between single building components and the whole system. By doing so, this approach allows decision-makers to provide evidence about the simplifications adopted, planning decisions and future model improvements accordingly.
The next section illustrates the workflow structure, stressing the procedure’s key elements. It deals with developing amulti-criteria decision making optimisation framework and a description of the framework’s components involved. Then, a case study is described.
2.1. Workflow Structure
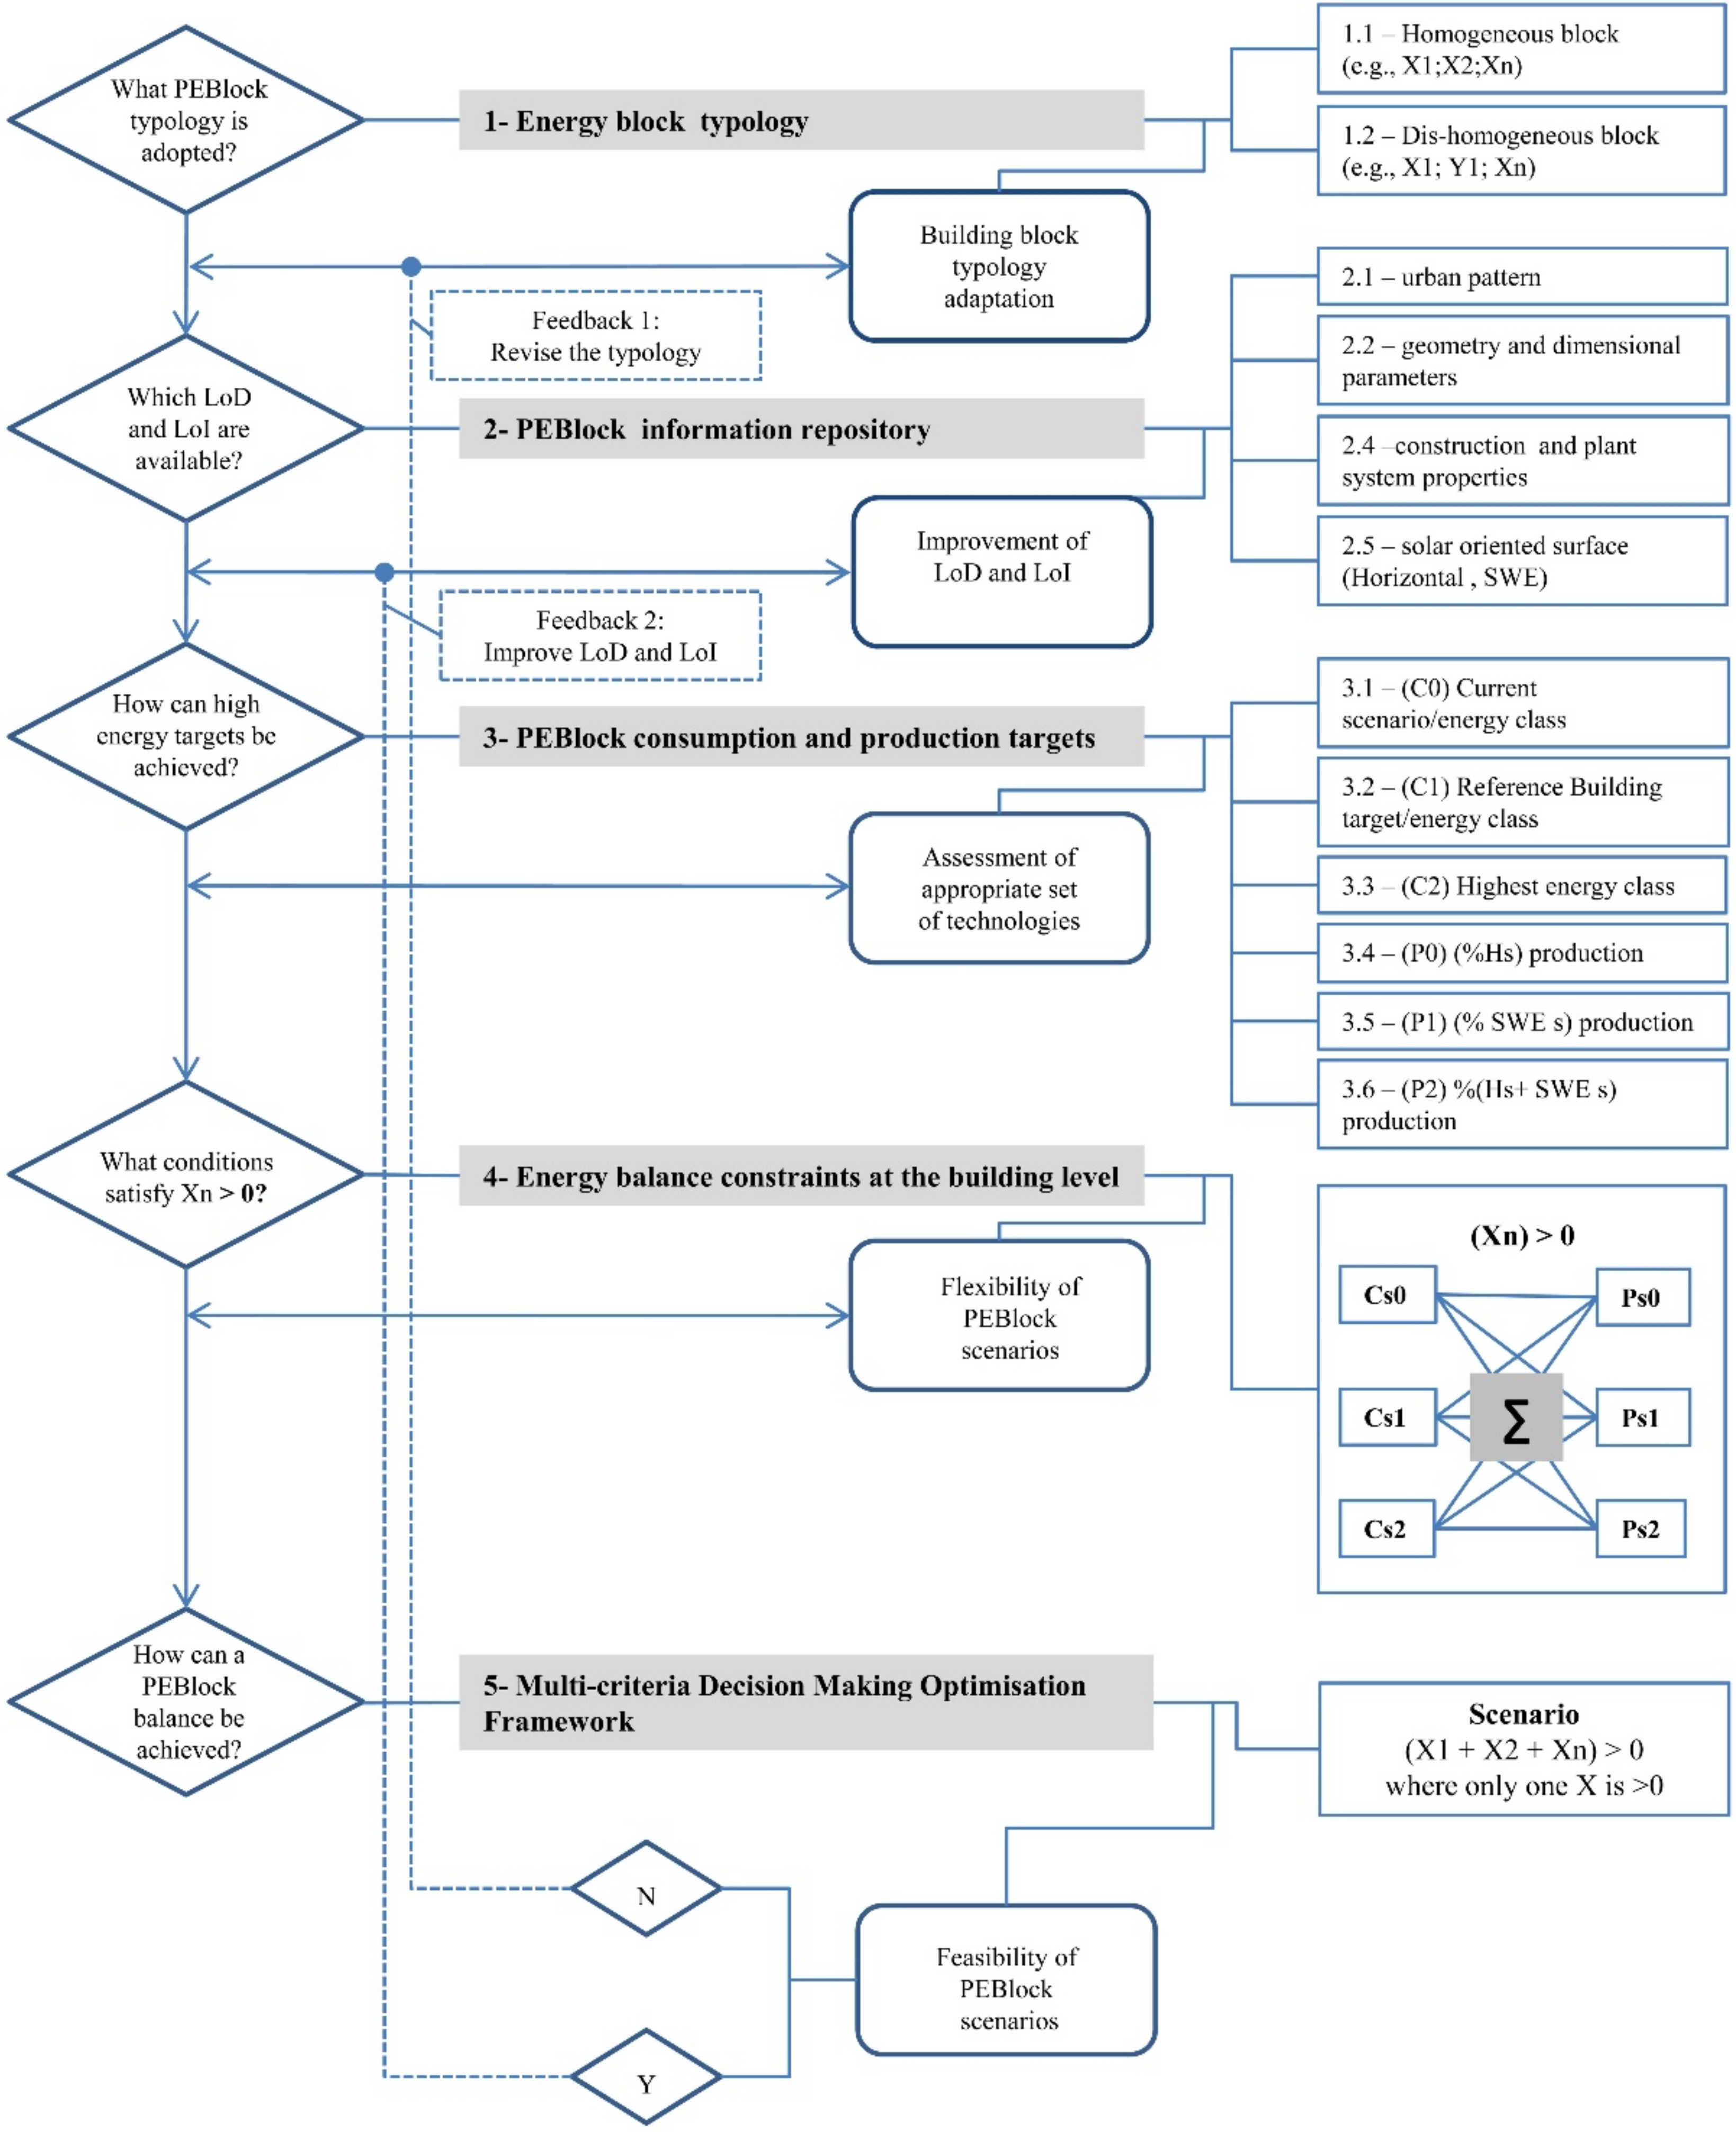
A five-phase approach was adopted and organised in a workflow structure (
Figure 1).
Figure 1 provides details concerning each phase, pointing out focus questions associated with each phase and outputs.
In detail, the first phase defines the energy block profile. The second phase focuses on creating a building information repository; the third phase compares and combines energy consumption and production targets; the fourth phase identifies energy balance constraints at the building level. The final phase assesses positive energy scenarios at the block level through a multi-criteria decision making optimisation framework.
Furthermore,
Figure 1 displays (on the right) a set of parameters associated with each phase used to set the optimisation framework. It also presents the nomenclature adopted herein. Thus, if no positive scenario emerges at the end of the process, the typology of PEBlock must be revised (Feedback 1,
Figure 1). By contrast, if a positive scenario emerges, the LoD and LoI must be improved to confirm the feasibility of the solution selected (Feedback2,
Figure 1). Additional details are provided in the following sub-section.
2.1.1. PEBlock Typology
The first phase in organising a PEBlock is about the typology definition. According to Sibilla and Kurul [
36], the workflow establishes two options: homogeneous and dis-homogeneous PEBlocks. Each option is based on two parameters: the building and technology typology. The block is homogeneous when it is composed of buildings with similar energy demand profiles and one type of energy system (e.g., PV-based systems). In a preliminary step, the energy demand profile may refer to the main building activities (e.g., school, office or residence). This is a common approach in energy modelling, which adopts recognised international or national standards to associate consumption patterns and activities [
45]. By contrast, it is dis-homogeneous when the block includes an energy exchange among buildings with different energy profiles (e.g., schools and offices) and a mix of integrated renewable systems (e.g., PV-based and wind-based systems).
2.1.2. PEBlock Information Repository
The second phase is about the levels of information (LoI) and detail (LoD) available concerning PEBlock components. The workflow sets a preliminary list of parameters affecting the potential role of each component within an energy block. Thus, it takes into account the urban patternand geometrical and dimensional parameters. The former can have a relevant impact on using local renewable energy sources, such as sun and wind. Indeed, demolishing the existing urban patterns to improve the quality of solar and wind access is rare and often unsustainable [
46]. The latter establishes how a building can or cannot act as a positive energy building due to its dimension and form [
36]. More simply, large and well-exposed surfaces to integrate PV modules are needed to produce a surplus of energy.
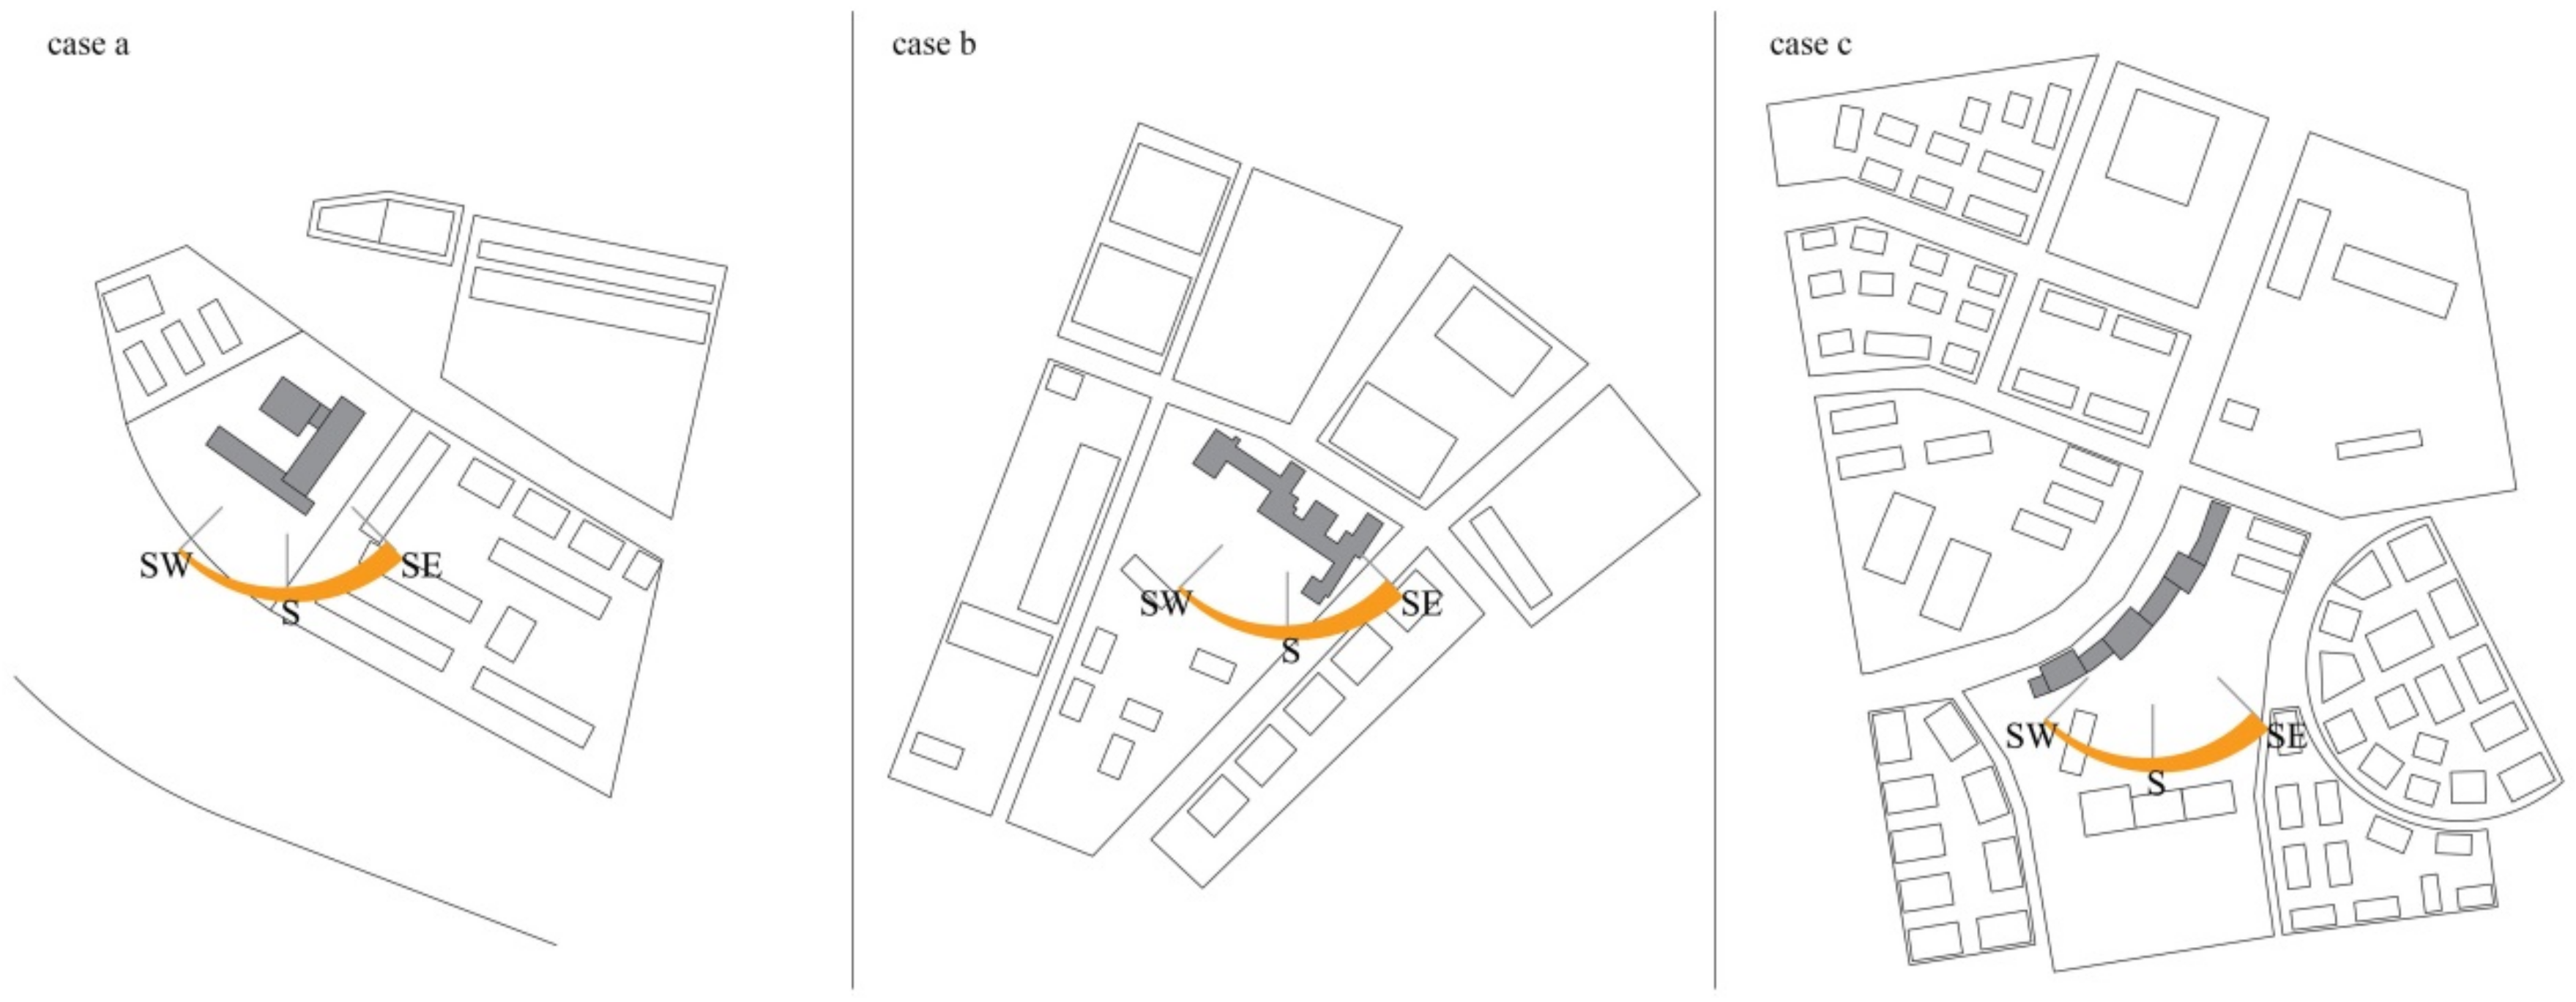
Similarly, modifying the building orientation or optimising its current form can be impractical. On the contrary, these parameters are fundamental in implementing a new settlement based on the PEBlock concept. According to Sibilla and Kurul [
36], the workflow considers a further family of parameters, the so-called solar orientated surfaces (i.e., horizontal and SWE solar oriented surfaces). It was stressed that solar oriented surfaces are indexes to measure the extent to which a building can be a component of a PV-based PEBlock, taking into account its solar form.
The LoD and LoI related to the parameters mentioned above are key factors in determining the flexibility and feasibility of a PEBlock. Establishing an appropriate LoD and LoI is a typical design problem in using parametric platforms [
47,
48]. The need for a parametric platform for positive energy scenario management was stressed by Abanda et al. [
49].
2.1.3. PEBlock Consumption and Production Targets
The third phase responds to how to define consumption and production targets. It is not in the scope of this paper to focus on the calculation procedure because the procedure is based on a standard process adaptable to each context. In this regard, relevant references are provided.
Thus, the workflow takes into account the Energy Performance Certificates (EPC) procedure, where the consumption target is usually classified from G-class (low performance) to A-class (high performance). In Europe, EPC was introduced by Directive 2002/91/EC. As a well-known procedure, it is based on evaluating the building envelope performance, adopting a semi-stationary method as reported by UNI EN ISO 13790:2009 [
50]. In this regard, each EU country established a national technical procedure; for example, Italy adopted UNI-13800-1 [
51].
In order to obtain the range of classes, the procedure refers to the “reference building”, a concept introduced by Directive 20210/31/UE. The “reference building” is a building identical to the object of design in terms of geometry, orientation, geographical location and intended use and type of system but having predetermined thermal and energy characteristics established by the legislative framework. Thus, it is relevant to emphasise that each building has its own “reference building” and thus a specific set of values attributed to the range of classes. However, the concept of the “reference building” is currently under investigation by several studies [
52,
53], and its application at the large scale is emerging as a new topic [
54].
Similarly, the energy generated by PV refers to the national application of UNI EN 15316-4-6 [
55]. For example, in Italy the calculation procedure is defined by UNI/TS 11300-4 [
56]. A detailed simulation of building-integrated renewable energy systems is provided in [
57].
Therefore, three energy consumption scenarios were included: the current scenario (Cs0), the “reference building” scenario (Cs1) and the highest energy class scenario (Cs2). Each scenario requires applying a specific set of values to the construction and plant systems level to identify the energy class. This set of values can be based on, for example, an architectural survey, a comparative analysis taking into account the date of construction and analogies or technical data from the original project. Regarding energy Cs1 and Cs2, the value used refers to those generated by applying the EPC procedure.
Simultaneously, three energy production scenarios are considered: %Hs production (Ps0); (%SWEs) production (Ps1); %Hs+%SWEs production (Ps2). The usable percentage of solar oriented surfaces depends on the LoD and LoI available. As a preliminary step, the percentage of usable surfaces was considered equal to 100% (i.e., maximum potentiality related to the LoI adopted in this study).
2.1.4. Energy Balance Constraints at the Building Level
Subsequently, the building level’s energy balance constraints are assessed, calculating the energy consumption and energy production balance. The calculation is based on the simple inequalities (e.g., Cs0 + Ps0 < 0; Cs1 + Ps2 > 0). Thus, the combination returns two macro ranges for each building (i.e., Xn): Xn < 0 and Xn > 0. The former refers to a building that cannot produce more energy than it consumes; on the contrary, the latter points out that the building is potentially able to produce a surplus of energy. It is also possible to establish an inter-range, pointing out results near zero. As a result, the flexibility of PEBlock scenarios is described, establishing under what circumstance a single building can act as a positive, neutral or negative node.
2.1.5. Multi-Criterion Decision Making Optimisation Framework
After defining the energy balance constraint at the building level, it is possible to explore positive scenarios at the block level. Specifically, these scenarios refer to the following alternative conditions:
- 1.
X1>0, while (X2<0 + Xn<0) < 0;
- 2.
X2>0,while (X1<0 + Xn<0) < 0;
- 3.
Xn>0,while (X1<0 + X2<0) < 0.
The comparison among the above-mentioned conditions, at this stage, is based on three criteria:
- •
Technical complexity level (T);
- •
Surplus energy production level (SEP);
- •
Comfort level (C).
All these criteria depend on the LoD and LoI, and they can be analysed using basic or advanced methodologies [
27,
58]. The former implies assigning qualitative and quantitative numerical values to each component that composes the scenario. The second refers to a more sophisticated algorithm and artificial intelligence techniques. According to the scope of this paper, the first option was adopted. The simplifications adopted herein are considered admissible since the scope of this paper is not to provide a tangible energy balance, but it is about the description of a procedure, which can be improved through a sequence of feedback and adaptations (see
Figure 1).
Concerning the technical complexity level, it is plausible to state that it increases along with building performance. For example, achieving the Cs1 target is possible to work on the building envelope qualities (e.g., wall insulation level). However, achieving the Cs2 target requires substantial plant system improvements (e.g., distribution, production and emission efficiency). Similarly, it is possible to affirm that PV modules installed on horizontal surfaces are technically simpler than vertical ones (e.g., vertical installation always requires scaffoldings).
Therefore,
Table 1 shows the numerical values attributed to each combined scenario. A simple unitary scale was adopted so that an additional unitary value is assigned for each variation in complexity. The scale assigned also takes into account that the combinations for X
1 > 0 refer to a single building, while the combinations forX
2<0 + X
n<0 involve two buildings. Thus, the maximum value of technical complexity levels is 14. This value must be minimised.
Table 1 displays this variation across energy consumption and production combinations.
The surplus energy production level is calculated as energy consumption and production combinations at the block level (i.e., X1 > 0 > Xn < 0 + X2 < 0). Thus, it is a quantitative criterion which must be maximised. However, among the positive values returned by the combinations, only two for each combination are selected to be returned to the optimisation framework: the highest value and the nearest positive value to zero.
Finally, in line with prior studies [
59,
60,
61], which confirmed that better energy performance of building components positively affects the users’ comfort perceptions, the criterion of comfort level is based on a qualitative scale associated with the combination of consumption target (e.g., high comfort: without Cs
0 target; moderate: one Cs
0 target; low: two Cs
0 target). Therefore, this qualitative criterion must be maximised.
Furthermore, these three criteria are linked to stakeholders’ perspectives, as suggested by [
18]. For example, technical complexity and surplus energy production may be associated with stakeholders interested in reducing the cost of transformation or exploring financial investment. While the comfort level related to users’ perspectives focused on the quality of the indoor environment more than energy production, the exact weight (i.e., 33%) was attributed to all three criteria as a starting point.
The procedure was tested through a case study described in the following section. The multi-criterion decision making optimisation framework was developed with the support of Visual PROMETHEE, setting the main scenario and specifying the number of criteria and combinations included in the problem resolution.
This scenario refers to a PEBlock composed of three buildings where only one building is positive. In terms of problems, it is expected that the framework will help improve the scalability of the PEBlock procedure to transform buildings into components of a PEBlock across time and space. In addition, implications in weighting criteria were also analysed.
2.2. A Case Study
The case study involved three school buildings within three different urban patterns located in Rome’s XI district (
Figure 2). It aimed to assess the extent to which these three buildings can act as a PEBlock. It also represented how public buildings can be re-organised in new energy infrastructure, providing an example and the best practices to guide the urban energy transition.
Furthermore, Rome’s school buildings, especially those built between 1930 and 1970, play a relevant role in defining their neighbourhoods’ urban and architectural qualities [
62]. Consequently, the organisation of a PEBlock is promoted as an opportunity to enhance thepublic buildings’ roles in the sustainable re-organisation of the city. The application of the workflow structure to the case study is described below.
The block typology was established as homogeneous, both in terms of energy profile and RES technologies (
Table 2).
The owner of these buildings is the Municipality of Rome, which is responsible for their maintenance. Considering that more than 50 school buildings belong to the XI district, it is evident that involving this typology of building within a PEBlock transformation process can profoundly impact managerial, financial and planning strategies of the Municipality of Rome.
Furthermore, only the PV-based system was considered concerning the RES plant since solar energy has a high potential in Rome, while the wind-based system was excluded due to the low level of airflow velocity within the urban context.
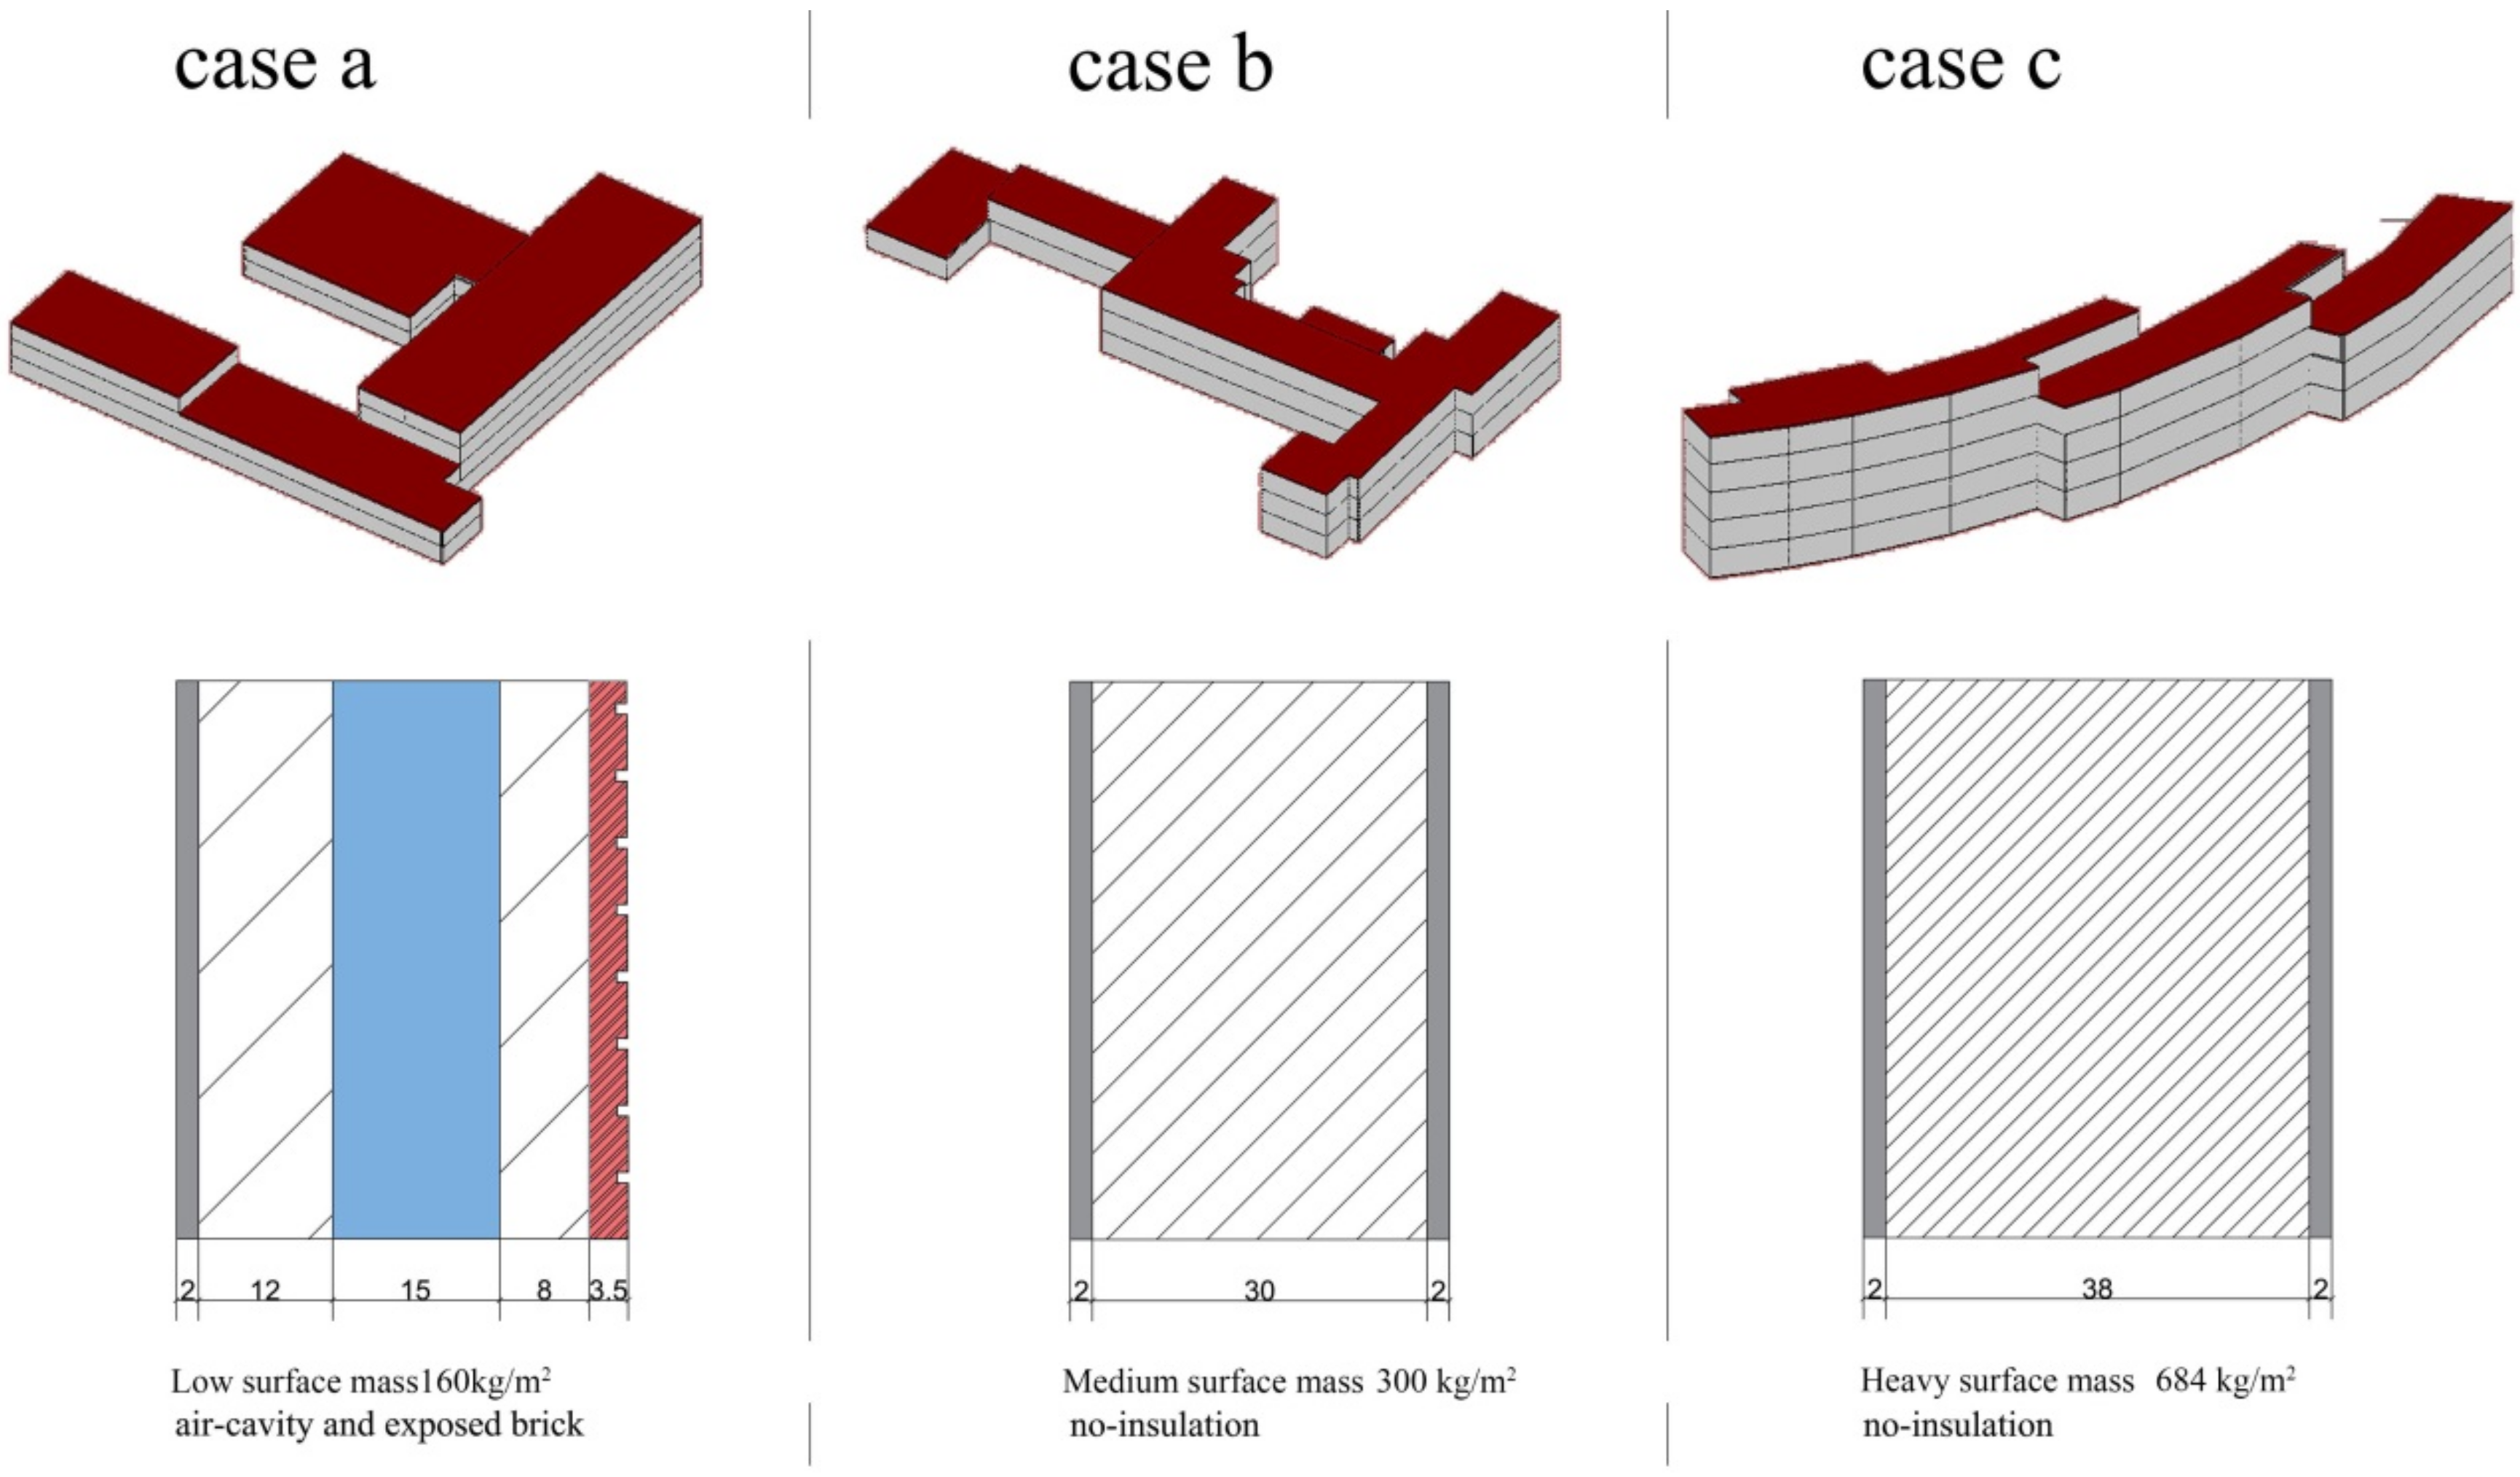
Three simplified models were developed, taking into account dimensions, forms, volumes, position and orientation as LoD (
Figure 3). Moreover, the main features concerning the construction components (i.e., floors, external walls, roofs and plant systems) were defined to achieve an appropriate LoI to set and run the EPC procedure.
Figure 3 shows the volumetric features of the three case studies, pointing out the main differences in terms of construction systems. In this regard, the three cases represent three completely different situations. Therefore, the cases “a”, “b” and “c” are characterised by low (160 kg/m
2), medium (300 kg/m
2) and heavy (684 kg/m
2) surface masses, respectively.
Table 3 reports the values to evaluate the building envelope performance, adopting a semi-stationary method. It also reports the values established by the legislative framework for the “reference buildings” in order to define the class range for each building.
Successively, building consumption and production targets are established according to the Italian legislation framework [
63] pursuant to the EU directive (i.e., 2010/31/EU). Therefore, the consumption targets are classified by energy class, from G (low class) toA4 (highest class), while the A1class represents the “reference building” according to the Italian legislation framework [
64].
Table 4 reports the results from the calculation developed using validated software (i.e., TermoNamirial v5.0). Consumption targets refer to the building envelope performance in kWh/m
2 and energy class. Production targets refer to the IBPV surfaces (horizontal, SWE orientated and their combination). PV surfaces were set to100% of the oriented surfaces. The potential production was calculated based on [
56]. All case studies currently belong to the E-Class.
Therefore, due to the energy balance constraints at the building level, each building provides four possible solutions to act as a positive node. In detail, one is based on the Cs
1 target and three on the Cs
2 target, as shown in
Table 5.
These solutions were combined, considering the scenario established (see
Section 2.1.5). In other words, the combination refers to a PEBlock organisation where only one building is positive, while the sum of the other two is negative in terms of energy balance.
As a result, a list of 300 potential combinations for each building was identified, of which 220 are not admissible since they did not return positive energy scenarios. However, from those considered admissible, only the combination that returned the highest value and the nearest to zero value of the positive energy balances was selected. These two values may represent two different stakeholders’ perspectives: a group of stakeholders interested in maximising energy production, while another focused on maximising the users’ comfort. This selection forms a list of 21 actions for the multi-criteria decision making optimisation framework, characterised with the prefix “M” and “U” for the group mentioned above, respectively.
The main results of the multi-criteria are presented in the next section.
3. Results
This section illustrates the main results focused on the following components concerning the analysis conducted: action impact comparison, criteria comparison and walking weights evaluation.
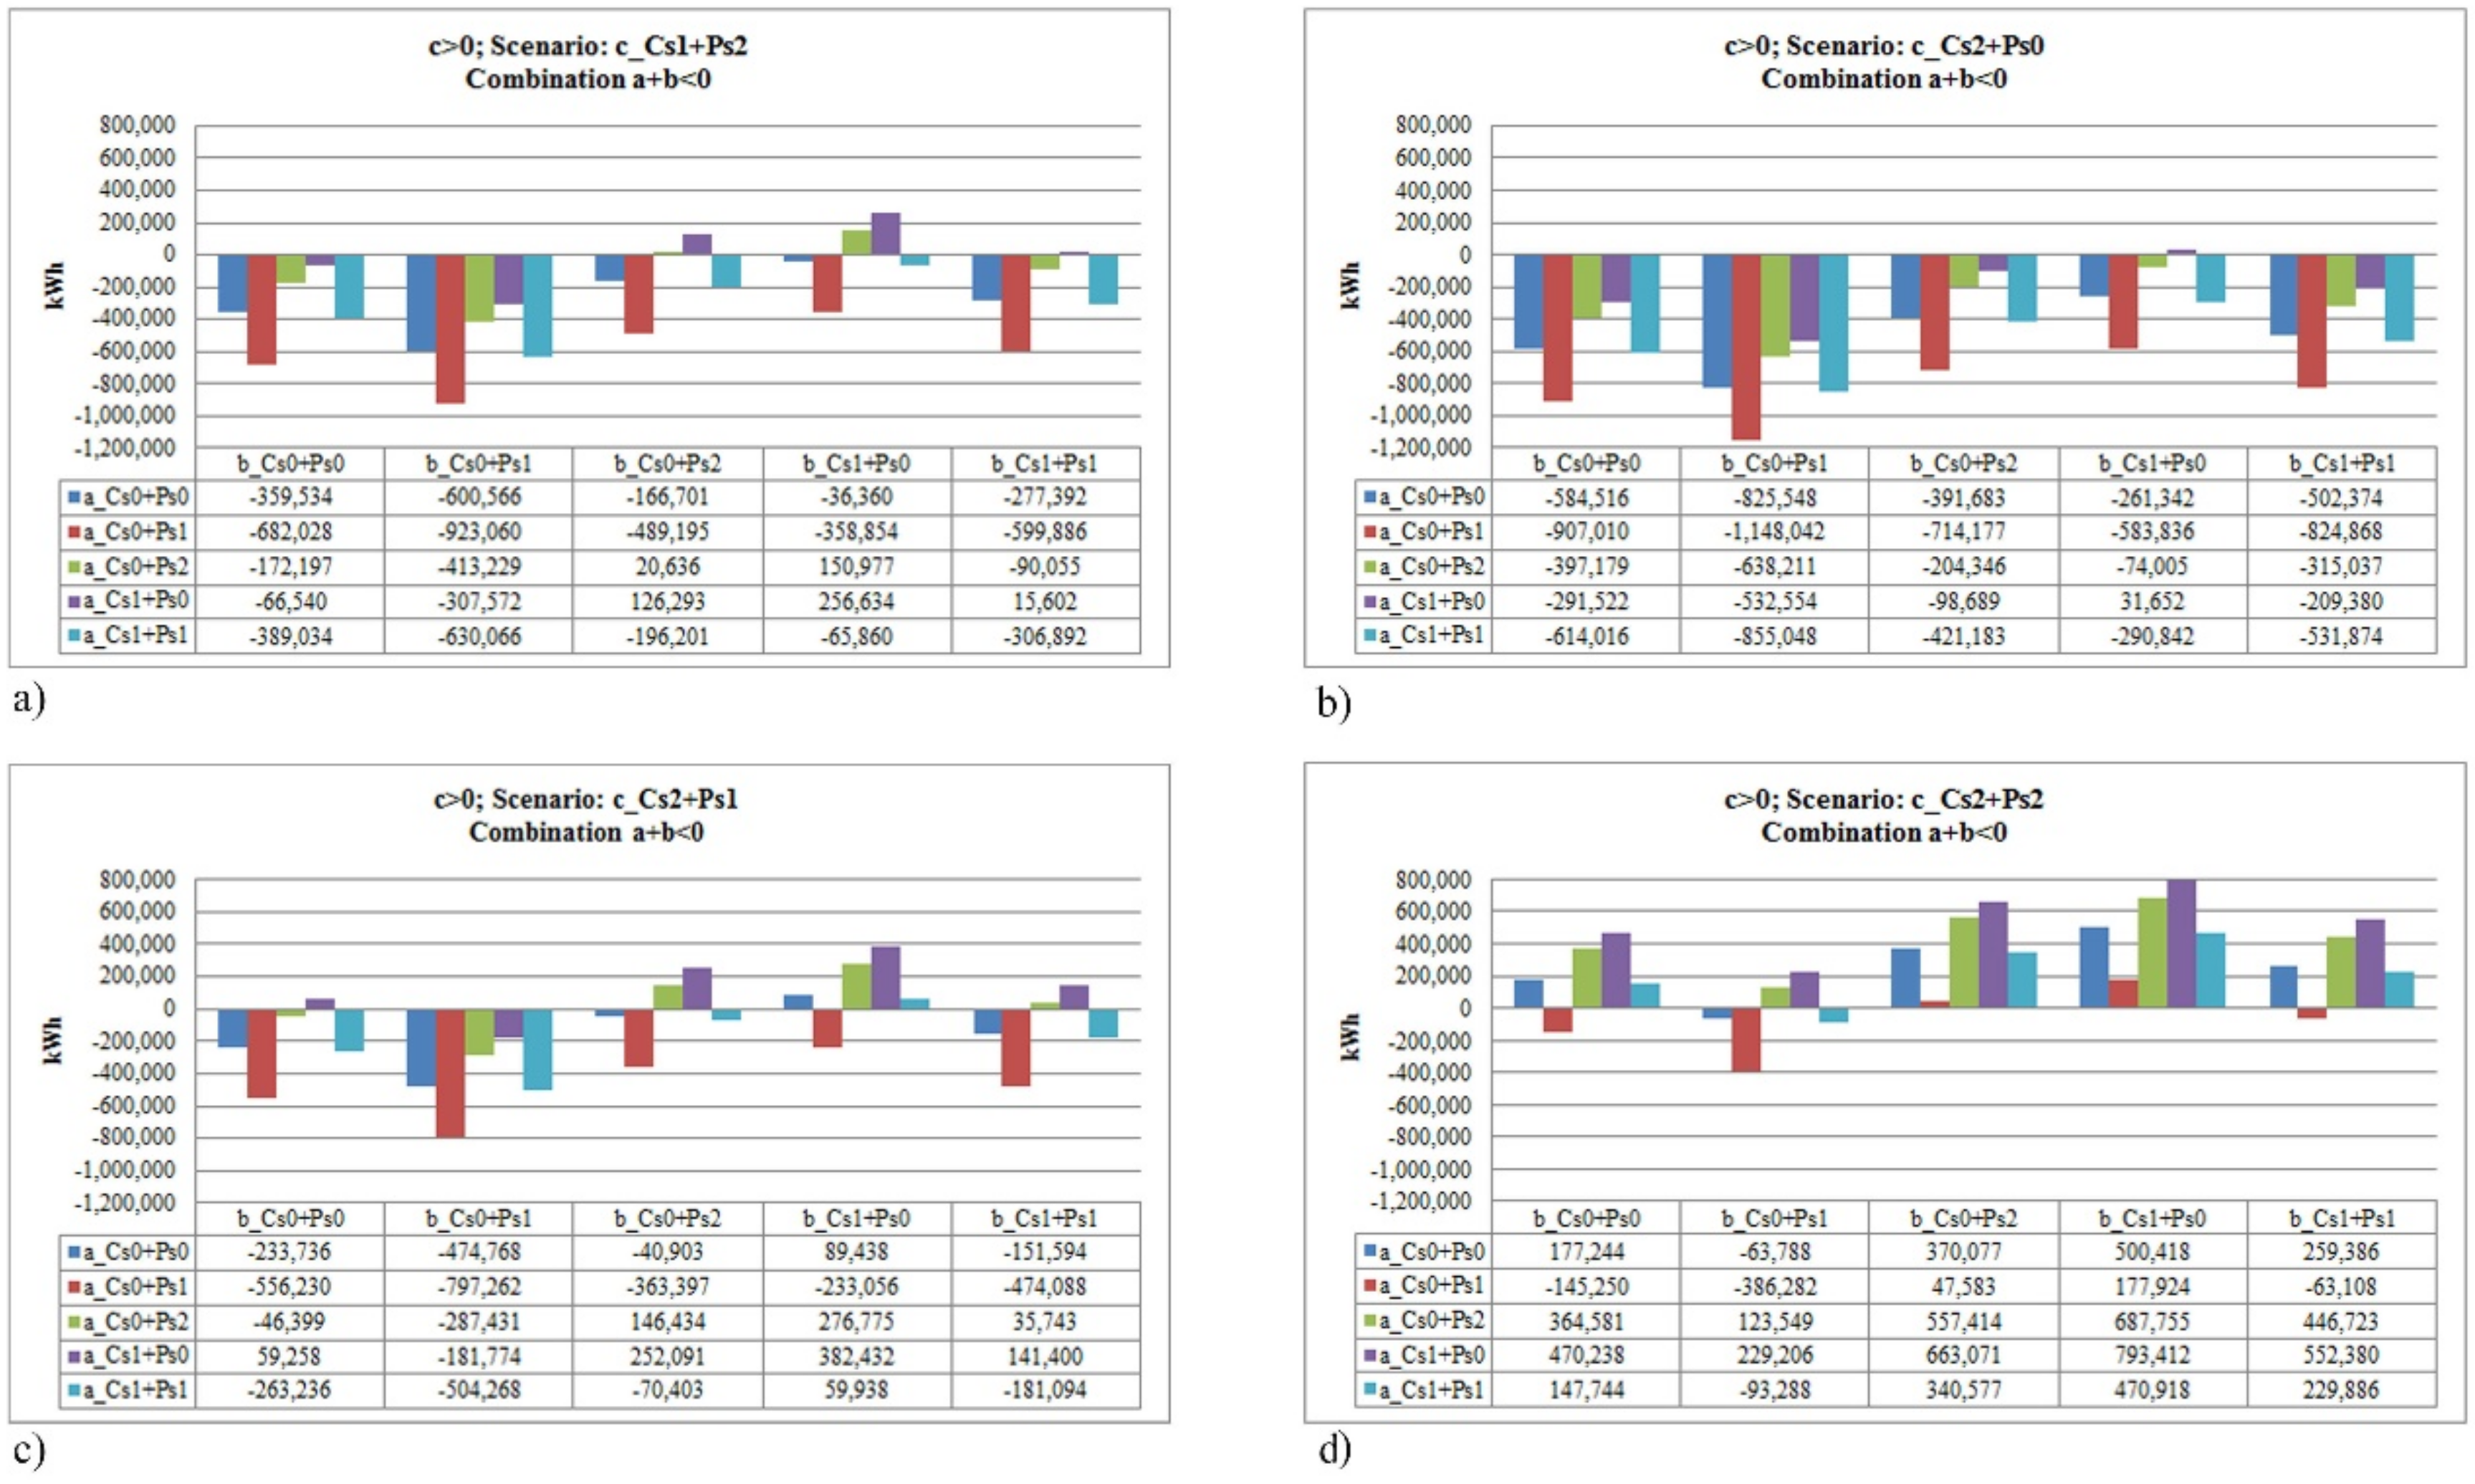
Figure 4 displays the results from the calculation focused on the scenario where building “c” acts as a positive energy node (i.e., c > 0).
Figure 4a provides evidence that the first combination (i.e., Cs
1 + Ps
2) can achieve a positive energy target only under three combinations concerning “a + b < 0”.
Figure 4b stresses the ineffectiveness of combinations based on the Cs
2 + Ps
0 scenario. Here, only one positive solution emerges with a minimal surplus of energy.
Figure 4c,d show an increasing number of potential solutions in line, of course, with the technical complexity. However, it is crucial to focus on the energy production values in terms of kWh (see Y-axis) because the gap that refers to the same combination of “a + b < 0”is relevant. This gap must be taken into account if the scope of the PEBlock is to produce a substantial surplus of energy.
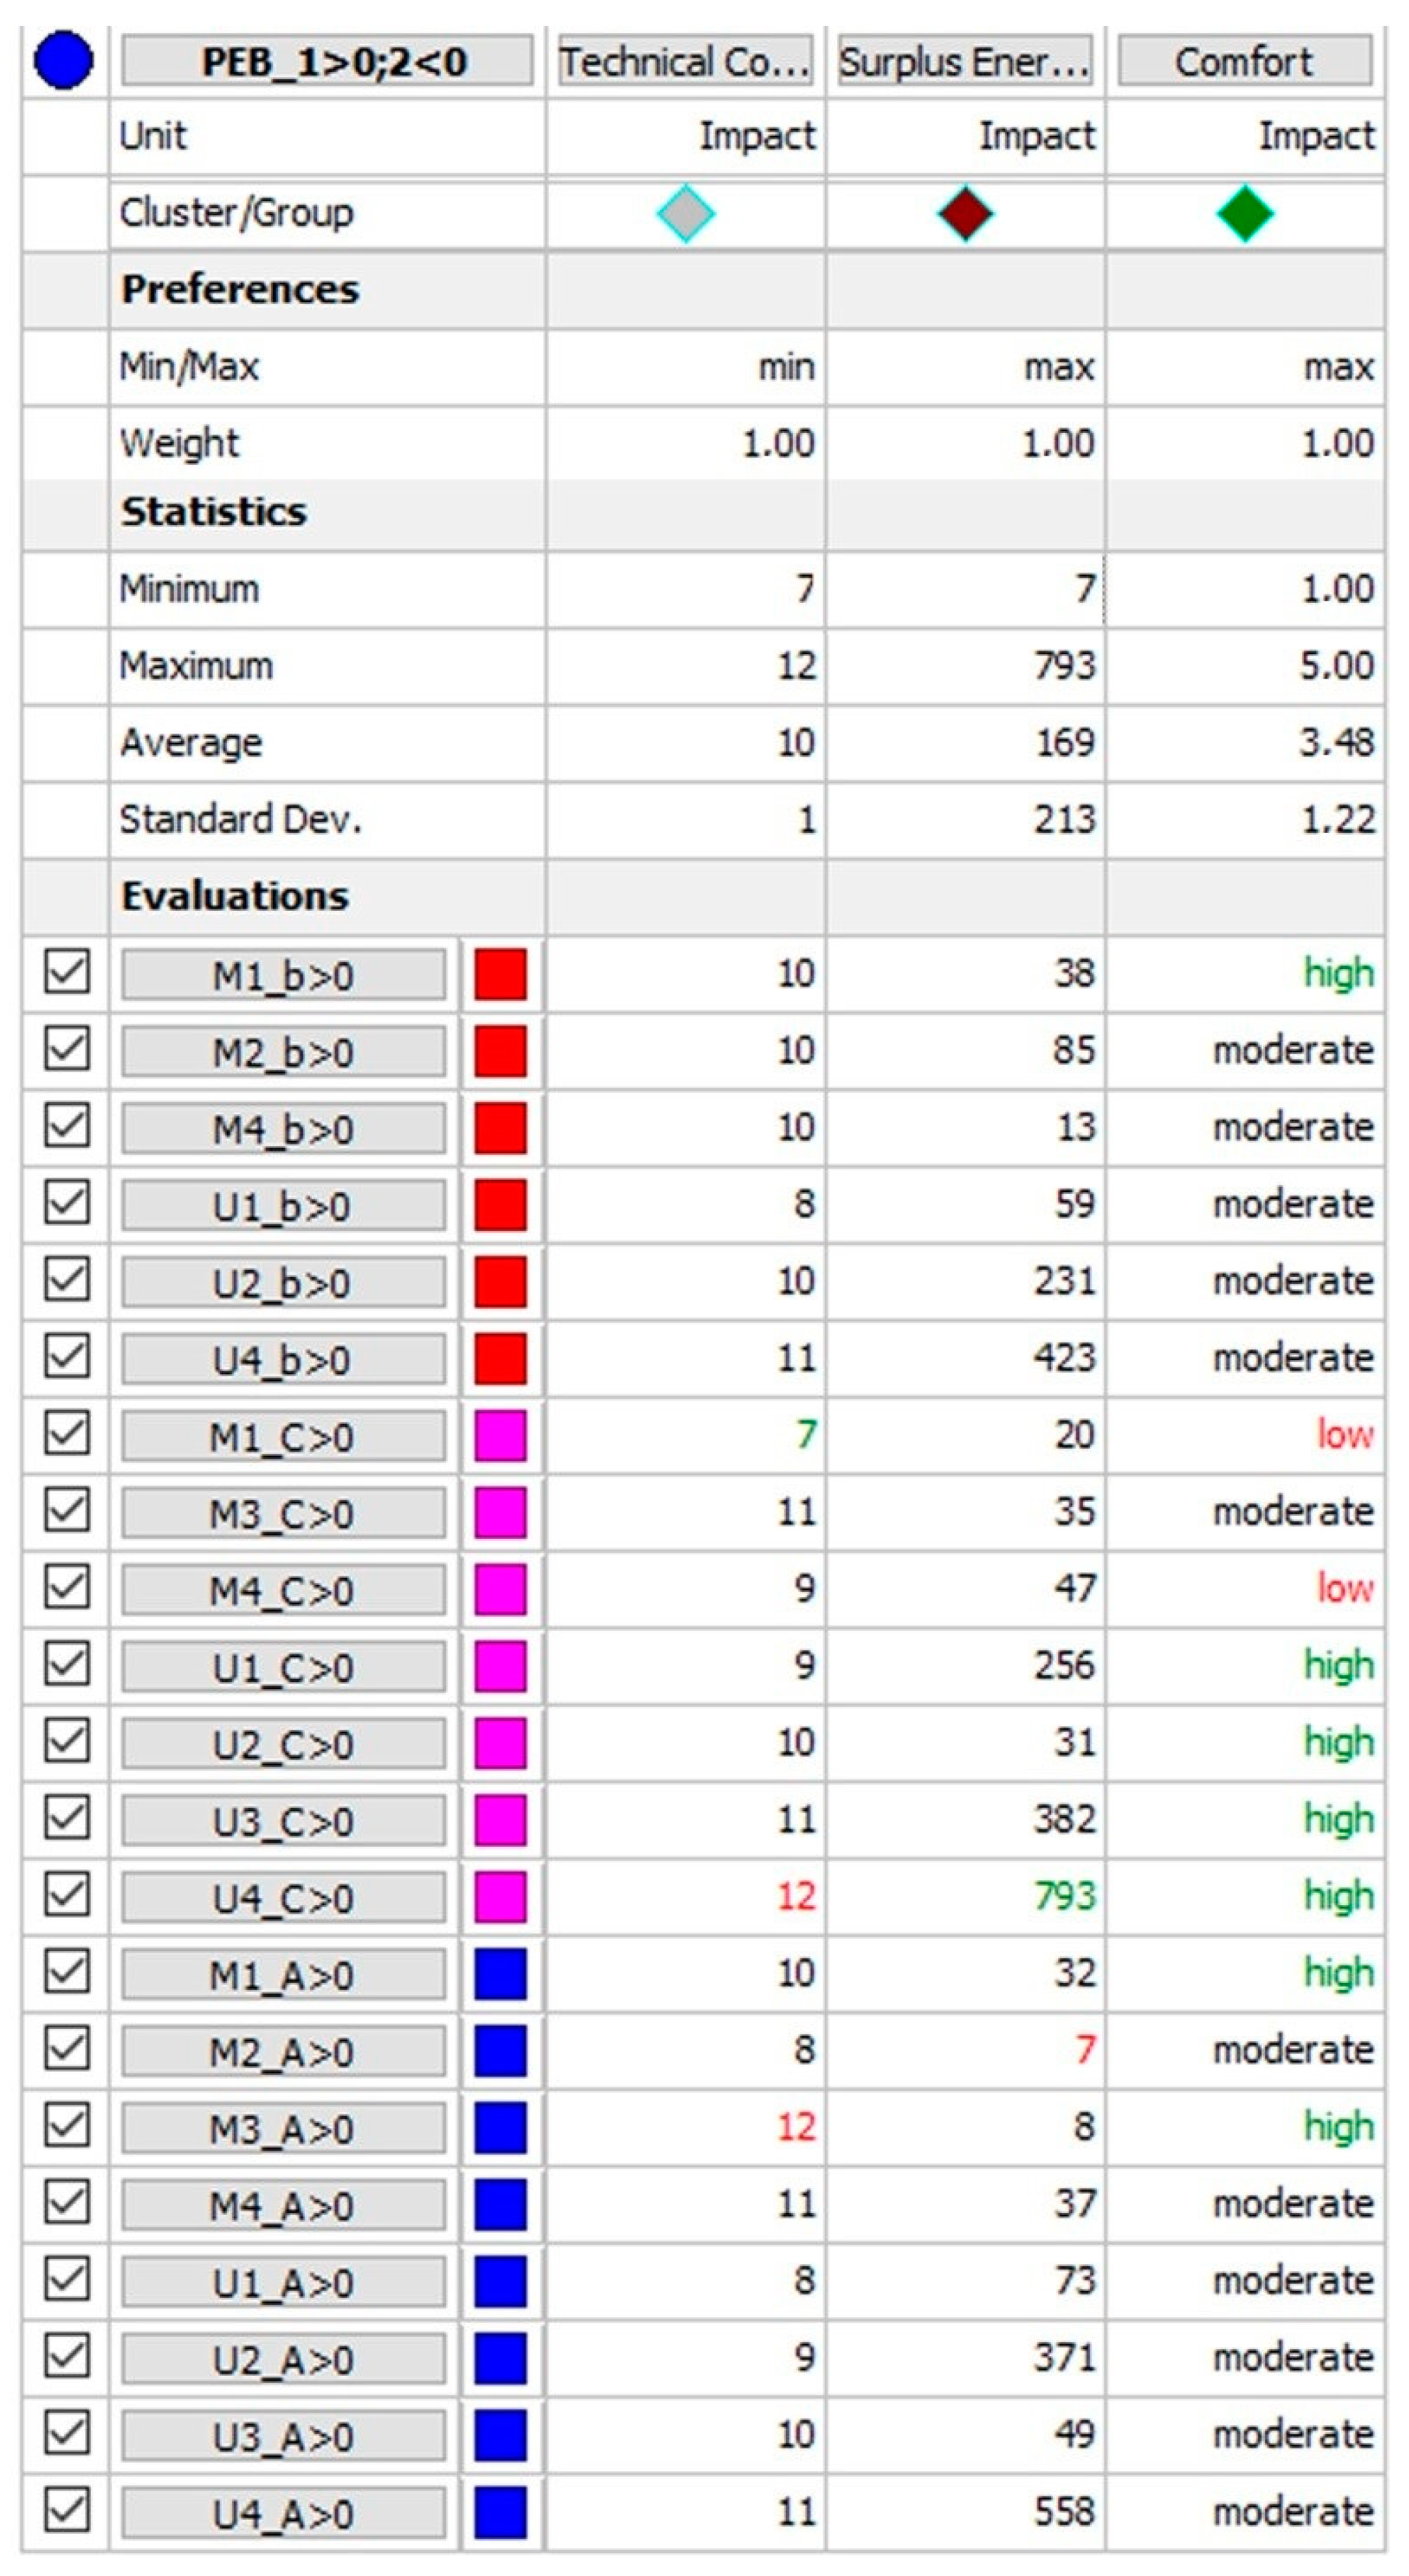
In terms of optimisation,
Figure 5 provides an overview of the results obtained, listing the actions selected for the multi-criteria decision making optimisation framework and reporting the corresponded values. In addition,
Figure 5 clarifies the reference scenario (i.e., one building > 0; two buildings < 0) and the three criteria used (T, SEP and C), weighted with the same unitary index at this analysis stage. In order to allow the comparison among the actions, simple statistical values are included (i.e., min, max, average and standard deviation). In addition, max and min values for each criterion are highlighted with green and red, respectively. The results yield seven optimal solutions for surplus energy production above average. However, this number decreases to four when the surplus energy production criterion is associated with the other two. For example, the action U4_C > 0 has the best value concerning two criteria (i.e., surplus energy production and comfort), but the worst concerning the technical complexity. It is possible to observe that the highest comfort level is usually achieved by the high impact concerning the technical complexity criterion. In this regard, it is interesting to note an exception related to the action U1_C > 0, which reports a value concerning the technical complexity criterion under the average while showing the highest comfort level.
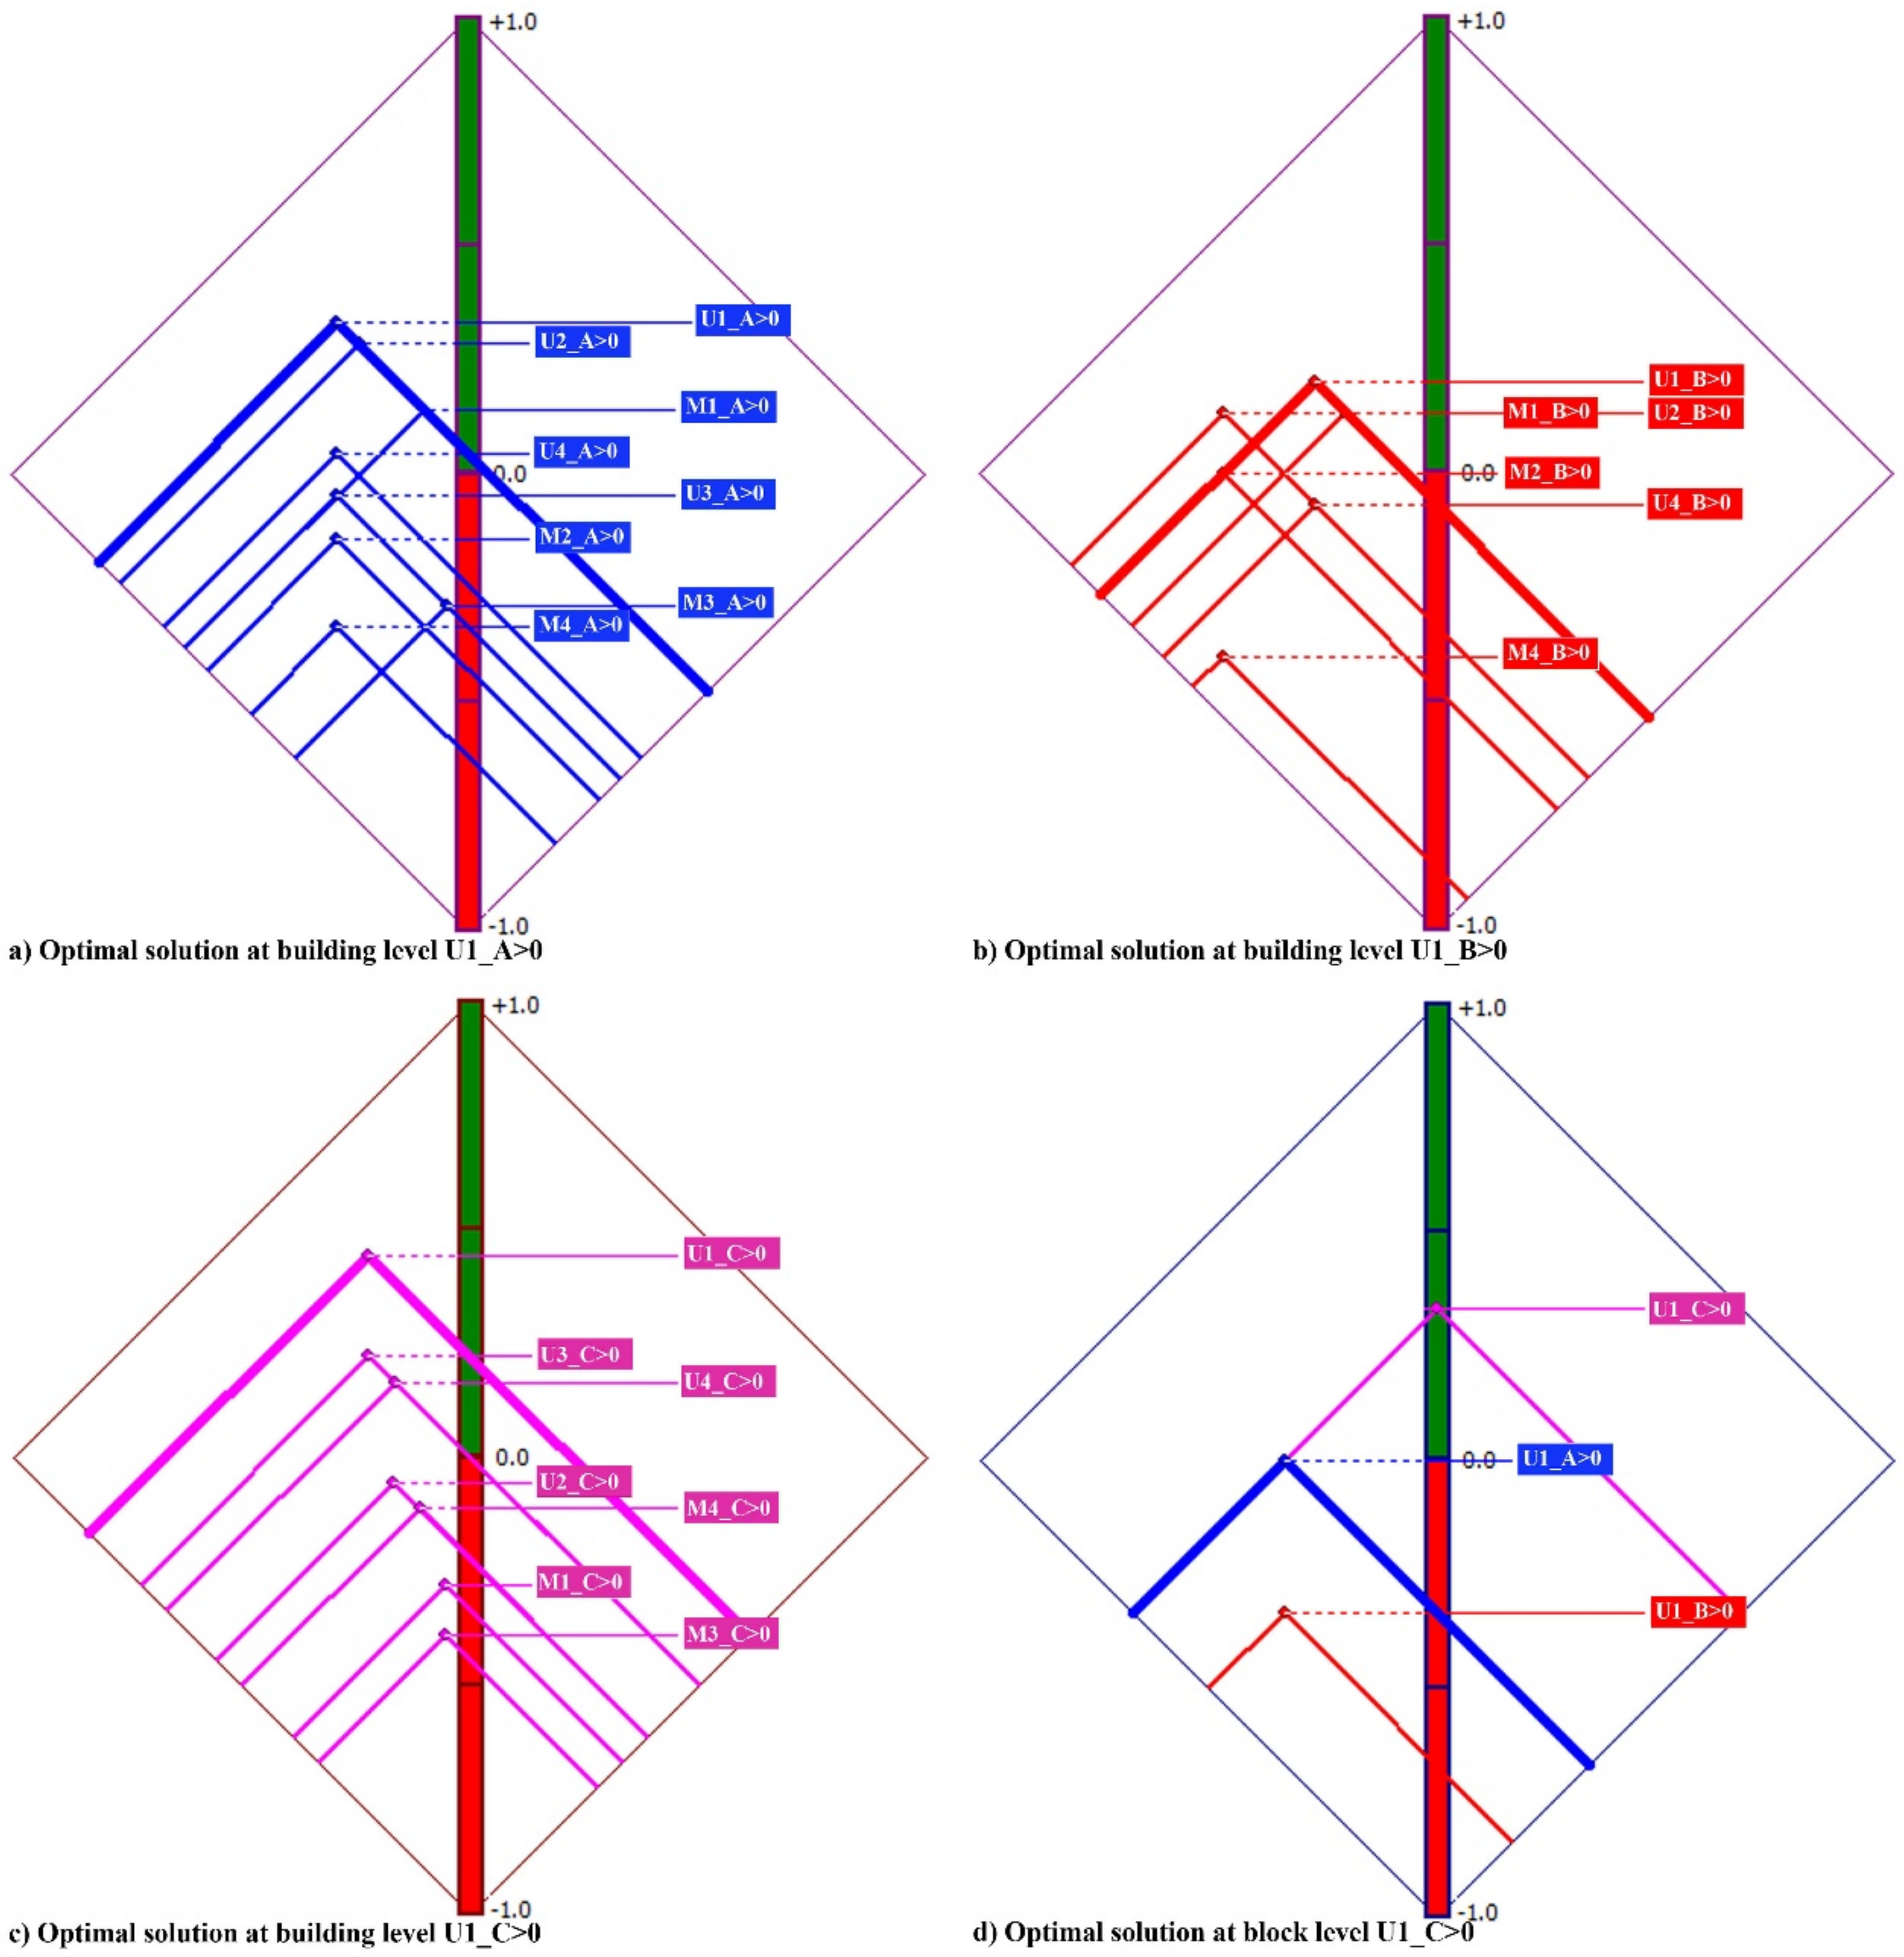
Figure 6 shows the actions comparison. First, it was divided into four-diamond charts, comparing the hierarchical distribution of actions applied to every building (
Figure 6a–c). The values are normalised, considering a scale from −1 to +1. Actions that intersect the green bar are optimal. In detail, four potential positive actions were identified at the building level for building “a” and three both for building “b” and “c”. These actions will require an additional level of information to assess their feasibility. Then, each optimal solution at the building scale was compared at the block scale (
Figure 6d). Results show that the feasibility concerning building “c” to act as an active node of the PEBlock is more remarkable than “b” and “a”.
Therefore, as a final result, the procedure established a hierarchical organisation of energy retrofit actions affecting the building scale; in addition, it pointed out the hierarchical organisation of the buildings as components of the block within the scenario where only one building is an active node.
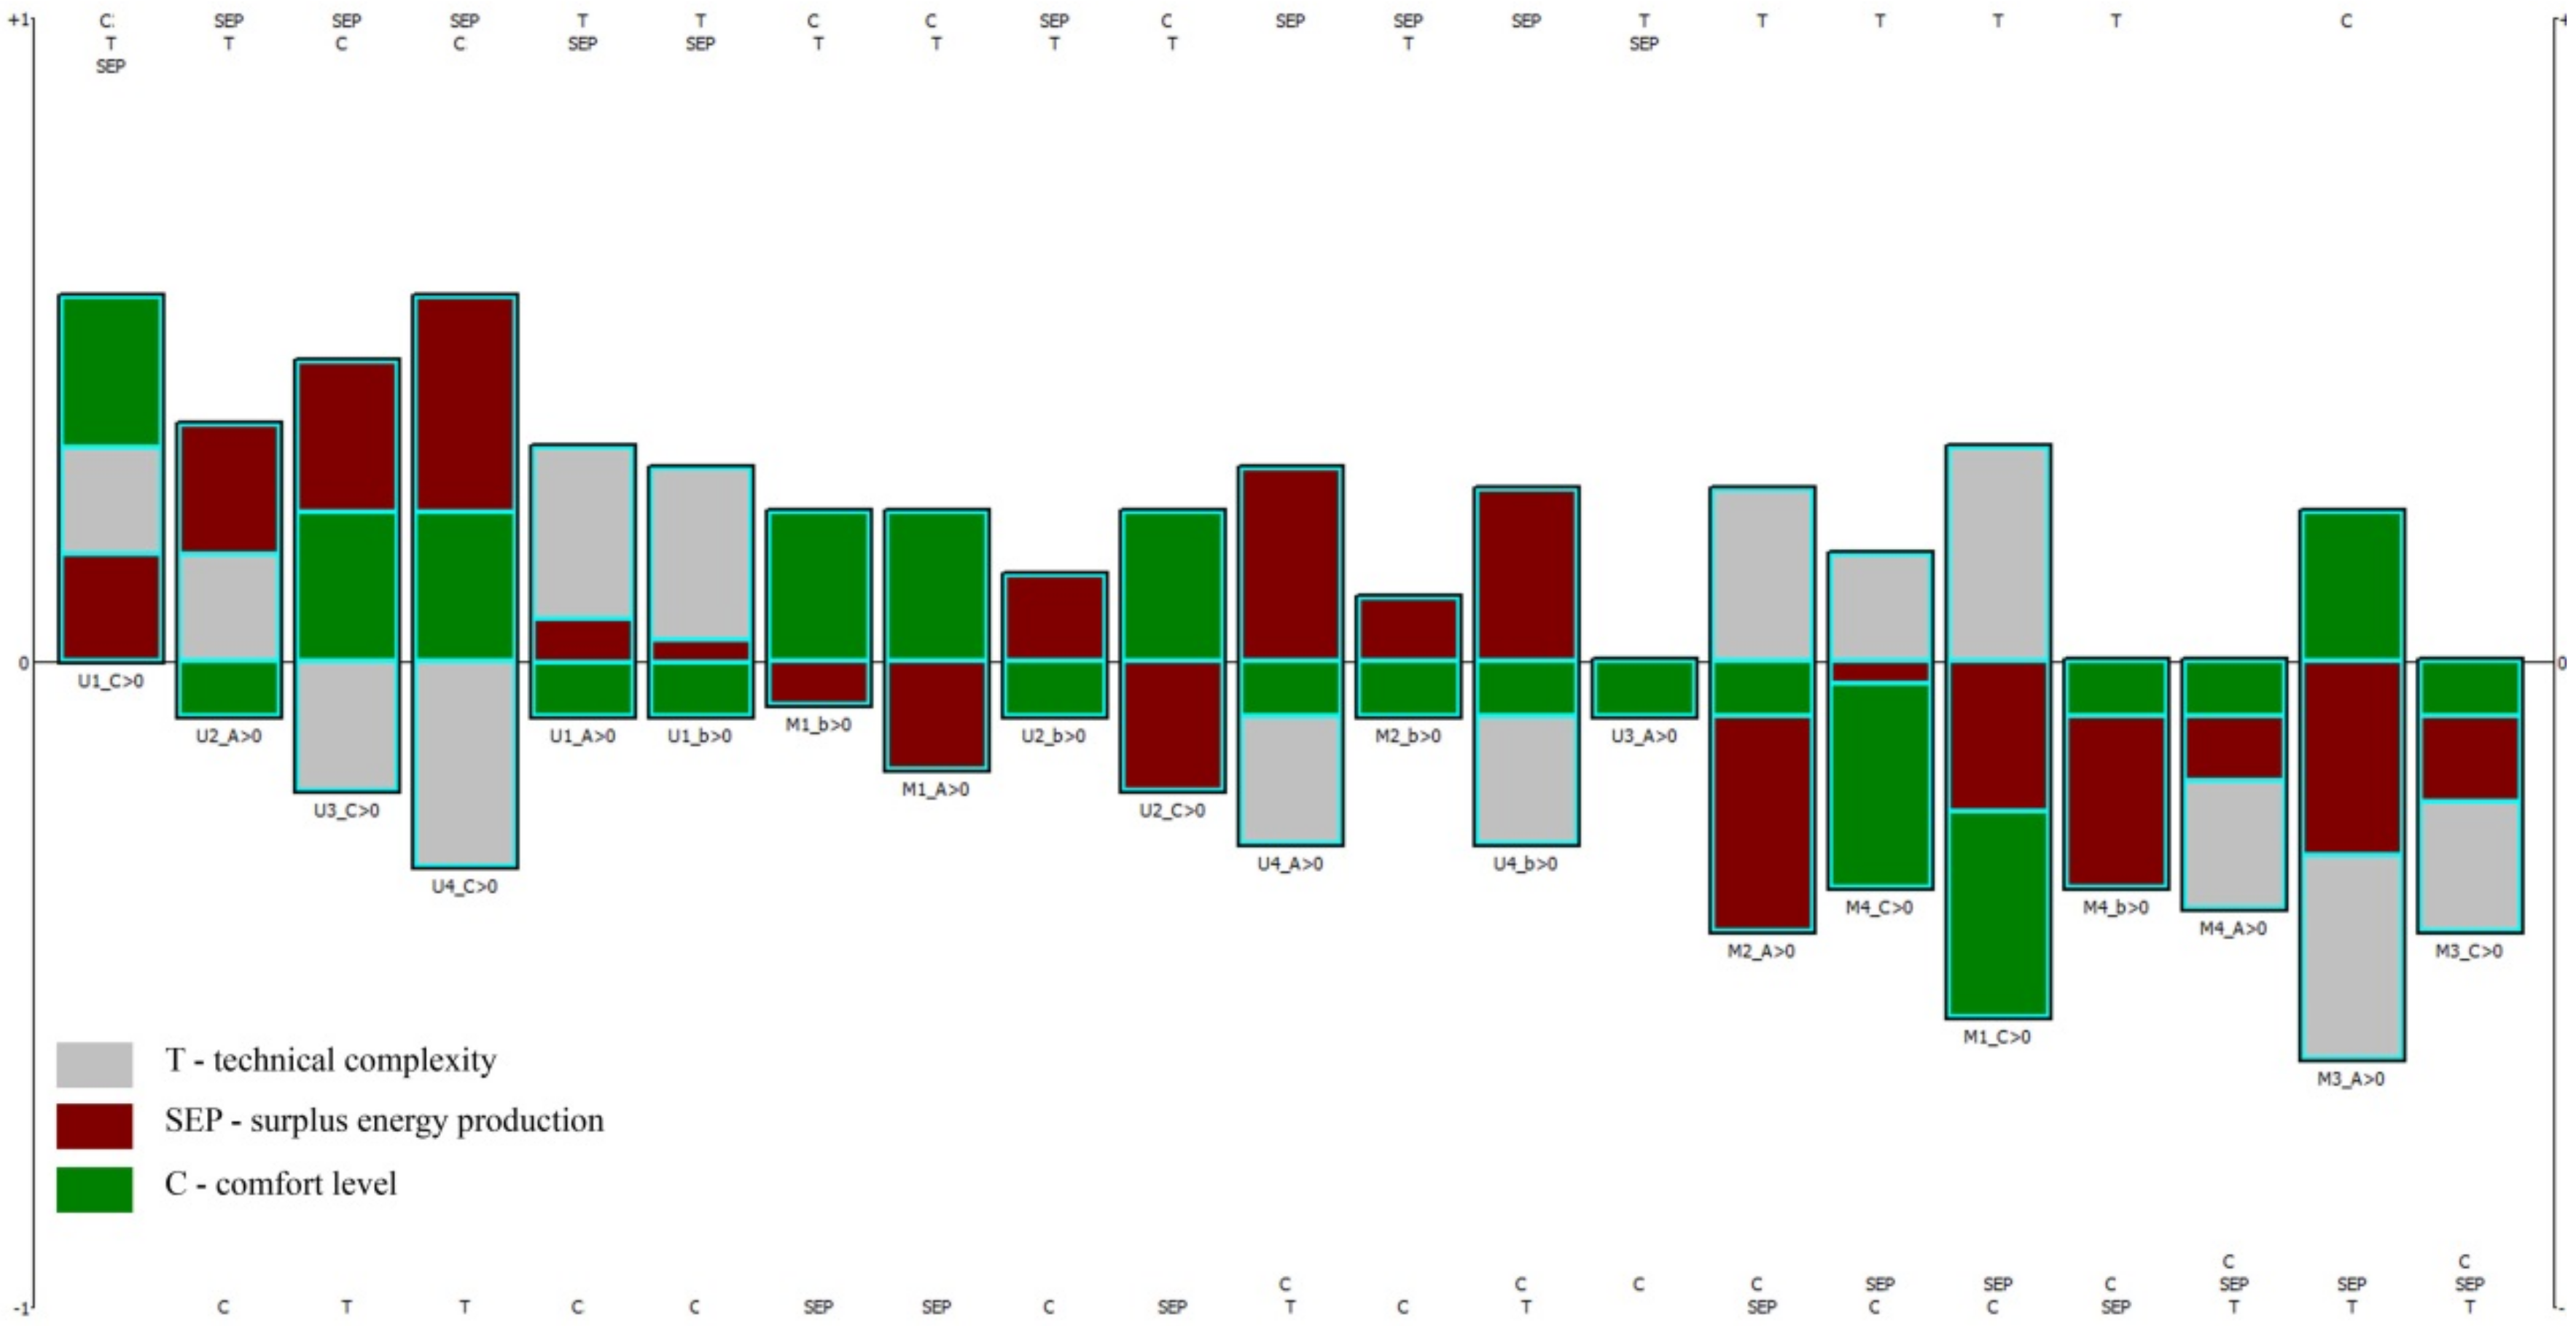
Figure 7 shows the criteria comparison based on technical complexity, surplus energy production and comfort level. Also, in this case, the values are normalised on a scale from −1 to +1. Criteria with values under zero must be considered critical. The dimension of the bar provides evidence of the impact of such a value within the action.
Findings point out the optimal solution; U1_C > 0 is represented by a high comfort level and a medium level of technical complexity and energy production. Interestingly, only one solution emerges with positive values for all the criteria at the current level of information available. However, the procedure allows us to visualise other opportunities. For example, U4_C > 0 shows the highest value of the energy production criterion. In detail, this value is 793, which is much higher than U1_C > 0 (256). These results can be helpful to drive further evaluations on buildings extending or deepening the criteria of analysis.
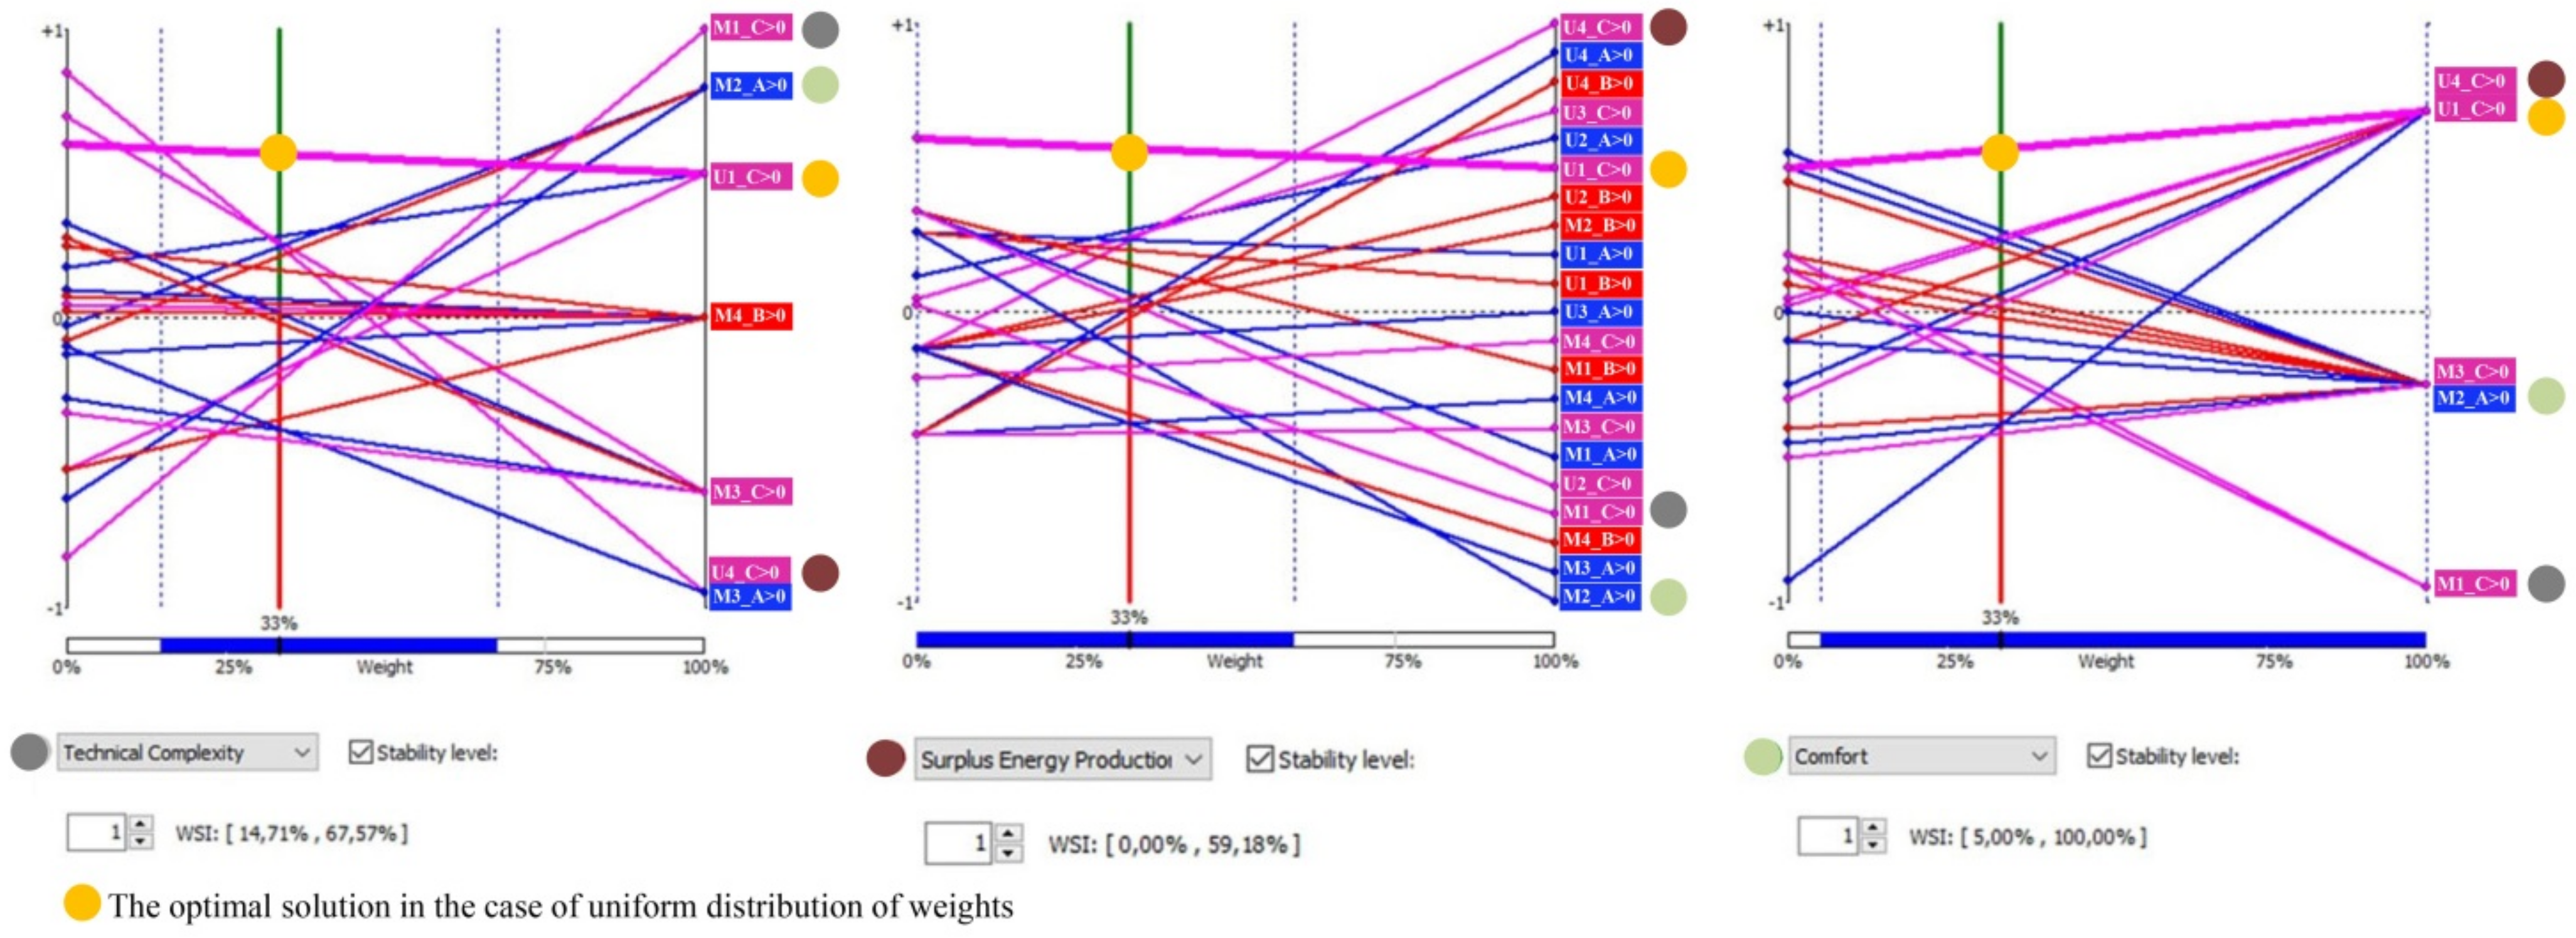
Furthermore, to define the optimal solution, weighting every single criterion is essential. In this regard,
Figure 8 compares the results returned from the variation of the weight assigned, taking into account the three criteria established (T, SEP and C).
Figure 8 displays the line at 33%, representing the values when each criterion has the same weight. The range from 0 to 100% shows how each action varies for the assigned weight. Focusing on this line, it emerges that the U1_C > 0 action (marked in yellow) has a significant positive gap compared toothers. It is the only action that, while varying, remains above the zero line. Incontrast, if one focuses on the criterion of surplus energy production, the action U4_C > 0isat the top of the hierarchical classification. Nevertheless,
Figure 8 provides evidence that this action is placed at the minimum regarding the technical complexity level. However, these variations depend on a preliminary LoD and LoI. Thus, as feedback reported in this procedure, it would be interesting to improve the level of detail concerning exclusively U1_C > 0 and U4_C > 0 to establish a more detailed comparison.
In conclusion, the procedure results allow decision-makers to work within a complex scenario composed of a set of actions and criteria, establishing a range of weights related to a specific circumstance. The significance and usability of the approach proposed to operationalise PEBlocks at the local level is discussed next.
4. Discussion
This study developed and tested a multi-criteria decision making optimisation framework to drive the transformation of a group of existing buildings in a Positive Energy Block. The literature review stressed how the PEBlock is an emerging paradigm and, in this regard, procedures and measurements have not been codified yet. Therefore, this study dealt with an approach to putting a PEBlock into practice.
The approach adopted identified a set of criteria and actions, which were compared to achieve a net-positive balance. It was based on the concept of flexibility and related to the level of detail and level of information locally available. It promotes a strategic approach concerning PEBlock organisation, which may be seen as a process to establish a new form of (self-organised) energy communities, going beyond a mere technical resolution of reducing the energy demand.
The analysis (see
Figure 4) showed that to achieve positive energy is not easy and it requires the combination of energy retrofit and PV integration distributed among the buildings which compose the block. Therefore, findings corroborate the idea of Sougkakis et al. [
37], who stressed the need of procedures allowing decision-makers to combine a set of variables on which to plan the optimal combination of strategies throughout suitable criteria. In addition, in line with Sibilla and Kurul [
36], results focused on how to organise a hierarchical organisation of positive, neutral and passive nodes (i.e., buildings) as PEBlock components. This study further contributes to putting such a hierarchical organisation process into practice, introducing an adaptable and expandable set of criteria to describe the level of information related to the buildings analysed. By doing so, the procedure provides additional measurable parameters to establish appropriate measures to configure PEBlocks. These findings support previous research in the area of low-carbon transition (e.g., [
35]), which links methodologies to improve the scalability of new forms of energy systems integrated at the district level.
Furthermore, according to Cole [
31], the procedure developed emphasises that the PEBlock is not a simple extension of the net-zero energy concept. Indeed, the PEBlock offers new design considerations and promises. In this regard, our findings identify the role of a building as a part of energy infrastructure. As a component of a system, a building is involved in long-term transformation processes. The term system, herein, refers both to urban configuration and the technical apparatus as a whole. This means that the key variables will require a series of negotiations and agreements among stakeholders. Therefore, our findings may be helpful to establish the weight of the parameters (see
Figure 8) according to emerging needs. Moreover, our approach is not simply focused on achieving a positive energy solution but aims to reconcile urban pattern transformations and energy infrastructure evolution to drive the direction toward a low-carbon society. In this regard, additional criteria and actions may be included in the process.
Regarding the technical feasibility concerning a PEBlock as an energy infrastructure, the findings from this study corroborate that of Kolokotsa et al. [
33], whose results mark the road towards positive energy approaches, envisioning the dissemination of predictive control schemes. Undoubtedly, the dissemination of sensors at scale will bring significant advancement in reducing the energy performance gap. However, this represents only a part of the technological innovation that the PEBlock requires to be a reliable energy system. By contrast, our findings seek to extend the effective implementation of the PEBlock as a socio-technical system, promoting an approach to synchronising energy planning measures at scale, not only on the bases of energy consumption and demand relationships but also as a tool to regenerate buildings and part of the city. Here, the relevance of the procedure adaptability and peculiarities concerning local contexts can be included as criteria of the process.
Therefore, this study has provided an open framework that, in line with the results of Bossi et al. [
34], can help establish practical strategies for energy transition within a specific urban context. However, while Bossi et al. focused on a PED agenda, this work pursues a PEBlock framework. Although the PEBlock and PED are two different models, they can co-exist. This is because buildings belonging to a PEBlock can be part of a PED.
The substantial difference is that the PED model works within an urban boundary. Thus, strategies and actions are applied within a well-defined urban area. By contrast, thePEBlock model works by selecting potential buildings. It does not require the definition of an urban boundary, but it entails a list of buildings called to work in association. Therefore, while other studies (e.g., [
39]) tested a multi-objective optimisation approach in organising a PED, this study has proposed PEBlocks as a solution to spread micro low-carbon infrastructure across neighbourhoods, based on a comparison, which takes into account both buildings and urban context peculiarities. Thus, in line with the results of Good et al. [
40], our procedure seeks to achieve an optimal solution across time and space.
Currently, buildings must be placed close to each other because of technical limitations concerning PEBlocks. However, it is expected that these limitations will be outdated (e.g., commercialisation of superconductors or energy storage technologies). In addition, from a social perspective, it is expected that the paradigm of the PEBlock will affect the organisation of self-organised energy communities. This is because energy communities will be based on the possibility of activating peer-to-peer energy exchanges depending on the potential offered by every building.
Therefore, according to the results of Hyytinen and Toivonen [
38], our findings create the background to link the energy service perspective to the perspective of socio-technical transition. Indeed, this study, stressing the potential role of a building within a network of nodes (i.e., active, neutral and passive nodes), raises the need for a new generation of bottom-up and top-down planning processes driven by an appropriate set of innovative tools. As a consequence, the organisation of a PEBlock requires the definition of policy instruments and governance structures, which support their configuration, the so-called technological support network [
32]. Hence, our procedure allows decision-makers to work within a framework to develop innovative managerial practices, develop niches of innovation and test to establish distributed renewable and interactive systems as reliable and feasible alternative socio-technical systems.
5. Conclusions
In conclusion, this study has provided a characterisation of the concept of PEBlocks, developing a preliminary tool to operationalise them. This was conducted by emphasising some issues concerning PEBlocks and stressing their relevance as tools to synchronise social and technical transformation, pointing out the role of PEBlocks in implementing new forms of environmental and spatial organisation such as self-organised energy communities.
In detail, this paper has:
- •
Established a set of three preliminary criteria, which can be extended by taking into account the LoD and LoI locally available.
- •
Selected a list of 21 potential positive energy scenarios among 300 possible combinations concerning a block composed of three buildings, where only one acts as a positive node.
- •
Individuated the optimal solution (U1_C > 0) represented by a high level of comfort and a medium level of technical complexity and energy production.
- •
Compared the optimal solution individuated with others based on the weight assigned to the criteria, stressing possible variations and feedback.
- •
Developed a multi-criteria optimisation framework to manage PEBlock organisation across time and space.
- •
Discussed the PEBlock as a feasible and reliable socio-technical infrastructure.
The procedure has some limitations. The first limitation concerns the number of criteria adopted. However, it was clearly stated that the structure of such criteria could be adapted in quality and quantity. In this regard, this procedure was offered as an open-ended structure. It can be modified depending on the local peculiarities and scopes. Its structure is horizontally (e.g., new criteria) and vertically (e.g., improving the criteria accuracy) expandable. Thus, it refers to the ability to work within a level of uncertainty, developing plausible and flexible scenarios. A second limitation is the accuracy of the quantitative and qualitative values attributed to the adopted criteria. In terms of surplus energy production and comfort, for example, they can be improved according to the level of detail associated with the buildings involved. The numerical values assigned to measure the technical complexity can be associated with more sophisticated algorithms, which can better represent the distance in terms of feasibility between the combinations adopted.
Improving the accuracy of the criteria is also associated with new research areas. One of the future branches of research is related to the development of digital twin platforms for PEBlocks. It is well-known that the digital twin platform works by taking into account the level of information and level of detail associated with the project’s components. A dedicated digital twin platform for PEBlocks may be practical to make evident the level of information and detail associated with each criterion. In addition, the development of a dedicated digital platform may increase the applicability and reliability of this study. For example, qualitative indicators such as the comfort criterion could be evaluated quantitatively or integrated with statistical analysis. Similarly, the PEBlock organisation processes can be integrated with fuzzy logic system techniques to include a vast number of buildings instead to be limited to three. This also opens new research avenues in energy modelling based on new concepts such as PEBlock reference rather than building reference to develop new business models, making PEBlocks a reliable and feasible sustainable energy system.


