Article

Atmospheric Storm Anomalies Prior to Major Earthquakes in the Japan Region

by
Friedemann T. Freund
1,
Mohammad Reza Mansouri Daneshvar
2,* and
Majid Ebrahimi
3
1
GeoCosmo Science and Research Center, NASA Ames Research Park, Code SCR, Moffett Field, Mountain View, CA 94035-1000, USA
2
Department of Geography and Natural Hazards, Research Institute of Shakhes Pajouh, Isfahan 81589-49191, Iran
3
Department of Physical Geography, Hakim Sabzevari University, Sabzevar 96179-76487, Iran
*
Author to whom correspondence should be addressed.
Sustainability 2022, 14(16), 10241; https://doi.org/10.3390/su141610241
Submission received: 1 July 2022 / Revised: 13 August 2022 / Accepted: 16 August 2022 / Published: 17 August 2022

Abstract

:
Connections between atmospheric perturbations, e.g., thunderstorm activity, and major earthquakes are investigated along with the lithosphere–atmosphere coupling mechanism, concerning the earthquake prediction models. The present research attempts to recognize a possible link between atmospheric processes (rainfall, storms) and subsequent earthquakes (M > 6) across a wide area around Japan. Earthquake data and upper-atmosphere sounding data related to the Severe Weather Threat (SWEAT) index and Skew-T plots were obtained from two Japanese radiosonde stations, Hachijojima and Kagoshima. Using the cross-correlation function (CCF) method, it is shown that SWEAT conditions existed within 30 days before six major earthquakes in 2017 in the Japan region. The Seismo-Climatic Index (SCI) reached a mean of 2.00, 7–8, and 13–14 days before these earthquakes, indicating thunderstorms and extreme weather conditions, further supported by Skew-T plots. Low-pressure systems, deviating from the mean by as much as −50 to −250 m, and hot spots of increased precipitation ranging from ~80 to ~140 mm rainfall within 24 h were observed to be geographically associated with these earthquake events. The anomalous atmospheric conditions can be understood based on increased air ionization at the ground-to-air interface due to the influx of positive-hole charge carriers that are stress-activated deep in the lithosphere and spread through the rock column. When the positive electronic charge carriers are accumulated at the lithosphere, preferentially at topographic highs, some steep electric fields are observed capable of field-ionizing the air. The airborne ions then act as condensation nuclei for atmospheric moisture, thermal updrafts, cloud formation, and a statistically significant precipitation increase. This research was conducted based on some experimental indicators in a very important seismological region to examine the successfulness of the proposed mechanism and the given indicators as the possible proxies of pre-earthquake precursors. Hence, the main practical implication of the research can highlight a sustainable way for improving the managerial tools in the field of earthquake prediction.

1. Introduction

The electric circuit and potential differences arising from thunderstorm activities and air mass convections significantly influence the interactions between the lithosphere and the atmosphere/ionosphere system [1]. Convective flow and upward air motion anomalies can be noted several days before major earthquakes. For instance, Daneshvar and Freund [2] pointed to the synoptic scale of abnormal thunderstorm activity, air turbulence, and atmospheric/ionospheric variations that lasted for several weeks above the epicentral area of the M 8.3 (magnitude = 8.3) Chile earthquake in 2015. In the case of an M 7.8 large earthquake in the Iran–Pakistan border region in 2013, refs. [3,4] have pointed to powerful pre-earthquake thunderstorm activity influencing a chain of atmospheric anomalies and perturbations of the total electron content (TEC) in the ionosphere about one week prior to the seismic event. Likewise, in Ref. [5] low-pressure centers over the Japan Sea associated with gas emanations were identified one week before the M 7.2 Kobe earthquake of 1995.
Connections between thunderstorm activity and major earthquakes are assumed as a type of atmosphere–ocean–solid Earth coupling called “stormquakes”, suggesting that wind-driven ocean waves can generate earthquakes [6]. However, a broader evaluation of the atmospheric and ionospheric anomalies before major seismic events reveals that the pre-seismic signals are widely distributed in the spatial and temporal domain (e.g., [2,7,8,9,10,11,12,13,14]). For instance, atmospheric blocking events and thunderstorm-associated anomalies in a seismological region may be considered a potential pre-earthquake indicator [10].
During thunderstorm activity, sudden and abnormally high precipitations are commonly observed. Similar atmospheric anomalies have been investigated as an indicator of impending earthquake activity, for instance, across the Middle East (e.g., [2,15]). Earlier, researchers have pointed to a correlation between heavy rainfall and seismicity in the European region [16,17,18,19]. In the case of Japan, researchers provided evidence for TEC anomalies up to ten days before major earthquakes (M > 6) [12]. Some scholars identified anomalous pre-earthquake atmospheric signals within 30 days before some large earthquakes in Japan, including an M 7.0 event in 2016 [8]. Other studies suggest a systematic occurrence of atmospheric anomalies near the epicentral area within 5 days before the M 9.0 earthquake in 2011 in Japan [20].
The significant tectonic events of Japan arise from the combination of subduction/accretion, volcanism, and arc spreading/collision. In this regard, both the extensive volcanic activity and the strong M = 9.0 earthquake of Tohoku-Oki in 2011 occurred due to the subduction of the Pacific Plate beneath the northeastern Honshu along the Japan Trench [21]. Investigations of the connection between the aforementioned seismic events and their atmospheric environments in the Japan region are actively pursued. For instance, researchers described changes in atmospheric pressures linked to the above-mentioned M = 9.0 earthquake [22]. Similarly, other scientists have pointed to atmospheric variations represented by the outgoing long wavelength radiation (OLR), total electron content (TEC) anomalies, ultralow and extremely low frequency (ULF/ELF) anomalies, atmospheric interference with radio emission, and ionospheric perturbations linking these observations to the aforementioned M = 9.0 earthquake, but offering different interpretations [23,24,25,26]. Hayakawa [27] claimed significant progress in the study of earthquake precursors in Japan, in particular concerning the signature of electromagnetic emissions.
In the present study, major earthquakes (M > 6) in 2017 were included to detect relations between seismic events and preceding extreme atmospheric conditions in Japan and the surrounding region. The given phenomena are expected as atmospheric precipitation, wind, and severe weather index in this research. Likewise, extreme events are defined as detective anomalies based on a departure of the current observation value from the long-term average reference [28,29]. For this purpose, the possible links between the atmospheric storm and subsequent seismic activity were investigated across earthquake preparation zones in Japan. The focus of this study is on the statistical analysis using the SCI and the CCF methods between atmospheric variables and earthquake indicators on upper-air sounding data, e.g., the SWEAT and the spatial visualization of climatic variables such as the precipitation rate and geopotential height to detect evidence for enhanced thunderstorm activity before major earthquakes. Ultimately, this paper discusses the appearance of positiveholes charge carriers at the ground-to-air interface as a possible physical mechanism for the aforementioned variations. The concept of positiveholes activated in stressed rocks in seismically active regions provides the basis for the coupling between the lithosphere and ionosphere layers through the ionization of the atmosphere [30]. During the build-up of tectonic stressed rocks, the positiveholes are accumulated over a wide area, especially at topographic highs, and steep electric fields at the ground-to-air interface have resulted in a plethora of non-seismic indicators [31]. Atmospheric-related anomalies such as precipitation hot spots before major earthquakes are consistent with this overall concept [10].
A literature review of the previously established linkages between atmospheric environment and earthquake occurrence revealed a volume of reports of precursory phenomena such as the variations of the precipitation rate [2,14], thermal infrared radiation, air temperature, latent heat flux, and outgoing long wave radiation [32]. Previously, the trigger mechanism between lithosphere and atmosphere was based on a “top-down” approach rather than a result of processes at depth (e.g., “bottom-up”). The notable examples were the intraplate earthquakes in the continental US [33,34] and rainfall-triggered earthquakes in Germany [16,17]. These examples invoked a simple physical basis, revealing that the infiltration of meteoric water into the subsurface serves to decrease the effective stress at depth (lubricating fault planes and facilitating brittle material failure). Furthermore, increased subsurface pore fluid pressure has been used to explain silent slip events [35], remotely triggered seismicity [36], and volcanic phenomena (e.g., [37]), proposing that the heavy precipitation resulted in a “top-down” pressure pulse and infiltration from the lithosphere to seismogenic depths over time. The recent model of lithospheric-atmospheric-ionospheric-magnetospheric coupling (LAIMC) is a mechanism with the initial process of EM disturbance and air ionization, triggering reactions from the ground level up to the ionosphere and magnetosphere of the Earth [38]. However, the research hypothesis in the link between climate and earthquake is the triggering mechanism of field-ionization, influenced by positiveholes at the ground-to-air interface (i.e., “bottom-up” effect) as defined by [30,39].
The importance and novelty of the research are the robust statistical indices for climatic storms, e.g., the SWEAT index, as the possible precursor of triggering mechanism of pre-earthquake air ionization in the study area. Besides, the operation of the statistical examination of Skew-T plots, extracted from the upper-air sounding data, is another significance of this research. The research result anticipates that the real-time monitoring of these measurable data would improve the basic knowledge of earthquake prediction in the Japan region and also in other seismological regions of the world.

2. Study Area

Japan and its surrounding regions were chosen as the study area limited by (20–50°) N and longitudes (120–150°) E from eastern China to the tectonic trench, extending from Taiwan and China to far eastern Russia. This study area is taken as the seismic preparation zone by collecting all spatial and temporal data and analyzing the possible interactions between the seismic activities and the atmospheric storms. According to [40], the seismic preparation zone is a region affected by the mechanical stresses outward from the hypocenter with observable and measurable pre-earthquake signals [14]. Due to the geographical distribution of six selected earthquakes (M > 6), the study area can be considered a seismic zone. According to the website https://earthquake.usgs.gov/earthquakes/search, accessed on 15 December 2019, of the United States Geological Survey (USGS) [41], 1089 earthquakes of M > 3 and 7 earthquakes of M > 6 occurred in the study region in 2017. One major event on 3 September 2017 was removed from the study due to the North Korean underground nuclear explosion. The list of the earthquakes (six cases with M > 6) and the geographical distribution of their epicentral locations are given in Table 1 and Figure 1a,b, respectively. The first and second cases refer to the M = 6.0 earthquake in east Hirara on 9 May 2017 and the M = 6.0 earthquake in south Naze on 26 July 2017. The third and fourth cases refer to the M = 6.1 earthquake in west Chichi-Shima on 9 September 2017 and the M = 6.1 earthquake in east Kamaishi on 20 September 2017. The fifth and sixth cases refer to an M = 6.2 earthquake in east Ishinomaki on 6 October 2017 and an M = 6.0 earthquake in south Hachijo-Jima on 9 November 2017.
As mentioned in the previous works (e.g., [3]), the different focal depths of the earthquakes could influence the preceding time of the climatic precursors before the earthquakes. In the present research, the mean hypocenter depths of all earthquakes were estimated equal to 10–12 km, except for the Chichi-Shima earthquake with a focal depth of 450 km. However, its notable evidence should be investigated for a set of plentiful different cases. Hence, this parameter was removed from this research.
Limiting the earthquake sampling cases is related to avoiding the complicated analysis affected by huge data selection. For example, earthquake occurrences were observed by M > 5 during 76 days in the study region. Hence, the analysis focused on the six major earthquakes (M > 6), where these high magnitude datasets are composed and followed by a number of events, e.g., M > 5. Meanwhile, concerning relationships between earthquakes and non-seismic precursors, the correlation conventionally increases with the magnitude threshold of the seismic catalog [42].
The geological setting of the study area is characterized by the interactions between the North America plate, the Pacific plate, the Philippine Sea plate, and the Eurasia plate. The Pacific plate is being subducted beneath Hokkaido and Honshu, along the eastern margins of the Sea of Okhotsk from the North American plate in the north to the Philippine Sea plate in the south. This setting is responsible for creating the Japan Trench and its chains of islands and volcanoes. Similarly, the Philippine Sea plate is subducted under the Eurasia plate extending from Taiwan China to southern Honshu, comprised of the Nansei-Shonto trench [43].

3. Data and Methods

3.1. Data Preparation

After the seismic data collection, including seismic parameters of earthquake frequency and magnitude from USGS, the upper-atmosphere sounding data, vertical atmosphere profiles, and Skew-T plots were obtained from the two radiosonde stations Hachijojima (code: 47678 with a balloon launched a platform for the radio-transmitting device) and Kagoshima (code: 47827 with a manned-balloon launching platform for the radio-transmitting device). To summarize, the upper-atmosphere sounding data is part of the atmospheric data, which can be gathered using a balloon-launched radiosonde instrument from the near-surface (~1000 geopotential height) to 16,500 m above ground level in the station (~100 geopotential height). On this basis, the vertical profile of the atmosphere parameters can be drawn through day-by-day monitoring above the station. One of the drawing plots of vertical air profile is named the Skew-T, which includes the high-resolution vertical profile of air mass temperatures. The Skew-T plot comprises several indices derived from radiosonde, e.g., Lifted index [44], Showalter index [45], and SWEAT index [46,47], which are often used to discriminate between ordinary and severe convection of air masses, incorporating thermodynamic as well as kinetic formation mechanism over each station [48].
The data comprised of the SWEAT index and wind speed at 2000 m above ground level were extracted from the University of Wyoming’s upper-atmosphere sounding database via (https://weather.uwyo.edu/upperair/sounding.html, accessed on 15 December 2019) in the diurnal and re-analyzed scale ranges during all 365 days of 2017 [49]. The distribution of the radiosonde network in Japan and the location of the Hachijojima and Kagoshima stations are shown in Figure 1c, obtained from the Japan Meteorological Agency (JMA) [50] via (https://www.jma.go.jp/jma/en/Activities/upper/upper.html, accessed on 15 December 2019). The basic upper-atmosphere data for all case studies (regarding 6 earthquake events) were obtained from the Hachijojima station. To complete the data set, specifically for the dates 9 May 2017 and 26 July 2017, the Kagoshima station was used.
Besides, daily precipitation rate timeseries data, based on the Tropical Rainfall Measurement Mission (TRMM) project, were extracted from the Asia Pacific Data Research Center (APDRC) [51] via (https://apdrc.soest.hawaii.edu/las/getUI.do, accessed on 15 December 2019) for the Hachijojima (33–34° N × 139–140° E) and Kagoshima (31–32° N × 130–131° E) stations. A visualization of the TRMM precipitation data was created as time-averaged maps in the 4th version of the Geospatial Interactive Online Visualization and Analysis Infrastructure (GIOVANNI) [52] program via (https://giovanni.gsfc.nasa.gov/giovanni, accessed on 20 January 2020), maintained at NASA Goddard Earth Sciences Data and Information Services Center. The daily reanalysis database of NOAA/Physical Sciences Laboratory [53] was used to map the composite anomaly of geopotential height at level 500-hPa for detecting the definite storm centers, via (https://www.esrl.noaa.gov/psd/data/composites/day, accessed on 20 January 2020) based on the normal climatology period (1981–2010).
Furthermore, the global volcanism program data from the National Museum of Natural History (NMNH) [54] in New York was taken to discriminate between seismic events and the effects of volcanic eruptions in the region under study via (https://volcano.si.edu/search_eruption.cfm, accessed on 10 April 2020). Three volcanic eruptions were detected in 2017: Aira (code: 28208), Kirishimayama (code: 282090), and Nishinoshima (code: 284096). The geographical distribution of the volcanoes and calderas in Japan and the surrounding region is shown in Figure 1d, drawn using data from the 4th version of the national catalog of active volcanoes in Japan [55] via (https://www.data.jma.go.jp/svd/vois/data/tokyo/STOCK/souran_eng/menu.htm, accessed on 10 April 2020), edited by the Japan Meteorological Agency and Volcanological Society of Japan.

3.2. Data Analysis

The first step in the statistical data analysis of this study is to define the cross-correlation function (CCF) based on the diurnal time-lag correlation. This CCF helps identify the time lags between atmospheric predictors and seismic indicators. These time lags can be of the order of days until a build-up of stress (e.g., anomalous impact) becomes noticeable in the environment [56,57,58,59,60]. In this study, three atmospheric pre-earthquake variables are considered: the precipitation rate, the wind speed at 2000 m above ground level, and the SWEAT index.
Among the aforementioned variables, SWEAT is a significant weather predictor [61], reflecting air perturbations and severe weather conditions from radiosonde data plus incorporating kinetic thermodynamics [46,47]. Based on work by [48], and [62], the dimensionless SWEAT index can be written as:
S W E A T = 12 T d 850 + 20 ( T T 49 ) + 2 f 850 + f 500 + 125 ( S + 0.2 )
where, Td850 is the dew point (°C) at 850 hPa, and f850 and f500 are the wind speed (knots) at 850 hPa and 500 hPa, respectively. TT is an air temperature index (°C) between 850 hPa and 500 hPa. S is the wind shear between 850 and 500 hPa representing the wind direction (0–360°). The weather severity classification is classified as low, high, and extreme for SWEAT values <200, 200–300, and >300, respectively [62].
In the last step of the study, a multidisciplinary index titled seismo-climatic index (SCI) is used based on the variations of earthquake indicators before and after atmospheric event predictors as defined by [10] and modified by [63]:
S C I = ( F r e q A × M e a n A × M a x A ) / ( F r e q B × M e a n B × M a x B )
where, SCI is the seismo-climatic index, FreqA and FreqB are the number of earthquakes after and before the selected episode of storm events, MeanA and MeanB are the mean magnitude of earthquakes after and before the storm events, MaxA and MaxB are the largest magnitude of earthquakes after and before the storm events. In this study, the selected days for storm episodes were within a period based on the confirmed range of lag-day intervals, demonstrated by the CCF method, typically comprised of 7–8 days or 13–14 days prior to the main shocks. SCI values above 2.00 and even more above 3.00 indicate a possible relation between the storm events and subsequent seismicity.
Certainly, the major earthquakes (M > 6) are followed by a series of small earthquakes, entitled swarm clusters, which are defined as the accumulated earthquakes in the time and space after the main shock. In the present study, the frequency and magnitude of these small earthquakes are assumed in the SCI within 30 days before and after the selected storm episodes that happened 1–2 weeks prior to the main shocks. The reason for this method is that the enhancing seismicity (both main shocks and subsequent swarm clusters) dominantly occurred following the triggering mechanism of pre-earthquake air ionization, e.g., atmospheric thunderstorm anomalies.

4. Result and Discussion

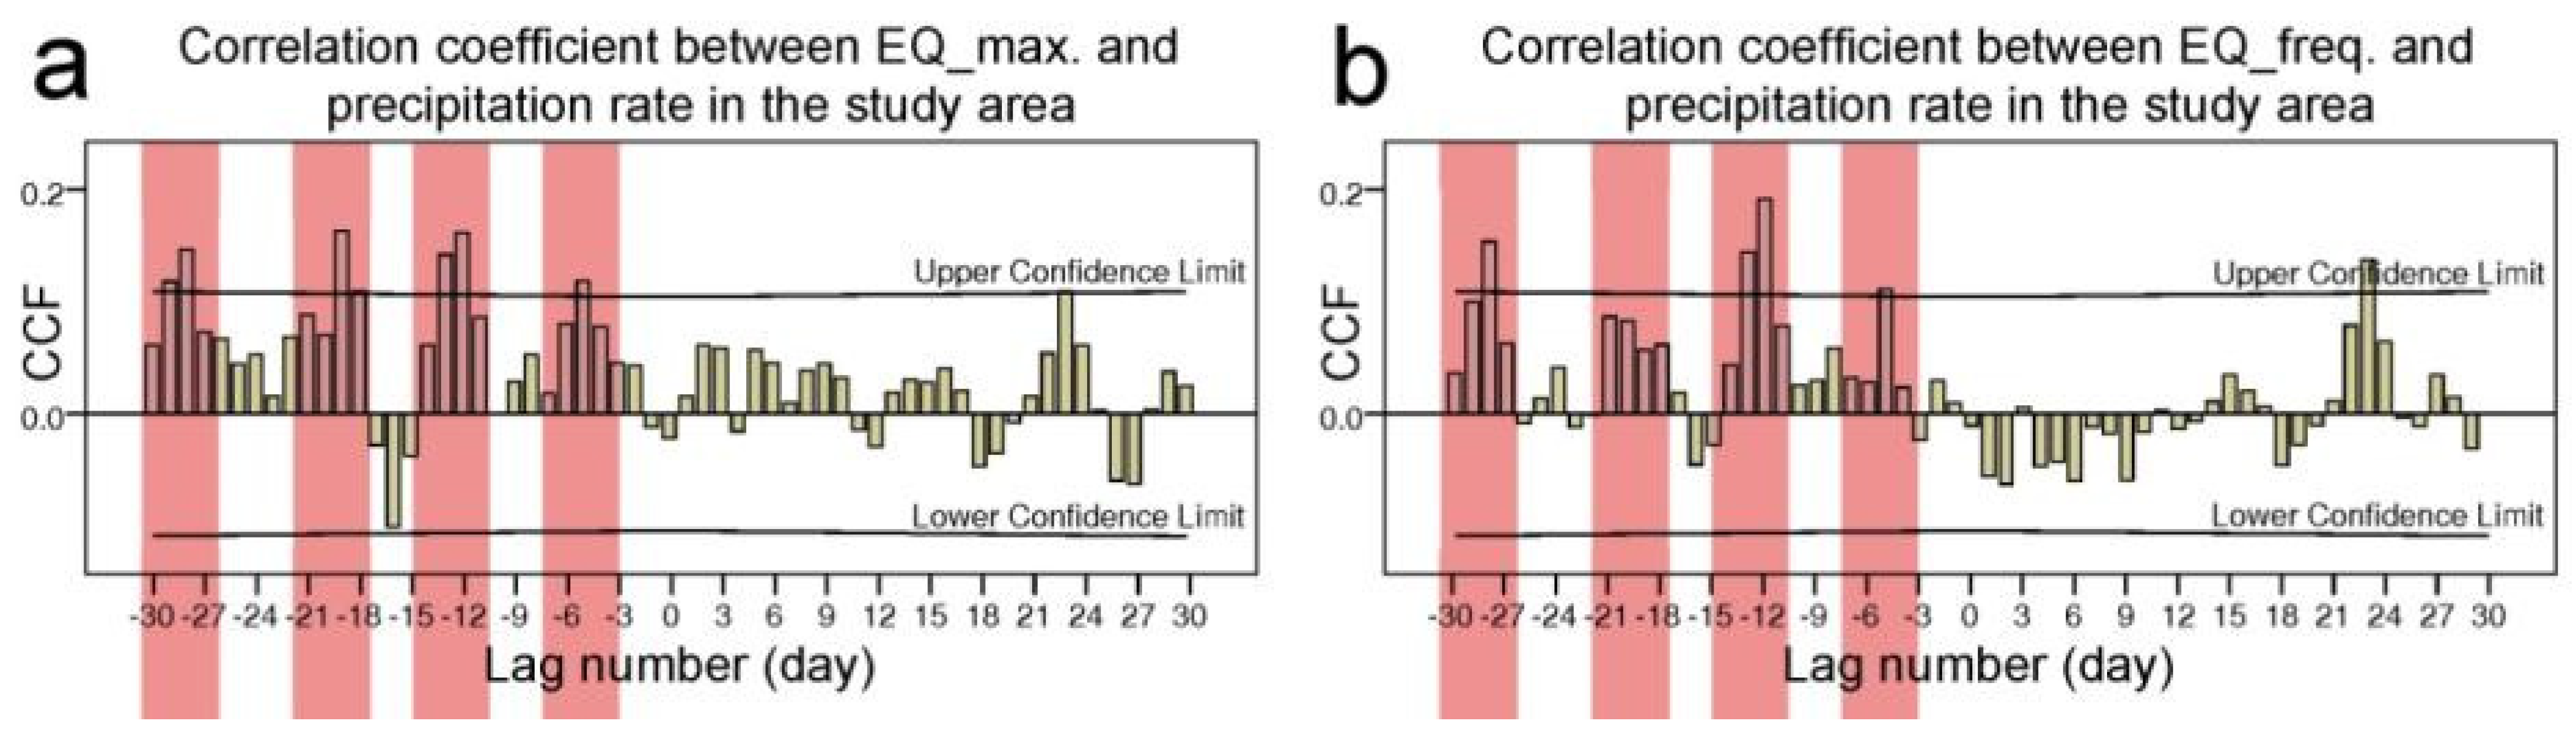
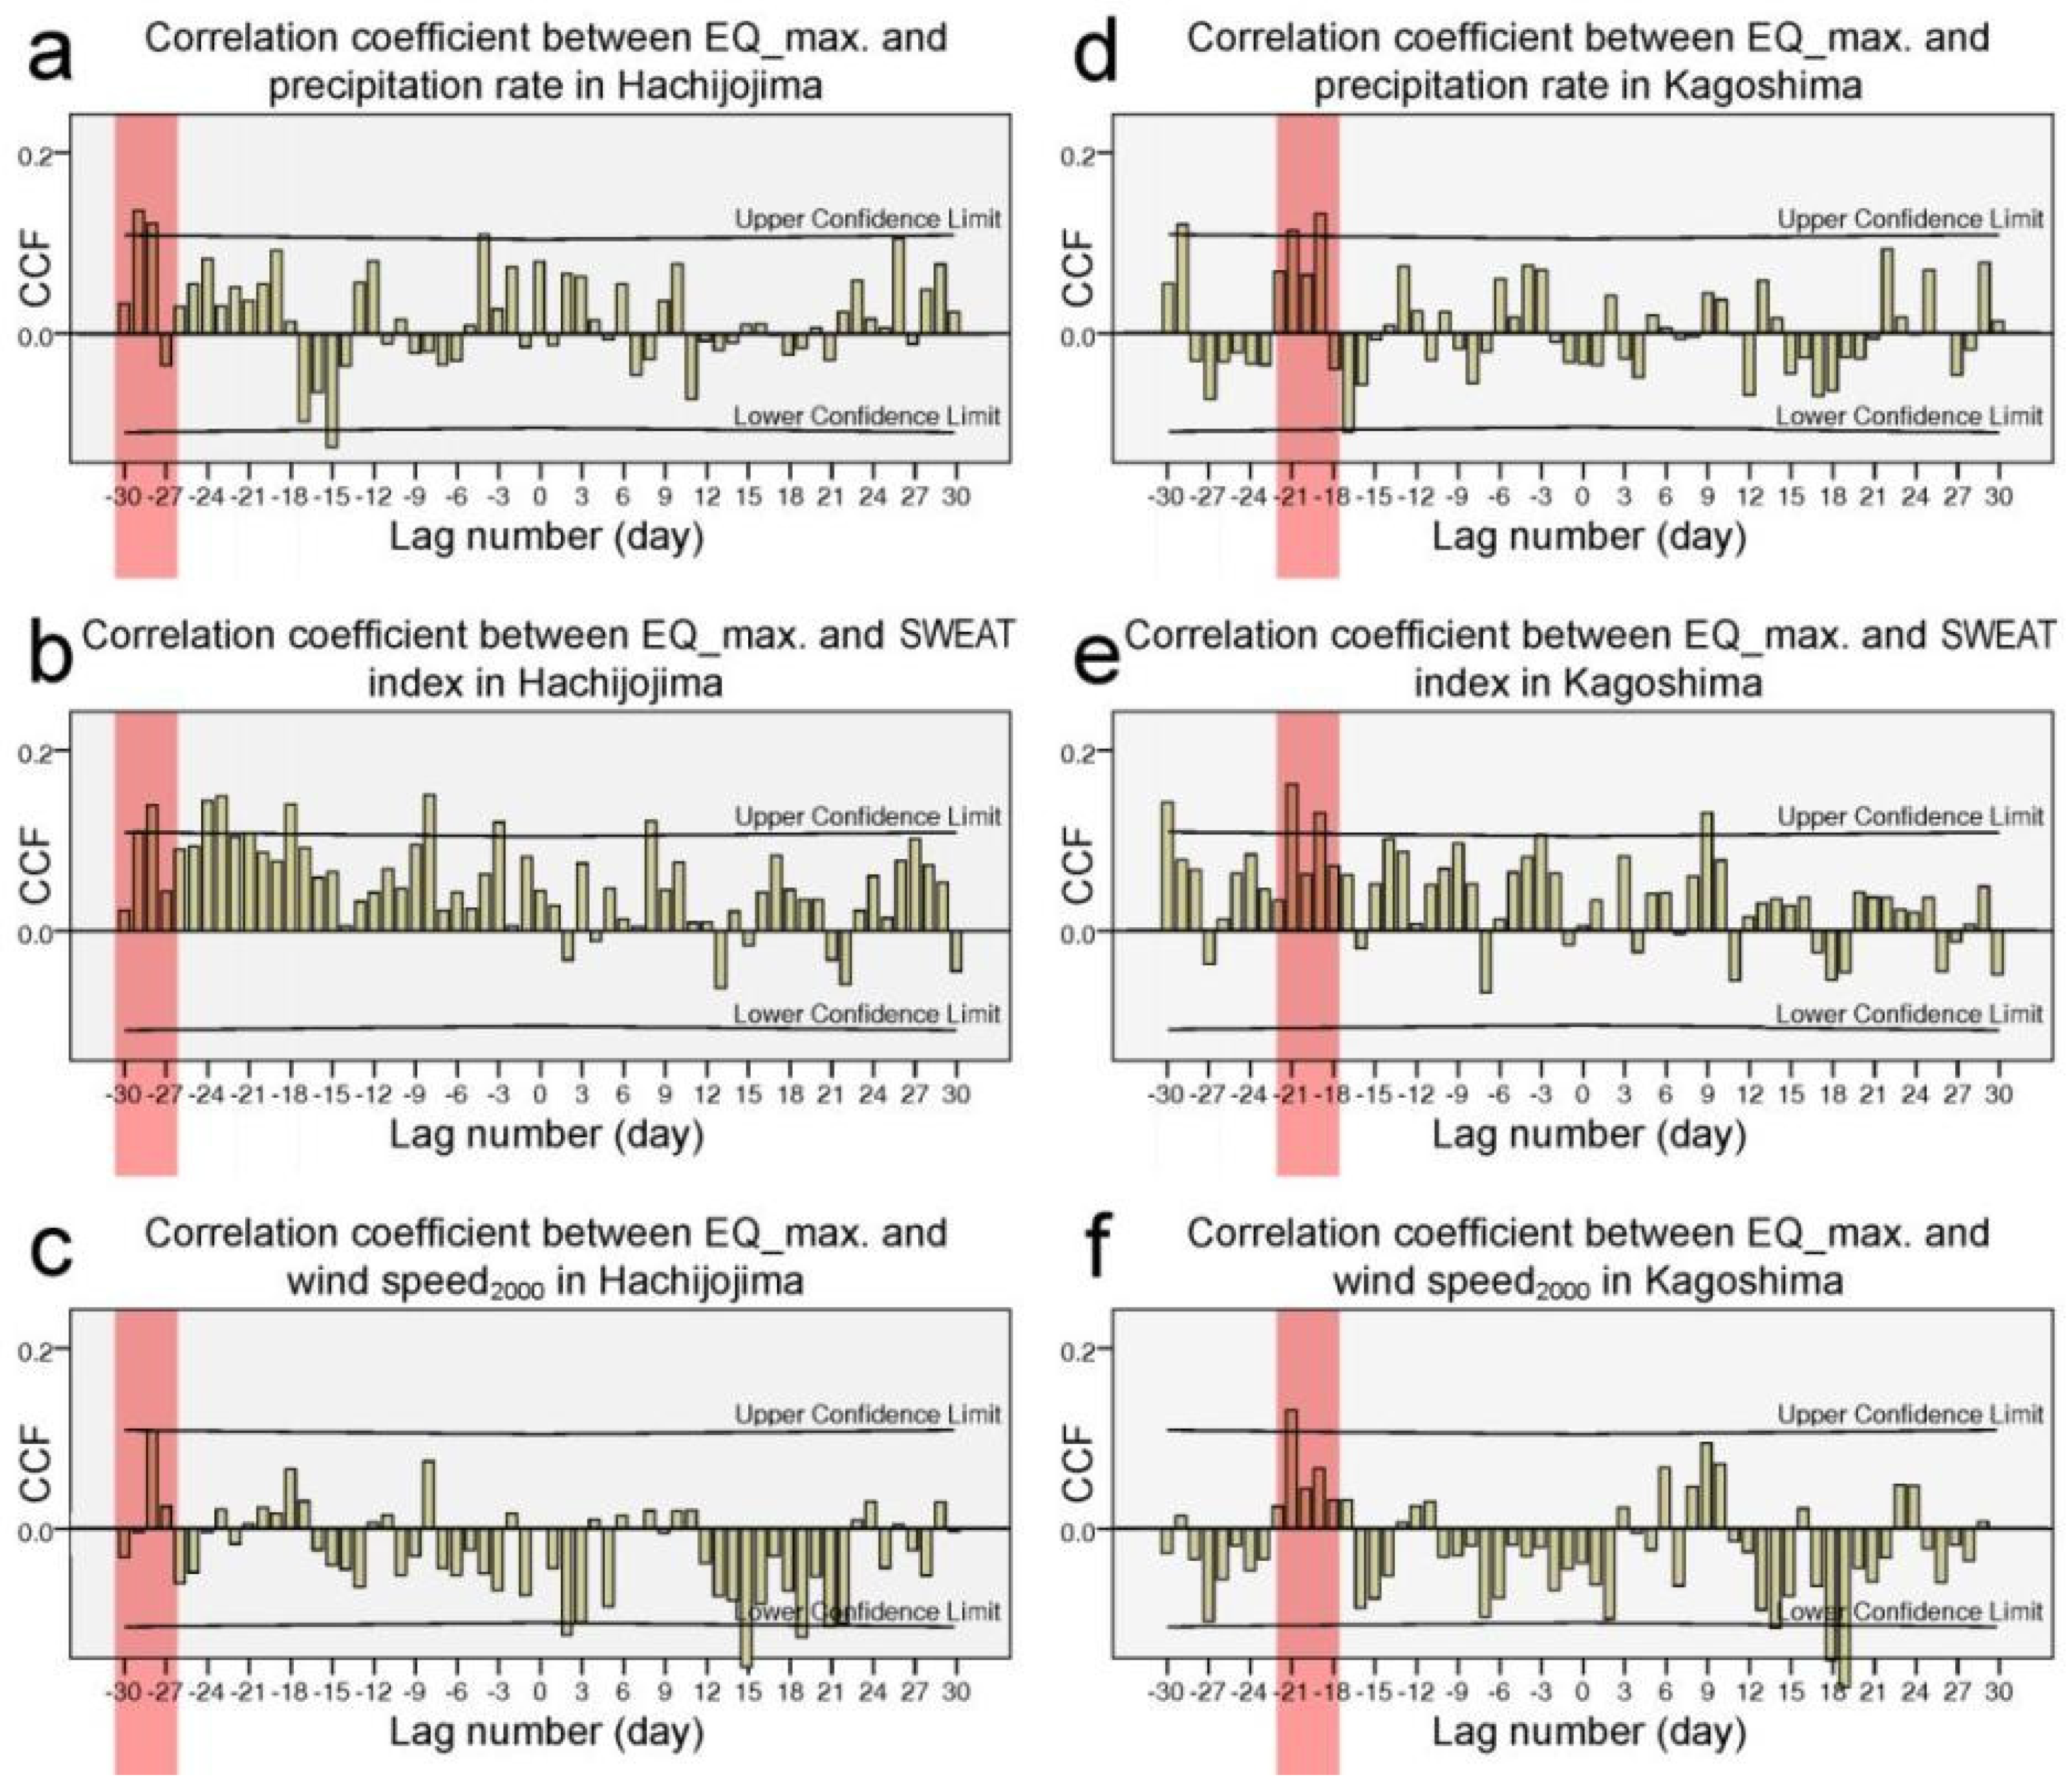
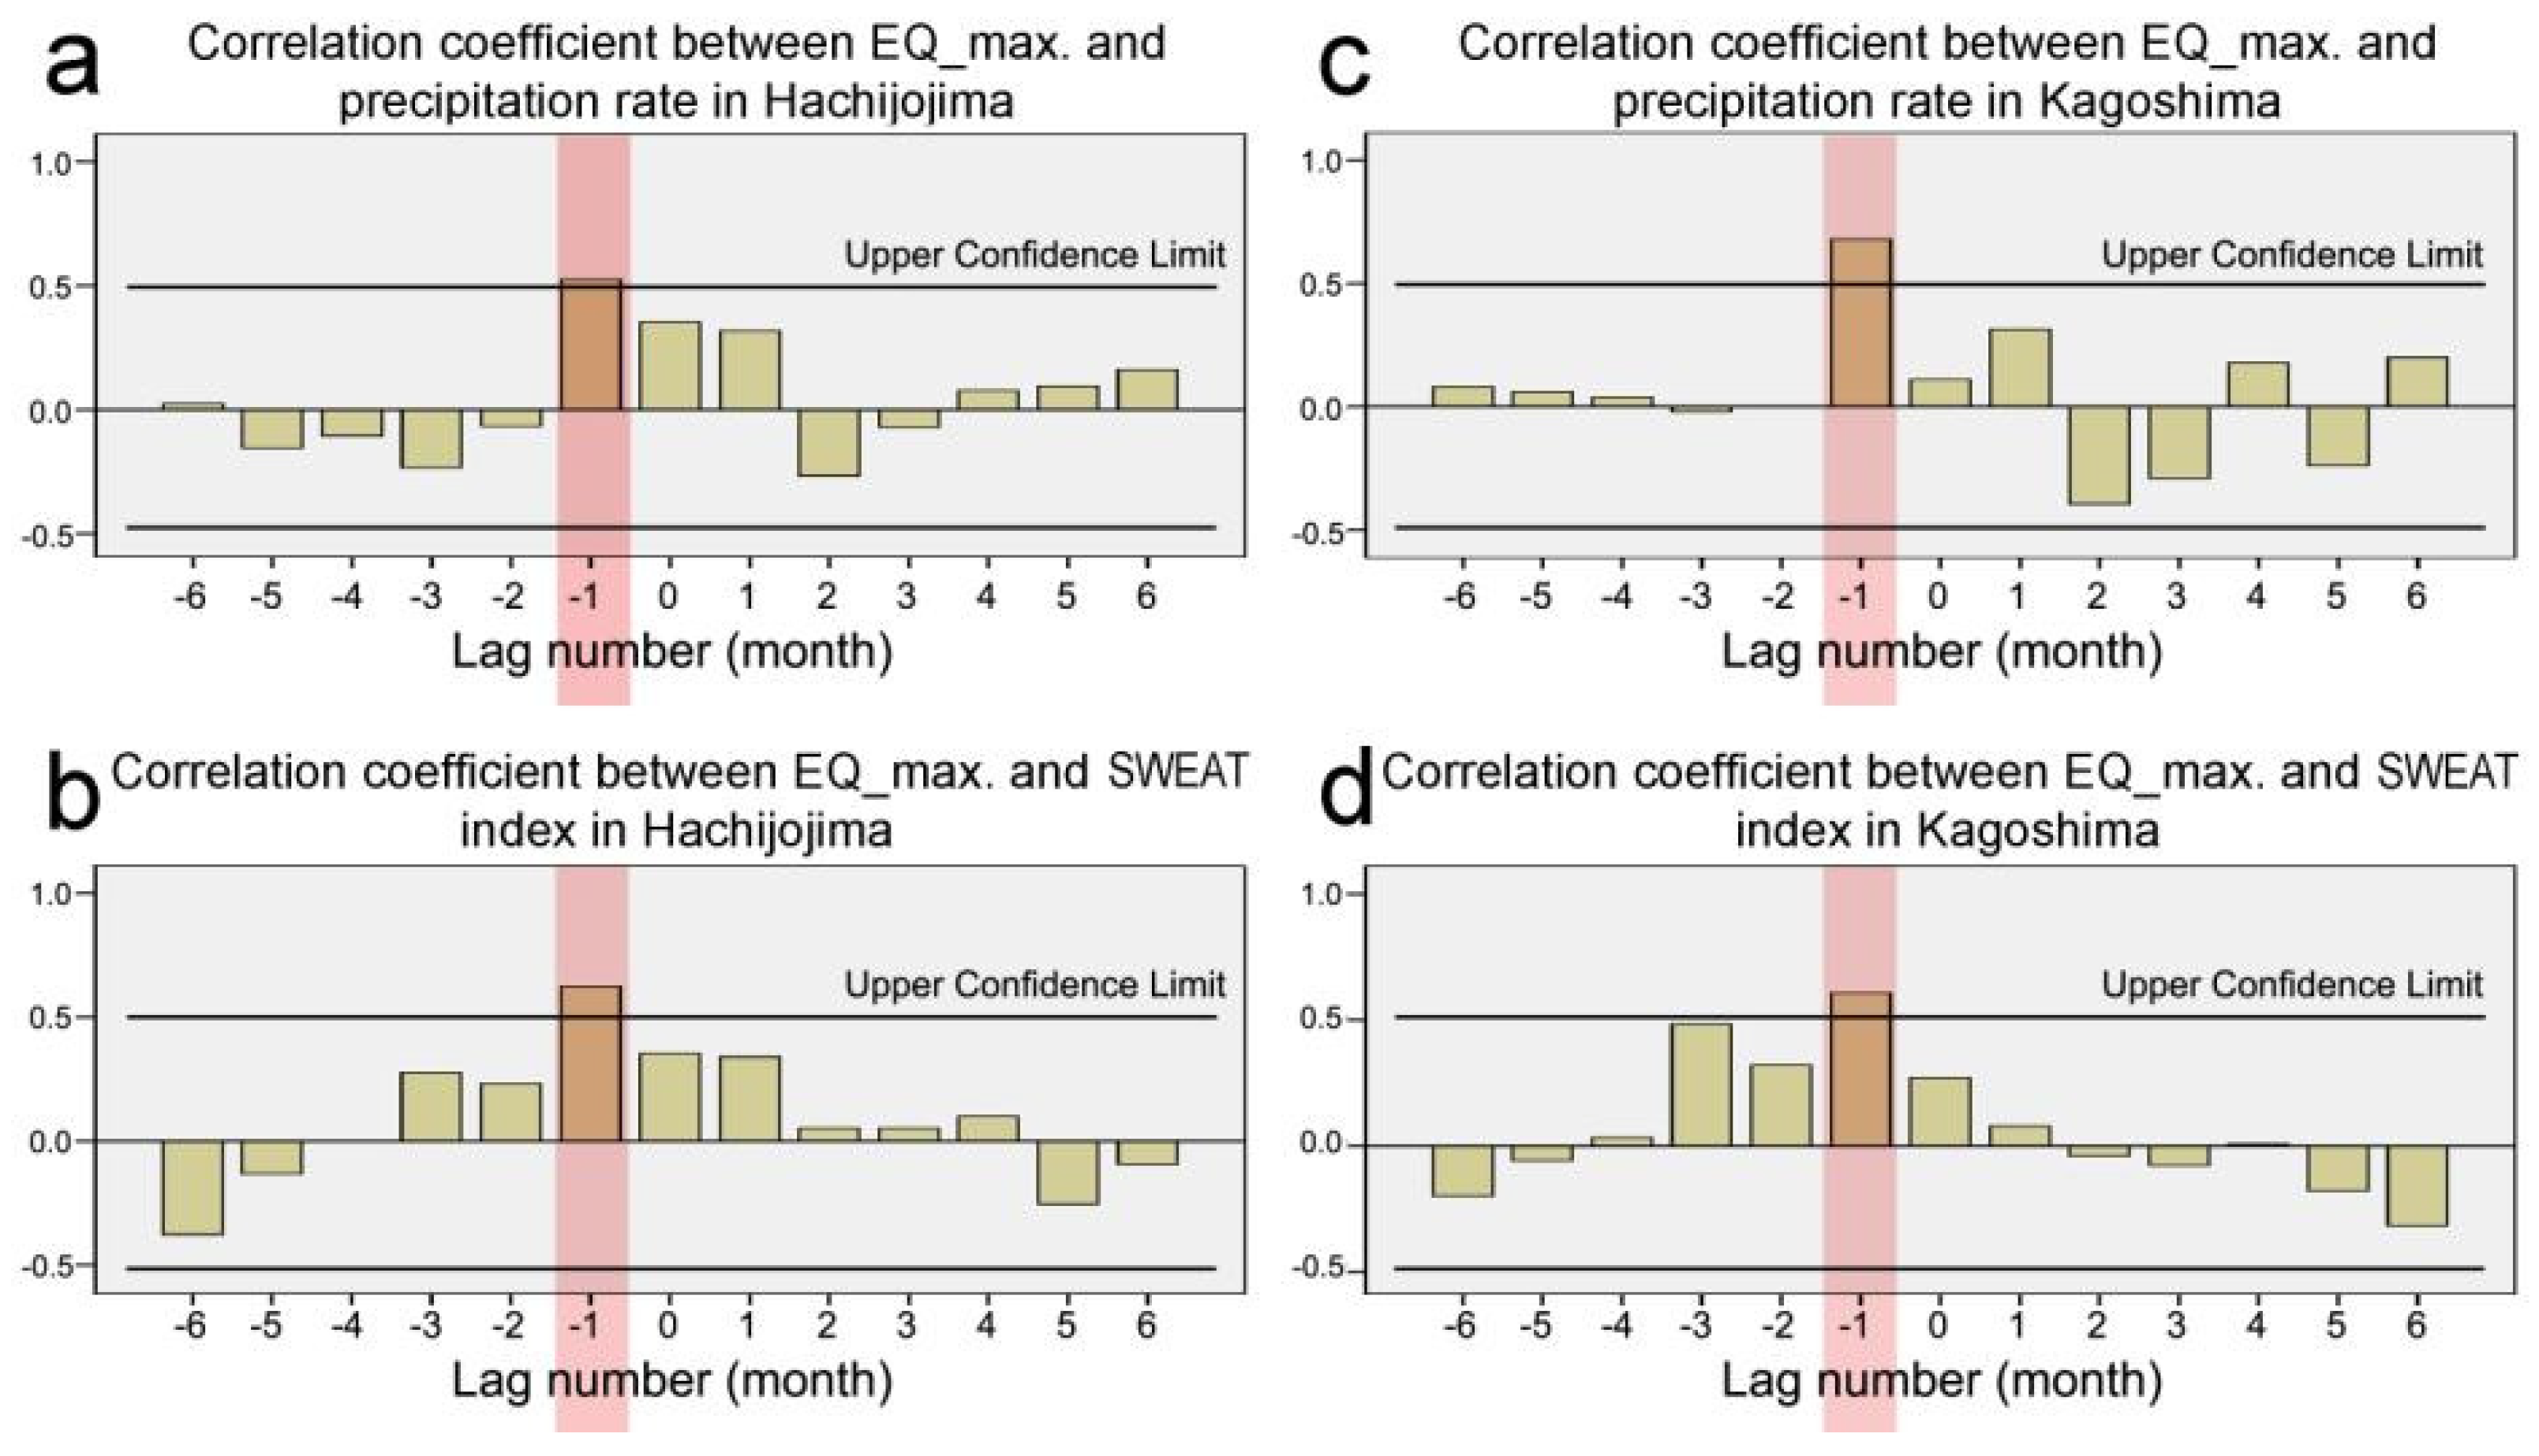
4.1. Cross-Correlation Function
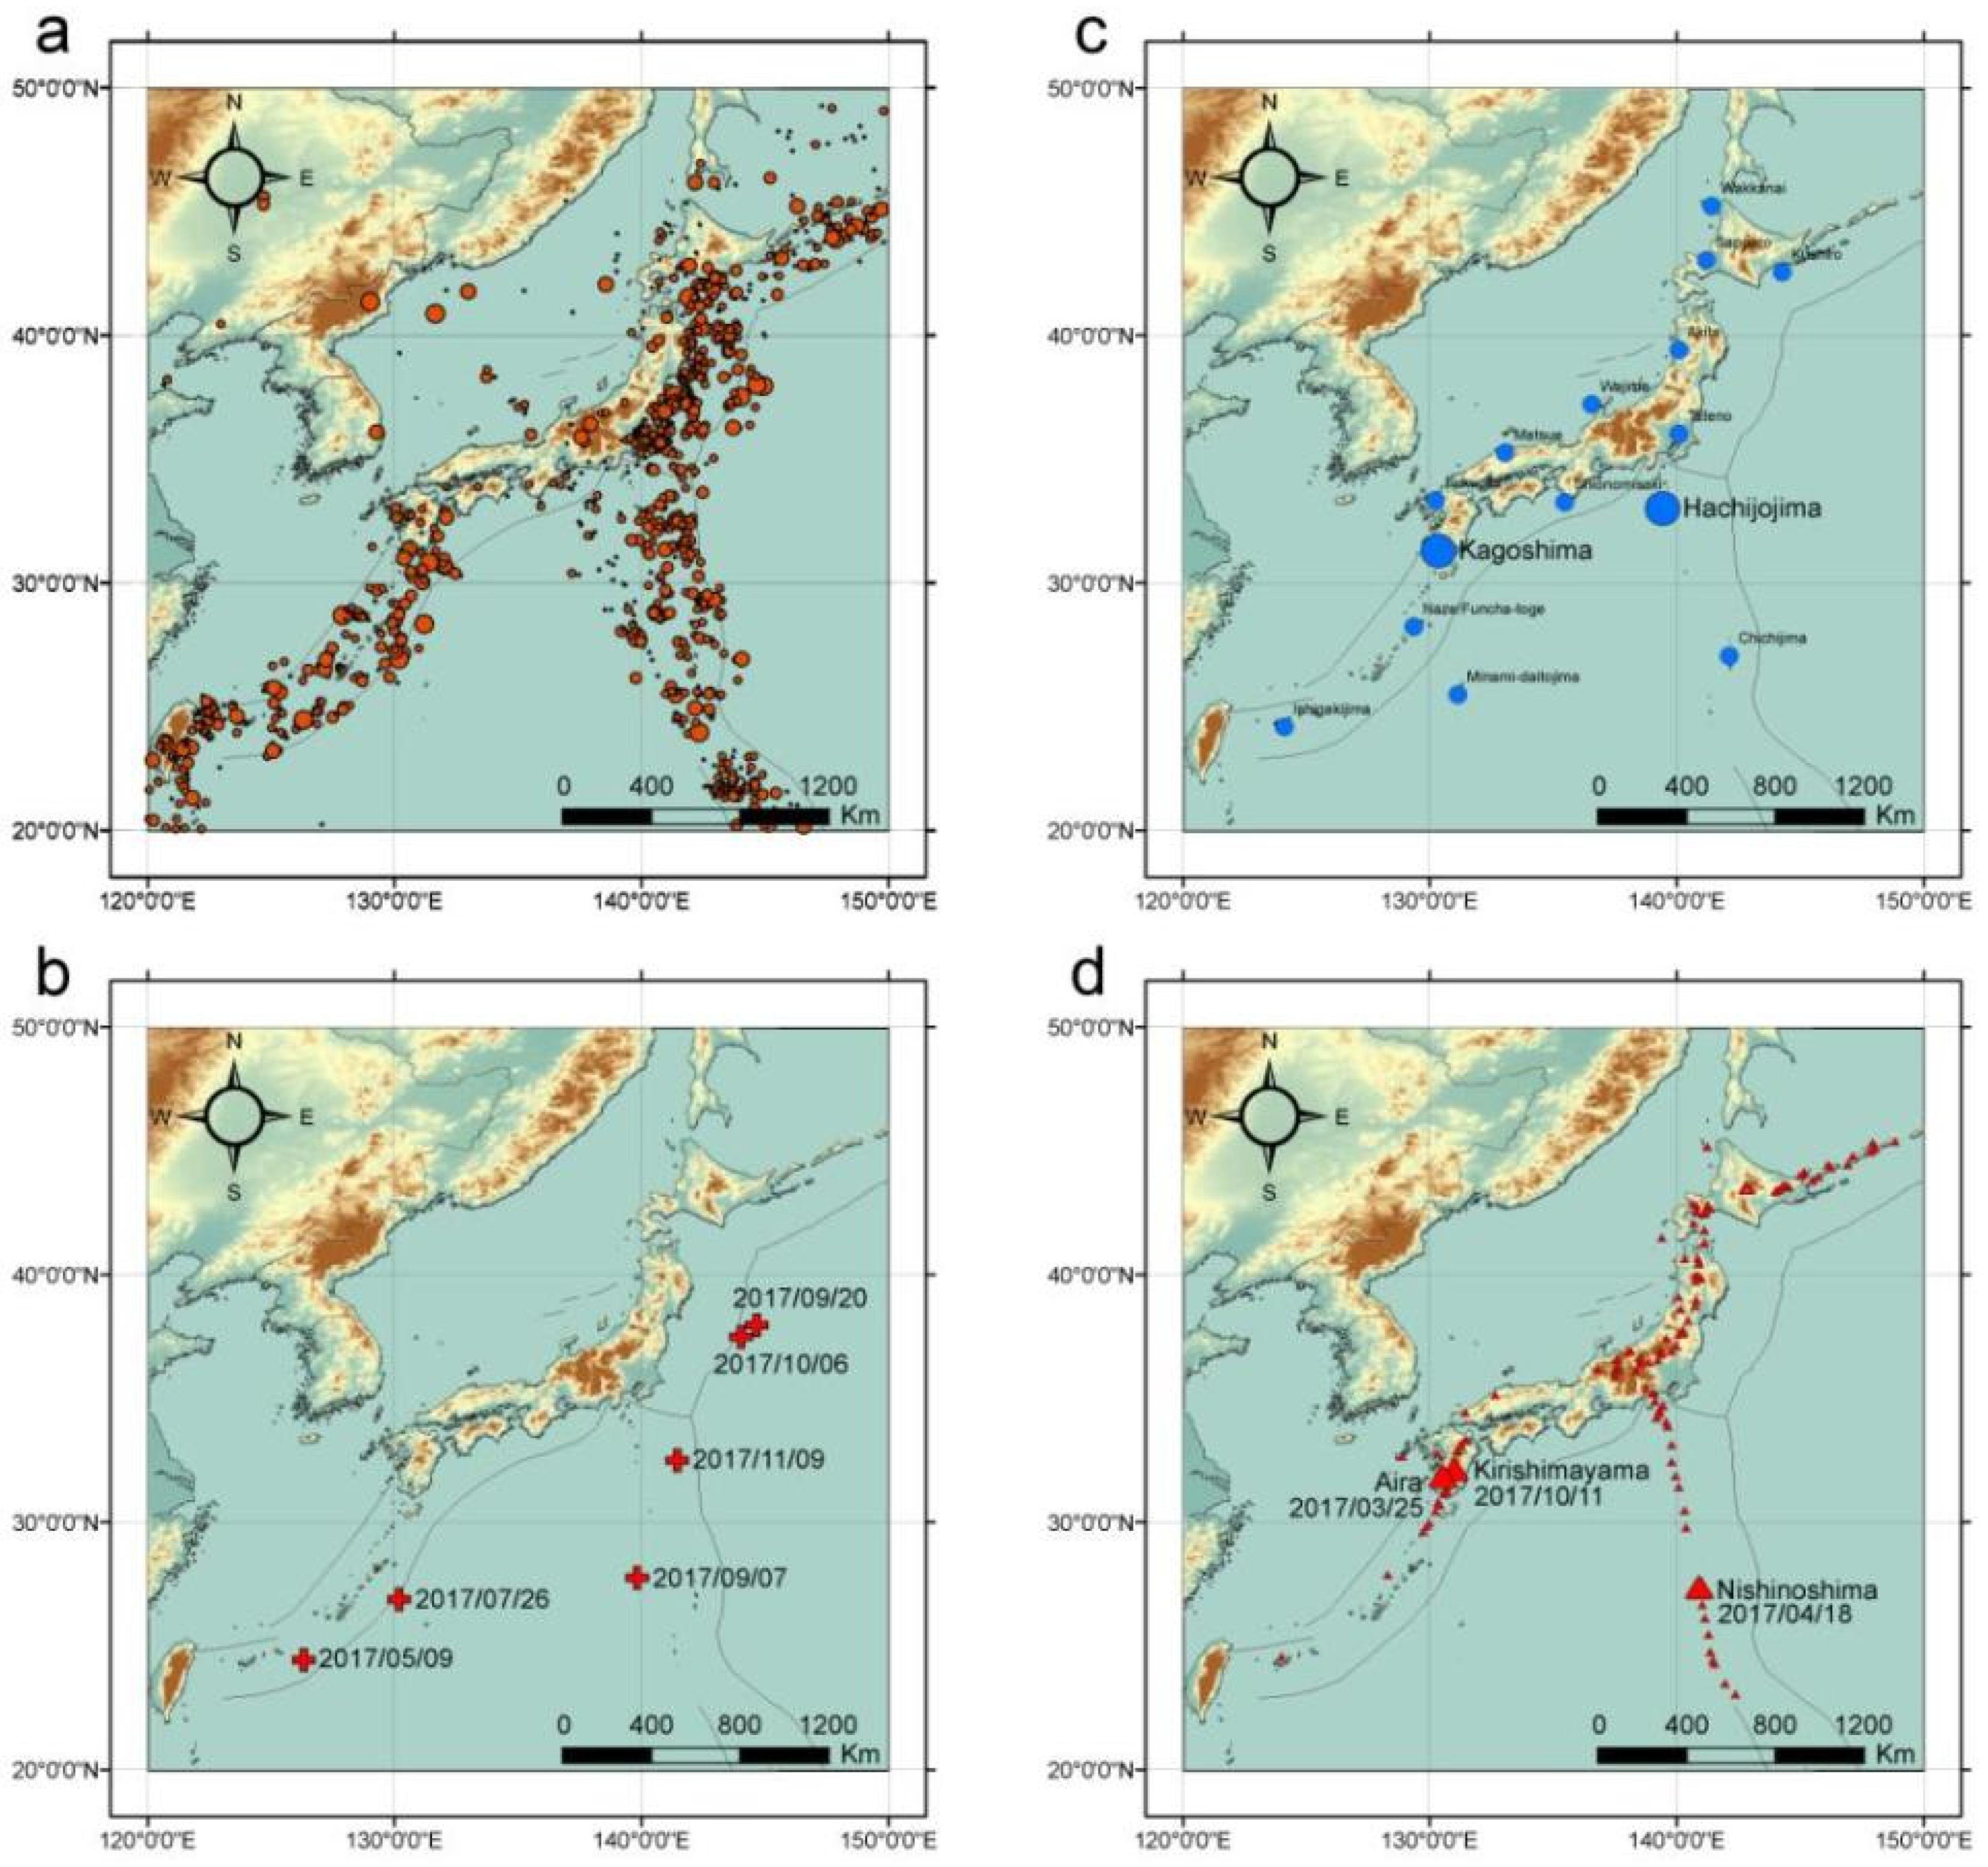
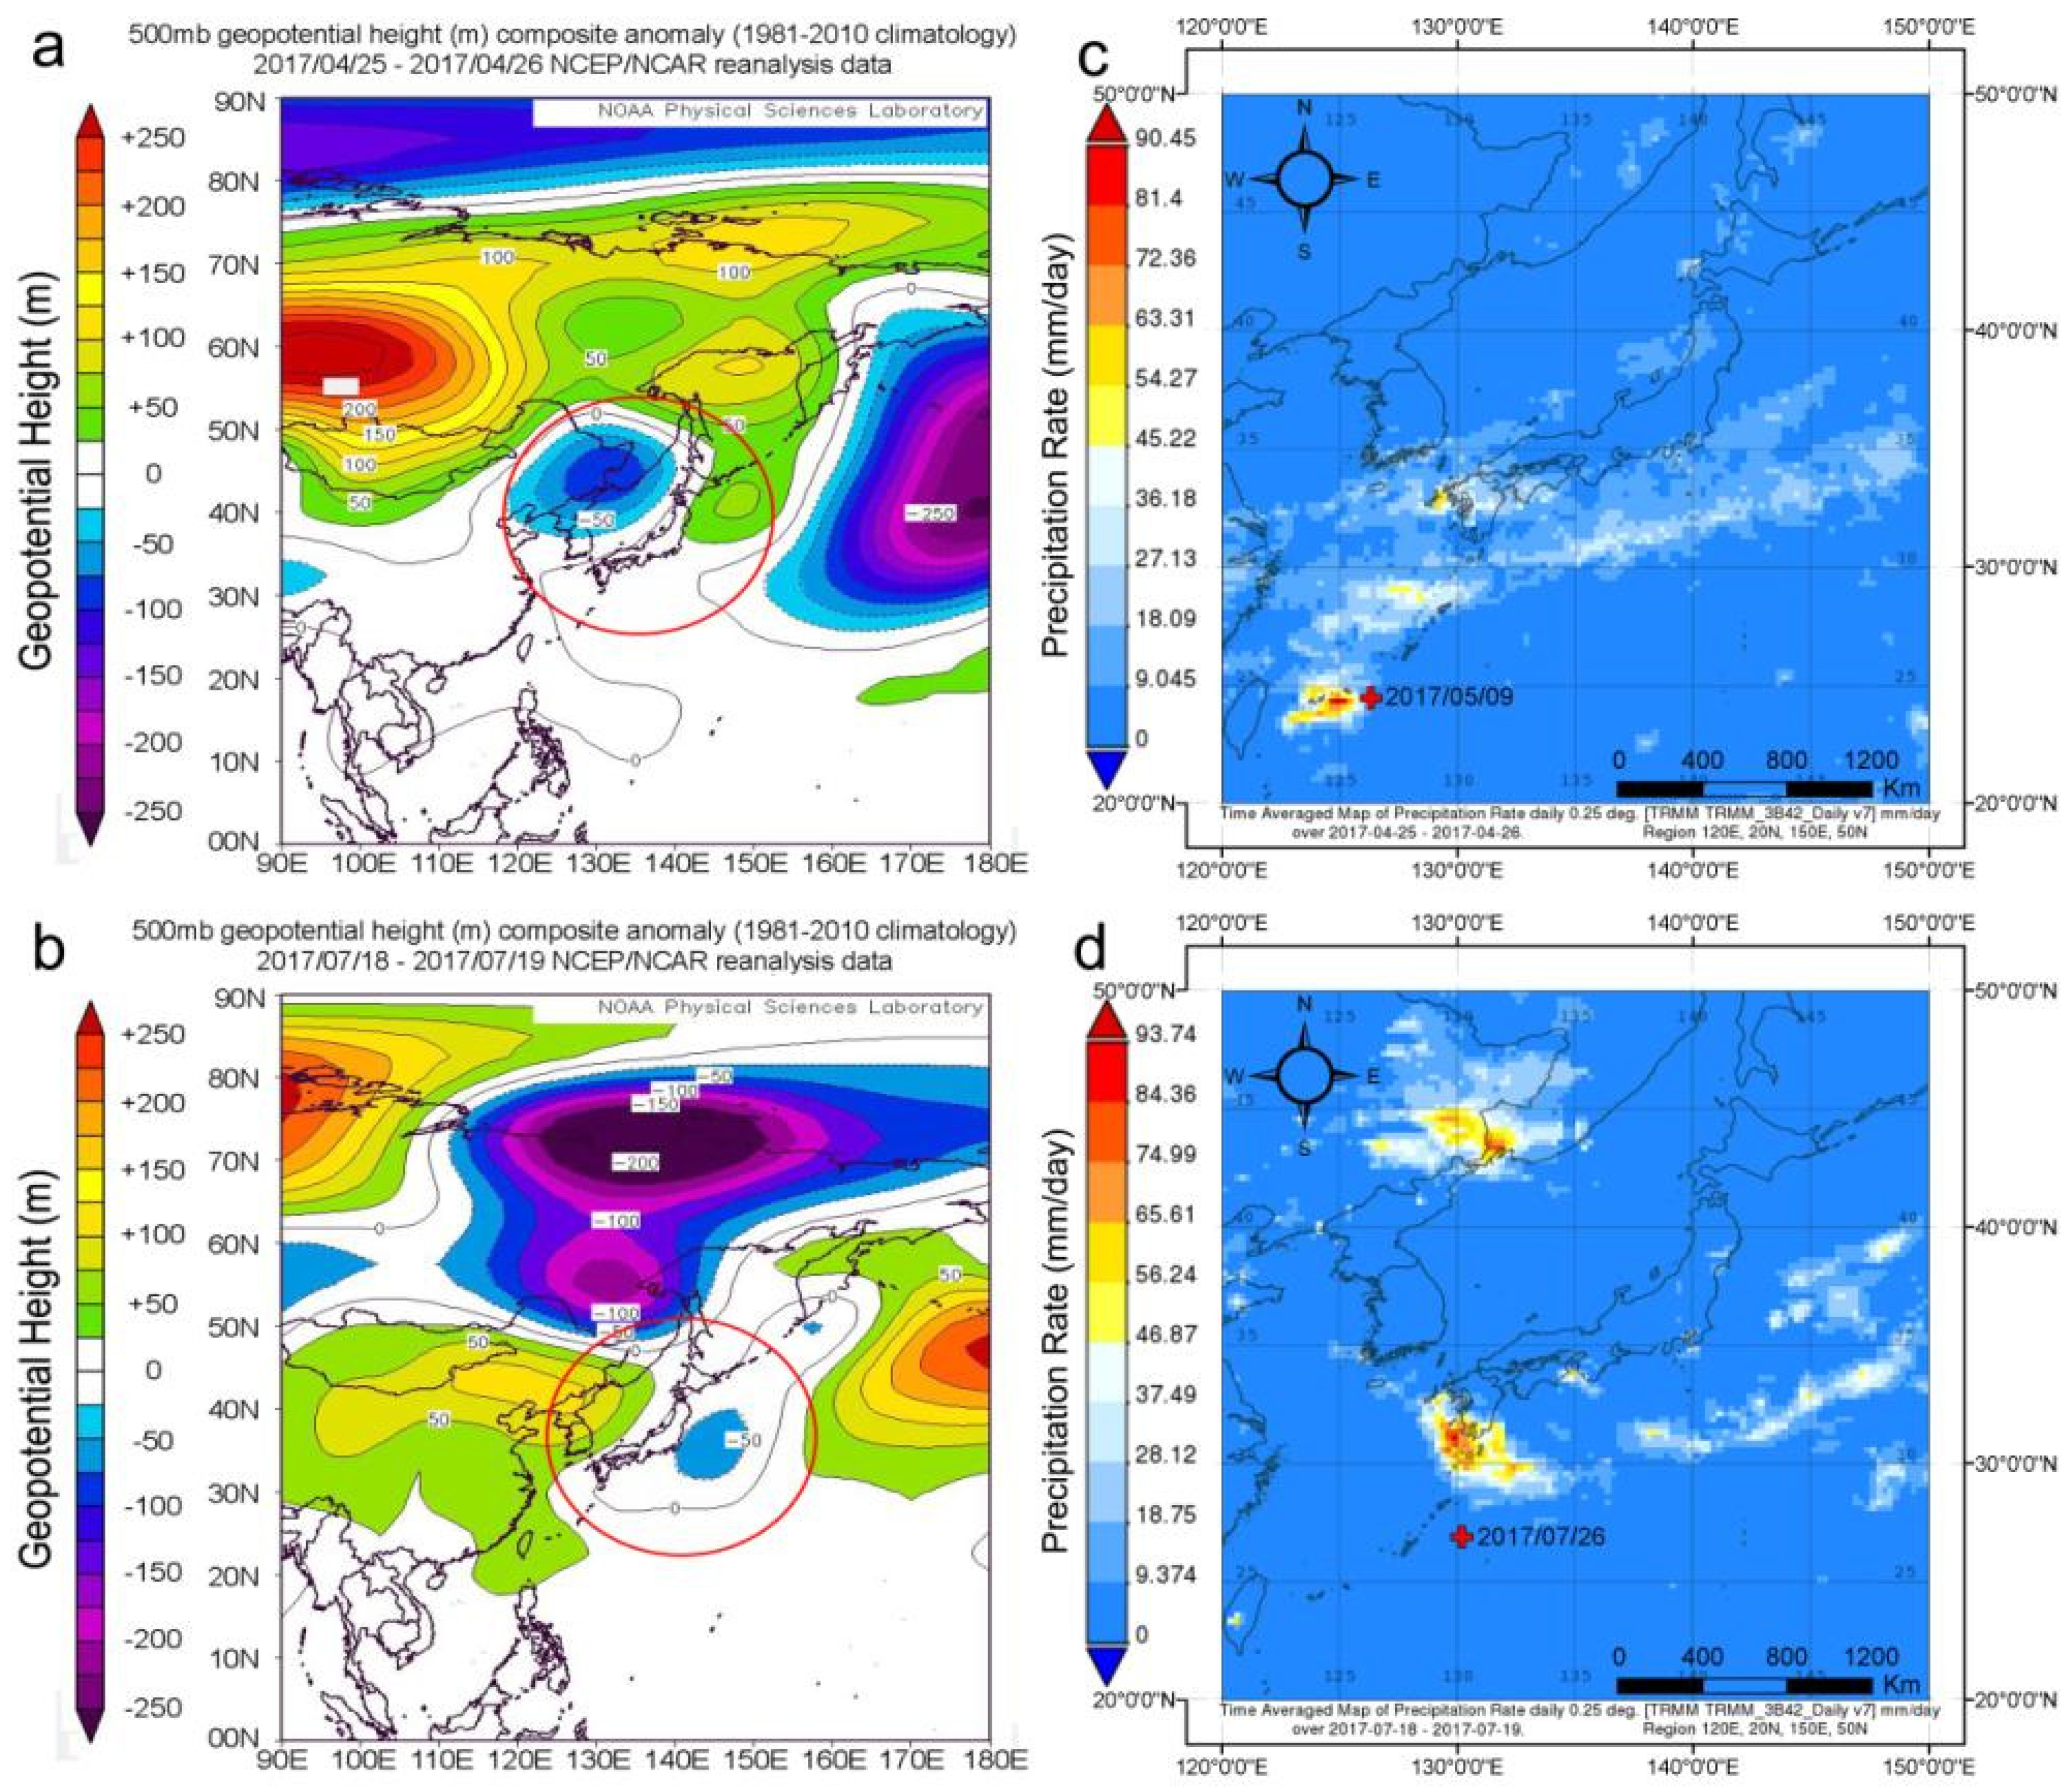
In a cross-correlation, the predictor time series is the input, and the followed time series is the output [60]. In the present study, the input time series refers to climatic elements such as the precipitation rate, whereas the output time series relates to an earthquake indicator such as the maximum earthquake magnitude.
In a first step, the correlation coefficients between earthquake indicators such as magnitude/frequency and the precipitation rate were estimated for the entire study area with a time lag of 30 days before and after the dates of major earthquakes (M > 6). These time delays were based on previous studies (e.g., [2,3,10,15]), specifying the increase in precipitation within a given number of days or weeks before seismic events. Moreover, scholars recently showed that the highest number of non-seismic anomalies was usually observed about one month before the earthquake [64].
The results provided a positive relation and distinct time lags between the atmospheric predictors and two sets of time series of earthquake indicators (Figure 2a,b). Thus, increased precipitation preceding earthquakes by 3–6, 12–15, 18–21, and 27–30 days, independent of magnitude and frequency, demonstrates a significant level of perturbations above the upper confidence limit of CCF > 0.1. Statistically, the upper and lower confidence limits are derived directly and automatically from the SPSS software using the CCF method. The thresholds depend on the number of standardized correlations (for example, between earthquake and precipitation) and time-lag numbers (days). In this regard, the increase in diurnal CCF values along −30 to 0 lagged days can indicate a positive lag correlation, but the exceeding points from the upper confidence limit can reveal significant anomalies.
The CCF plots are based on three atmospheric variables: (i) precipitation rate, (ii) wind speed at 2000 m above ground, and (iii) the SWEAT index for the radiosonde stations Hachijojima and Kagoshima, both not far from major earthquake epicenters. The data for the CCF plots are constructed in a matrix with 365 rows (days) and 10 columns (variables), including the above-mentioned variables (i)–(iii) for the earthquake frequency (number) and maximum earthquake magnitudes across the study area.
In addition to the rate of precipitation, the SWEAT index is a useful indicator for atmospheric instability and storm activity [65]. It combines moisture, lapse time, and vertical shear data to determine the convective potential of anomalous weather, specifically thunderstorms [66,67,68,69]. Based on the findings, anomalous CCFs between the climatic time series and earthquake indicators are noted at both stations, Hachijojima and Kagoshima. Some examples of the CCF test between earthquake maximum magnitude (EQ max) and climatic time series are shown in Figure 3. The analysis puts in evidence the anomalous increase in the climatic variables above the upper confidence limit (CCF > 0.1), specifically for severe threat weather conditions, within 27–30 and 18–21 days before these major earthquakes. This finding statistically suggests a co-occurrence of air turbulence (vertical wind speed), weather perturbations (SWEAT index), and rainfall data (precipitation rate) before these major earthquakes in the Japan region in 2017.

4.2. Spatial Survey

In a second step, the periods of atmospheric storm activities were determined within the indicated time windows. Based on the simultaneous arrangement of the time series, some storm episodes were detected before major earthquakes, as seen in the spatial visualization of the composite NOAA/NCEP reanalysis maps for the 500-hPa geopotential height anomaly. Some examples in Figure 4a,b clearly reveal storm centers (anomalous negative cores) as finite periods within the broader thunderstorm activity. In this regard, the storm event on 25–26 April 2017 occurred 13–14 days before the earthquake on 9 May 2017 (Figure 4a). Similarly, the storm event on 18–19 July 2017 occurred 7–8 days before the earthquake on 26 July 2017 (Figure 4b). All storm episodes were detected 3–4, 7–8, or 13–14 days before strong earthquakes. On this basis, remarkable low-pressure anomalies (negative centers) are seen in the synoptic-scale climatologic maps, persisting across the Japan region with amplitudes between −50 m and −250 m before all earthquakes. These low-pressure events may be related to the break-up or blocking of anomalous tropospheric Rossby waves at mid-latitudes [10]. Such perturbations observed over a seismological zone are probably related to lithospheric-atmospheric interactions caused by massive air ionization at the ground-to-air interface before major earthquakes [30].
Meanwhile, high-resolution TRMM precipitation data were used to create time-averaged spatial maps for the aforementioned selected storm episodes, such as the time-averaged map of the daily precipitation rate for the storm episode, on 25–26 April 2017, 13–14 days before the earthquake on 9 May 2017 (Figure 4c). In addition, time-averaged maps of the daily precipitation rate were drawn for the storm episode, on 18–19 July 2017, and 7–8 days before the earthquake on 26 July 2017 (Figure 4d). Hot spots in the precipitation rate (~80 mm to ~140 mm per 24 h) were observed before these major earthquakes within less than ~400 km of their epicenters, pointing to a correlation between the pre-earthquake signals and the locations of subsequent earthquakes. Researchers also demonstrated the appearance of pre-earthquake signals within several hundred kilometers of epicenters of strong earthquakes [70].
These varied field observations are consistent with two remarkable characteristics of positivehole charge carriers that have been derived from laboratory studies: (1) The ability of positivehole charge carriers to flow out of the stressed rock volume [71], like ultrafast optical electric field probing, is characterized as traveling fast and far into and through less stressed or unstressed rocks. The capability of traversing includes great distances, probably up to ~100 km [30], such as observations of the potential voltage of electromotive force (EMF) at a distance of hundreds of kilometers from the major earthquake source [72]. The second, (2) is the propensity of the electronic wave function associated with the positiveholes to delocalize on the atomic scale over many neighboring O2− neighbors, thereby altering their bonding characteristics and, thence, the physical properties of the rocks, including their “softness” or plasticity under directional stress [73].

4.3. Seismo-Climatic Index

In the third step, more information about the earthquakes was gathered before and after the storm events to calculate the seismo-climatic index based on the episodes indicated in the previous section. Seismicity indicators such as the frequency (number) of earthquakes, their mean magnitude, and maximum magnitude were considered within a given time window, depending on the time interval between the storm events and the earthquakes to calculate the numerator Equation (2). This time interval is designated as the preceding time period (days) before the earthquakes included in this study. Meanwhile, preceding time intervals (e.g., 3–4, 7–8, or 13–14 days) are chosen before storm episodes to calculate the denominator of Equation (2).
The results of this analysis are compiled in Table 2 in addition to the seismo-climatic indices (SCI), which range from 1.20 to 3.71 for the earthquakes on 9 November 2017 and 20 September 2017, respectively. The mean value of the SCI can thus be estimated to be 2.00, indicating that they reflect the thunderstorm and cyclone genesis and influence the persistence of low-pressure systems during the increase in regional seismicity before these earthquakes. Based on the preceding time intervals, an increase in seismicity apparently induced by thunderstorm activity is observable 7–8 and 13–14 days before major earthquakes. Table 3 lists the gradient values between the variables before and after the atmospheric storm events within the time windows. A simple statistical procedure was considered to estimate the gradient values based on the below equation [63]:
Δ = [ ( V a r A V a r B ) / ( V a r B ) ] × 100
where, Δ is the gradient value and VarA and VarB are the variable’s values after and before the selected episode of storm events. On that basis, the gradient values for precipitation, the SWEAT indices, and wind speed variables were estimated equal to 95%, 25%, and 16%, respectively, to affect the thunderstorm episodes within 1–2 weeks before these major earthquakes. In this research, the atmospheric storm anomalies were investigated using the SWEAT index based on the variables before and after observable storm episodes about 1–2 weeks prior to the major earthquakes. The reason for this method depends on the background logic for finding the non-seismic precursory status, which is observed some weeks before the main shocks not exactly on the earthquake event day.
Daneshvar and Freund [10] have noted an SCI value of 2.88 for the Middle East region, adopting the results in the present study, also revealing a link between atmospheric blocking and the increase in overall seismicity within two weeks prior to significant seismic events. The action of the lithospheric (e.g., E field, E flux, and positive/negative ion release) can thus provide a connection to the chain of atmospheric and ionospheric precursors in seismogenic regions [15]. Previously, scholars, e.g., [74], noted the feedback mechanisms between lithospheric activities and atmospheric dynamics. Therefore, the development of the lithosphere–atmosphere–ionosphere coupling (LAIC) model by [7,75] has demonstrated the geophysical anomalies before major earthquakes. However, there is still no consensus about the physical processes controlling the aforementioned earthquake precursors [13]. Two types of physical processes have been proposed to shed light on these correlations, one centered around the release of radon from the ground and the air ionization it will produce (e.g., [76,77,78]) and one centered around the stress-activation of positivehole charge carriers within the hypocentral volume and field-ionization of air at the ground-to-air interface ([30,39]).
Based on the latter proposal, increasing strains resulting from the build-up of tectonic stresses deep in the lithosphere in the days or weeks before earthquakes activate electronic charge carriers—positiveholes. Those positiveholes are defect electrons in the oxygen sub-lattice, i.e., the wave function associated with O in a matrix of O2−, highly mobile and able to spread through the rock column. When these charge carriers reach the lithosphere, they accumulate at the ground-to-air interface, preferentially at topographic highs, setting up electric fields that are microscopic in range but can reach millions of volts per centimeter. Such steep positive electric fields cause air molecules, primarily O2, to become field-ionized at the ground-to-air interface. According to a simple model of the global electric current system, earth E-charge carriers and air ionization rates depend on a function of high altitudes [79]. Due to the intrinsic nature of E-fields, corners, edges, or any other positive (i.e., upward) topographic fluctuation (e.g., high altitudes in the tectonic convergence areas) intensify E-fields [80]. As mentioned in recent papers, the non-seismic precursor’s chain from the lithosphere to the atmosphere, followed by the ionosphere could be highlighted at different altitudes [81]. As the O2 loses an electron to the ground, they turn into positive airborne ions, O2+. Air laden with O2+ and other field-ionized airborne ions tends to rise upward due to moisture condensation and release of latent heat. Anomalous latent heat release is due to air ionization and moisture condensation on ions [82]. Air ionization increases air velocity and upward flows [83]. The increase in the buoyancy of the air, in turn, produces thermal updrafts, which will transport ionized air to higher altitudes, where further moisture condensation can lead to cloud formation and anomalous precipitation.
The release of traces of radioactive radon from the lithosphere has been promoted as the key process responsible for enhanced regional pre-earthquake air ionization, moisture condensation, and increase in precipitation as another alternative explanation (e.g., [1,76,77]) because the existence of a high radon-related ionization rate enhances the particle formation processes and nucleation [84]. However, the number of airborne ions produced by radon decay pales in comparison to the number of airborne ions that can be produced by field ionization at the ground-to-air interface as a result of the arrival of stress-activated positivehole charge carriers from below [30]. This fact can be explained as the residual air-laden ions at the ground-to-air interface in high altitudes, whereas in lower relief, the mentioned ions are mostly produced by the radioactive decay of natural outgassing from the earth such as 222Rn [79].
Radon decay produces positive and negative airborne ions in about equal numbers, which are expected to recombine over time, decreasing the level of air ionization and, hence, the number of condensation nuclei can lead to droplet formation, latent heat release, and buoyancy. By contrast, any field ionization, affected by positiveholes at the ground-to-air interface, will produce exclusively positive airborne ions and follow pronounced instabilities in the atmosphere. The electrostatic imbalance in the lower troposphere may also be important to understand. In the case of pre-earthquake situations, near-ground ionized air rises so effectively, leading not only to the formation of cluster ion-aerosols, moisture condensation, and heavy rainfall but also to identifiable ionospheric perturbations possibly due to electrostatic imbalance, i.e., the excess positive charge associated with positive airborne ions in the air column ([2,39]). This mechanism can also explain the moisture condensation in the air, the air convection patterns, and precipitation occurrences [14].

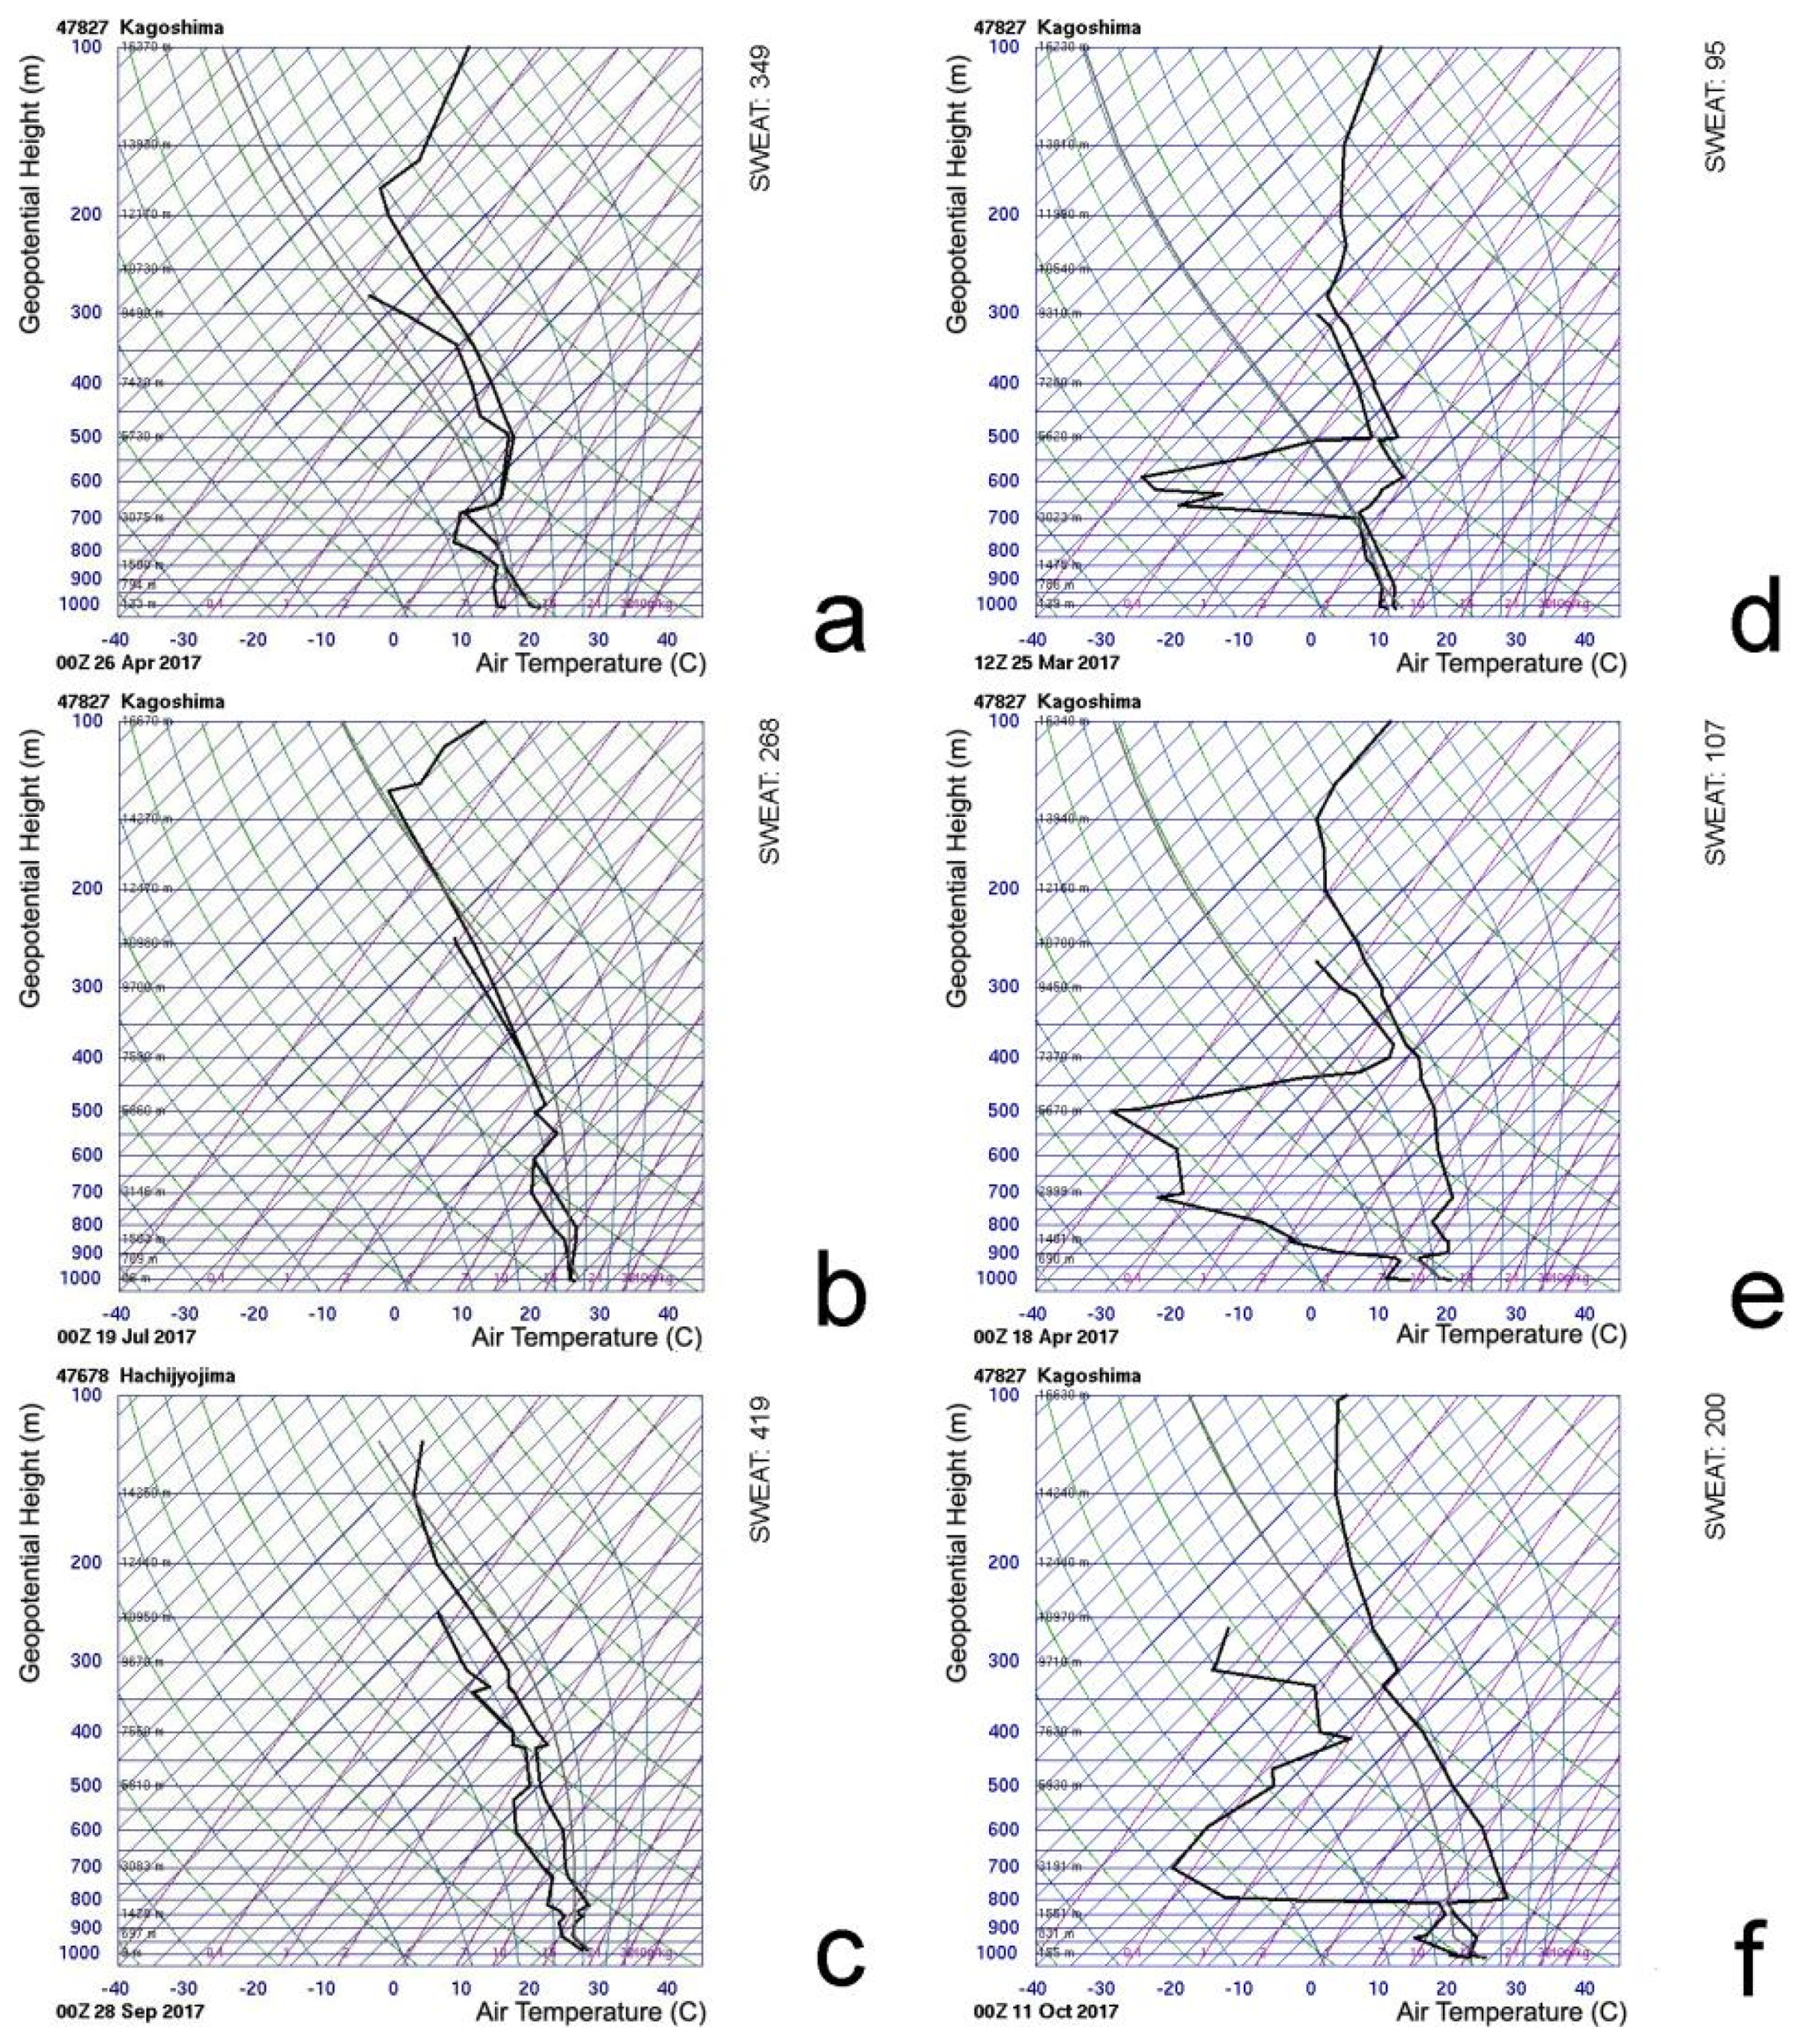
4.4. Upper-Air Vertical Profile

In a fourth step, Skew-T plots obtained from the Hachijojima and Kagoshima data were analyzed for selected days to provide further evidence for the pre-earthquake thunderstorm conditions based on vertical air profiles (Figure 5a–c). For instance, the Skew-T plots on 26 April 2017 before the earthquake on 9 May 2017 (Figure 5a) reveal a concordance of the dew-point and air-temperature curves, consistent with convective air turbulences moisture-saturated air, strong precipitation ~9500–1000 m above ground, up to ~300 hPa, and extremely severe weather condition with SWEAT values up to 349. Similarly, the other plots reveal unstable, highly convective, and moisture-saturated conditions with extreme values of the SWEAT index (>300). Thus, the Skew-T plots confirm the extreme weather conditions geographically close to the epicenters of major earthquakes within ~7–8 and 13–14 days of the main shock associated with the thunderstorm generation above the radiosonde stations. The upward motion of ionized-air masses over the seismic zones [82,83] indeed influenced the vertical and convective air turbulence, such as extreme values of the SWEAT, through the upper-air vertical profile. Hence, this mechanism could be considered as a result of earth processes at depth (i.e., “bottom-up” effect), which can be triggered by positiveholes at the ground-to-air interface. The massive ionization of air would lead to an upward migration of E-charged particles and a vertical flow in the atmosphere [80].

4.5. Volcanic Activity

In this section, volcanic activities in 2017 are addressed. As mentioned in the sections above (e.g., Figure 1d), three eruptions occurred in 2017 at the Aira, Kirishimayama, and Nishinoshima volcanoes (code 28208, 282090, and 284096, respectively). The Aira caldera is one of the most hazardous volcanoes in southern Japan, featuring one active cone [85]. The Kirishimayama volcano was particularly active during the late Holocene with more than 10 craters [86]. Nishinoshima is a small island, the volcanic activity of which started about 50 years ago without historical records before 1973 [87]. It provides a rare example of a volcanic island [88,89].
All 2017 eruptions of these three volcanoes happened at different locations and dates relative to the six major earthquakes. They occurred outside the time windows as specified, within 30 days before and after the nearby earthquake epicenters. For instance, whereas the Aira and Kirishimayama eruptions on 25 March 2017 and 11 October 2017 were within 800 km of the nearby M = 6.0 earthquake epicenter of 26 July 2017, their time-lapse was ~3–4 months. Another eruption of the Nishinoshima volcano on 18 April 2017 occurred within ~200 km of the nearby M = 6.1 earthquake epicenter of 7 September 2017, but its time-lapse was ~5 months. Accordingly, the correlation between the island volcano activity and major earthquakes in the Japan region appears weak, at least for the six cases presented here. Because of the relative proximity of the volcano eruptions to the Kagoshima meteorological observatory in southern Kyushu, Japan, the Skew-T plots of the eruption days presented in Figure 5d–f demonstrate volcano-driven effects on upper-air profile, namely pronounced thermal fluctuations in the upper atmospheric boundary layer (above ~1500–2000 m) and low SWEAT indices (<200). Nonetheless, during atmospheric storm conditions before the earthquakes, the upper-air vertical profiles reveal highly unstable and saturated-air conditions with an extreme SWEAT index value (>300).

4.6. Cross-Correlation Function Test

In this section, the cross-correlation function was tested between earthquake maximum magnitude and two climatic variables of accumulated precipitation and SWEAT index for the entire study area during a year (2017) with a time lag of ±6 months. For this purpose, the mean monthly values were estimated for mentioned variables for both stations of Hachijojima and Kagoshima (Table 4). The CCF estimations and plots are presented in Figure 6. The results revealed significant (above the upper confidence limit line) and positive correlations between the atmospheric predictors and the earthquake events for Hachijojima and Kagoshima’s stations. In this regard, increased precipitation and SWEAT values preceding earthquakes by one month confirmed the results obtained by CCF analysis on the diurnal scale (i.e., within 27–30 and 18–21 days before these major earthquakes). Hence, the finding can confirm that the climatic variables are categorized as the predictors from one month ago for following earthquake events in the study area.

5. Conclusions

Connections between atmospheric perturbations, e.g., thunderstorm activity, and major earthquakes are investigated along with the lithosphere–atmosphere coupling mechanism, concerning the earthquake prediction models. The present research attempts to recognize a possible link between atmospheric processes (rainfall, storms) and subsequent earthquakes. Hence, six major earthquakes (M > 6) in 2017 were analyzed in the Japan region given a possible correlation between atmospheric storm conditions and subsequent seismicity. Statistical analysis and spatial visualizations were used, such as CCF, SWEAT, SCI indices, plus time-averaged and composite anomaly maps of the precipitation rates and geopotential heights, as well as Skew-T plots. In addition to international open-source databases from NASA/Giovanni, the NOAA/Physical Sciences Laboratory, and US Geological Survey, upper-air sounding data were obtained from the University of Wyoming for the radiosonde stations at Kagoshima and Hachijojima such as SWEAT and wind speed at ~2000 m above ground, in addition to the surface precipitation rates.
For the earthquakes included in this study, the CCF results, on the diurnal and monthly scales, indicate a pattern of increased atmospheric fluctuations, specifically severe weather threats, within 27–30 and 18–21 days (~one month) of the seismic events. This statistically supports a correlation between the six major earthquakes in the Japan region in 2017 and air turbulence (as derived from the vertical wind speed profiles), weather perturbations (as derived from the SWEAT index), and rainfall (as derived from the precipitation rate). The estimated SCI values give mean values of around 2.00, indicating increased thunderstorm activity and associated cyclone genesis and the persistence of low-pressure systems about 7–8 and 13–14 days before these major earthquakes. More specifically, an increase in storm and thunderstorm activity was detected about 3–4, 7–8, and 13–14 days before the selected earthquakes. Abnormally low-pressure systems are seen in the synoptic-scale climatologic maps, persisting over the Japan region with a deviation from the mean range from −50 m to −250 m before all earthquakes were investigated. Furthermore, hot spots of heavy precipitation (from ~80 mm to ~140 mm within 24 h) were identified in the time-averaged maps of storm activities before these earthquakes and within reasonable distances from their epicenters. Thus, the Skew-T plots confirm unusual weather conditions associated with thunderstorm generation above the radiosonde stations approximately 7–8 and 13–14 days before the main shocks of all selected 6 earthquakes.
In the present research, a schematic framework was proposed to describe the findings as below. The unusual thunderstorm dynamics before major earthquake activity in the study area are consistent with the activation of positive-hole electronic charge carriers, which spread through the rock column, acting as powerful physical and chemical agents and causing air ionization at the ground-to-air interface. The airborne ions then act as condensation nuclei for atmospheric moisture, thermal updrafts, cloud formation, and a statistically significant precipitation increase approving the “bottom-up” effect.
This research was done based on some experimental indicators in a very important seismological region to examine the successfulness of the proposed mechanism and the given indicators as the possible proxies of pre-earthquake precursors. Hence, the main practical implication of the research can highlight a sustainable way for improving the managerial tools in the field of earthquake prediction. However, the present research was not free of limitations. One of the limitations relates to the research time interval in 2017. The primitive idea, data preparation, and draft of the present research belonged to 2019–2020 when the complete data collection was limited to 2017. Hence, collecting and analyzing similar procedures for new data in recent years of 2018–2022 should be considered by scholars for further research in the future. Another limitation depended on the inaccessibility to real-time and archived air ionization data to examine the findings and propositions’ accuracy. Hence, using the simultaneous diurnal data of air ionization (e.g., ground-based positive and negative ion counting) is remarkably suggested to correlate with co-registered atmospheric anomalies in further research.

Author Contributions

Conceptualization, F.T.F. and M.R.M.D.; methodology, F.T.F. and M.R.M.D.; software, M.R.M.D.; validation, F.T.F., M.R.M.D. and M.E.; formal analysis, M.R.M.D.; investigation, F.T.F.; resources, F.T.F. and M.R.M.D.; data curation, M.R.M.D. and M.E.; writing—original draft preparation, M.R.M.D. and M.E.; writing—review and editing, F.T.F. and M.R.M.D.; visualization, M.R.M.D.; supervision, F.T.F.; project administration, F.T.F. All authors have read and agreed to the published version of the manuscript.

Funding

This research received no external funding.

Informed Consent Statement

Informed consent was obtained from all subjects involved in the study.

Data Availability Statement

The data that support the findings of this study are available from the corresponding author upon request.

Acknowledgments

We wish to acknowledge NASA/Giovanni, NOAA/Physical Sciences Laboratory, US Geological Survey, and the University of Wyoming web data-centers for providing crucial data.

Conflicts of Interest

The authors declare no conflict of interest.

References

  1. Pulinets, S.A.; Ouzounov, D.; Karelin, A.; Davidenko, D.V. Physical bases of the generation of short-term earthquake precursors: A complex model of ionization-induced geophysical processes in the lithosphere-atmosphere-ionosphere-magnetosphere system. Geomagn. Aeron. 2015, 55, 521–538. [Google Scholar] [CrossRef]
  2. Daneshvar, M.R.M.; Freund, F.T. Remote Sensing of Atmospheric and Ionospheric Signals Prior to the Mw 8.3 Illapel Earthquake, Chile 2015. Pure Appl. Geophys. 2017, 174, 11–45. [Google Scholar] [CrossRef]
  3. Daneshvar, M.R.M.; Khosravi, M.; Tavousi, T. Seismic triggering of atmospheric variables prior to the major earthquakes in the Middle East within a 12-year time-period of 2002–2013. Nat. Hazards 2014, 74, 1539–1553. [Google Scholar] [CrossRef]
  4. Pundhir, D.; Singh, B.; Singh, O.P. Anomalous TEC variations associated with the strong Pakistan-Iran border region earthquake of 16 April 2013 at a low latitude station Agra, India. Adv. Space Res. 2014, 53, 226–232. [Google Scholar] [CrossRef]
  5. Ondoh, T. Investigation of precursory phenomena in the ionosphere, atmosphere and groundwater before large earthquakes of M > 6.5. Adv. Space Res. 2009, 43, 214–223. [Google Scholar] [CrossRef]
  6. Fan, W.; McGuire, J.J.; de Groot-Hedlin, C.D.; Hedlin, M.A.H.; Coats, S.; Fiedler, J.W. Stormquakes. Geophys. Res. Lett. 2019, 46, 12909–12918. [Google Scholar] [CrossRef]
  7. Pulinets, S.A.; Ouzounov, D.; Karelin, A.; Davidenko, D.V. Lithosphere-atmosphere-ionosphere-magnetosphere coupling—A concept for pre-earthquake signals generation. In Pre-Earthquake Processes: A Multi-Disciplinary Approach to Earthquake Prediction Studies; American Geophysical Union: Washington, DC, USA; John Wiley& Sons, Inc.: Hoboken, NJ, USA, 2018; pp. 79–98. [Google Scholar]
  8. Ouzounov, D.; Pulinets, S.; Liu, J.Y.; Hattori, K.; Han, P. Multiparameter Assessment of Pre-Earthquake Atmospheric Signals. In Pre-Earthquake Processes: A Multidisciplinary Approach to Earthquake Prediction Studies; Ouzounov, D., Pulinets, D., Hattori, K., Taylor, P., Eds.; American Geophysical Union: Washington, DC, USA; John Wiley & Sons, Inc.: Hoboken, NJ, USA, 2018; pp. 339–359. [Google Scholar]
  9. Shah, M.; Jin, S. Pre-seismic ionospheric anomalies of the 2013 Mw = 7.7 Pakistan earthquake from GPS and COSMIC observations. Geod. Geodyn. 2018, 9, 378–387. [Google Scholar] [CrossRef]
  10. Daneshvar, M.R.M.; Freund, F.T. Examination of a relationship between atmospheric blocking and seismic events in the Middle East using a new seismo-climatic index. Swiss J. Geosci. 2019, 112, 435–451. [Google Scholar] [CrossRef]
  11. Tariq, M.A.; Shah, M.; Pajares, M.H.; Iqbal, T. Pre-earthquake ionospheric anomalies before three major earthquakes by GPS-TEC and GIM-TEC data during 2015–2017. Adv. Space Res. 2019, 63, 2088–2099. [Google Scholar] [CrossRef]
  12. Shah, M.; Aibar, A.C.; Tariq, M.A.; Ahmed, J.; Ahmed, A. Possible ionosphere and atmosphere precursory analysis related to Mw > 6.0 earthquakes in Japan. Remote Sens. Environ. 2020, 239, 111620. [Google Scholar] [CrossRef]
  13. Şentürk, E.; Inyurt, S.; Sertçelik, İ. Ionospheric anomalies associated with Mw 7.3 Iran-Iraq border earthquake and a moderate magnetic storm. Ann. Geophys. Discuss. 2020, 38, 1031–1043. [Google Scholar] [CrossRef]
  14. Daneshvar, M.R.M.; Freund, F.T. Survey of a relationship between precipitation and major earthquakes along the Peru-Chilean trench (2000–2015). Eur. Phys. J. Spec. Top. 2021, 230, 335–351. [Google Scholar] [CrossRef]
  15. Daneshvar, M.R.M.; Tavousi, T.; Khosravi, M. Atmospheric blocking anomalies as the synoptic precursors prior to the induced earthquakes; A new climatic conceptual model. Int. J. Environ. Sci. Technol. 2015, 12, 1705–1718. [Google Scholar] [CrossRef]
  16. Hainzl, S.; Kraft, T.; Wassermann, J.; Igel, H.; Schmedes, E. Evidence for rainfall-triggered earthquake activity. Geophys. Res. Lett. 2006, 33, 1–5. [Google Scholar] [CrossRef]
  17. Kraft, T.; Wassermann, J.; Schmedes, E.; Igel, H. Meteorological triggering of earthquake swarms at Mt. Hochstaufen, SE-Germany. Tectonophysics 2006, 424, 245–258. [Google Scholar] [CrossRef]
  18. Husen, S.; Bachmann, C.; Diardini, D. Locally triggered seismicity in the central Swiss Alps following the large rainfall event of August 2005. Geophys. J. Int. 2007, 171, 1126–1134. [Google Scholar] [CrossRef]
  19. Miller, S.A. Note on rain-triggered earthquakes and their dependence on karst geology. Geophys. J. Int. 2008, 173, 334–338. [Google Scholar] [CrossRef]
  20. Ouzounov, D.; Pulinets, S.; Romanov, A.; Romanov, A.; Tsybulya, K.; Davidenko, D.; Kafatos, M.; Taylor, P. Atmosphere-ionosphere response to the M9 Tohoku earthquake revealed by joined satellite and ground observations: Preliminary results. Earthq. Sci. 2011, 24, 557–564. [Google Scholar] [CrossRef]
  21. Wakita, K. Geology and tectonics of Japanese islands: A review—The key to understanding the geology of Asia. J. Asian Earth Sci. 2013, 72, 75–87. [Google Scholar] [CrossRef]
  22. Arai, N.; Iwakuni, M.; Watada, S.; Imanishi, Y.; Murayama, T.; Nogami, M. Atmospheric boundary waves excited by the tsunami generation related to the 2011 great Tohoku-Oki earthquake. Geophys. Res. Lett. 2011, 38, L00G18. [Google Scholar] [CrossRef]
  23. Heki, K. Ionospheric electron enhancement preceding the 2011 Tohoku-Oki earthquake. Geophys. Res. Lett. 2011, 38, L17312. [Google Scholar] [CrossRef]
  24. Kakinami, Y.; Kamogawa, M.; Tanioka, Y.; Watanabe, S.; Gusman, A.R.; Liu, J.Y.; Watanabe, Y.; Mogi, T. Tsunamigenic ionospheric hole. Geophys. Res. Lett. 2012, 39, L00G27. [Google Scholar] [CrossRef]
  25. Ohta, K.; Izutsu, J.; Schekotov, A.; Hayakawa, M. The ULF/ELF electromagnetic radiation before the 11 March 2011 Japanese earthquake. Radio Sci. 2013, 48, 589–596. [Google Scholar] [CrossRef]
  26. Hayakawa, M. Seismo-ionospheric perturbations, and the precursors to the 2011 Japan earthquake. In Proceedings of the 2014 International Symposium on Electromagnetic Compatibility, Tokyo (EMC’14/Tokyo), Tokyo, Japan, 13–16 May 2014; pp. 155–158. [Google Scholar]
  27. Hayakawa, M. Earthquake Precursor Studies in Japan. In Pre-Earthquake Processes: A Multi-Disciplinary Approach to Earthquake Prediction Studies; Ouzounov, D., Pulinets, S., Hattori, K., Taylor, P., Eds.; John Wiley & Sons, Inc.: Hoboken, NJ, USA, 2018. [Google Scholar]
  28. Ouzounov, D.; Liu, D.; Chunli, K.; Cervone, G.; Kafatos, M.; Taylor, P. Outgoing long wave radiation variability from IR satellite data prior to major earthquakes. Tectonophys 2007, 431, 211–220. [Google Scholar] [CrossRef]
  29. Jiao, Z.H.; Zhao, J.; Shan, X. Pre-seismic anomalies from optical satellite observations: A review. Nat. Hazards Earth Syst. Sci. 2018, 18, 1013–1036. [Google Scholar] [CrossRef]
  30. Freund, F.T.; Kulahci, I.G.; Cyr, G.; Ling, J.; Winnick, M.; Tregloan-Reed, J.; Freund, M.M. Air ionization at rock surfaces and pre-earthquake signals. J. Atmos. Sol. Terr. Phys. 2009, 71, 1824–1834. [Google Scholar] [CrossRef]
  31. Freund, F.T. Earthquake Forewarning—A Multidisciplinary Challenge from the Ground up to Space. Acta Geophys. 2013, 61, 775–807. [Google Scholar] [CrossRef]
  32. Qin, K.; Zheng, S.; Wu, L.; Wang, Y. Quasi-synchronous multi-parameter anomalies before Wenchuan and Yushu earthquakes in China. Eur. Phys. J. Spec. Top. 2021, 230, 263–274. [Google Scholar] [CrossRef]
  33. Costain, J.K.; Bollinger, G.A.; Speer, J.A. Hydroseismicity—A hypothesis for the role of water in the generation of intraplate seismicity. Geology 1987, 15, 618–621. [Google Scholar] [CrossRef]
  34. Costain, J.K. Groundwater recharge as the trigger of naturally occurring intraplate earthquakes. Geol. Soc. Spec. Publ. 2017, 432, 91–118. [Google Scholar] [CrossRef]
  35. Kodaira, S.; Iidaka, T.; Kato, A.; Park, J.O.; Iwasaki, T.; Kaneda, Y. High pore fluid pressure may cause silent slip in the Nankai Trough. Science 2004, 304, 1295–1298. [Google Scholar] [CrossRef] [PubMed]
  36. Prejean, S.G.; Hill, D.P.; Brodsky, E.E.; Hough, S.E.; Johnston, M.J.S.; Malone, S.D.; Oppenheimer, D.H.; Pitt, A.M.; Richards-Dinger, K.B. Remotely triggered seismicity on the United States west coast following the Mw 7.9 Denali Fault earthquake. Bull. Seismol. Soc. Am. 2014, 94, S348–S359. [Google Scholar] [CrossRef]
  37. Farquharson, J.I.; Amelung, F. Extreme rainfall triggered the 2018 rift eruption at Kīlauea Volcano. Nature 2020, 580, 491–495. [Google Scholar] [CrossRef] [PubMed]
  38. Parrot, M.; Tramutoli, V.; Liu, T.J.Y.; Pulinets, S.; Ouzounov, D.; Genzano, N.; Lisi, M.; Hattori, K.; Namgaladze, A. Atmospheric and ionospheric coupling phenomena associated with large earthquakes. Eur. Phys. J. Spec. Top. 2021, 230, 197–225. [Google Scholar] [CrossRef]
  39. Freund, F.T.; Freund, M.M. Paradox of Peroxy Defects and Positive Holes in Rocks Part I: Effect of Temperature. J. Asian Earth Sci. 2015, 114, 373–383. [Google Scholar] [CrossRef]
  40. Dobrovolsky, I.P.; Zubkov, S.I.; Myachkin, V.I. Estimation of the size of earthquake preparation zones. Pure Appl. Geophys. 1979, 117, 1025–1044. [Google Scholar] [CrossRef]
  41. USGS. Earthquake Archive Data. Online Catalog of United States Geological Survey. Available online: https://www.usgs.gov/natural-hazards/earthquake-hazards/earthquakes (accessed on 15 December 2019).
  42. Marchitelli, V.; Harabaglia, P.; Troise, C.; De Natale, G. On the correlation between solar activity and large earthquakes worldwide. Sci. Rep. 2020, 10, 11495. [Google Scholar] [CrossRef]
  43. Rhea, S.; Tarr, A.C.; Hayes, G.; Villaseñor, A.; Benz, H. Seismicity of the Earth 1900–2007, Japan and Vicinity; Open-File Report 2010–1083-D; U.S. Geological Survey: Reston, VA, USA, 2010.
  44. Galway, J.G. The lifted index as a predictor of latent instability. Bull. Am. Meteorol. Soc. 1956, 37, 528–529. [Google Scholar] [CrossRef]
  45. Showalter, A.K. A stability index for thunderstorm forecasting. Bull. Am. Meteorol. Soc. 1953, 34, 250–252. [Google Scholar] [CrossRef]
  46. Bidner, A. The Air Force Global Weather Central severe weather threat (SWEAT) index—A preliminary report. Air Weather Serv. Sci. Rev. 1970, 3, 105–162. [Google Scholar]
  47. Miller, R.C. Notes on the Analysis of Severe Storm Forecasting Procedures of The Air Force Global Weather Center; AFGWC Technical Report 200 (Rev.); Air Weather Service, Scott AFB: St. Clair, IL, USA, 1972. [Google Scholar]
  48. Sioutas, M.V.; Flocas, H.A. Hailstorms in Northern Greece: Synoptic patterns and thermodynamic environment. Theor. Appl. Climatol. 2003, 75, 189–202. [Google Scholar] [CrossRef]
  49. University of Wyoming. Upper-Atmosphere Sounding Database. Available online: https://weather.uwyo.edu/upperair/sounding.html (accessed on 15 December 2019).
  50. JMA. Radiosonde Network in Japan Archived by Japan Meteorological Agency. Available online: https://www.jma.go.jp/jma/en/Activities/upper/upper.html (accessed on 15 December 2019).
  51. APDRC. Tropical Rainfall Measurement Mission (TRMM) Project Archived by Asia Pacific Data Research Center. Available online: https://apdrc.soest.hawaii.edu/las/getUI.do (accessed on 15 December 2019).
  52. GIOVANNI. Precipitation Data Archived by the 4th Version of the Geospatial Interactive Online Visualization and Analysis Infrastructure Program. Available online: https://giovanni.gsfc.nasa.gov/giovanni (accessed on 20 January 2020).
  53. NOAA. Daily Reanalysis Database of NOAA/Physical Science Laboratory. Available online: https://www.esrl.noaa.gov/psd/data/composites/day (accessed on 20 January 2020).
  54. NMNH. Volcanic Eruptions Data Archived by National Museum of Natural History in New York. Available online: https://volcano.si.edu/search_eruption.cfm (accessed on 10 April 2020).
  55. JMA. National Catalog of Active Volcanoes in Japan. Edited by Japan Meteorological Agency and Volcanological Society of Japan. Available online: https://www.data.jma.go.jp/svd/vois/data/tokyo/STOCK/souran_eng/menu.htm (accessed on 10 April 2020).
  56. Straile, D.; Eckmann, R.; Juengling, T.; Thomas, G.; Loeffler, H. Influence of climate variability on whitefish (Coregonus lavaretus) year-class strength in a deep, warm monomictic lake. Oecologia 2007, 151, 521–529. [Google Scholar] [CrossRef] [PubMed]
  57. Greenstreet, S.P.R.; Rogers, S.I.; Rice, J.C.; Piet, G.J.; Guirey, E.J.; Fraser, H.M.; Fryer, R.J. Development of the EcoQO for the North Sea fish community. ICES J. Mar. Sci. 2011, 68, 1–11. [Google Scholar] [CrossRef]
  58. Gröger, J.P.; Fogarty, M.J. Broad-scale climate influences on cod (Gadus morhua) recruitment on Georges Bank. ICES J. Mar. Sci. 2011, 68, 592–602. [Google Scholar] [CrossRef]
  59. Shephard, S.; Reid, D.G.; Greenstreet, S.P.R. Interpreting the large fish indicator for the Celtic Sea. ICES J. Mar. Sci. 2011, 68, 1963–1972. [Google Scholar] [CrossRef]
  60. Probst, W.N.; Stelzenmüller, V.; Ove Fock, H. Using cross-correlations to assess the relationship between time-lagged pressure and state indicators: An exemplary analysis of North Sea fish population indicators. ICES J. Mar. Sci. 2012, 69, 670–681. [Google Scholar] [CrossRef]
  61. Wang, J.; Sheng, Z.; Zhou, B.; Zhou, S. Lightning potential forecast over Nanjing with denoised sounding-derived indices based on SSA and CS-BP neural network. Atmos. Res. 2014, 137, 245–256. [Google Scholar] [CrossRef]
  62. Bauman, W.H.; Wheeler, M.M.; Short, D.A. Severe weather forecast decision aid. In NASA Technical Reports Server; NASA/CR-2005-212563; US Government: Washington, DC, USA, 2005. [Google Scholar]
  63. Mahmoudzadeh, A.; Daneshvar, M.R.M. Verification of Increased Intensity and Frequency of Earthquakes after the Climatic Anomalies in Jan 2020; Technical Report; Shakhes Pajouh Research Institute: Isfahan, Iran, 2020; (In Persian). [Google Scholar] [CrossRef]
  64. Akhoondzadeh, M.; Marchetti, D. Developing a fuzzy inference system based on multi-sensor data to predict powerful earthquake parameters. Remote. Sens. 2022, 14, 3203. [Google Scholar] [CrossRef]
  65. Siedlecki, M. Selected instability indices in Europe. Theor. Appl. Climatol. 2009, 96, 85–94. [Google Scholar] [CrossRef]
  66. Wasula, A.C.; Bosart, L.F.; Lapenta, K.D. The Influence of Terrain on the severe weather distribution across interior eastern New York and Western New England. Water. Forecast. 2002, 17, 1277–1289. [Google Scholar] [CrossRef]
  67. Derubertis, D. Recent trends in four common stability indices derived from U.S. radiosonde observations. J. Clim. 2006, 19, 309–323. [Google Scholar] [CrossRef]
  68. Miller, P.W.; Mote, T.L. Characterizing severe weather potential in synoptically weakly forced thunderstorm environments. Nat. Hazards Earth Syst. Sci. 2018, 18, 1261–1277. [Google Scholar] [CrossRef]
  69. Abshaev, M.T.; Abshaev, A.M.; Mikhailovskiy, Y.P.; Sinkevich, A.A.; Popov, V.B.; Adzhiev, A.K. Characteristics of the Supercell Cb Thunderstorm and Electrical Discharges on 19 August 2015, North Caucasus: A Case Study. 2019. Available online: https://www.preprints.org/manuscript/201912.0033/v1 (accessed on 30 June 2022).
  70. Gregori, G.; Poscolieri, M.; Paparo, G.; De Simone, S.; Rafanelli, C.; Ventrice, G. Storms of crustal stress and AE earthquake precursors. Nat. Hazards Earth Syst. Sci. 2010, 10, 319–337. [Google Scholar] [CrossRef]
  71. Takeuchi, A.; Lau, B.W.S.; Freund, F.T. Current and surface potential induced by stress-activated positive holes in igneous rocks. Phys. Chem. Earth A B C 2006, 31, 240–247. [Google Scholar] [CrossRef]
  72. Takeuchi, A.; Nagao, T. Activation of hole charge carriers and generation of electromotive force in gabbro blocks subjected to nonuniform loading. J. Geophys. Res. Solid. Earth 2013, 118, 915–925. [Google Scholar] [CrossRef]
  73. Freund, F.T.; Hoenig, S.A.; Braun, A.; Dahlgren, R.P.; Momayez, M.; Chu, J.J. Softening Rocks with Stress-Activated Electric Current. 5th International Symposium on In-Situ Rock Stress (ISRSV); Francis and Taylor Publ.: Abingdon, UK, 2010; pp. 838–843. [Google Scholar]
  74. Iaffaldano, G.; Husson, L.; Bunge, H.P. Monsoon speeds up Indian plate motion. Earth Planet. Sci. Lett. 2011, 304, 503–510. [Google Scholar] [CrossRef]
  75. Pulinets, S.A.; Ouzounov, D. Lithosphere-atmosphere-ionosphere coupling (LAIC) model: An unified concept for earthquake precursors validation. J. Asian Earth Sci. 2011, 41, 371–382. [Google Scholar] [CrossRef]
  76. Pulinets, S.A.; Ouzounov, D.; Karelin, A.V.; Boyarchuk, K.A.; Pokhmelnykh, L.A. The physical nature of thermal anomalies observed before strong earthquakes. Phys. Chem. Earth 2006, 31, 143–153. [Google Scholar] [CrossRef]
  77. Namgaladze, A.; Klimenko, M.V.V.; Klimenko, V.; Zakharenkova, I.E. Physical mechanism and mathematical modeling of earthquake ionospheric precursors registered in total electron content. Geomagn. Aeron. 2009, 49, 252–262. [Google Scholar] [CrossRef]
  78. Hayakawa, M.; Schekotov, A.; Izutsu, J.; Yang, S.S.; Solovieva, M.; Hobara, Y. Multi-parameter observations of seismogenic phenomena related to the Tokyo earthquake (M = 5.9) on 7 October 2021. Geosciences 2022, 12, 265. [Google Scholar] [CrossRef]
  79. Kelly, M.C. (Ed.) Atmospheric electricity. In The Earth’s Electric Field; Elsevier Inc.: Amsterdam, The Netherlands, 2014; pp. 29–52. [Google Scholar]
  80. Freund, F.T.; Ouillon, G.; Scoville, J.; Sornette, D. Earthquake precursors in the light of peroxy defects theory: Critical review of systematic observations. Eur. Phys. J. Spec. Top. 2021, 230, 7–46. [Google Scholar] [CrossRef]
  81. Satti, M.S.; Ehsan, M.; Abbas, A.; Shah, M.; de Oliveira-Júnior, J.F.; Naqvi, N.A. Atmospheric and ionospheric precursors associated with Mw ≥ 6.5 earthquakes from multiple satellites. J. Atmos. Sol. Terr. Phys. 2022, 227, 105802. [Google Scholar] [CrossRef]
  82. Pulinets, S.A. The synergy of earthquake precursors. Earthq. Sci. 2011, 24, 535–548. [Google Scholar] [CrossRef]
  83. Liperovsky, V.A.; Meister, C.V.; Liperovskaya, E.V.; Davidov, V.F.; Bogdanov, V.V. On the possible influence of radon and aerosol injection on the atmosphere and ionosphere before earthquakes. Nat. Hazards Earth Syst. Sci. 2005, 5, 783–789. [Google Scholar] [CrossRef]
  84. Zhang, K.; Feichter, J.; Kazil, J.; Wan, H.; Zhuo, W.; Griffiths, A.D.; Sartorius, H.; Zahorowski, W.; Ramonet, M.; Schmidt, M.; et al. Radon activity in the lower troposphere and its impact on ionization rate: A global estimate using different radon emissions. Atmos. Chem. Phys. 2011, 11, 7817–7838. [Google Scholar] [CrossRef]
  85. Brothelande, E.; Amelung, F.; Yunjun, Z.; Wdowinski, S. Geodetic evidence for interconnectivity between Aira and Kirishima magmatic systems, Japan. Sci. Rep. 2018, 8, 9811. [Google Scholar] [CrossRef] [PubMed]
  86. Kato, K.; Yamasato, H. The 2011 eruptive activity of Shinmoedake volcano, Kirishimayama, Kyushu, Japan—Overview of activity and Volcanic Alert Level of the Japan Meteorological Agency. Earth Planets Space 2013, 65, 489–504. [Google Scholar] [CrossRef]
  87. Shinohara, M.; Ichihara, M.; Sakai, S.; Yamada, T.; Takeo, M.; Sugioka, H.; Nagaoka, Y.; Takagi, A.; Morishita, T.; Ono, T.; et al. Continuous seismic monitoring of Nishinoshima volcano, Izu-Ogasawara, by using long-term ocean bottom seismometers. Earth Planets Space 2017, 69, 159. [Google Scholar] [CrossRef]
  88. Maeno, F.; Nakada, S.; Kaneko, T. Morphological evolution of a new volcanic islet sustained by compound lava flows. Geology 2016, 44, 259–262. [Google Scholar] [CrossRef]
  89. Kaneko, T.; Maeno, F.; Yasuda, A.; Takeo, M.; Takasaki, K. The 2017 Nishinoshima eruption: Combined analysis using Himawari-8 and multiple high-resolution satellite images. Earth Planets Space 2019, 71, 140. [Google Scholar] [CrossRef]
Figure 1. Geographical distribution of (a) earthquake epicenters with M > 3 and (b) major earthquakes with M > 6 (catalogs of US Geological Survey in 2017), (c) the Japan radiosonde network including the Hachijojima and Kagoshima stations and (d) volcano and calderas in the Japan region including three volcanic eruptions of Aira, Kirishimayama, and Nishinoshima in 2017 (catalogs of Japan Meteorological Agency).
Sustainability 14 10241 g001
Figure 2. Daily lag-time correlation test based on the cross-correlation function (CCF) over the whole study area (20–50° N, 120–150° E) between earthquake indicators and precipitation rate time series (a) EQ max and precipitation rate, and (b) EQ freq. and precipitation rate. EQ max: maximum magnitude of earthquake events on the diurnal scale, EQ freq.: frequency (number) of earthquake events on the diurnal scale. (Red stripes are the significant level of perturbations above the upper confidence limit).
Sustainability 14 10241 g002
Figure 3. Daily lag-time correlation test based on the cross-correlation function (CCF) between earthquake maximum magnitude (EQ max) and climatic time series in both radiosonde stations including: (a) precipitation rate in Hachijojima, (b) SWEAT index in Hachijojima, (c) wind speed2000 in Hachijojima, (d) precipitation rate in Kagoshima, (e) SWEAT index in Kagoshima, and (f) wind speed2000 in Kagoshima. (Red stripes are the significant level of perturbations above the upper confidence limit).
Sustainability 14 10241 g003
Figure 4. Spatial visualization of reanalyzed remote sensing maps including: (a) 500-hPa geopotential height anomaly in 25–26 April 2017 about 13–14 days before the 9 May 2017 earthquake and (b) 500-hPa geopotential height anomaly in 18–19 July 2017 about 7–8 days before the 26 July 2017 earthquake (NOAA/NCEP database), (c) time-averaged maps of daily precipitation rate in 25–26 April 2017 about 13–14 days before the 9 May 2017 earthquake and (d) time-averaged maps of daily precipitation rate in 18–19 July 2017 about 7–8 days before the 26 July 2017 earthquake (NASA/Giovanni database).
Sustainability 14 10241 g004
Figure 5. Skew-T plot for given days and selected stations (Hachijojima and Kagoshima) evidencing the air vertical profiles for some examples including (a) thunderstorm day on 26 April 2017, (b) thunderstorm day on 19 July 2017, (c) thunderstorm day on 28 September 2017, (d) Aira eruption on 25 March 2017, (e) Kirishimayama eruption on 18 April 2017, and (f) Nishinoshima eruption on 11 October 2017 (meteorological database of Wyoming University, Laramie, WY, USA).
Sustainability 14 10241 g005
Figure 6. Monthly lag-time correlation test based on the cross-correlation function (CCF) between earthquake event and (a) accumulated precipitation at the Hachijojima, (b) SWEAT index at the Hachijojima, (c) accumulated precipitation at the Kagoshima, and (d) SWEAT index at the Kagoshima. (Red stripes are the significant level of perturbations above the upper confidence limit).
Sustainability 14 10241 g006
Table 1. Major earthquakes in the study area during 2017 (retrieved from USGS), and their respective epicentral locations.
No.Earthquake DateLocation NameMLatitude and Longitude1° × 1° Pixel of Spatial Coordination
19 May 2017Hirara6.024.450° N, 126.317° E24–25° N, 126–127° E
226 July 2017Naze6.026.898° N, 130.184° E26–27° N, 130–131° E
37 September 2017Chichi-Shima6.127.783° N, 139.804° E27–28° N, 139–140° E
420 September 2017Kamaishi6.137.981° N, 144.660° E37–38° N, 144–145° E
56 October 2017Ishinomaki6.237.503° N, 144.020° E37–38° N, 144–145° E
69 November 2017Hachijo-Jima6.032.521° N, 141.438° E32–33° N, 141–142° E
Table 2. Characteristics of earthquakes and seismo-climatic index before and after the atmospheric storm events.
No.Earthquake DateSelected Storm
Episode
(Date)
Preceding Time
Interval
(Day)
Seismicity before Storm EventSeismicity after Storm EventSeismo-Climatic Index
Earthquake FrequencyMean MagnitudeMax. MagnitudeEarthquake FrequencyMean MagnitudeMax. Magnitude
19 May 201725–26 April 201713–14294.545.2434.5261.70
226 July 201718–19 July 20177–8284.375.2334.5961.43
37 September 201730–31 August 20177–8164.474.8314.646.12.56
420
September 2017
16–17
September 2017
3–474.34.6184.686.13.71
56
October 2017
27–28
September 2017
7–8264.485.8334.646.21.41
69
November 2017
28–29
October 2017
13–14394.545.9464.5561.20
-Mean-244.455.3344.606.12.00
Table 3. Gradient values between variables before and after atmospheric storm events.
No.Selected Storm
Episode
(Date)
Variables before Storm EventVariables after Storm EventGradient Values (Δ)
Accumulated Precipitation (mm)SWEAT Index (Unit-Less)Wind Speed (Knot)Accumulated Precipitation (mm)SWEAT Index (Unit-Less)Wind Speed (Knot)Accumulated Precipitation (%)SWEAT Index (%)Wind Speed (%)
125–26 April 201741.41179.660.314310.9462214
218–19 July 201710.72116.731.42417.3193149
330–31 August 201713.62208.5104.326711.96672140
416–17 September 201719.420211.867.129514.42464622
527–28 September 201718.71859.421.12639.913425
628–29 October 201798.718612.1111.218813.11318
-Mean33.81879.765.923311.3952516
Table 4. Mean monthly values for the earthquake indicators and two climatic variables of accumulated precipitation and SWEAT index during a year (2017).
Date (Month)SWEAT IndexAccumulated Precipitation (mm)EQ Freq.EQ Max.
HachijojimaKagoshimaHachijojimaKagoshima
Jan16015712572845.4
Feb1751528867855.7
Mar155149153178915.7
Apr145193140195775.7
May1381407279786.0
Jun230220121217965.5
Jul19825446551176.0
Aug224256127188795.7
Sep251246228250946.1
Oct243227276192956.2
Nov195159122136936.0
Dec15715853511005.8
Publisher’s Note: MDPI stays neutral with regard to jurisdictional claims in published maps and institutional affiliations.

