
Remote Sensing Land Use Evolution in Earthquake-Stricken Regions of Wenchuan County, China


Abstract
:1. Introduction
2. Materials
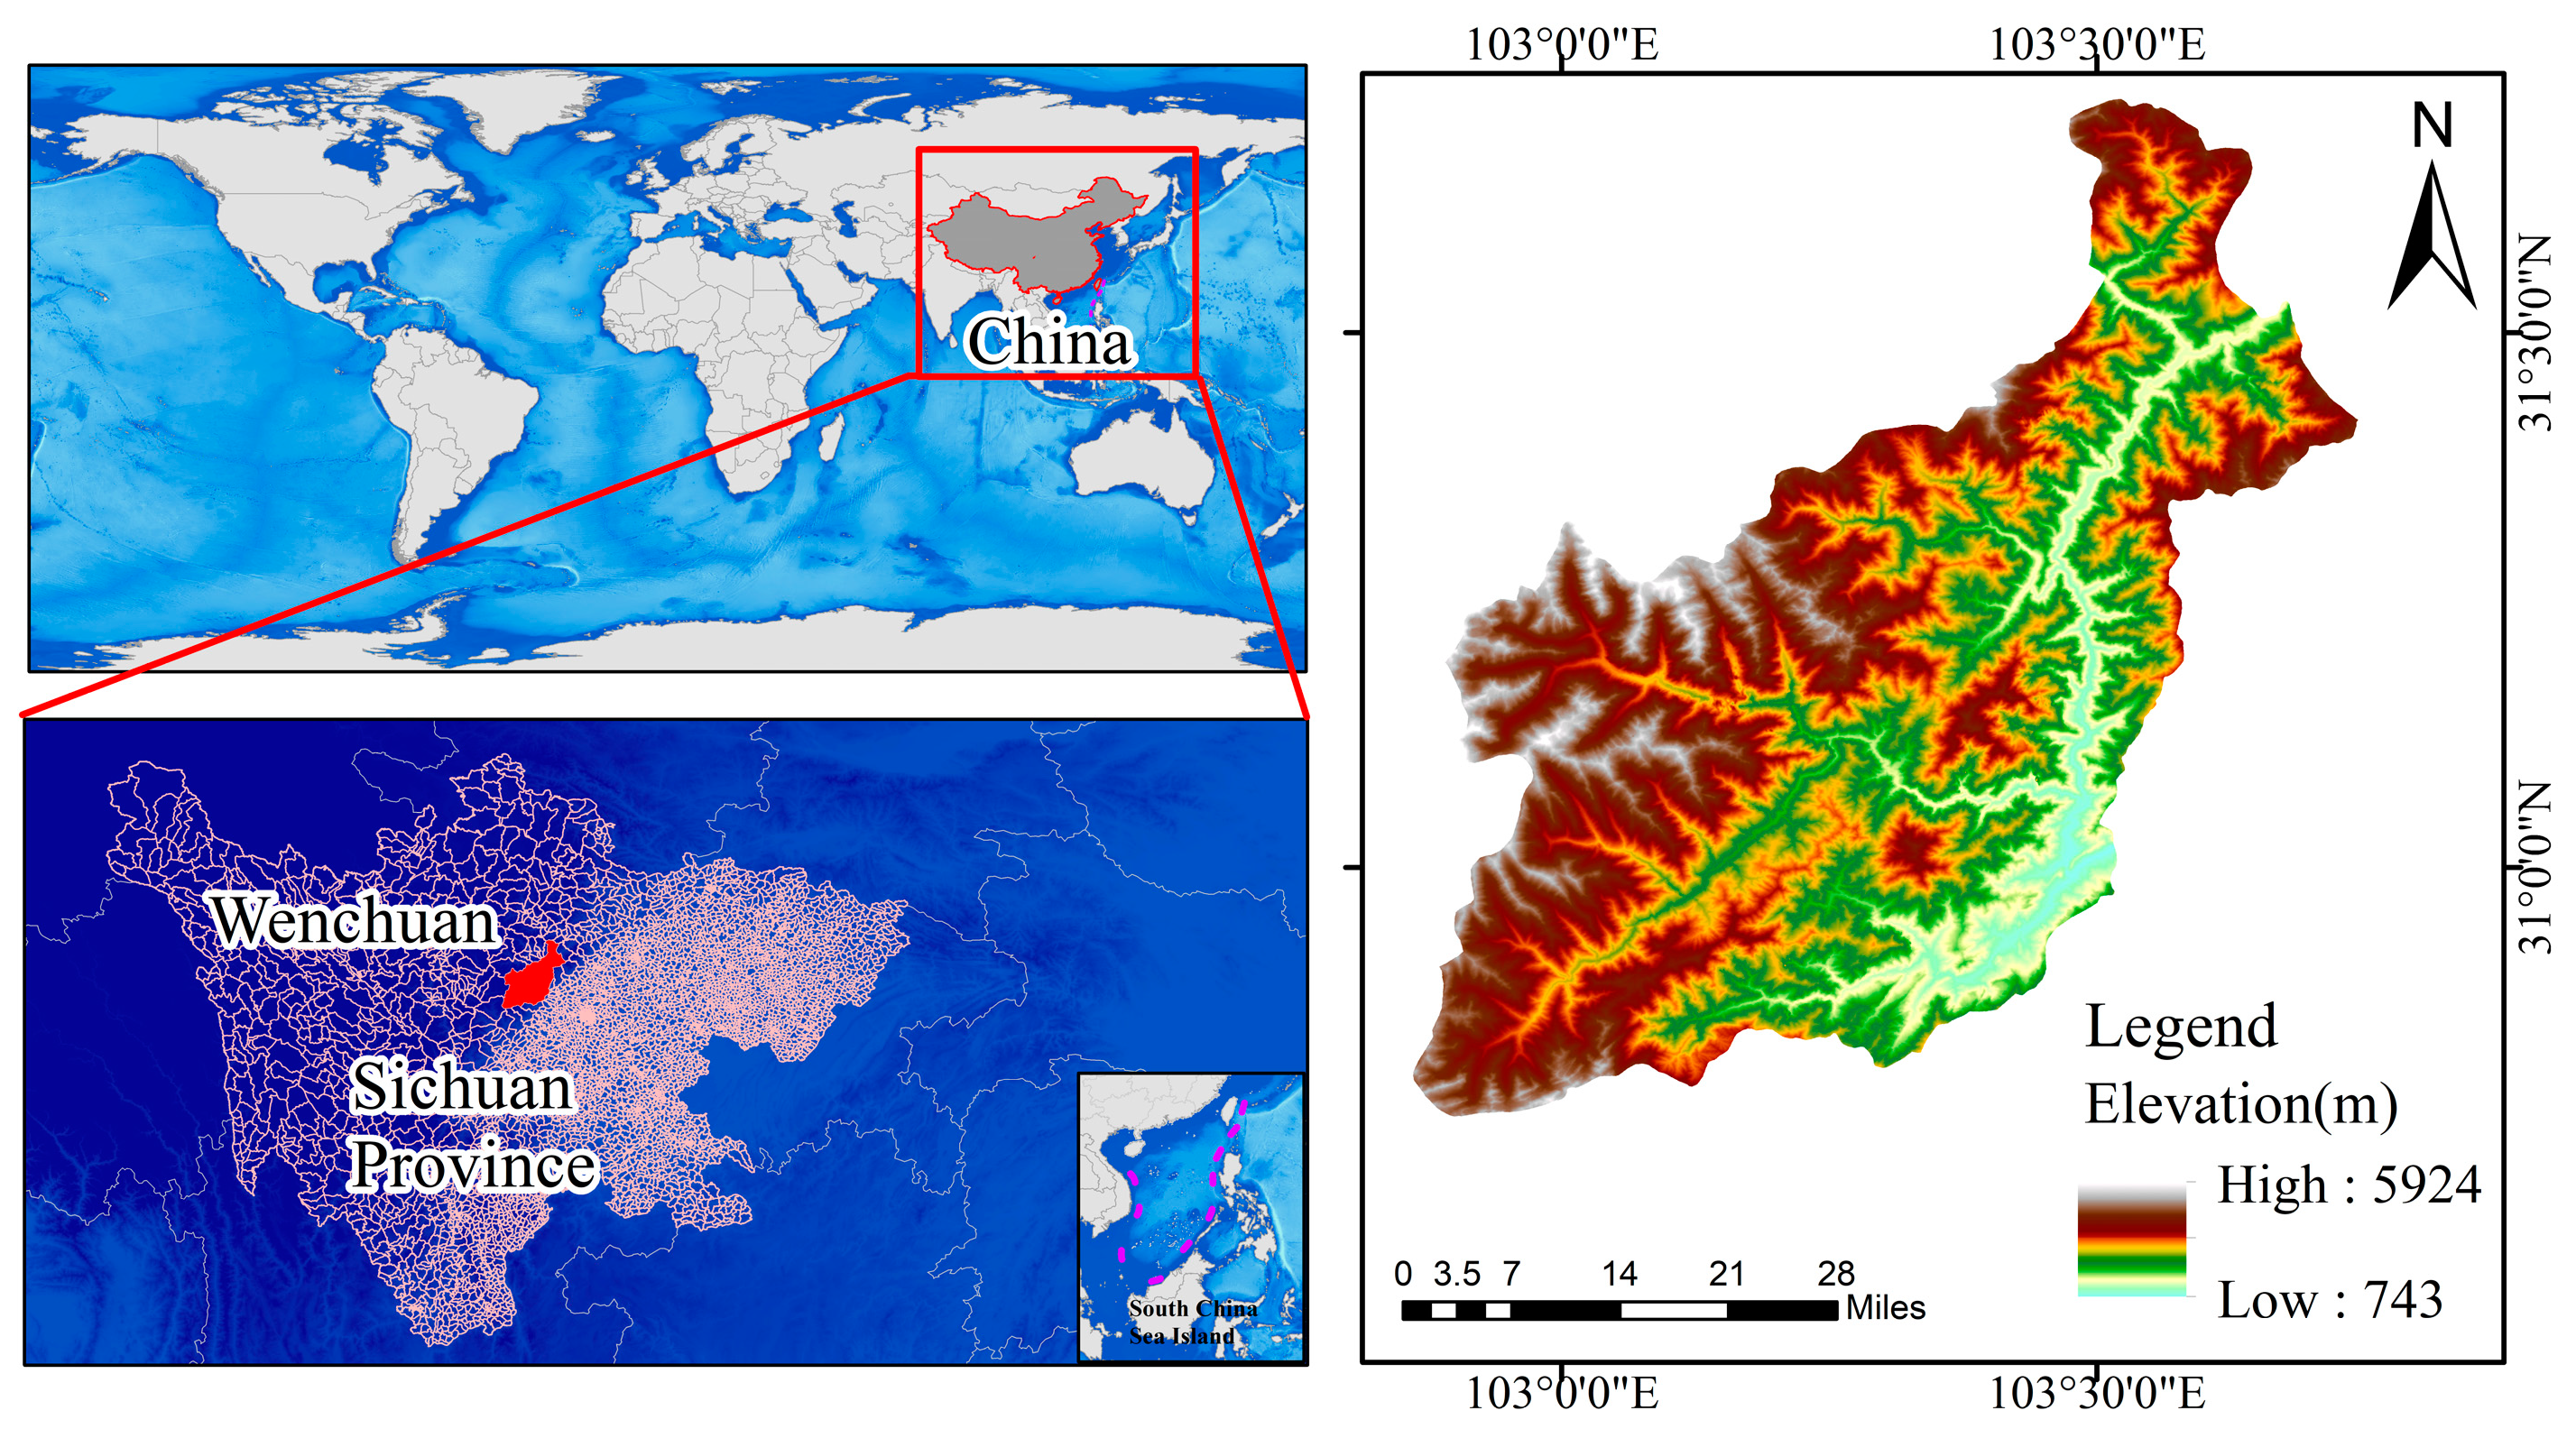
2.1. Study Area
2.2. Data and Preprocessing
3. Methods
3.1. Comprehensive Index of Land Use Degree
3.2. Land Use Transfer Matrix
3.3. Landscape Ecological Index
- (1)
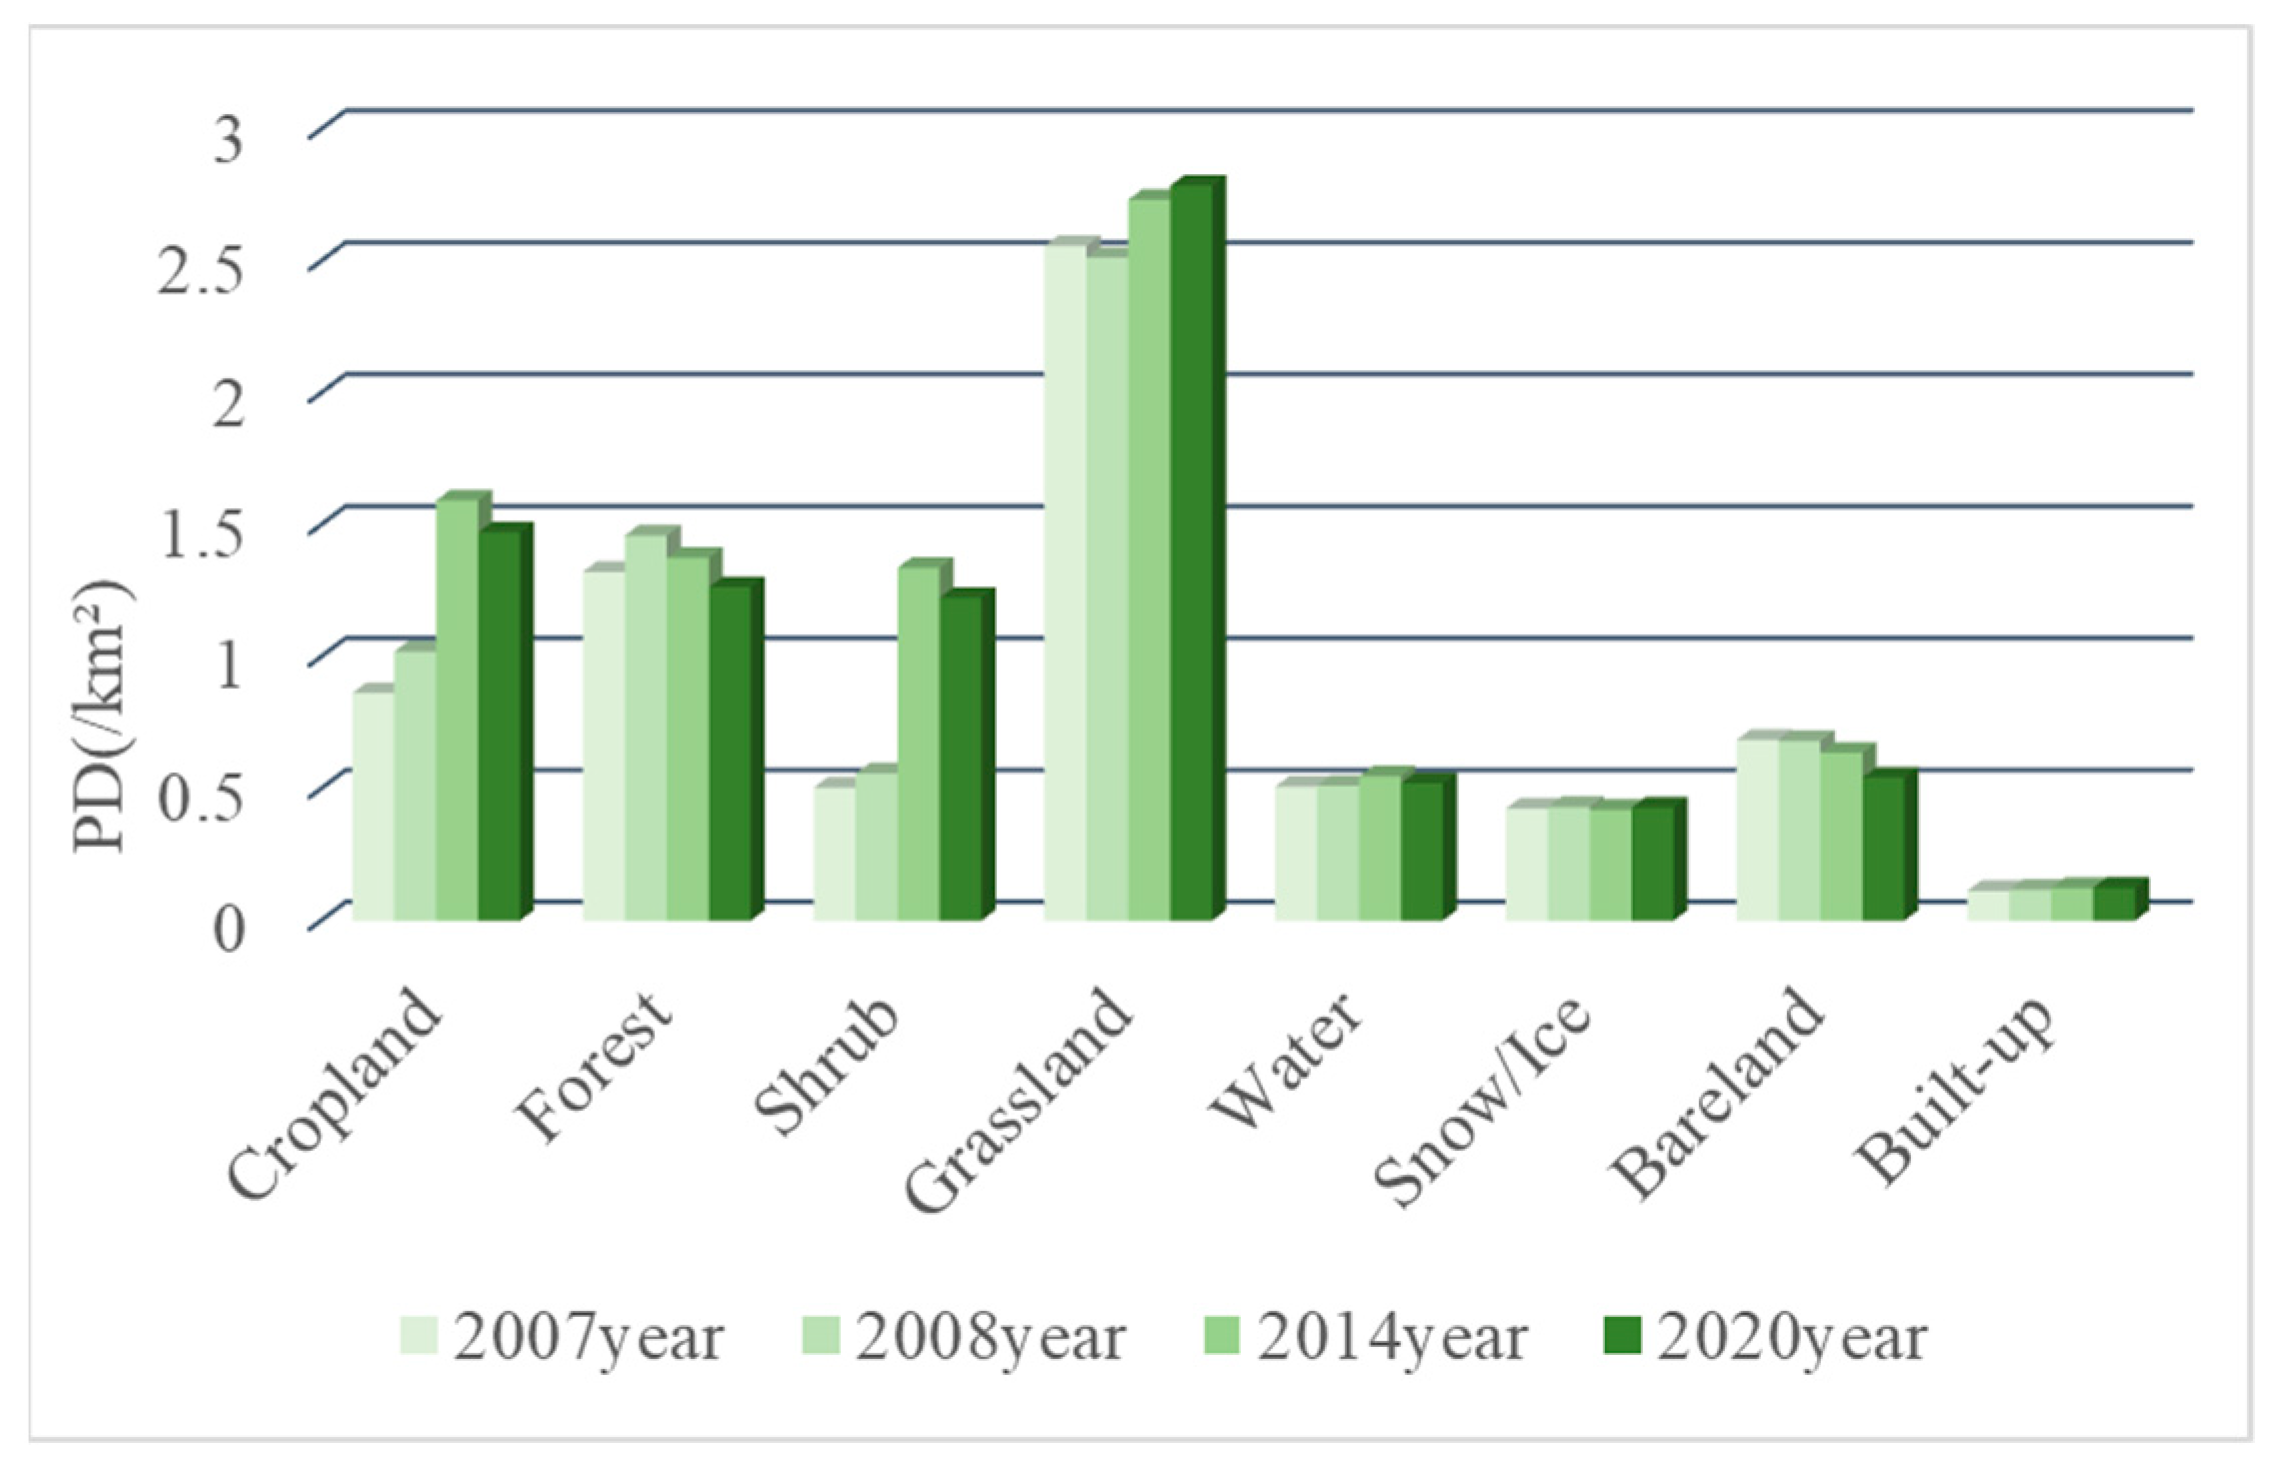
- PD: PD is a measure of landscape fragmentation, which can better reflect the characteristics of landscape heterogeneity. A smaller patch density corresponds to smaller landscape heterogeneity and fragmentation. In addition, the intensity and extensiveness of interactions among landscape elements can also be indirectly reflected by PD. The more active the landscape ecological process is, the higher the PD value is. The calculation formula of PD is as follows:where, N represents the total number of patches in the landscape; A represents the total landscape area.
- (2)
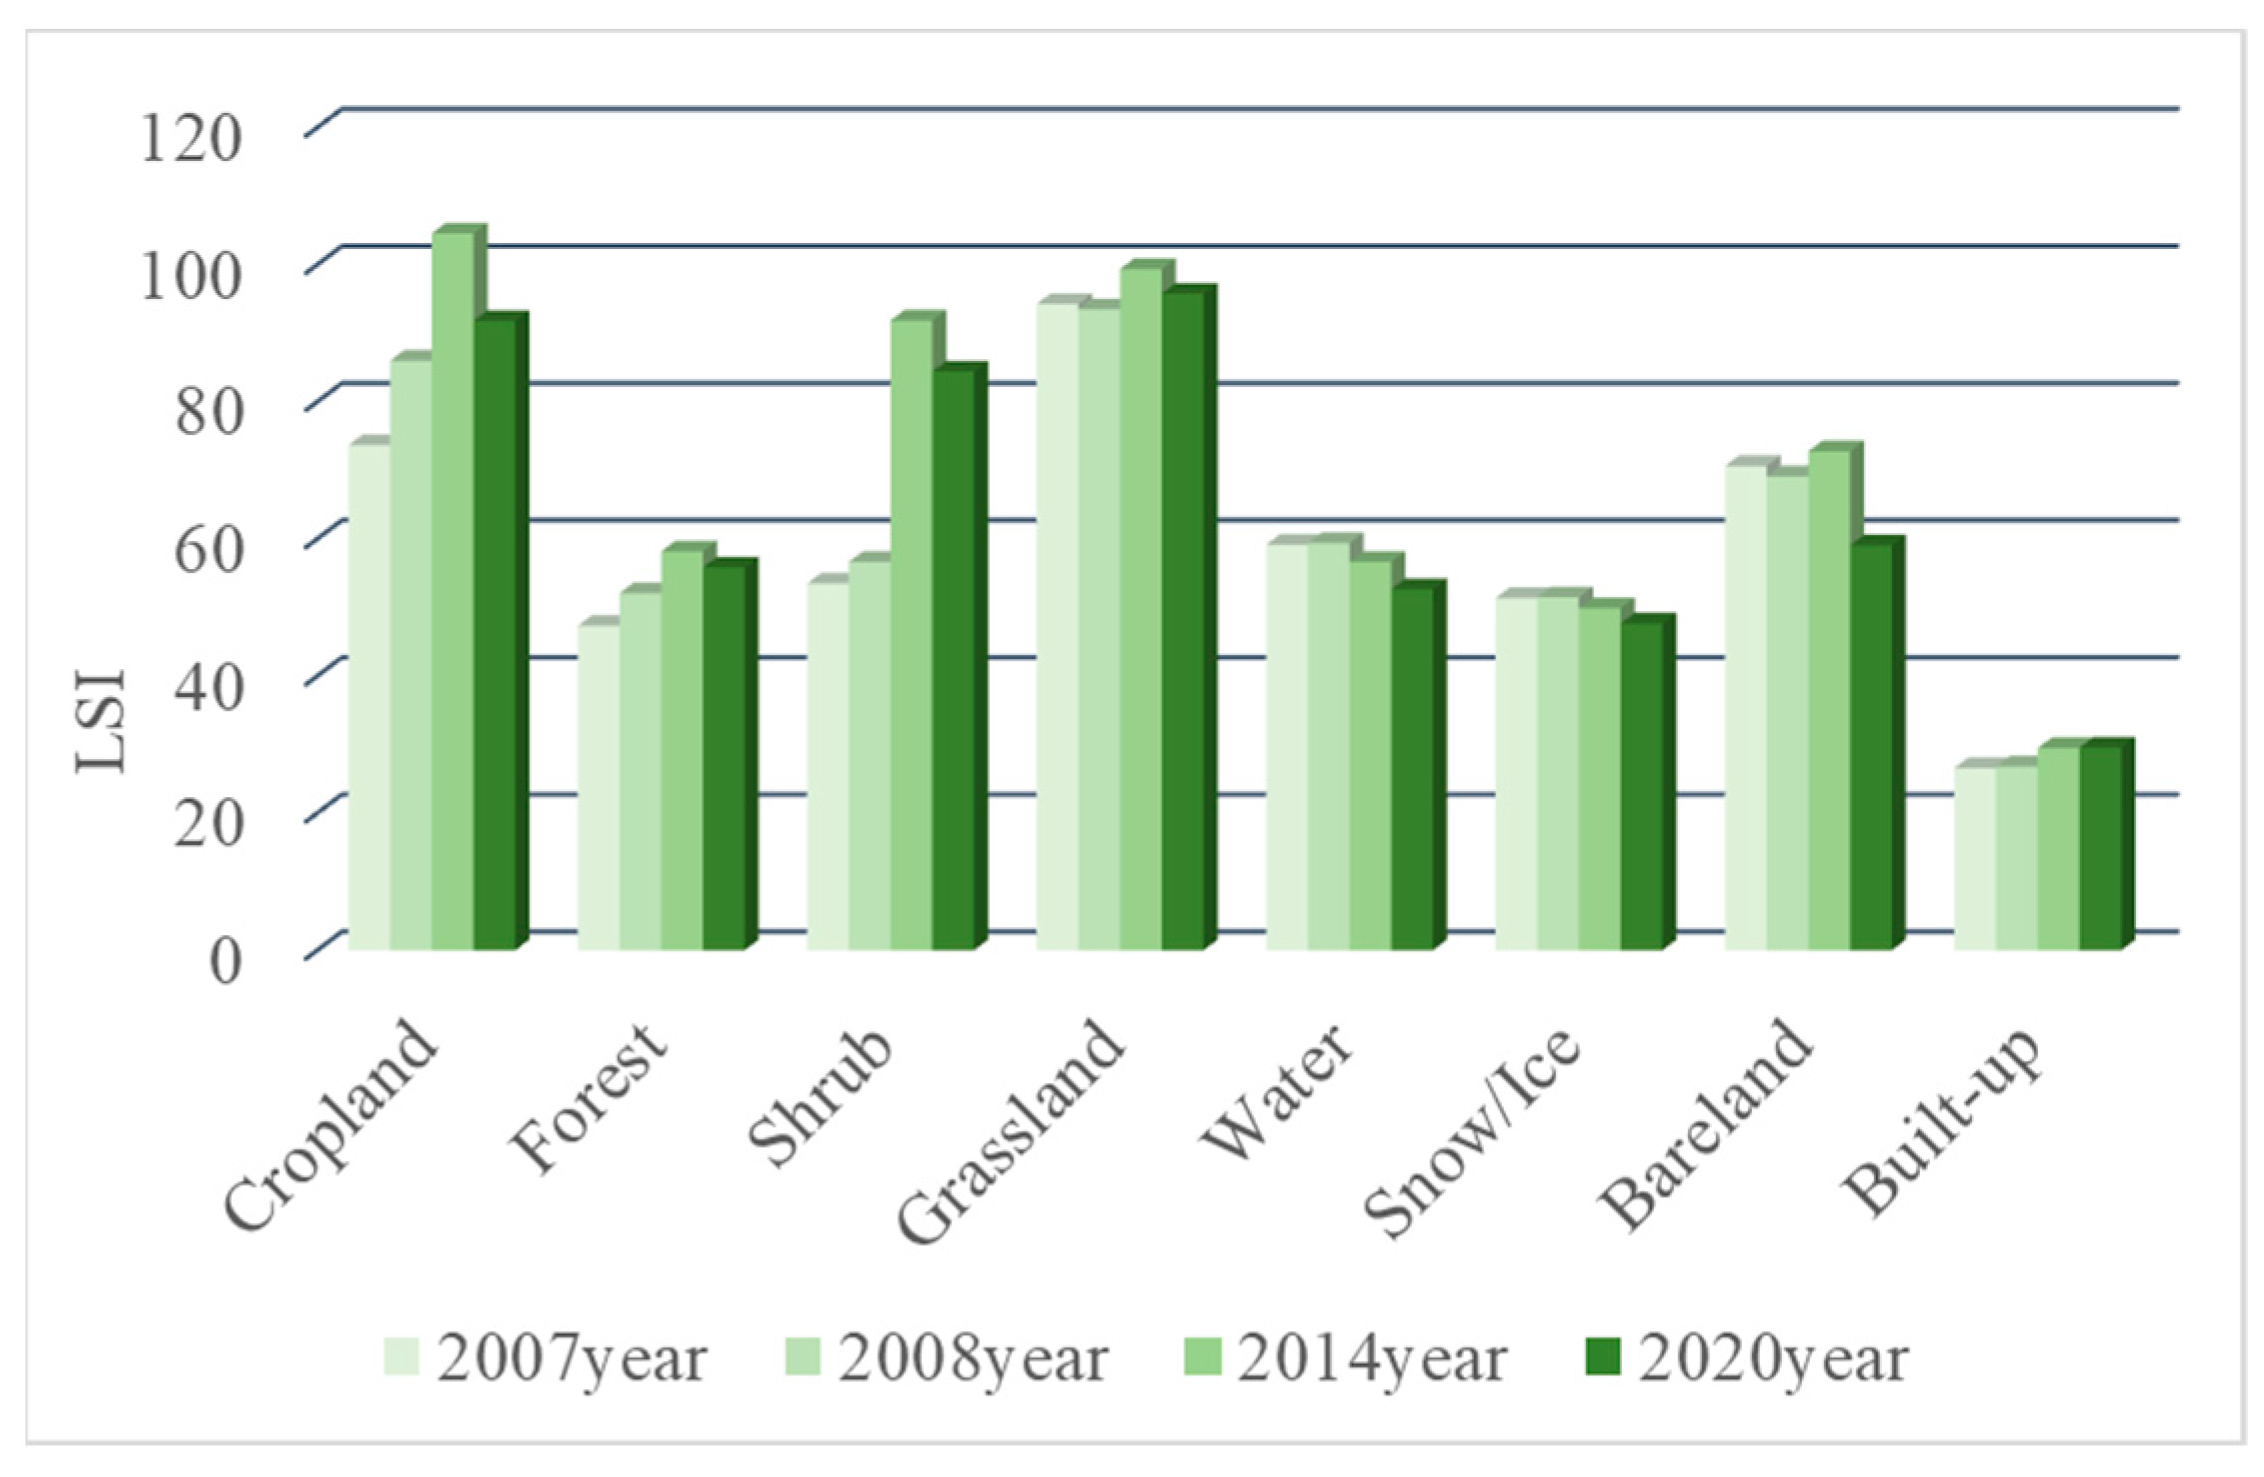
- LSI: LSI is a landscape index used to describe landscape pattern characteristics based on the shape of the landscape. The shape of the landscape is simple, which means that the LSI value is close to 1. If a square can be used to describe the landscape shape, the LSI value is 1. The larger the deviation between the landscape shape and square, the larger the LSI value. LSI is calculated as follows:where, represents the total length of all patch boundaries in the landscape; represents the total landscape area.
- (3)
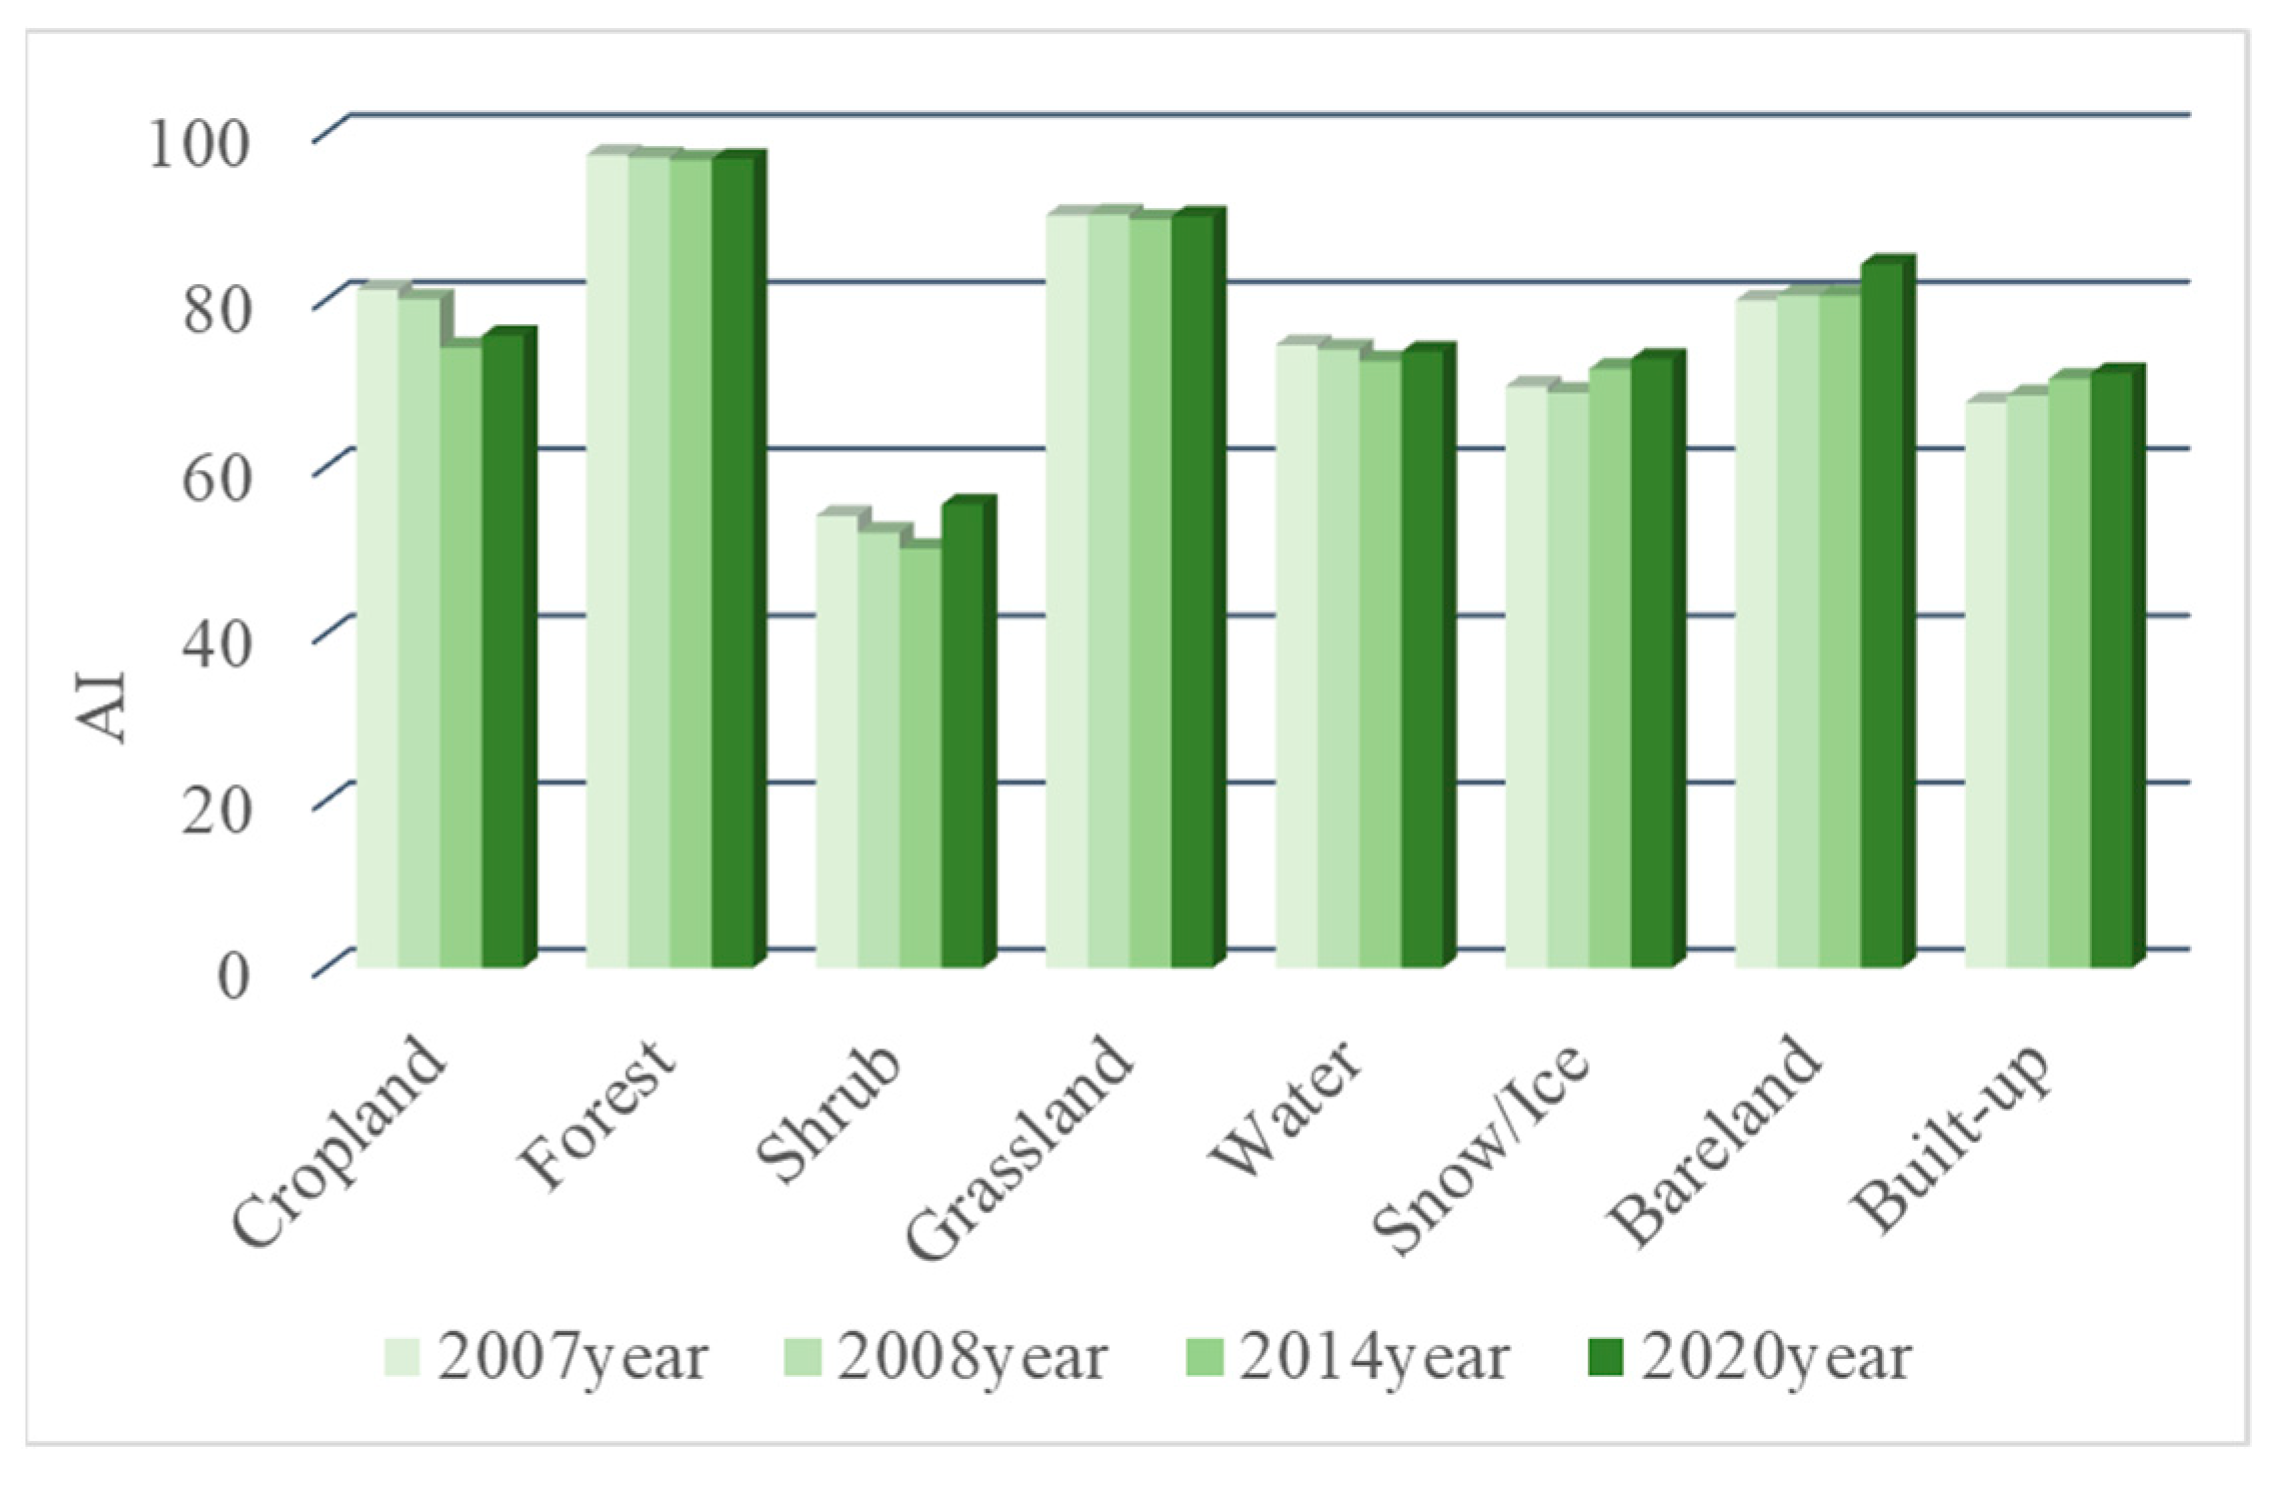
- AI: AI is an important indicator when measuring landscape heterogeneity from the perspective of the connectivity between landscape patches. A small value of AI means that patches in the landscape are scattered and fragmented. The AI calculation formula is as follows:where, represents the number of similar connections between pixels of patch type .
4. Results
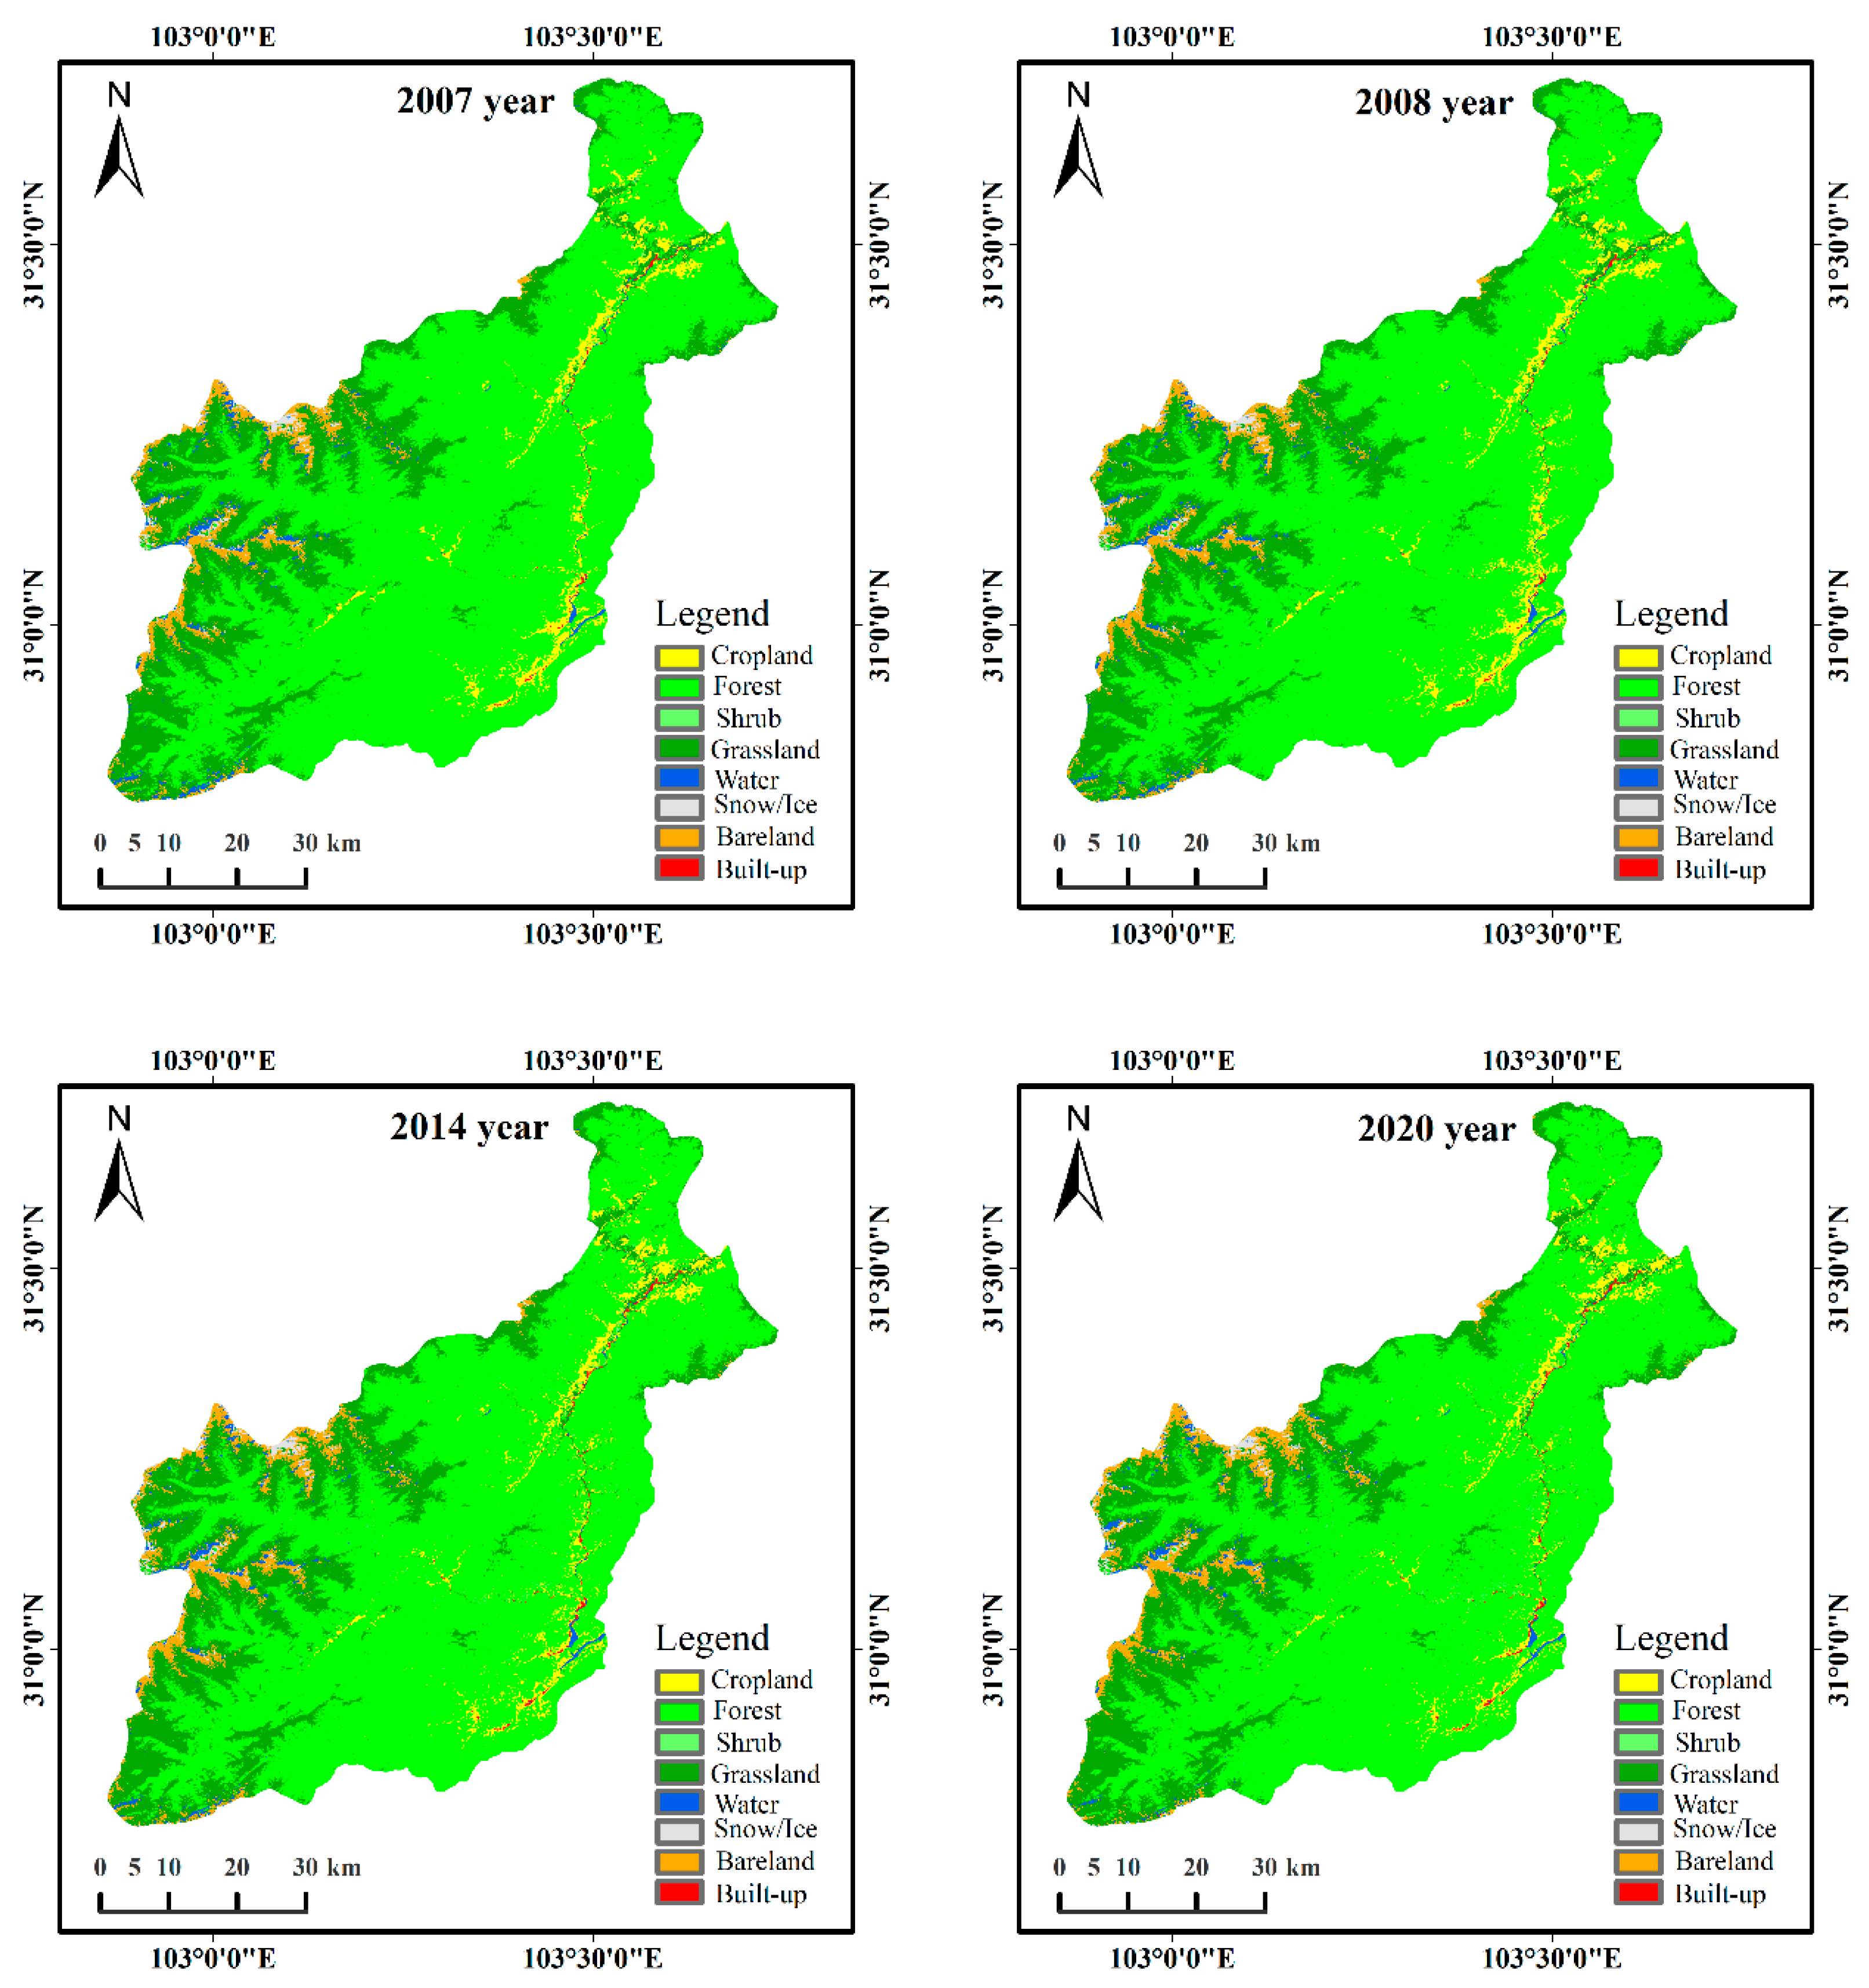
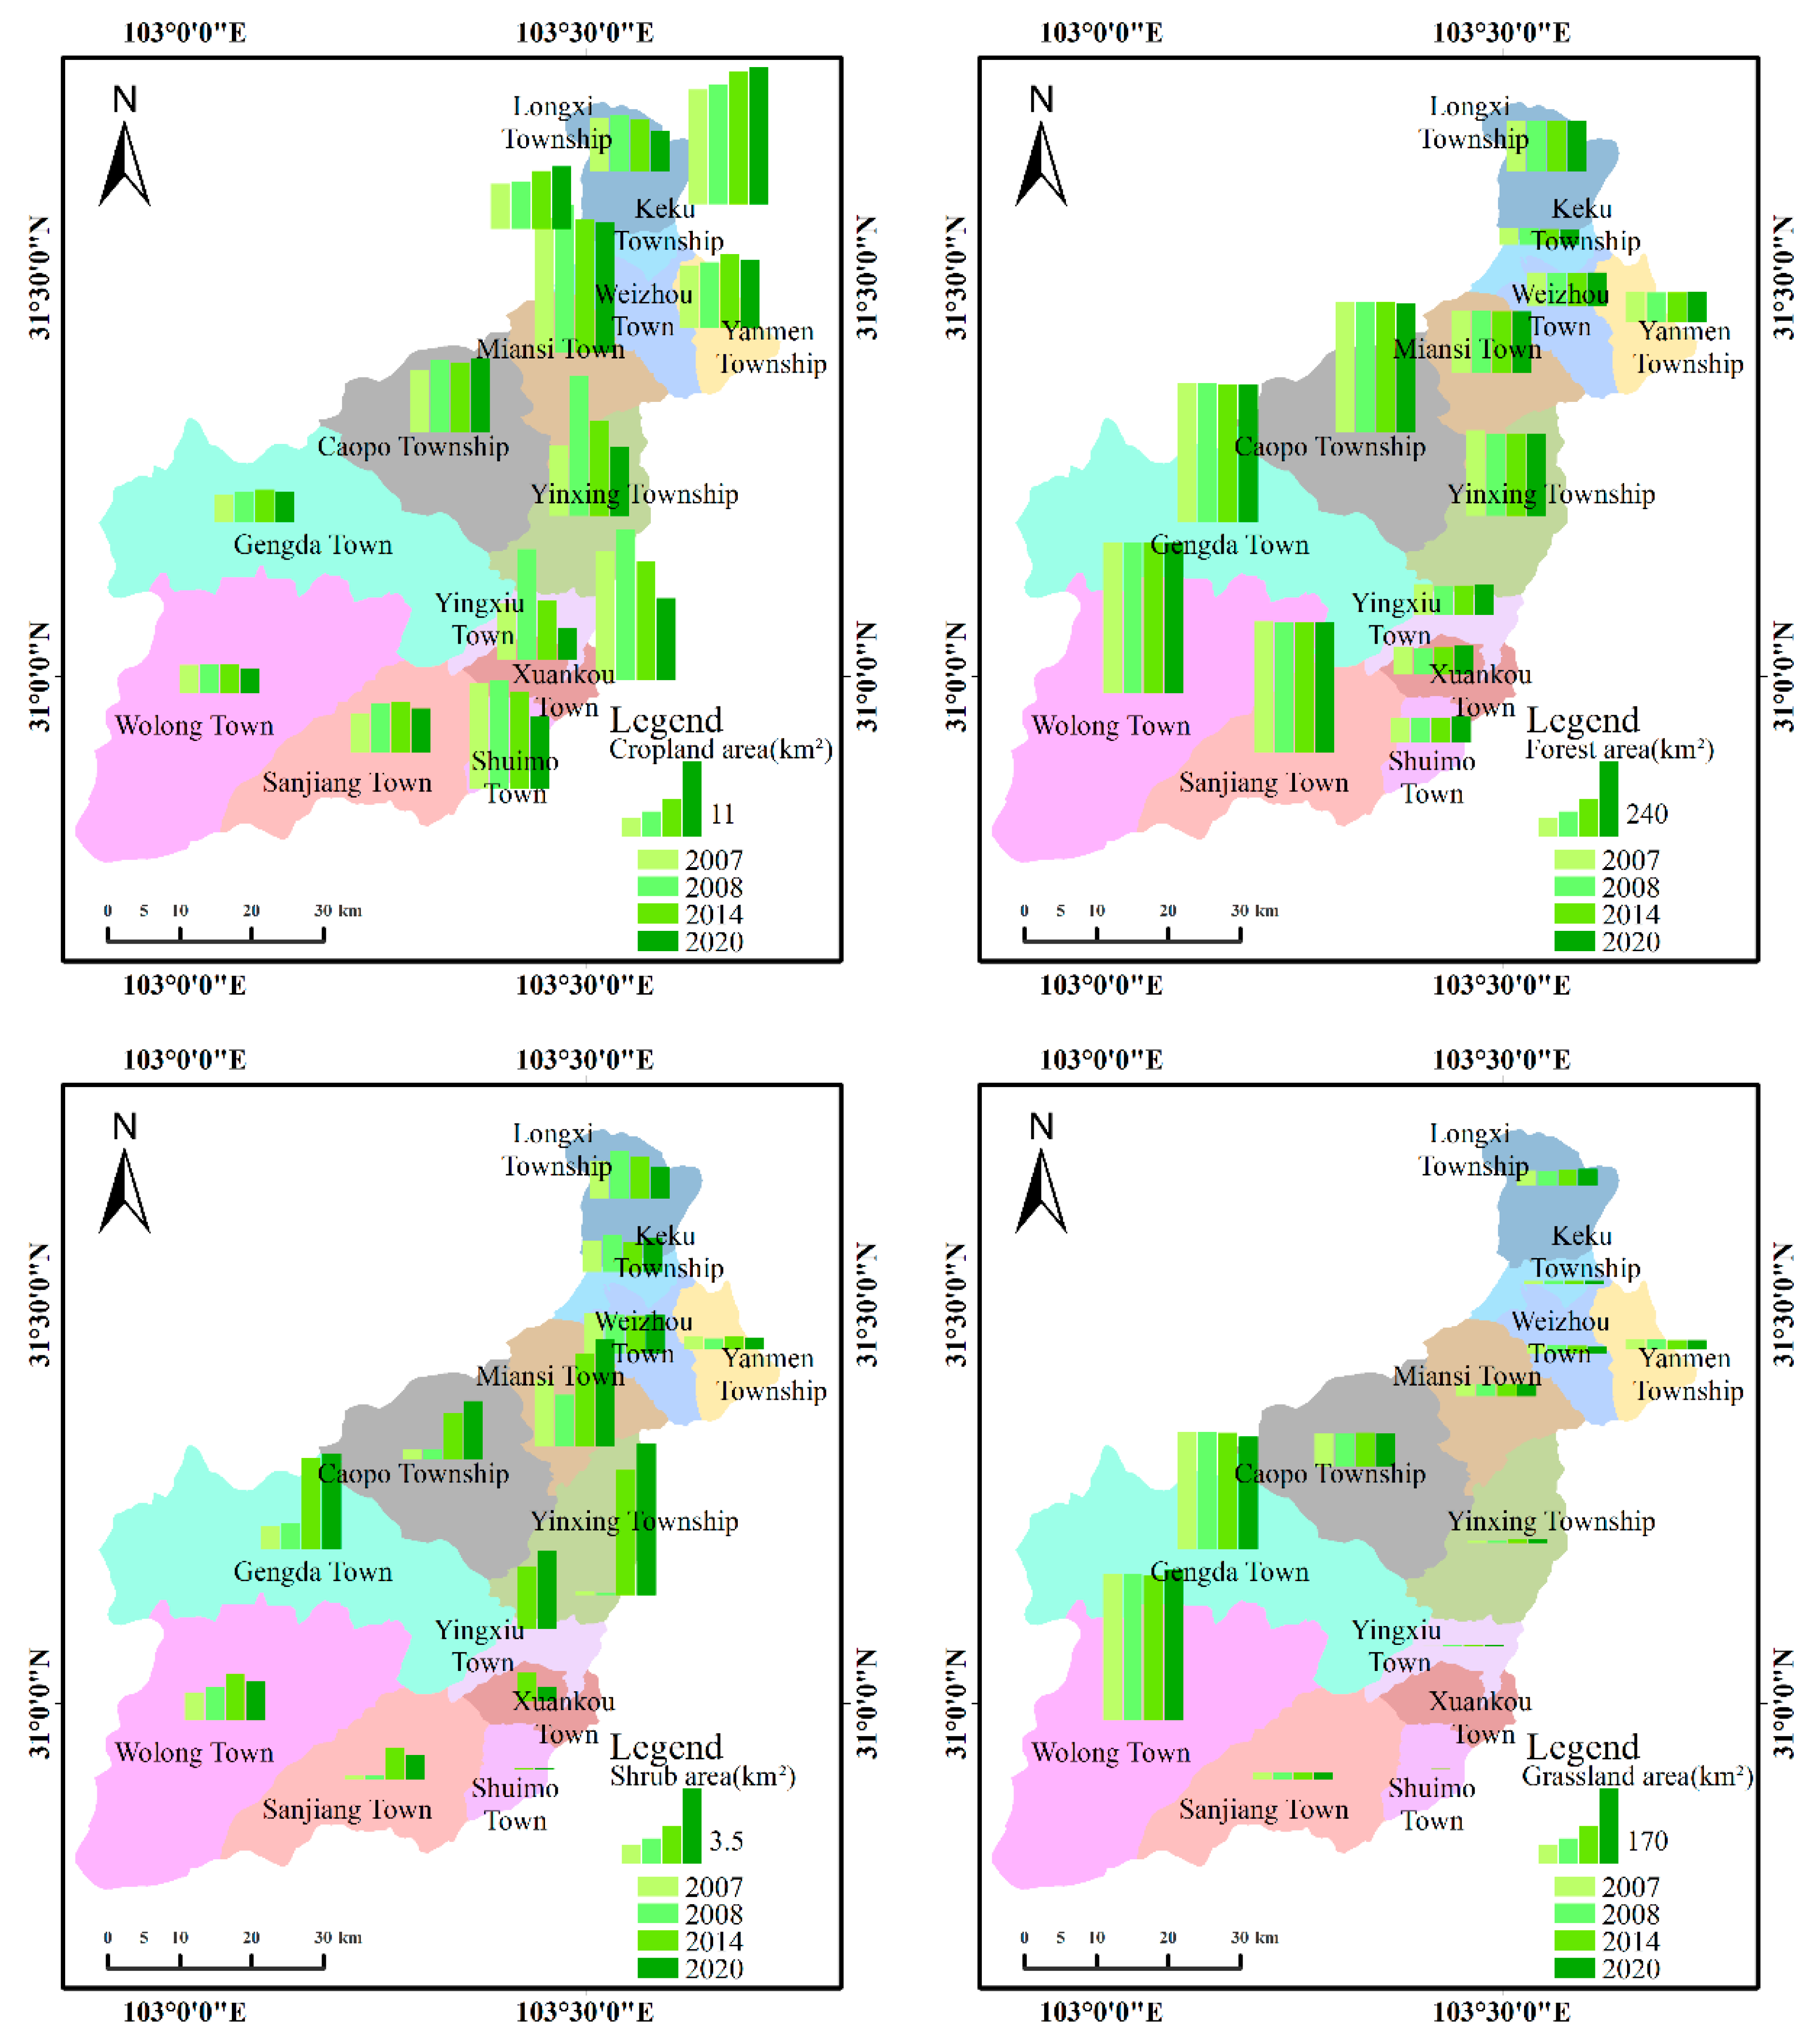
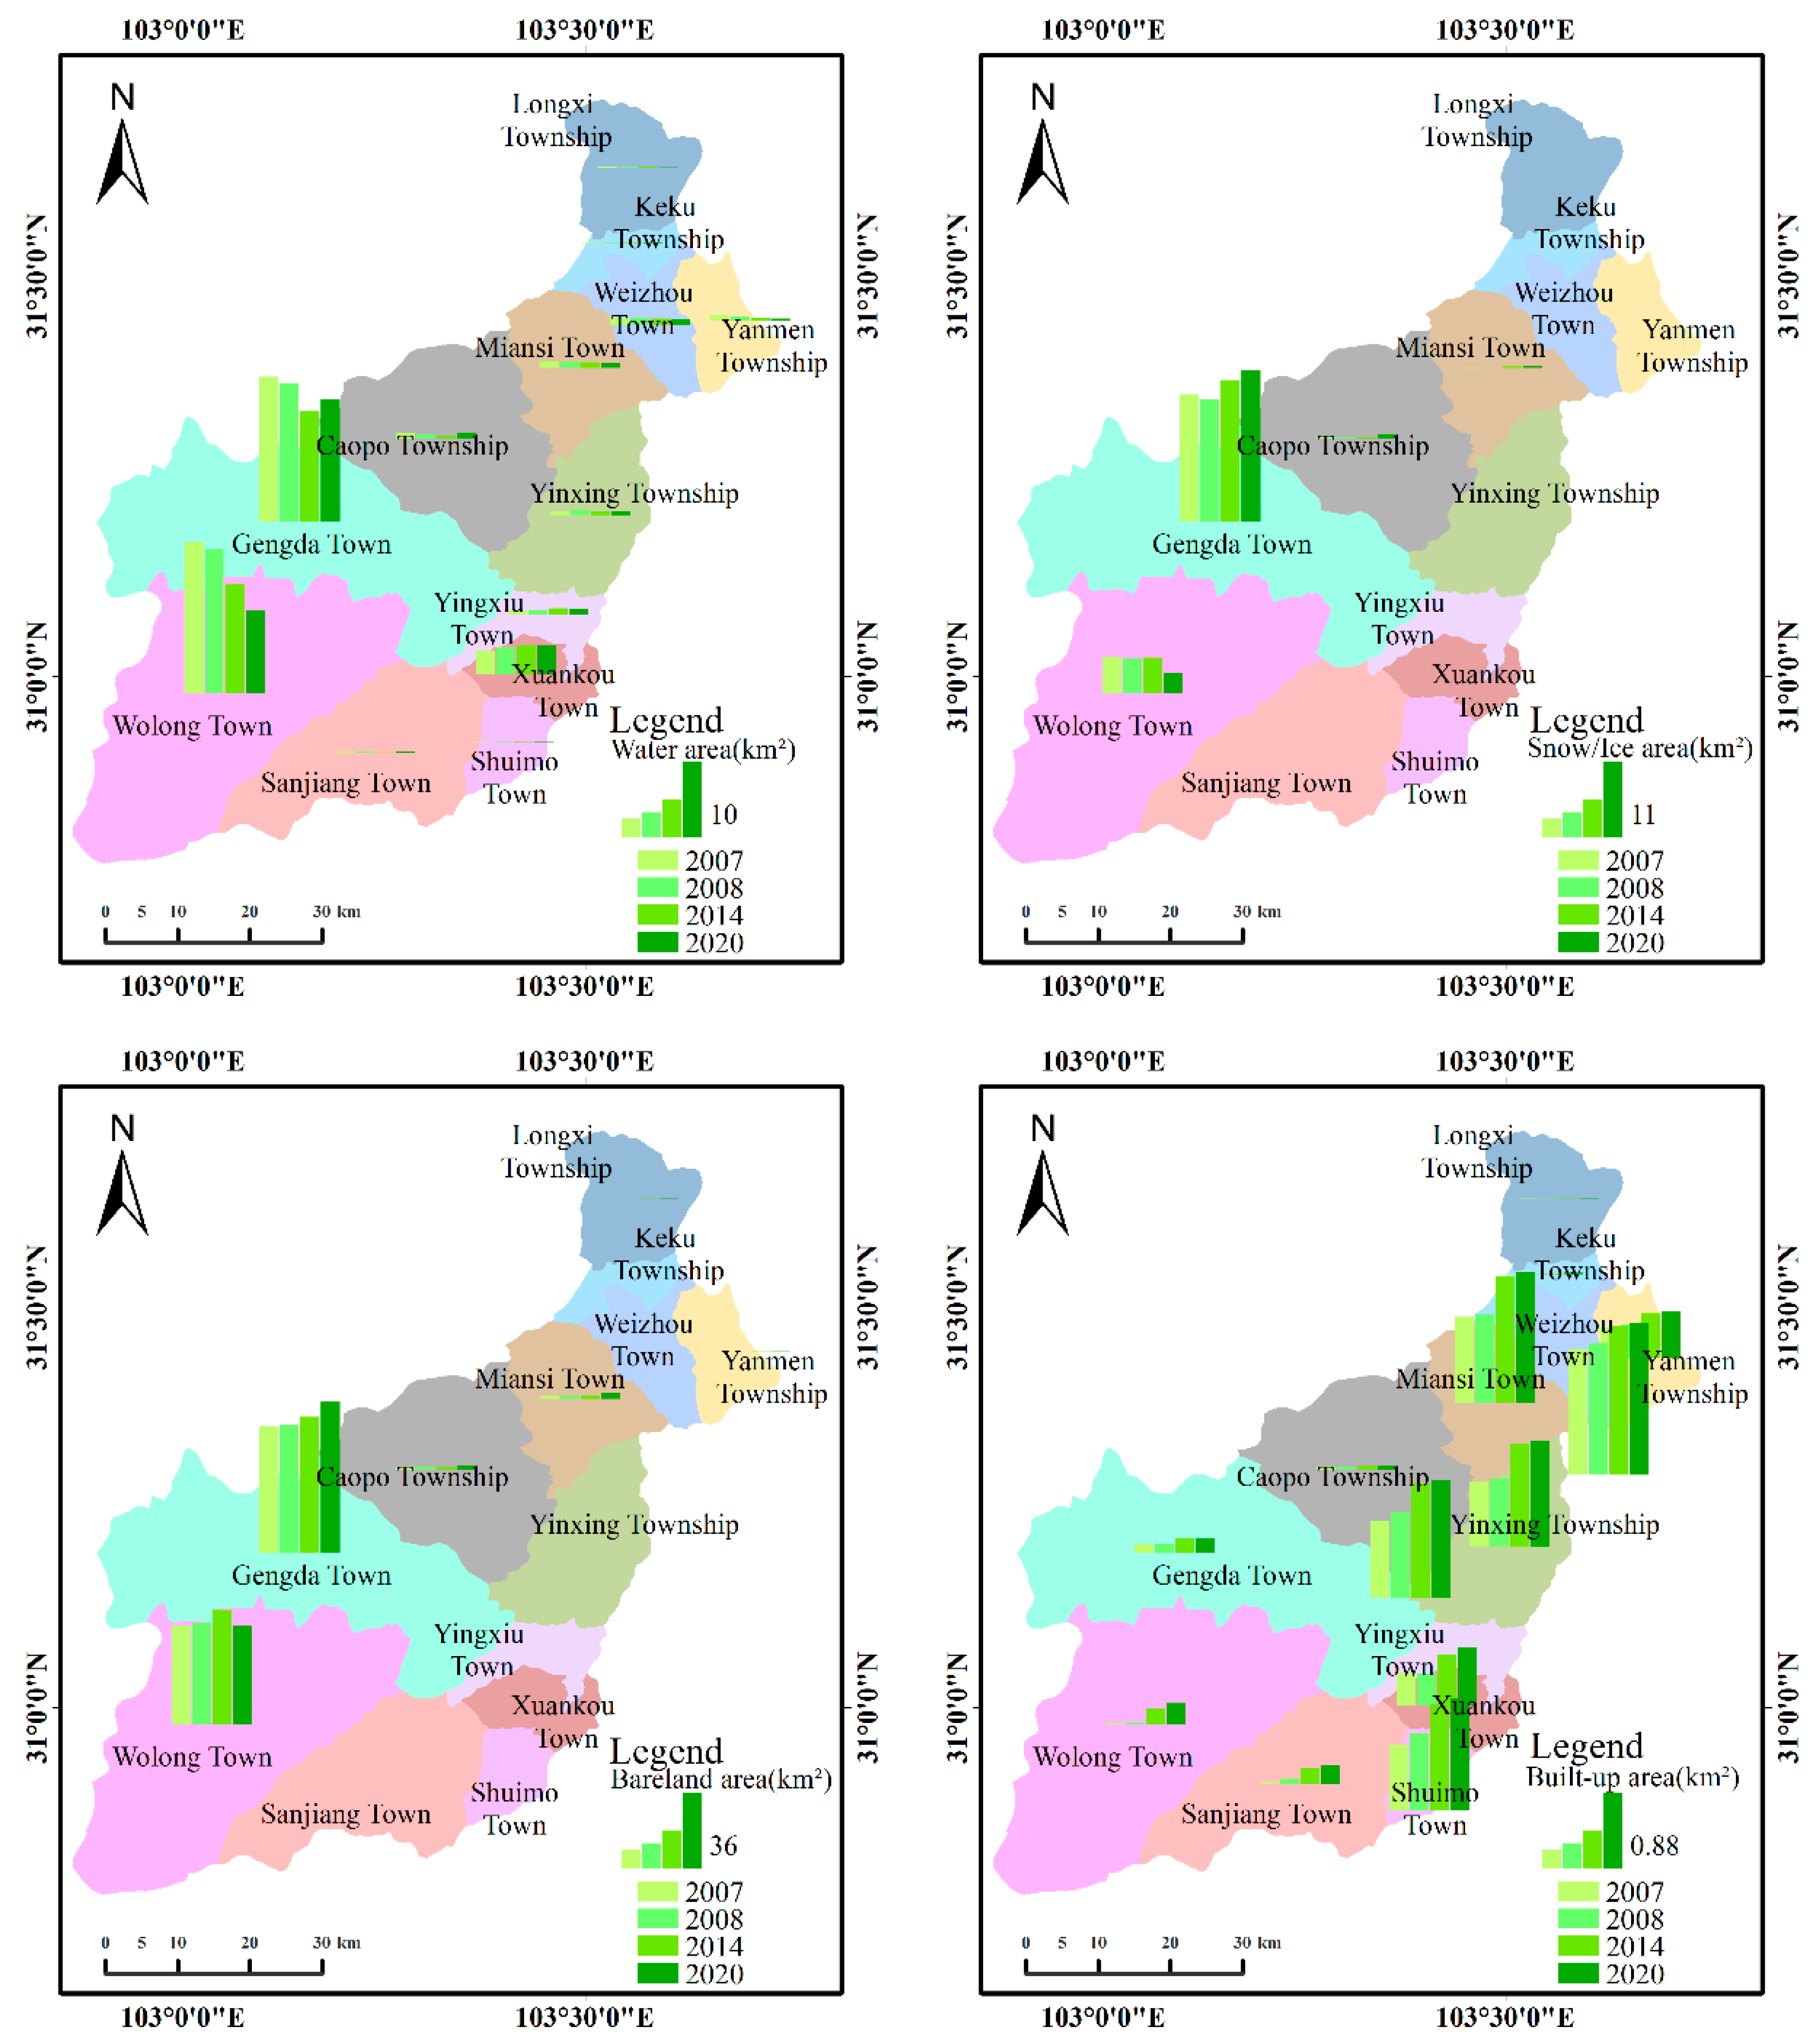
4.1. Land Use Area Change
4.2. Land Use Degree Change
4.3. Land Use Transfer
4.4. Spatial–Temporal Evolution of Landscape Pattern
4.4.1. Temporal Variation Characteristics of Landscape Index
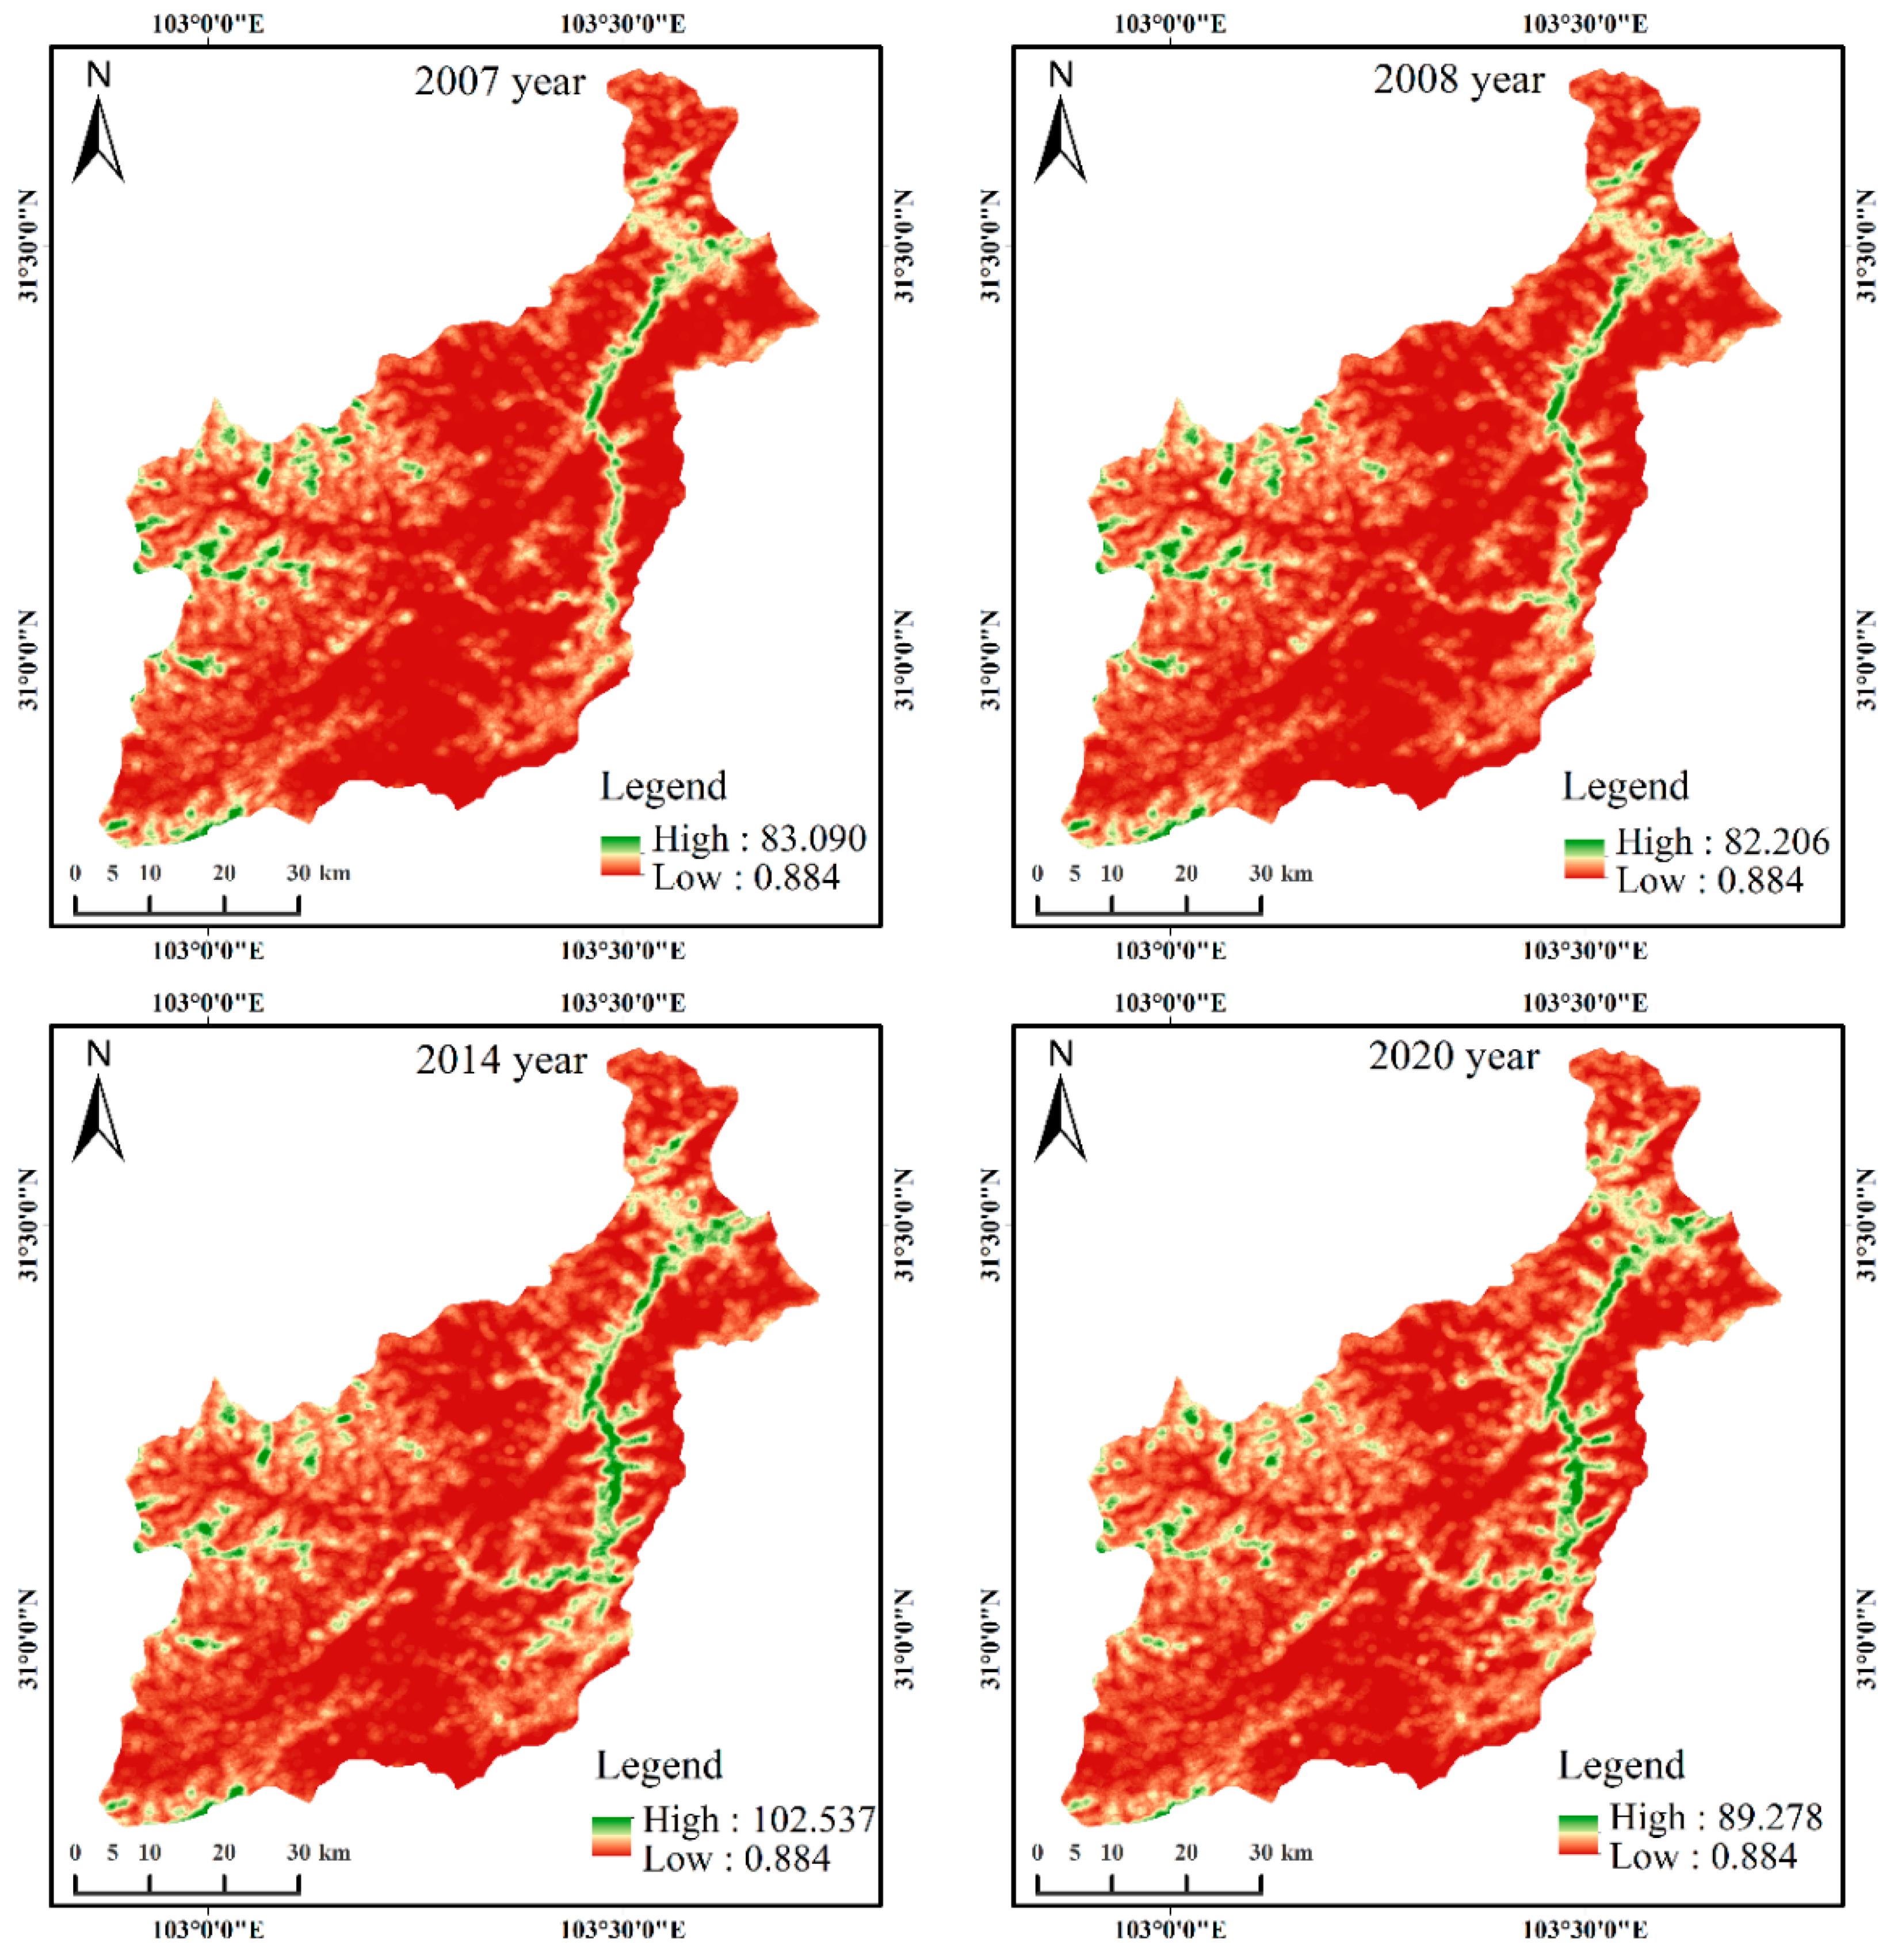
4.4.2. Spatial Variation Characteristics of Landscape Index
4.5. Land Use Change Distribution of Topographic and Geological Conditions
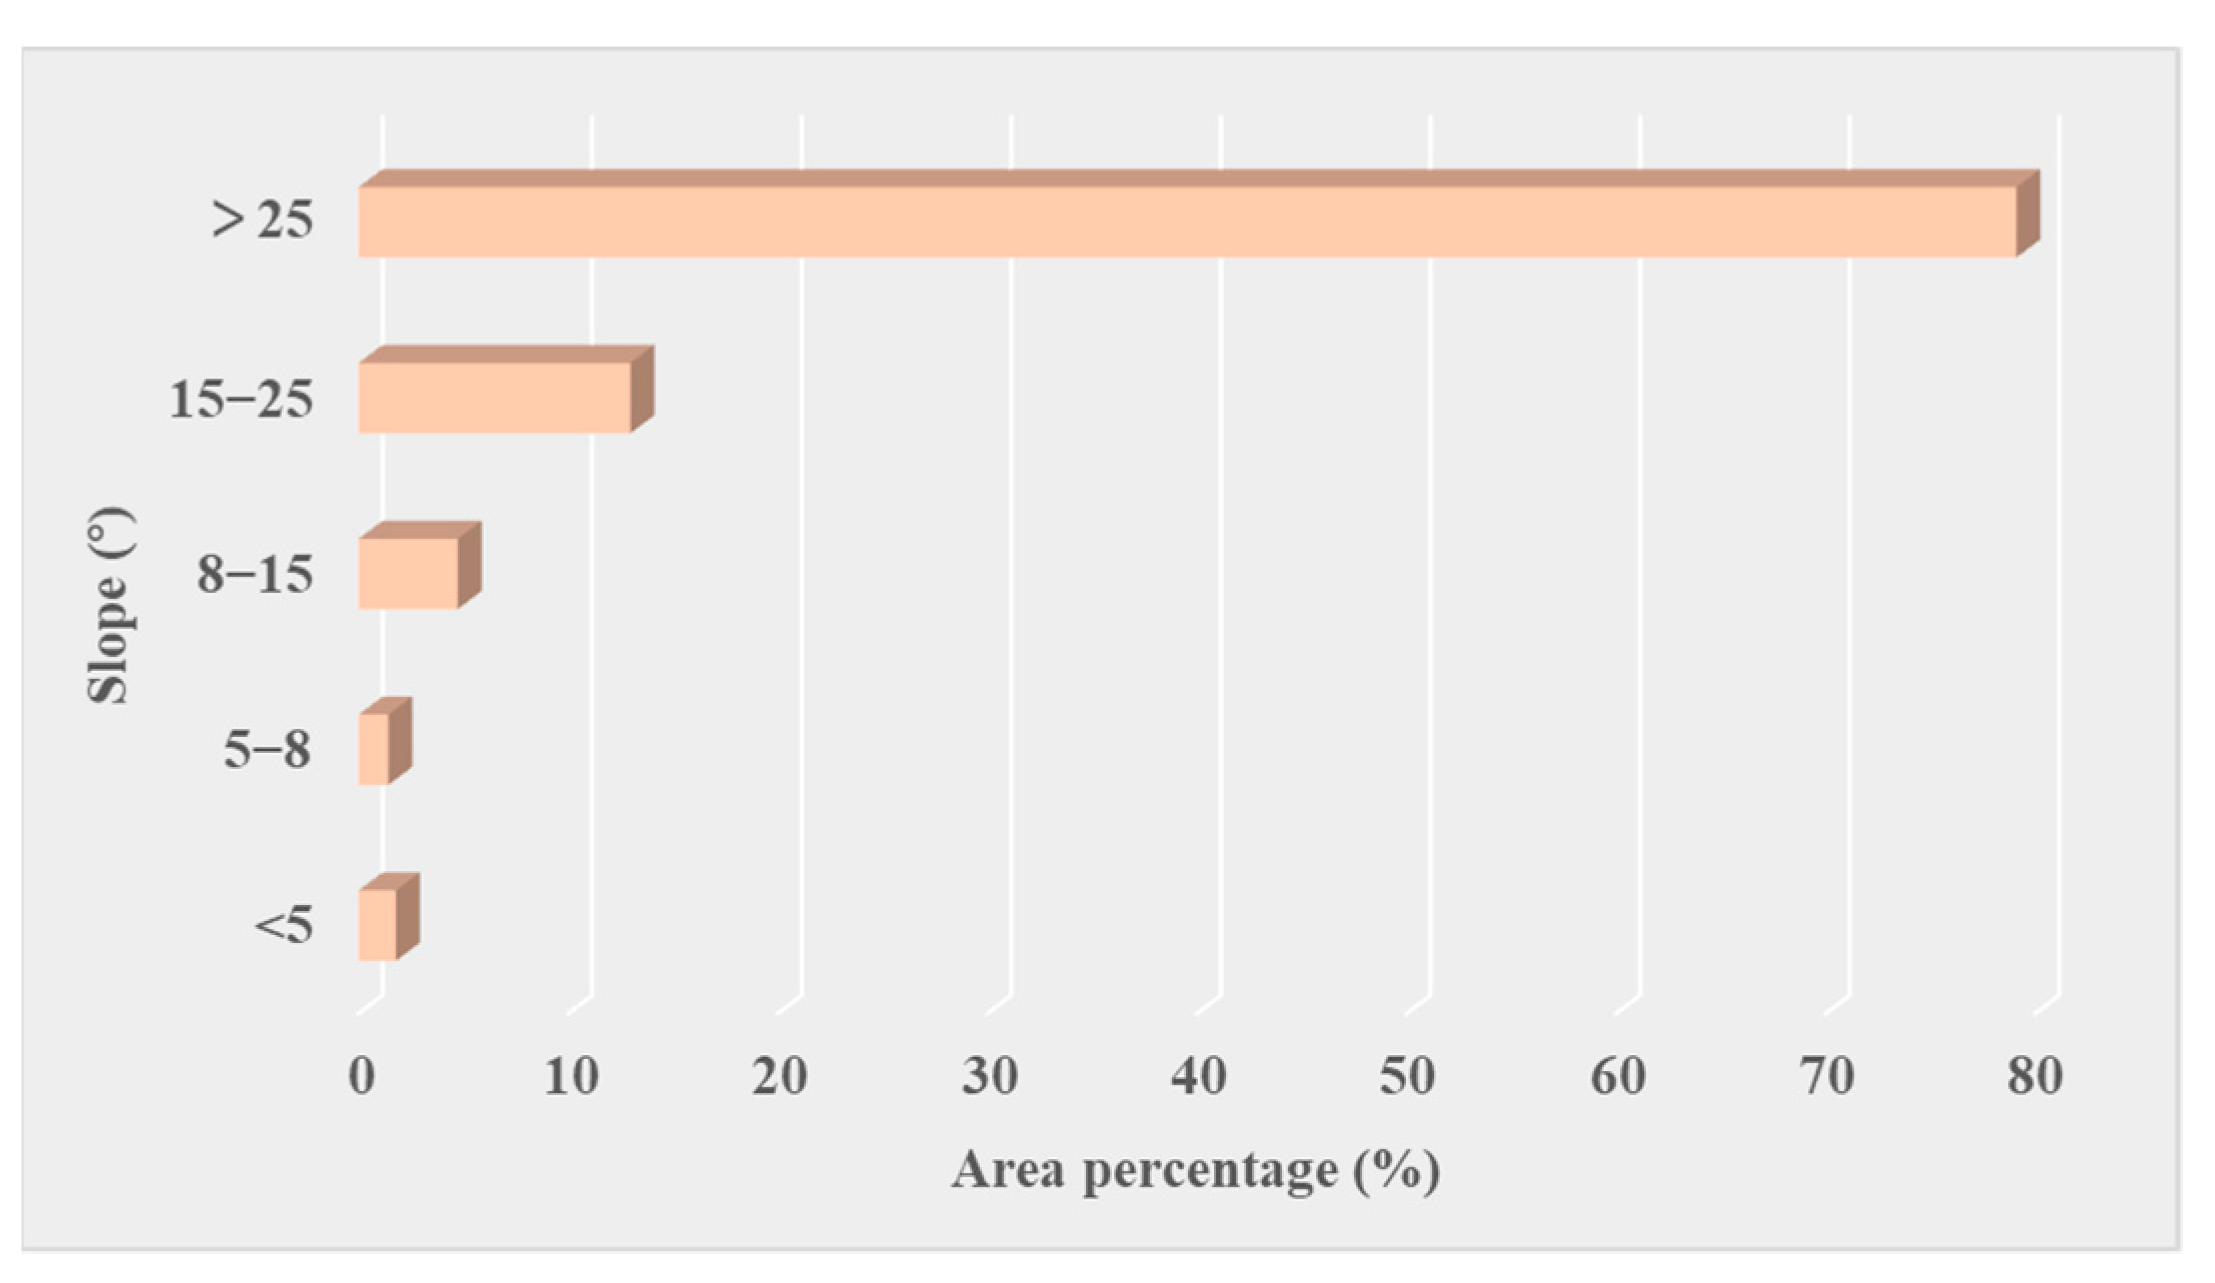
4.5.1. Distribution of Land-Use Change of Different Slope
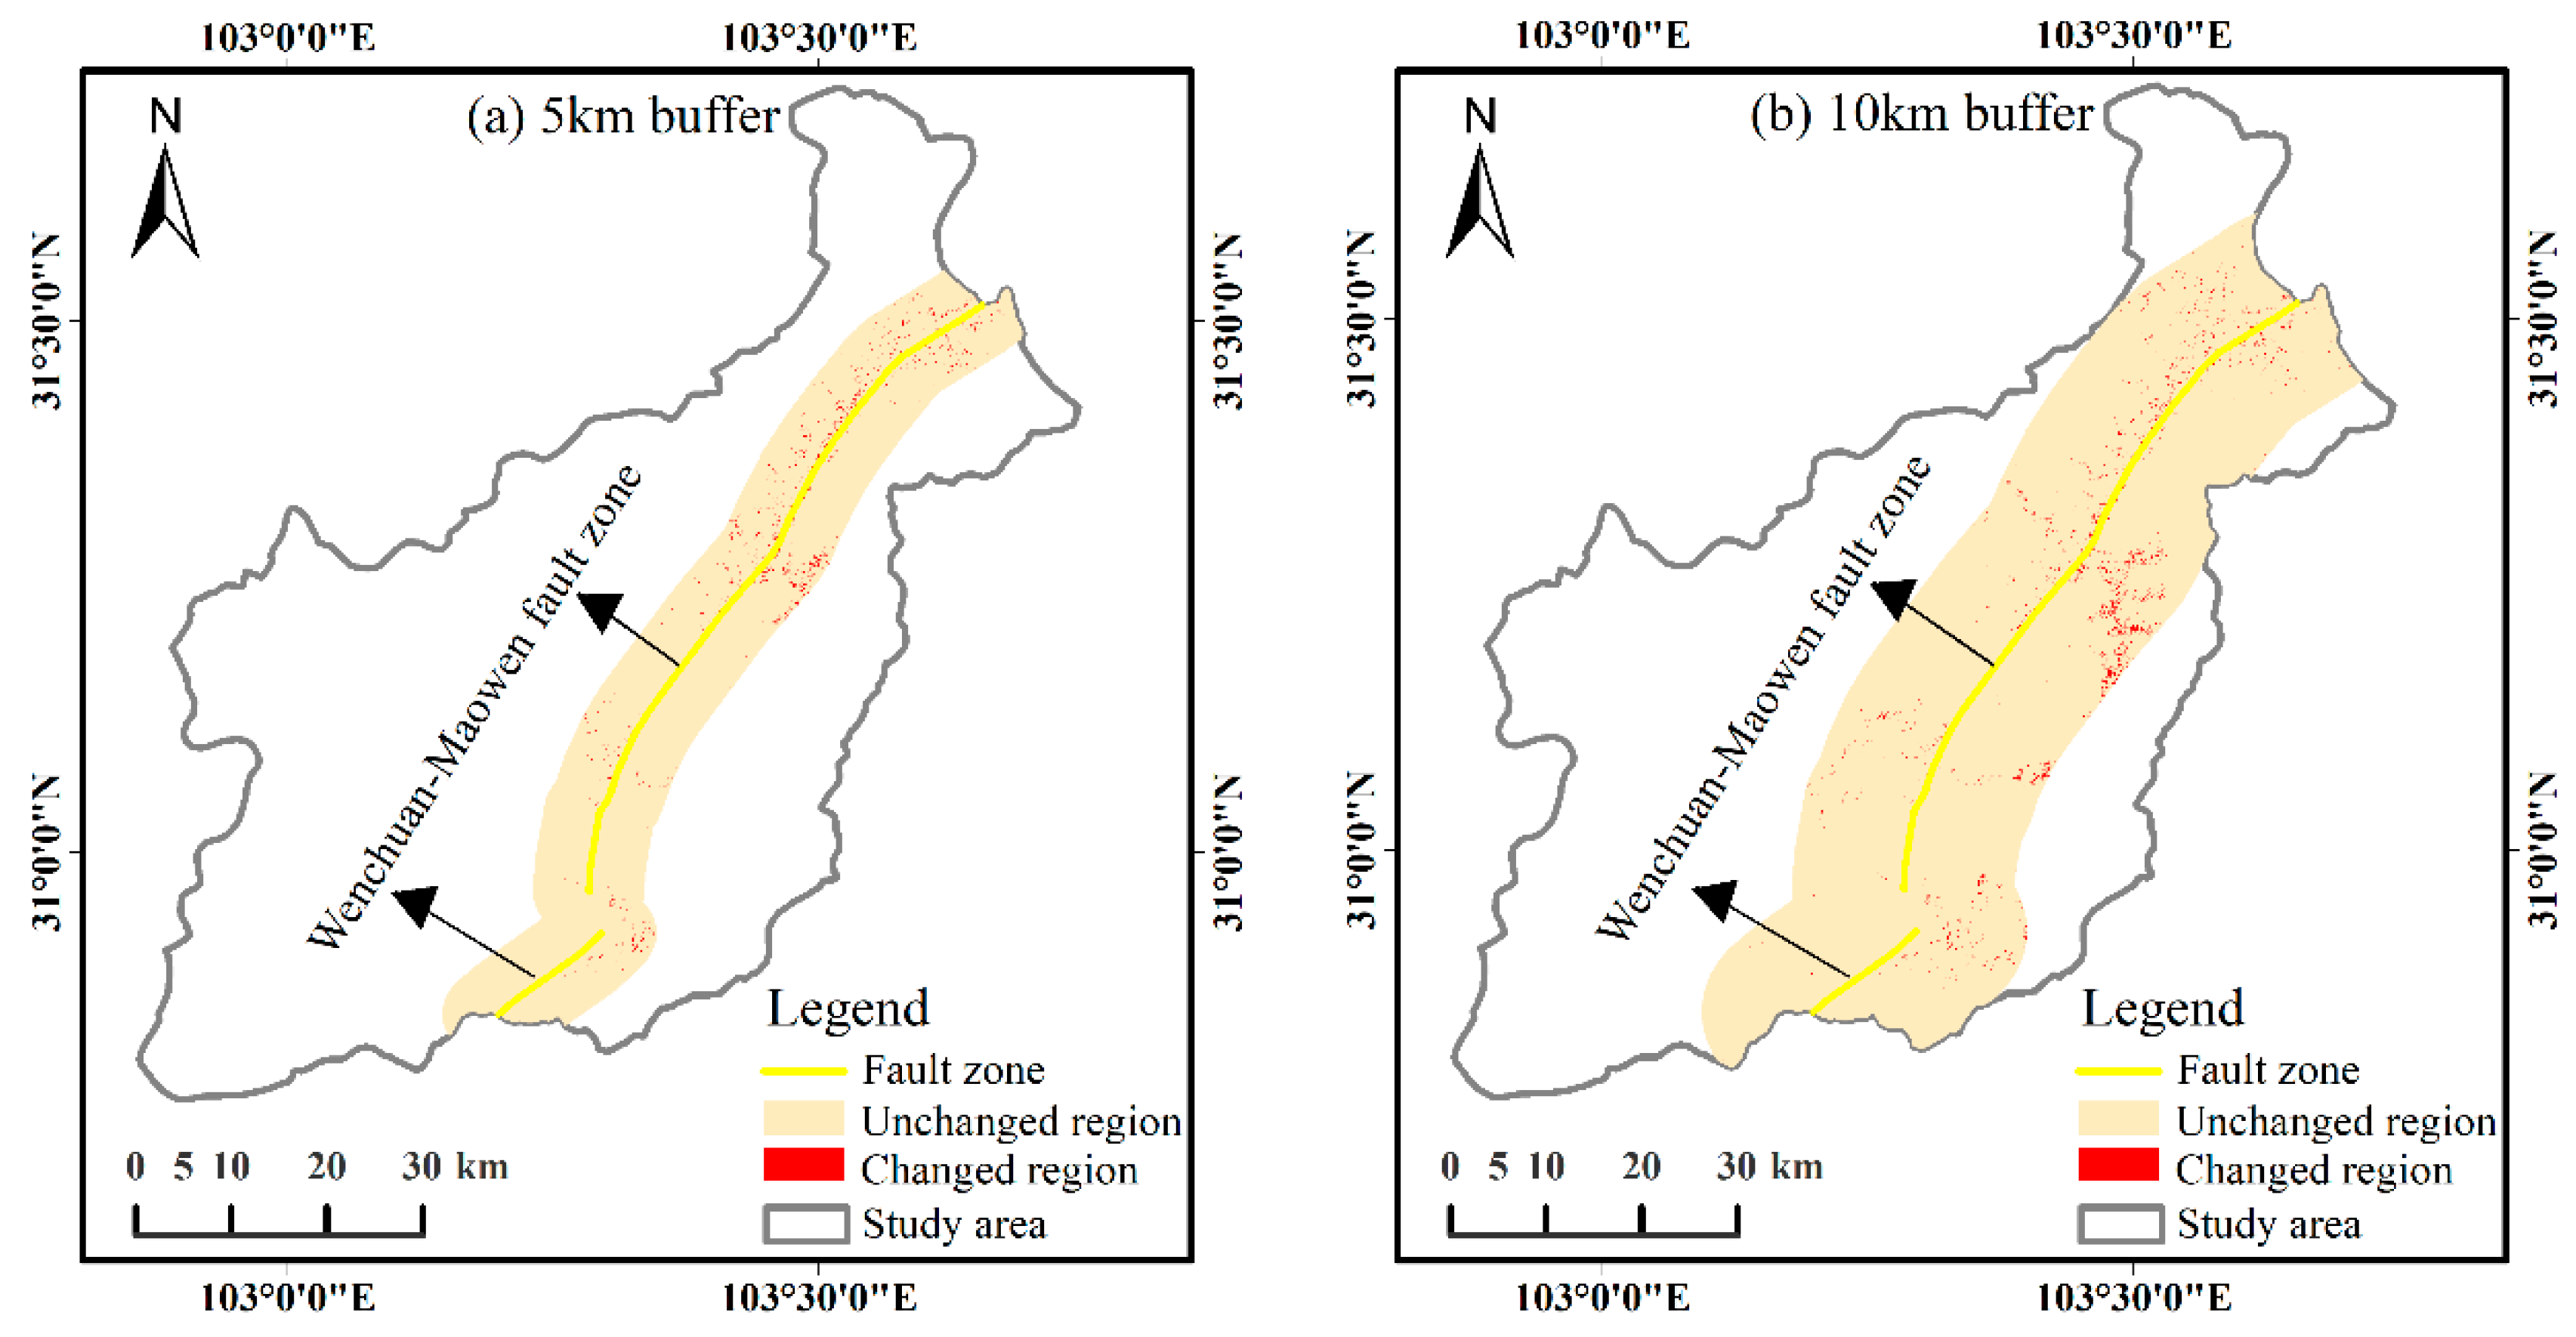
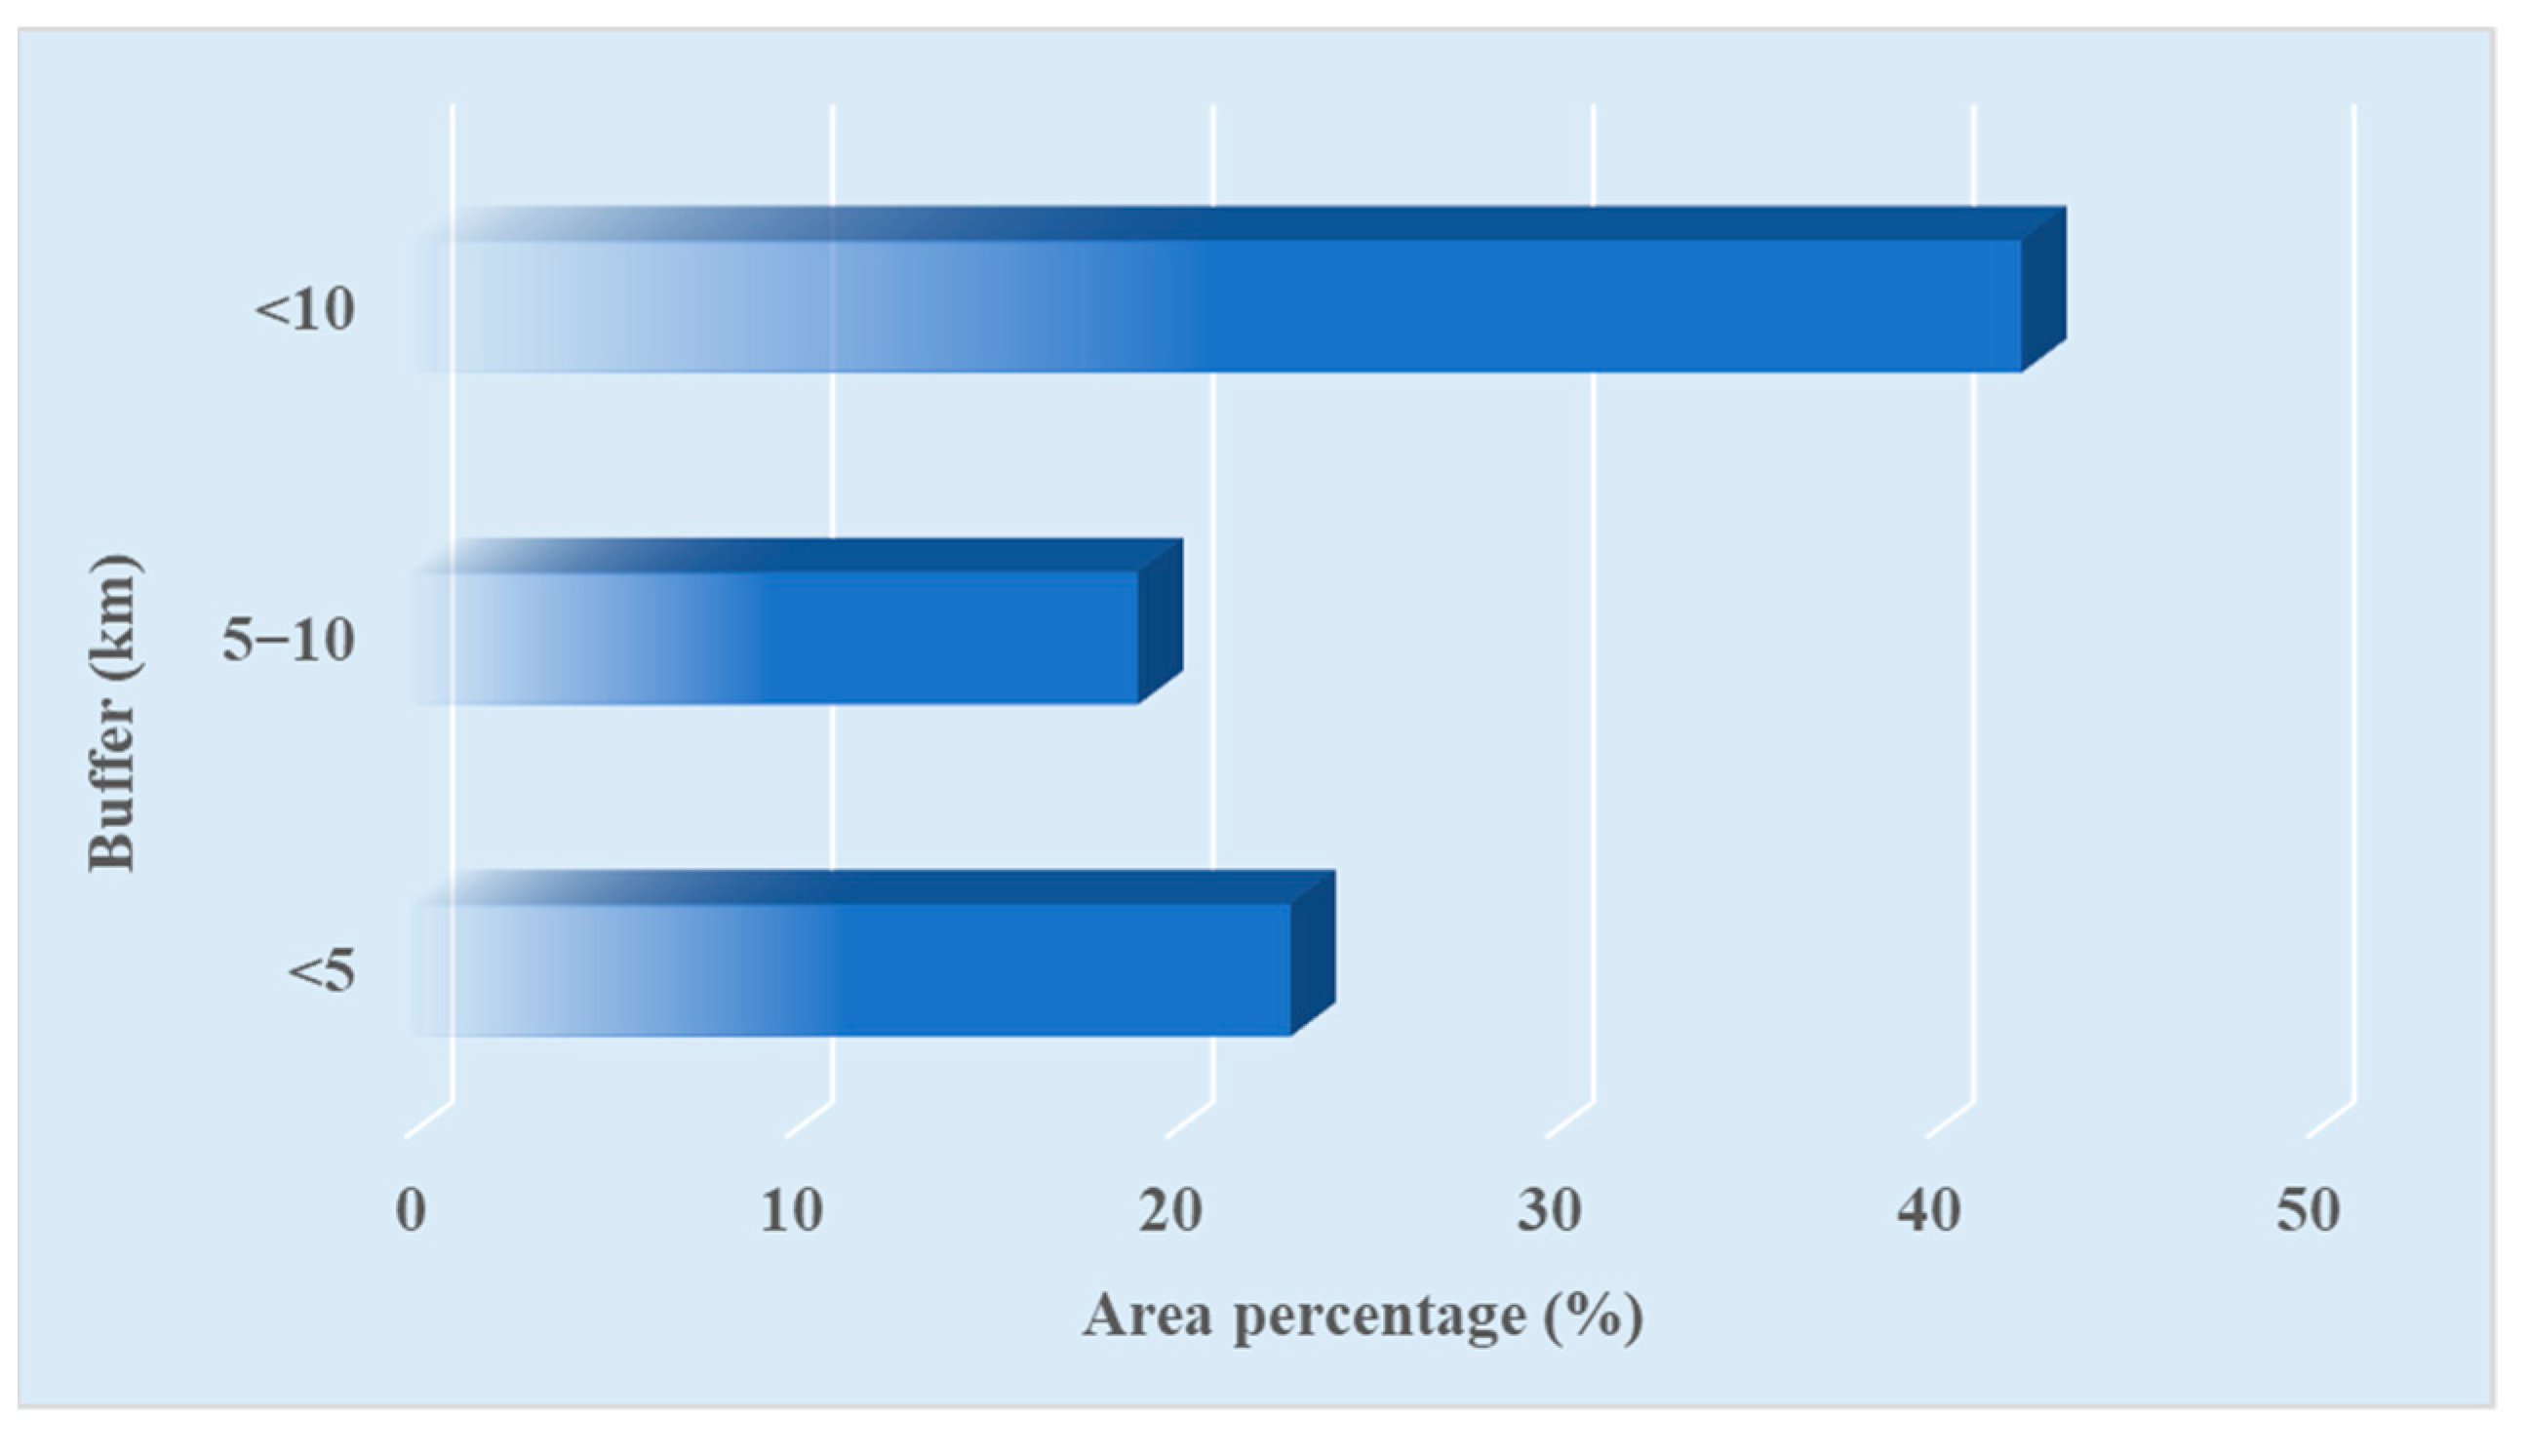
4.5.2. Distribution of Land-Use Change of Wenchuan-Maowen Fault Zone
5. Discussion
5.1. Geological Hazard Factors Influencing Land Use Change in Earthquake-Stricken Regions
5.2. Human Factors Influencing Land Use Change in Earthquake-Stricken Regions
6. Conclusions
Author Contributions
Funding
Data Availability Statement
Conflicts of Interest
References
- Marano, K.D.; Wald, D.J.; Allen, T.I. Global earthquake casualties due to secondary effects: A quantitative analysis for improving rapid loss analyses. Nat. Hazards 2010, 52, 319–328. [Google Scholar] [CrossRef]
- Wang, Z. A preliminary report on the Great Wenchuan Earthquake. Earthq. Eng. Eng. Vib. 2008, 7, 225–234. [Google Scholar] [CrossRef]
- Ye, S.; Zhai, G.; Hu, J. Damages and lessons from the Wenchuan earthquake in China. Hum. Ecol. Risk Assess. 2011, 17, 598–612. [Google Scholar] [CrossRef]
- Subedi, S.; Chhetri, M.B.P. Impacts of the 2015 Gorkha earthquake: Lessons learnt from Nepal. In Earthquakes-Impact, Community Vulnerability and Resilience; IntechOpen: London, UK, 2019. [Google Scholar]
- Hu, K.; Zhang, X.; You, Y.; Hu, X.; Liu, W.; Li, Y. Landslides and dammed lakes triggered by the 2017 Ms6. 9 Milin earthquake in the Tsangpo gorge. Landslides 2019, 16, 993–1001. [Google Scholar] [CrossRef]
- Li, C.; Wang, M.; Liu, K. A decadal evolution of landslides and debris flows after the Wenchuan earthquake. Geomorphology 2018, 323, 1–12. [Google Scholar] [CrossRef]
- Meng, X.; Xie, Y.; Bian, F. Distributed Geospatial Analysis through Web Processing Service: A Case Study of Earthquake Disaster Assessment. J. Softw. 2010, 5, 671–679. [Google Scholar] [CrossRef]
- Sun, T.; Davis, E.E.; Wang, K.; Jiang, Y. Trench-breaching afterslip following deeper coseismic slip of the 2012 Mw 7.6 Costa Rica earthquake constrained by near-trench pressure and land-based geodetic observations. Earth Planet. Sci. Lett. 2017, 479, 263–272. [Google Scholar] [CrossRef]
- Elliott, J. Earth Observation for the assessment of earthquake hazard, risk and disaster management. Surv. Geophys. 2020, 41, 1323–1354. [Google Scholar] [CrossRef]
- Xiang, M.; Deng, Q.; Duan, L.; Yang, J.; Wang, C.; Liu, J.; Liu, M. Dynamic monitoring and analysis of the earthquake Worst-hit area based on remote sensing. Alex. Eng. J. 2022, 61, 8691–8702. [Google Scholar] [CrossRef]
- Xiang, H.; Ma, Y.; Zhang, R.; Chen, H.; Yang, Q. Spatio-Temporal Evolution and Future Simulation of Agricultural Land Use in Xiangxi, Central China. Land 2022, 11, 587. [Google Scholar] [CrossRef]
- Luo, L.; Zhou, Q.; He, H.S.; Duan, L.; Zhang, G.; Xie, H. Relative Importance of Land Use and Climate Change on Hydrology in Agricultural Watershed of Southern China. Sustainability 2020, 12, 6423. [Google Scholar] [CrossRef]
- Gao, L.; Ma, C.; Wang, Q.; Zhou, A. Sustainable use zoning of land resources considering ecological and geological problems in Pearl River Delta Economic Zone, China. Sci. Rep. 2019, 9, 16052. [Google Scholar] [CrossRef] [PubMed] [Green Version]
- Li, M.; Cao, X.; Liu, D.; Fu, Q.; Li, T.; Shang, R. Sustainable management of agricultural water and land resources under changing climate and socio-economic conditions: A multi-dimensional optimization approach. Agric. Water Manag. 2022, 259, 107235. [Google Scholar] [CrossRef]
- Huang, Y.; Chen, Z.-X.; Tao, Y.; Huang, X.-Z.; Gu, X.-F. Agricultural remote sensing big data: Management and applications. J. Integr. Agric. 2018, 17, 1915–1931. [Google Scholar] [CrossRef]
- Sajjad, H.; Kumar, P. Future challenges and perspective of remote sensing technology. In Applications and Challenges of Geospatial Technology; Springer: Cham, Switzerland, 2019; pp. 275–277. [Google Scholar]
- Zhang, B.; Wu, Y.; Zhao, B.; Chanussot, J.; Hong, D.; Yao, J.; Gao, L. Progress and challenges in intelligent remote sensing satellite systems. IEEE J. Sel. Top. Appl. Earth Obs. Remote Sens. 2022, 15, 1814–1822. [Google Scholar] [CrossRef]
- Zhao, S.; Wang, Q.; Li, Y.; Liu, S.; Wang, Z.; Zhu, L.; Wang, Z. An overview of satellite remote sensing technology used in China’s environmental protection. Earth Sci. Inform. 2017, 10, 137–148. [Google Scholar] [CrossRef]
- Kang, J.; Yang, X.; Wang, Z.; Cheng, H.; Wang, J.; Tang, H.; Li, Y.; Bian, Z.; Bai, Z. Comparison of Three Ten Meter Land Cover Products in a Drought Region: A Case Study in Northwestern China. Land 2022, 11, 427. [Google Scholar] [CrossRef]
- Kang, J.; Yang, X.; Wang, Z.; Huang, C.; Wang, J. Collaborative Extraction of Paddy Planting Areas with Multi-Source Information Based on Google Earth Engine: A Case Study of Cambodia. Remote Sens. 2022, 14, 1823. [Google Scholar] [CrossRef]
- Wang, J.; Yang, X.; Wang, Z.; Cheng, H.; Kang, J.; Tang, H.; Li, Y.; Bian, Z.; Bai, Z. Consistency Analysis and Accuracy Assessment of Three Global Ten-Meter Land Cover Products in Rocky Desertification Region—A Case Study of Southwest China. ISPRS Int. J. Geo-Inf. 2022, 11, 202. [Google Scholar] [CrossRef]
- Wang, J.; Yang, X.; Wang, Z.; Ge, D.; Kang, J. Monitoring Marine Aquaculture and Implications for Marine Spatial Planning—An Example from Shandong Province, China. Remote Sens. 2022, 14, 732. [Google Scholar] [CrossRef]
- Hakim, W.L.; Lee, C.-W. A review on remote sensing and GIS applications to monitor natural disasters in Indonesia. Korean J. Remote Sens. 2020, 36, 1303–1322. [Google Scholar]
- Zhao, X.; Pan, S.; Sun, Z.; Guo, H.; Zhang, L.; Feng, K. Advances of satellite remote sensing technology in earthquake prediction. Nat. Hazards Rev. 2021, 22, 03120001. [Google Scholar] [CrossRef]
- Kader, A.; Jahan, I. A review of the application of remote sensing technologies in earthquake disaster management: Potentialities and challenges. In Proceedings of the International Conference on Disaster Risk Management, Dhaka, Bangladesh, 12–14 January 2019; pp. 12–14. [Google Scholar]
- Li, M.; Tian, S.; Huang, C.; Wu, W.; Xin, S. Risk Assessment of Highway in the Upper Reaches of Minjiang River under the Stress of Debris Flow. J. Geosci. Environ. Prot. 2021, 9, 21–34. [Google Scholar] [CrossRef]
- Li, Q.; Umaier, K.; Koide, O. Research on post-Wenchuan earthquake recovery and reconstruction implementation: A case study of housing reconstruction of Dujiangyan City. Prog. Disaster Sci. 2019, 4, 100041. [Google Scholar] [CrossRef]
- Cui, P.; Zhuang, J.; Chen, X.; Zhang, J.; Zhou, X. Characteristics and Countermeasures of Debris Flow in Wenchuan Area After the Earthquake. J. Sichuan Univ. 2010, 42, 10–19. [Google Scholar]
- Nath, B.; Niu, Z.; Singh, R.P. Land Use and Land Cover changes, and environment and risk evaluation of Dujiangyan city (SW China) using remote sensing and GIS techniques. Sustainability 2018, 10, 4631. [Google Scholar] [CrossRef] [Green Version]
- Yang, W.; Wang, M.; Kerle, N.; Van Westen, C.; Liu, L.; Shi, P. Analysis of changes in post-seismic landslide distribution and its effect on building reconstruction. Nat. Hazards Earth Syst. Sci. 2015, 15, 817–825. [Google Scholar] [CrossRef] [Green Version]
- Wang, M.; Yang, W.; Shi, P.; Xu, C.; Liu, L. Diagnosis of vegetation recovery in mountainous regions after the Wenchuan earthquake. IEEE J. Sel. Top. Appl. Earth Obs. Remote Sens. 2014, 7, 3029–3037. [Google Scholar] [CrossRef]
- Zhang, X.; Wang, M.; Liu, K.; Xie, J.; Xu, H. Using NDVI time series to diagnose vegetation recovery after major earthquake based on dynamic time warping and lower bound distance. Ecol. Indic. 2018, 94, 52–61. [Google Scholar] [CrossRef]
- Liu, X.; Jiang, W.; Li, J.; Wang, W. Evaluation of the vegetation coverage resilience in areas damaged by the Wenchuan earthquake based on MODIS-EVI data. Sensors 2017, 17, 259. [Google Scholar] [CrossRef] [Green Version]
- Tralli, D.M.; Blom, R.G.; Zlotnicki, V.; Donnellan, A.; Evans, D.L. Satellite remote sensing of earthquake, volcano, flood, landslide and coastal inundation hazards. ISPRS J. Photogramm. Remote Sens. 2005, 59, 185–198. [Google Scholar] [CrossRef]
- Balamurugan, G.; Aravind, M. Land use land cover changes in pre-and post-earthquake affected area using Geoinformatics–Western Coast of Gujarat, India. Disaster Adv. 2015, 8, 1–14. [Google Scholar]
- Thilagavathi, N.; Subramani, T.; Suresh, M. Land use/land cover change detection analysis in Salem chalk hills, South India using remote sensing and GIS. Disaster Adv. 2015, 8, 44–52. [Google Scholar]
- Ishihara, M.; Tadono, T. Land cover changes induced by the great east Japan earthquake in 2011. Sci. Rep. 2017, 7, 45769. [Google Scholar] [CrossRef]
- You, Y.; Huang, Y.; Zhuang, Y. Natural disaster and political trust: A natural experiment study of the impact of the Wenchuan earthquake. Chin. J. Sociol. 2020, 6, 140–165. [Google Scholar] [CrossRef]
- Parsons, T.; Ji, C.; Kirby, E. Stress changes from the 2008 Wenchuan earthquake and increased hazard in the Sichuan basin. Nature 2008, 454, 509–510. [Google Scholar] [CrossRef]
- Dai, F.; Xu, C.; Yao, X.; Xu, L.; Tu, X.; Gong, Q. Spatial distribution of landslides triggered by the 2008 Ms 8.0 Wenchuan earthquake, China. J. Asian Earth Sci. 2011, 40, 883–895. [Google Scholar] [CrossRef]
- Chen, Y.; Hu, J.; Peng, F. Seismological challenges in earthquake hazard reductions: Reflections on the 2008 Wenchuan earthquake. Sci. Bull. 2018, 63, 1159–1166. [Google Scholar] [CrossRef] [Green Version]
- Peng, Y.; Gu, X.; Zhu, X.; Zhang, F.; Song, Y. Recovery evaluation of villages reconstructed with concentrated rural settlement after the Wenchuan earthquake. Nat. Hazards 2020, 104, 139–166. [Google Scholar] [CrossRef]
- Lu, T.; Zeng, H.; Luo, Y.; Wang, Q.; Shi, F.; Sun, G.; Wu, Y.; Wu, N. Monitoring vegetation recovery after China’s May 2008 Wenchuan earthquake using Landsat TM time-series data: A case study in Mao County. Ecol. Res. 2012, 27, 955–966. [Google Scholar] [CrossRef]
- Wu, F.; Yu, B.; Yan, M.; Wang, Z. Eco-environmental research on the Wenchuan Earthquake area using Disaster Monitoring Constellation (DMC) Beijing-1 small satellite images. Int. J. Remote Sens. 2010, 31, 3643–3660. [Google Scholar] [CrossRef]
- Cui, P.; Lin, Y.-M.; Chen, C. Destruction of vegetation due to geo-hazards and its environmental impacts in the Wenchuan earthquake areas. Ecol. Eng. 2012, 44, 61–69. [Google Scholar] [CrossRef]
- Lu, T.; Shi, F.; Sun, G.; Luo, Y.; Wang, Q.; Wu, Y.; Wu, N. Reconstruction of the Wenchuan earthquake-damaged ecosystems: Four important questions. Chin. J. Appl. Env. Biol. 2010, 16, 301–304. [Google Scholar] [CrossRef]
- Yang, J.; Huang, X. The 30 m annual land cover dataset and its dynamics in China from 1990 to 2019. Earth Syst. Sci. Data 2021, 13, 3907–3925. [Google Scholar] [CrossRef]
- Canters, F. Evaluating the uncertainty of area estimates derived from fuuy land-cover classification. Photogramm. Eng. Remote Sens. 1997, 63, 403–414. [Google Scholar]
- Clark, M.L.; Aide, T.M.; Grau, H.R.; Riner, G. A scalable approach to mapping annual land cover at 250 m using MODIS time series data: A case study in the Dry Chaco ecoregion of South America. Remote Sens. Environ. 2010, 114, 2816–2832. [Google Scholar] [CrossRef]
- Kang, J.; Wang, Z.; Sui, L.; Yang, X.; Ma, Y.; Wang, J. Consistency analysis of remote sensing land cover products in the tropical rainforest climate region: A case study of Indonesia. Remote Sens. 2020, 12, 1410. [Google Scholar] [CrossRef]
- Zhu, S.; Wang, H. Remote Sensing Image Processing and Application; Science Press: Beijing, China, 2006. [Google Scholar]
- Shi, G.; Jiang, N.; Yao, L. Land use and cover change during the rapid economic growth period from 1990 to 2010: A case study of shanghai. Sustainability 2018, 10, 426. [Google Scholar] [CrossRef] [Green Version]
- Gao, P.; Niu, X.; Wang, B.; Zheng, Y. Land use changes and its driving forces in hilly ecological restoration area based on gis and rs of northern china. Sci. Rep. 2015, 5, 11038. [Google Scholar] [CrossRef] [Green Version]
- Shawul, A.A.; Chakma, S. Spatiotemporal detection of land use/land cover change in the large basin using integrated approaches of remote sensing and GIS in the Upper Awash basin, Ethiopia. Environ. Earth Sci. 2019, 78, 141. [Google Scholar] [CrossRef]
- Wang, J.; Sui, L.; Yang, X.; Wang, Z.; Ge, D.; Kang, J.; Yang, F.; Liu, Y.; Liu, B. Economic globalization impacts on the ecological environment of inland developing countries: A case study of laos from the perspective of the land use/cover change. Sustainability 2019, 11, 3940. [Google Scholar] [CrossRef] [Green Version]
- Kang, J.; Sui, L.; Yang, X.; Wang, Z.; Huang, C.; Wang, J. Spatial pattern consistency among different remote-sensing land cover datasets: A case study in Northern Laos. ISPRS Int. J. Geo-Inf. 2019, 8, 201. [Google Scholar] [CrossRef] [Green Version]
- Wang, H.; Sassa, K.; Xu, W. Analysis of a spatial distribution of landslides triggered by the 2004 Chuetsu earthquakes of Niigata Prefecture, Japan. Nat. Hazards 2007, 41, 43–60. [Google Scholar] [CrossRef]
- Chang, K.-T.; Chiang, S.-H.; Hsu, M.-L. Modeling typhoon-and earthquake-induced landslides in a mountainous watershed using logistic regression. Geomorphology 2007, 89, 335–347. [Google Scholar] [CrossRef]
- Huang, R.; Li, W. Analysis of the geo-hazards triggered by the 12 May 2008 Wenchuan Earthquake, China. Bull. Eng. Geol. Environ. 2009, 68, 363–371. [Google Scholar] [CrossRef]
- Khazai, B.; Sitar, N. Evaluation of factors controlling earthquake-induced landslides caused by Chi-Chi earthquake and comparison with the Northridge and Loma Prieta events. Eng. Geol. 2004, 71, 79–95. [Google Scholar] [CrossRef]
- Wang, F.-X.; Zhou, W.-C. The Study on Land Use Changes of Wenchuan Disaster Area based on RS and GIS. In Proceedings of the 2009 2nd International Congress on Image and Signal Processing, Tianjin, China, 17–19 October 2009; pp. 1–5. [Google Scholar]
- Wang, L.; Tian, B.; Masoud, A.; Koike, K. Relationship between remotely sensed vegetation change and fracture zones induced by the 2008 Wenchuan earthquake, China. J. Earth Sci. 2013, 24, 282–296. [Google Scholar] [CrossRef] [Green Version]
- Yang, X.; Yang, W.-N.; Li, Y.-H.; Hu, B.-R. Land Use Land Cover Change Analysis after the Earthquake of Wenchuan. In Proceedings of the 2010 International Conference on Multimedia Technology, Hong Kong, China, 24–25 April 2010; pp. 1–4. [Google Scholar]
- Chen, J.; Li, J.; Qin, X.; Dong, Q.; Sun, Y. RS and GIS-based Statistical Analysis of Secondary Geological Disasters after the 2008 Wenchuan Earthquake. Acta Geol. Sin.-Engl. Ed. 2009, 83, 776–785. [Google Scholar] [CrossRef]
- Yu, H.; Luo, Y.; Zheng, Z.; Sun, Y.; Ma, Y. Research on the distribution characteristics of secondary geological disasters induced by 5.12 earthquake in Wenchuan county based on RS and GIS. In Proceedings of the Third International Conference on Digital Image Processing (ICDIP 2011), Sichuan, China, 15–17 April 2011; pp. 269–273. [Google Scholar]
- Lubowski, R.N.; Bucholtz, S.; Claassen, R.; Roberts, M.J.; Cooper, J.C.; Gueorguieva, A.; Johansson, R.C. Environmental Effects of Agricultural Land-Use Change: The Role of Economics and Policy; United States Department of Agriculture (USDA): Washington, DC, USA, 2006.
- König, H.J.; Schuler, J.; Suarma, U.; McNeill, D.; Imbernon, J.; Damayanti, F.; Dalimunthe, S.A.; Uthes, S.; Sartohadi, J.; Helming, K.; et al. Assessing the impact of land use policy on urban-rural sustainability using the FoPIA approach in Yogyakarta, Indonesia. Sustainability 2010, 2, 1991–2009. [Google Scholar] [CrossRef] [Green Version]
- Hersperger, A.M.; Oliveira, E.; Pagliarin, S.; Palka, G.; Verburg, P.; Bolliger, J.; Grădinaru, S. Urban land-use change: The role of strategic spatial planning. Glob. Environ. Change 2018, 51, 32–42. [Google Scholar] [CrossRef]
- Chen, L.; Zhu, Y. Bridge Design Concept and Innovation of Chengdu-Dujiangyan Intercity Railway-Post Wenchuan Earthquake Reconstruction Project in Sichuan, China. In Proceedings of the 1st International Workshop on High-Speed and Intercity Railways, Shenzhen, China, 19–22 July 2011; pp. 205–216. [Google Scholar]
- Ou, J.; Li, H. The regional engineering damage and reconstruction strategy in Wenchuan earthquake of China. J. Earthq. Tsunami 2011, 5, 189–216. [Google Scholar] [CrossRef]
- Kim, J.H. Linking land use planning and regulation to economic development: A literature review. J. Plan. Lit. 2011, 26, 35–47. [Google Scholar]
- Zhang, J.; Cheng, L. Threshold effect of tourism development on economic growth following a disaster shock: Evidence from the Wenchuan earthquake, China. Sustainability 2019, 11, 371. [Google Scholar] [CrossRef] [Green Version]


| Year | 2007 | 2008 | 2014 | 2020 |
|---|---|---|---|---|
| OA (%) | 83.68 | 83.25 | 85.90 | 86.12 |
| Kappa | 0.75 | 0.76 | 0.78 | 0.80 |
| Land-Use Type | Bare Land, Snow/Ice | Forest, Grassland, Shrub, Water | Cropland | Built-Up |
|---|---|---|---|---|
| Grading index | 1 | 2 | 3 | 4 |
| 2007 Year | 2008 Year | |||||||
|---|---|---|---|---|---|---|---|---|
| Cropland | Forest | Shrub | Grassland | Water | Snow/Ice | Bare Land | Built-Up | |
| Cropland | 132.2019 | 1.4679 | 0.0306 | 1.9737 | 0.4653 | 0 | 0 | 0.5229 |
| Forest | 31.9095 | 2888.4726 | 1.5624 | 0 | 0 | 0 | 0 | 0.0045 |
| Shrub | 0.6444 | 0.1359 | 10.4697 | 0.8748 | 0 | 0 | 0 | 0 |
| Grassland | 1.1475 | 0.8847 | 0.3528 | 814.122 | 0.2223 | 0 | 2.9772 | 0.0306 |
| Water | 0 | 0.0783 | 0 | 1.6227 | 45.324 | 0 | 0.8343 | 0.0657 |
| Snow/Ice | 0 | 0 | 0 | 0.018 | 0.2124 | 23.9256 | 1.0683 | 0 |
| Bare land | 0 | 0.0009 | 0 | 2.4597 | 0.0162 | 0.2214 | 107.172 | 0.0018 |
| Built-up | 0 | 0 | 0 | 0 | 0.1854 | 0 | 0 | 5.6385 |
| 2008 Year | 2014 Year | |||||||
|---|---|---|---|---|---|---|---|---|
| Cropland | Forest | Shrub | Grassland | Water | Snow/Ice | Bare Land | Built-Up | |
| Cropland | 117.4392 | 32.1714 | 4.3857 | 9.3627 | 0.5049 | 0 | 0 | 2.0394 |
| Forest | 22.3587 | 2848.527 | 18.8721 | 1.2114 | 0.0027 | 0 | 0 | 0.0684 |
| Shrub | 1.3383 | 0.8451 | 6.2514 | 3.9807 | 0 | 0 | 0 | 0 |
| Grassland | 6.21 | 2.5173 | 0.9225 | 786.6891 | 1.3491 | 0.1071 | 23.1138 | 0.162 |
| Water | 0.0459 | 0.2808 | 0.0621 | 7.2072 | 34.56 | 0.045 | 3.9258 | 0.2988 |
| Snow/Ice | 0 | 0 | 0 | 0.2898 | 0.5724 | 19.4283 | 3.8556 | 0.0009 |
| Bare land | 0.009 | 0.0054 | 0.0018 | 10.7424 | 0.7245 | 7.8831 | 92.628 | 0.0576 |
| Built-up | 0 | 0 | 0 | 0 | 0.2025 | 0 | 0 | 6.0615 |
| 2014 Year | 2020 Year | |||||||
|---|---|---|---|---|---|---|---|---|
| Cropland | Forest | Shrub | Grassland | Water | Snow/Ice | Bare Land | Built-Up | |
| Cropland | 106.9065 | 30.915 | 2.6271 | 6.6843 | 0.063 | 0 | 0 | 0.2052 |
| Forest | 11.1924 | 2862.4914 | 9.9657 | 0.6885 | 0 | 0 | 0 | 0.009 |
| Shrub | 1.2294 | 5.2173 | 19.0656 | 4.9761 | 0.0009 | 0 | 0.0063 | 0 |
| Grassland | 7.9902 | 2.3553 | 0.5031 | 782.613 | 4.8186 | 0.153 | 20.9754 | 0.0747 |
| Water | 0.0675 | 0.0351 | 0.0108 | 4.7718 | 28.9503 | 0.0126 | 3.8709 | 0.1971 |
| Snow/Ice | 0 | 0 | 0 | 0.4401 | 0.5598 | 19.5336 | 6.93 | 0 |
| Bare Land | 0.0243 | 0.0135 | 0.0027 | 21.7674 | 1.2042 | 7.5366 | 92.9475 | 0.027 |
| Built-up | 0 | 0 | 0 | 0 | 0.0684 | 0 | 0 | 8.6202 |
Publisher’s Note: MDPI stays neutral with regard to jurisdictional claims in published maps and institutional affiliations. |
© 2022 by the authors. Licensee MDPI, Basel, Switzerland. This article is an open access article distributed under the terms and conditions of the Creative Commons Attribution (CC BY) license (https://creativecommons.org/licenses/by/4.0/).
Share and Cite
Kang, J.; Wang, Z.; Cheng, H.; Wang, J.; Liu, X. Remote Sensing Land Use Evolution in Earthquake-Stricken Regions of Wenchuan County, China. Sustainability 2022, 14, 9721. https://doi.org/10.3390/su14159721
Kang J, Wang Z, Cheng H, Wang J, Liu X. Remote Sensing Land Use Evolution in Earthquake-Stricken Regions of Wenchuan County, China. Sustainability. 2022; 14(15):9721. https://doi.org/10.3390/su14159721
Chicago/Turabian StyleKang, Junmei, Zhihua Wang, Hongbin Cheng, Jun Wang, and Xiaoliang Liu. 2022. "Remote Sensing Land Use Evolution in Earthquake-Stricken Regions of Wenchuan County, China" Sustainability 14, no. 15: 9721. https://doi.org/10.3390/su14159721
APA StyleKang, J., Wang, Z., Cheng, H., Wang, J., & Liu, X. (2022). Remote Sensing Land Use Evolution in Earthquake-Stricken Regions of Wenchuan County, China. Sustainability, 14(15), 9721. https://doi.org/10.3390/su14159721