Abstract
There are more and more tunnel projects in the karst-developed areas in Southwest China. Affected by karst caves and water, karst tunnels often experience geological disasters such as local collapses and water inrush. A simplified rock stress hardening-softening model was established based on the triaxial compression test results of two kinds of carbonatite to accurately analyze the deformation and water inrush characteristics of the surrounding rocks after karst tunnel excavation. The total stress–strain curve of rocks was simplified into four linear stages: the linear elastic stage, strain hardening stage, strain-softening stage, and residual stage. The volumetric strain–axial strain curve was simplified into four corresponding linear stages: the elastic expansion stage, slow expansion stage, rapid expansion stage, and stable expansion stage. The stress hardening–softening model was used to deduce the relationship between the rocks’ mechanical parameters such as cohesion, internal friction angle, dilatancy angle, and plastic strain, as well as the relationship between seepage characteristic parameters such as permeability coefficient, porosity, and volumetric strain. A karst tunnel in Chongqing, China was taken as the engineering background. The stress hardening–softening constitutive model and seepage characteristic parameters were applied to the FLAC3D numerical simulation by the programming language FISH to analyze the stability and water inrush characteristics of karst tunnels in overlying confining caves. The results showed that rock masses between the cave and tunnel were prone to overall sliding instability. Confined water in the karst cave intruded into the tunnel through the shear-slip rupture zone on both sides instead of the shortest path. Two water inrush points existed on the tunnel surface. The variation law of the permeability coefficients of the surrounding rocks could more truly reflect whether there was a seepage channel between the tunnel and karst cave, as well as the permeable area and water inrush speed of the seepage channel. The work provides a new idea for the stability control of karst tunnels.
1. Introduction
Karst is a general term for the geological process in which water acts on soluble rocks (carbonate rocks, gypsum, rock salt, etc.) mainly by chemical dissolution, supplemented by mechanical actions such as water erosion, undercutting, and collapse, and phenomena produced by these actions [1,2]. Karst areas in China are widely distributed, especially in southwest Yunnan, Guizhou, Guangxi, and Chongqing areas [3,4]. With the deepening of China’s transportation power and the development strategy of the western region, the number of tunnel projects in the karst-developed areas in the southwest has increased rapidly [5,6]. Karst tunnels often suffer from local collapse, water inrush, and other geological disasters due to karst caves and the influence of karst water, which seriously restricts the construction progress of tunnel engineering and easily causes casualties and economic losses [7,8].
At present, a lot of achievements have been made in studying the influences of karst caves on the stability of tunnels in karst areas. The number of repeated experiments is limited due to the high cost of similar model experiments. Moreover, the research objects are only for a specific condition. It is difficult to accurately simulate the performance of the surrounding rocks, and the general applicability of the research conclusions is relatively poor [9,10]. Therefore, most scholars at home and abroad use theoretical analysis and numerical simulations to study the stability of karst tunnels.
He et al. [11] deduced the theoretical formula of internal force and displacement at the foot of the tunnel arch based on Winkel’s elastic foundation beam theory and analyzed the stress state of the beam under different cave sizes and different ratios of the compressibility modulus of the medium. The closer the cave filling is to the compressibility modulus of the surrounding rocks, the weaker the influence of the cave on the lining stress. The larger the scale of the karst cave, the greater the influence of the change in the filling compressive modulus on the lining stress. Fraldi et al. [12,13,14] studied the collapse of tunnels with rectangular and arbitrary cross-sectional shapes in deeply buried rocks based on the nonlinear Hoek–Brown strength criterion and the upper limit method of limit analysis. The theoretical formula for solving the collapse range of the tunnel was given through theoretical derivation, and the effectiveness of the theoretical calculation method was verified by numerical analysis. Based on the research results of Fraldi, Yang et al. [15,16] studied the influence of the collapse failure of the underlying karst cave on the tunnel floor in karst areas and analyzed the influence law of different parameters on the collapse failure of the karst cave and the critical thickness between the underlying karst cave and the collapsed tunnel. Sun et al. [17,18] studied the effect of karst caves on the stability of tunnels by the strength-reducing method. The cohesion and friction angle have different reduction factors, and the analysis results are more reasonable and accurate. However, most of the existing theoretical analyses assume that rocks are ideal elastic–plastic bodies, which ignores the mechanical properties of rocks’ strain hardening before reaching peak strength and strain softening after peak strength.
There are four main types of calculation methods for numerical simulations: the finite element method (ANSYS, MIDAS, and RFPA), finite difference method (FLAC), discrete element method (PFC and UDEC), and coupling method (NMM and FDEM). Liu et al. [19,20,21] studied the influence of karst cave size, location, water pressure, and other factors on tunnel safety using the finite-difference calculation program of fluid–structure coupling. Karst water inrush is a progressive failure process affected by water pressure, karst filling, and the range of the plastic zone of the tunnel surrounding rocks. Yang et al. [22,23,24] used the rock fracture process analysis program (RFPA) to numerically simulate the water inrush process of a karst tunnel, revealing the catastrophic mechanism of water inrush from rock fracture of a karst tunnel. Sun et al. [25,26] used the PFC to simulate the process of water and mud inrush in a karst tunnel. The influences of water pressure and fracture properties on water inrush in the tunnel were analyzed to propose two important concepts: critical water pressure and critical water inrush distance. Cao et al. [27,28] used the UDEC to simulate the water inrush process of karst tunnels induced by groundwater seepage, excavation, and unloading. In addition, they discussed the mechanism of karst-tunnel water inrush and the critical water inrush pressure or roof safety distance of the karst tunnel under different conditions. Recently, the emerging continuous–discontinuous medium coupling method has also been used to study rock mass failure under groundwater seepage [29,30,31,32]. The mechanical properties of strain hardening before the peak strength and strain softening after the peak strength of rocks are mostly Ignored in the above numerical simulation. The strain-hardening/softening model (SS model) is used in FLAC to simulate the strain hardening and softening behaviors of rocks. However, the influences of confining pressures on mechanical parameters (e.g., the post-peak strength degradation rate, residual strength, and dilatancy rate of rocks) are ignored, and no corresponding value method is provided.
In addition, experiments show that the permeability of rocks is not constant but changes with the changes in rock stress and strain state [33]. Wang et al. studied the relationship between rock permeability and the complete strain–stress process through a triaxial compression experiment. Before the peak strength, the permeability decreases with increased loads; a dramatic increase in permeability occurs during the strain-softening period [34]. However, this conclusion is not comprehensive. Peng et al. believed that the change in rock permeability in the complete strain–stress process is related to many factors, such as confining pressure, lithology, and primary fractures. The overall law is as follows. The permeability decreases slightly with increased stress at the elastic stage; the permeability increases from slowly to sharply at the strain hardening stage; the permeability may continue to increase or decrease at the strain-softening stage [35,36]. Li et al. and Yang et al. obtained the relationship curve between rock permeability and strain and fitted it with polynomial segments. However, the fitting equation is not a generally applicable general formula, which is difficult to apply to engineering practice [37,38]. When the stability of the karst tunnel is analyzed, the permeability characteristics of the surrounding rocks changing with strain cannot be ignored.
Therefore, it is necessary to comprehensively consider the mechanical behaviors of rocks’ pre-peak strain hardening and post-peak strain softening and the evolution law of permeability characteristics to analyze the stability of karst tunnels. A simplified rock stress hardening–softening model was established based on the triaxial compression test of two kinds of carbonatite in the work, and the rocks’ total stress–strain curve and volumetric strain–axial strain curve were simplified into four corresponding linear stages. The stress hardening–softening model was used to deduce the relationship between rocks’ mechanical parameters such as cohesion, internal friction angle, dilatancy angle, and plastic strain, as well as the relationship between seepage characteristic parameters (e.g., the permeability coefficient and porosity) and volumetric strain. The stress hardening–softening constitutive model and seepage characteristic parameters were applied to the FLAC simulation by the programming language FISH to analyze the stability and water inrush characteristics of karst tunnels under overlying confining caves, which provides a new idea for the stability control of karst tunnels.
2. Establishment and Verification of Strain Hardening–Softening Model of Carbonatite
The radial stress of the surrounding rocks is released to different degrees after the tunnel is excavated, which increases the deviatoric stress and causes deformation and failure. Assuming that the surrounding rock is a homogeneous isotropic body, its mechanical properties and seepage characteristics in the process of stress release can be analyzed by the mechanical constitutive model of rocks under triaxial compression. Fractures and pores in the rocks are opened, closed, developed, and converged under triaxial compression, which makes the deformation of rocks nonlinear. For the convenience of research, it is usually simplified appropriately. According to the results of the rock triaxial test and existing research, Sun et al. simplified the mechanical properties of rock under different confining pressures into the curve (see Figure 1) [39,40].
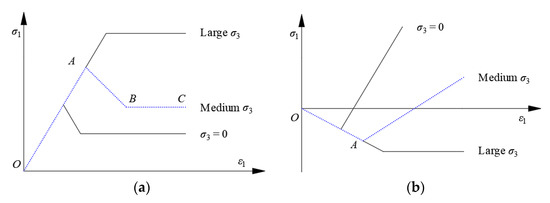
Figure 1.
Simplified stress–strain and volumetric strain–axial strain curves under tri-axial compression [39,40]. (a) Total stress–strain curve. (b) Volumetric strain–axial strain curve.
Figure 1a shows simplified rock stress–strain curves, including three stages: (1) Linear elastic stage (O–A). Stress increases linearly with strain. (2) Intensity degradation stage (A–B). After the rock strength reaches its peak strength, the micro-cracks and fissures in the rocks converge to form nuclei, and the rocks are destroyed. As the strain continues to increase, the bearing capacity of the rocks gradually decreases to the residual strength. (3) Residual plastic-flow stage. The residual strength of the rocks is unchanged, and the rocks are in an approximate plastic flow state.
Figure 1b shows a simplified volumetric strain–axial strain curve, including two stages. (1) At the linear elastic stage, the volumetric strain increases linearly with axial strain. (2) After the stress reaches its peak strength, the rocks are damaged and volume expansion occurs.
However, the above simplification of the rocks’ mechanical properties ignores the strain hardening stage between the yield point and peak strength. When the stress is near the yield point, the rocks have dilated [39,41,42]. The most widely distributed surrounding rocks in karst tunnels are carbonatite, and dolomite and limestone are two typical ones. Yuan et al. conducted the triaxial compression test of Gebdykes dolomite [41]; Wang et al. conducted the triaxial compression test of Daqing limestone [43] (see the solid line in Figure 2 for the results). Therefore, a simplified rock stress hardening–softening model is established based on the results of triaxial compression tests of two kinds of carbonate rocks conducted by Yuan et al. and Wang et al., respectively. The strain hardening stage and shear dilatant near the yield point are considered.
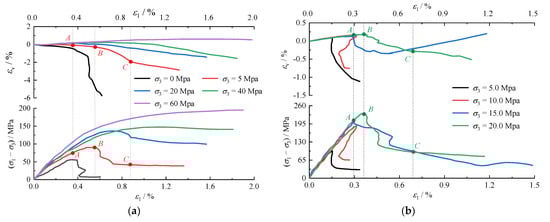
Figure 2.
Variation curves of deviatoric stress and volumetric strain of dolomite and limestone with axial strain under triaxial compression. (a) Gebdykes dolomite. (b) Daqing limestone.
2.1. Analysis of the Results of the Triaxial Compression Test of Carbonatite
The deviatoric stress of carbonatite shows an approximately linear elastic deformation at first with increased axial strain (Figure 2). After reaching yield point A, the deviatoric stress continues to increase, but the increase rate gradually decreases. Up to peak point B, the increasing rate of deviatoric stress approaches 0, showing the characteristics of strain hardening at this stage. Subsequently, deviatoric stress gradually decreases and remains unchanged after reaching residual point C, showing strain-softening characteristics at this stage.
The volumetric strain coincides with the changing nodes of deviatoric stress. As the axial strain increases, the volumetric strain first increases linearly. It reaches the maximum at yield point A and then decreases slowly, with a relatively small decrease rate. The decrease rate increases significantly at peak point B until reaching residual point C. Subsequently, the decrease rate decreases. After reaching yield point A, the dilatancy phenomenon occurs.
2.2. Establishment of the Strain Hardening–Softening Model
According to the above-mentioned deformation characteristics of carbonatite, the total stress–strain and volumetric strain–axial strain curves of rocks (Figure 3) can be simplified to the strain hardening–softening model.

Figure 3.
Simplified triaxial stress–strain and volumetric–axial strain curves of rocks. (a) Total stress–strain curve. (b) Volumetric strain–axial strain curve.
The total stress–strain curve of rock includes four linear stages (Figure 3a).
- (1)
- Linear elastic stage (O–A): The cohesive and internal friction angle of rocks are ce and φe, respectively.
- (2)
- Strain hardening stage (A–B): The cohesive and internal friction angle of rocks change from ce and φe to cp and φp, respectively.
- (3)
- Strain softening stage (B–C): The cohesive and internal friction angle of rocks change from cp and φp to cr and φr, respectively.
- (4)
- Residual strength stage (C–D): The cohesion and internal friction angle of rocks are still cr and φr, respectively.
Assuming that rock failure at each stage obeys the Mohr–Coulomb criterion, there are [44]
where σ3 is the confining pressure; , , and are the axial stress at yield point A, peak point B, and residual point C under the current confining pressure, respectively.
At stages A–B and B–C, tangential moduli Mep and Mpr of rocks decay exponentially with the change in confining pressure σ3 [45], expressed as
where Ee is the elastic modulus of rocks at stage O–A, which has nothing to do with the confining pressure if the initial internal damage is ignored; α1, β1, γ1, β2, and γ2 are the fitting constants of the triaxial compression test.
Combined with Equations (1) and (2) and the stress–strain relationship in Figure 3a, the axial strain of rocks at yield point A, the axial strain and axial plastic strain at peak point B, and the axial strain and axial plastic strain at residual point C are calculated as follows.
Corresponding to the four linear stages of the total stress–strain curve of rocks, the rocks’ volumetric strain–axial strain curve also includes four linear stages (Figure 3b).
- (1)
- Elastic expansion stage (O–A): Rocks are elastically compacted, and volumetric strain increases linearly with axial strain.
- (2)
- Slow expansion stage (A–B): The new micro-fractures appear in rocks and plastic deformation occurs. Volumetric strain decreases slowly, and the dilatancy angles of rocks are small, which can be approximated to keep ψep unchanged.
- (3)
- Rapid expansion stage (B–C): Micro-fractures in rocks gradually penetrate and macro-fractures appear. Volumetric strain decreases rapidly; the dilatancy angles of rocks can be approximated to keep ψpr unchanged, and ψpr > ψep.
- (4)
- Stable expansion stage (C–D): After rocks enter the residual strength stage, volumetric strain decreases steadily, and rocks’ dilatancy angle ψar tends to be constant.
The confining pressures and dilatancy angles of rocks at each stage conform to the following fitting relationship [46]:
where ψep, ψpr, and ψar are the dilatancy angles of rocks at different confining pressures at stages A–B, B–C, and C–D, respectively; θ0, θ1, θ2, θ3, ω1, ω2, and ω3 are the test fitting constants.
The volumetric strain of rocks at the elastic stage is [46,47]
The volumetric strain of rocks at the plastic stage is [47,48]
Combined with Equations (5) and (6) and the volumetric strain–axial strain relationship in Figure 3b, the volumetric strains , , and and at yield point A, peak point B, and residual point C of rocks can be obtained as
where εv is the volumetric strain; μ is the Poisson’s ratio; ε1 is the axial strain; is the plastic axial strain; is the plastic radial strain; ψ is the dilatancy angle.
2.3. Verification of the Strain Hardening–Softening Model
The mechanical properties of rocks (Figure 3) are described by the strain hardening–softening model to obtain the total stress–strain curves and volumetric strain–axial strain curves of Gebdykes dolomite and Daqing limestone under different confining pressures (Figure 4 and Figure 5). Dotted lines in the figure represent the model curves, and solid lines represent experimental curves.
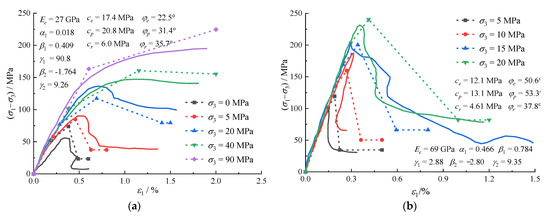
Figure 4.
Comparison between the total stress–strain experimental curves and the strain hardening–softening model curves under rocks’ triaxial compression. (a) Gebdykes dolomite. (b) Daqing limestone.
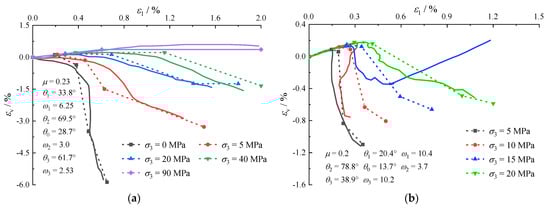
Figure 5.
Comparison between the volumetric strain–axial strain experimental curves and strain hardening–softening model curves under rocks’ triaxial compression. (a) Gebdykes dolomite. (b) Daqing limestone.
The stress and volumetric strain of the strain hardening–softening model at different stages are in good agreement with the experimental curves, which can reflect the variation and trends of stress and volumetric strain with the axial strain of rocks under different confining pressures.
3. Mechanical Properties and Permeability of Tunnel Surrounding Rocks Based on the Strain Hardening–Softening Model
Assuming that the surrounding rocks of a karst tunnel are isotropically homogeneous, the changes in its mechanical and seepage characteristics in the stress release process can be analyzed by the stress hardening–softening model.
3.1. Analysis of Mechanical Properties of Surrounding Rocks of the Karst Tunnel
The commonly used parameters of rocks’ mechanical properties include the elastic modulus, Poisson’s ratio, tensile strength, and dilatancy angle in addition to cohesion and internal friction angles. Based on the strain hardening–softening model, the above parameters are described as follows.
- (1)
- Cohesion and internal friction angle
Rocks’ cohesion c and internal friction angle φ vary with axial plastic strain, which can be understood as the maximum plastic principal strain in the surrounding rocks of a karst tunnel (Equations (8) and (9)).
- (2)
- Elastic modulus
Without considering the effect of fracture closure and opening in rocks, the plastic deformation of rocks at different stages cannot be recovered, but the elastic deformation can be completely recovered, and elastic modulus E can be calculated as follows [48].
- (3)
- Poisson’s ratio
The calculation equation of the Poisson’s ratio of rocks under linear shear failure is [49]
Combined with Equation (9), the relationship between Poisson’s ratio μ and plastic strain can be obtained.
- (4)
- Tensile strength
The equation for the pressure splitting tensile strength of rocks is [50]
Equations (8) and (9) are combined to obtain the relationship between tensile strength σt and plastic strain .
- (5)
- Dilatancy angle
According to the description of volumetric strain by the strain hardening–softening model in the previous section, the dilatancy angles of rocks can be calculated by Equation (4).
3.2. Analysis of Caracteristic Parameters of Surrounding-Rock Seepage in Karst Tunnels
Based on the strain hardening–softening model, the volumetric strain of carbonatite can be expressed as
Assuming that the surrounding rocks of the karst tunnel are isotropic permeability models, the parameters determining the seepage characteristics of the surrounding rocks are porosity and permeability coefficients. As the grains in rocks are usually hard, the volumes of grains remain unchanged in the stress adjustment process. Therefore, volumetric strain comes from the opening and closing of the pores in rocks. Then, the relationship between rocks’ porosity n and volumetric strain εv is expressed as
where n is the porosity when rocks produce volumetric strain εv; n0 is the initial porosity of rocks.
The porosity of rocks under different strain can be obtained by substituting Equations (13) and (14). A power function relationship exists among rocks’ permeability K, permeability coefficient k, and porosity n [51], defined as
where K0 and k0 are the initial permeability and permeability coefficient of rocks, respectively; b is the performance parameter of rock materials, which is obtained from the test.
Equations (13)–(15) show that after tunnel excavation, the permeability characteristics of the surrounding rocks change with volumetric strain. When the surrounding rocks are rich in groundwater, the change in permeability characteristics makes the surrounding rocks show completely different deformation and failure characteristics, which, in turn, affects the seepage characteristics of the surrounding rocks. Therefore, when a tunnel passes through an aquifer, the interaction between the mechanical properties of the surrounding rocks and the seepage characteristics should be considered.
4. Application of the Strain Hardening–Softening Model
4.1. Engineering Background
A tunnel in Chongqing, China has 6 lanes in both directions, with a total length of 4373 m. The karst strata passed through mainly include Triassic Leikoupo Formation and Jialingjiang Formation on the two flanks of the Guanyinxia anticline. The karst development of Leikoupo Formation is concentrated in the contact position between dolomitic limestone and Jialingjiang Formation limestone at the bottom. The surrounding rocks of the tunnel are mainly grades III and IV, and the permeability coefficient is 2.3 m/d. Karst structures are developed and distributed unevenly, and the diameter of karst caves is mainly 2–5 m. The height of the water column at the top of the tunnel in some sections is 150–200 m, and the hydrostatic pressure is 1.50–2.00 MPa. The selected study section has a tunnel burial depth of about 200 m, and the original rock stress is about 5 MPa. Figure 6 shows the design section of the tunnel. There is a pressure-bearing karst cave with a diameter of 3.6 m at 6.2 m above the tunnel vault of this section, and the water pressure is about 1.5 MPa.
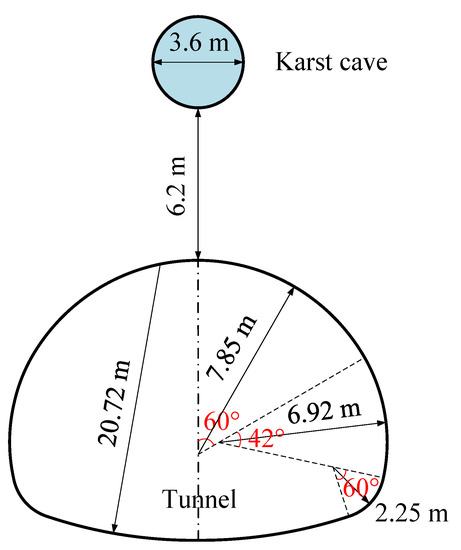
Figure 6.
Cross-section of the tunnel design.
The surrounding rocks of the tunnel were selected to make standard rock samples, and the triaxial compression test was carried out at a confining pressure of 5 MPa using the RMT rock mechanics test system. In terms of the stress hardening–softening model, the basic mechanical parameters of the surrounding rocks in different states are obtained (Table 1).

Table 1.
Basic mechanical parameters of surrounding rocks in different states.
The initial porosity n0 of the surrounding rocks is 0.1; the initial permeability coefficient k is 0.0027 cm/s; the seepage-characteristic fitting parameter b is 7.65. Table 2 shows the permeability parameters under different statuses.
Table 2.
Seepage parameters of surrounding rocks under different statuses.
4.2. Numerical-Simulation Scheme Design
The numerical model of the karst tunnel was established by FLAC3D (Figure 7). The width and height of the model were 75 and 65 m, respectively, with a total of 119,748 elements and 239,370 nodes. The boundary conditions of the model were set to apply the stress of 3.5 MPa on the top surface, normal constraints on the bottom surface and surrounding areas, and a water pressure of 1.5 MPa in the vaulted cave. The surrounding rocks adopted the strain hardening–softening constitutive model and the isotropic permeability model. When the parameters of the strain hardening–softening model of the surrounding rocks were input, the equivalent plastic strain parameter rp in the software and in the model transformed as follows [52].
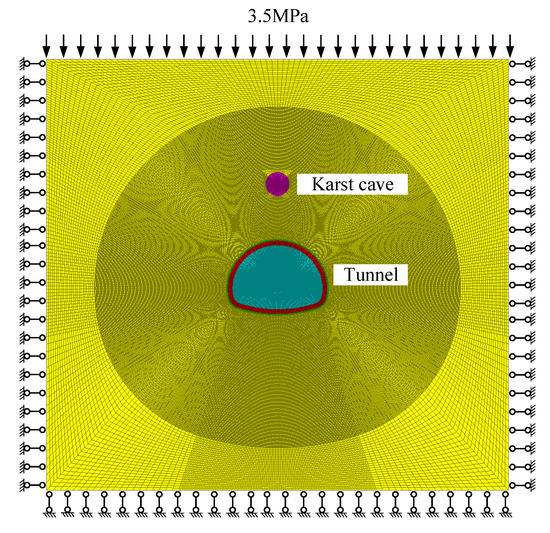
Figure 7.
Numerical model of karst-tunnel excavation.
When karst tunnel excavation was simulated, the built-in programming language FISH in FLAC3D was used to change the surrounding-rock mechanics and seepage parameters (Figure 8). The specific implementation process is as follows.
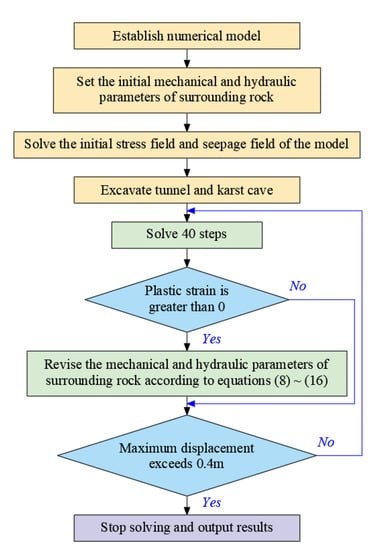
Figure 8.
Flow of the numerical simulation of the karst tunnel.
- (1)
- According to the size and location of the tunnel and karst cave, a numerical simulation model of karst tunnel excavation was established.
- (2)
- Set the boundary conditions of the model, and define the mechanical constitutive model and seepage model of the surrounding rocks of the tunnel. After inputting initial material parameters, perform fluid–solid coupling calculations up to equilibrium.
- (3)
- Calculate and analyze the excavation of karst caves and tunnels, and traverse all units every 40 time steps. According to the equivalent plastic strain parameter value rp of each unit body, the values of each mechanical parameter and seepage parameter are changed by Equations (8)–(16).
- (4)
- Repeat Step (3) until the stress field and seepage field of the surrounding rocks reach equilibrium or the maximum displacement of the surrounding rocks exceeds 0.4 m. Then, stop the calculation.
4.3. Analysis of Numerical Simulation Results
4.3.1. Change Law of Surrounding-Rock Displacement
Figure 9 shows the variation law of the surrounding-rock displacement of the karst tunnel with the number of solving steps under the condition of no support. When the number of solving steps is small, the stress release rate of the surrounding rocks of the tunnel is relatively small. At this time, the displacement of the surrounding rocks of the tunnel is about 7 m, and the maximum displacement is 6.2 mm at the vault, bottom, and sides (Figure 9a). With the increased solution steps, the stress release rate of the surrounding rocks increases gradually, and the displacement increases with it. Affected by the water pressure of the karst cave, the increased rate of the surrounding-rock displacement between the tunnel vault and karst cave is significantly greater than those on both sides and at the bottom.
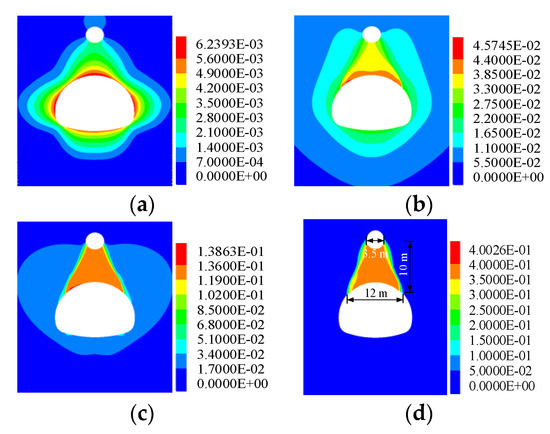
Figure 9.
Displacements of karst-tunnel surrounding rocks under different solution steps. (a) Step 800, (b) Step 4800, (c) Step 9800, and (d) Step 14,800.
The maximum displacement occurs when the tunnel surface deviates from the vault by about 4–5 m (Figure 9b). When the stress release rate continues to increase, the displacements of the surrounding rocks on both sides of the tunnel and at the bottom remain unchanged. However, the displacements of the surrounding rocks between the tunnel vault and the karst cave increase rapidly, and the overall sliding occurs, with a displacement of more than 0.4 m (Figure 9c,d). The width of the bottom edge of the sliding mass is about 12 m; that of the top edge is about 3.5 m; the height is about 10 m. Therefore, it can be judged that the rock masses at the vault of the karst tunnel have collapsed due to the release of excavation stress, the karst cave, and its internal water pressure.
4.3.2. Change Law of the Surrounding-Rock Plastic Zone
After tunnel excavation, the surrounding-rock failure is mainly pure shear failure, mixed with a small amount of shear failure. With the low-stress release rate of the surrounding rocks (Figure 10a), only the surrounding rocks within about 1 m have plastic yield failure. The plastic zone of the surrounding rocks gradually expands to the depth with the increased stress release rate (Figure 10b), and an obvious shear-slip fracture zone appears. Meanwhile, the two shear-slip fracture zones above the vault connect the karst cave to form a seepage channel.
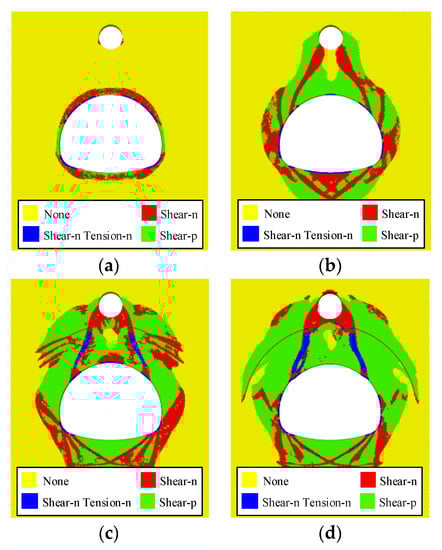
Figure 10.
Distribution of surrounding-rock plastic zones of the karst tunnel under different solution steps. (a) Step 800, (b) Step 4800, (c) Step 9800, and (d) Step 14,800.
When the stress release rate of the surrounding rocks continues to increase (Figure 10c,d), the extent of the surrounding-rock plastic zones on both sides of the tunnel and at the bottom of the tunnel remains unchanged. The width of the two shear-slip facture zones between the vault and the karst cave gradually increases, which causes tensile failure. In addition, the plastic zones of the surrounding rocks gradually expand to both sides. From beginning to end, there is always a part of the surrounding rocks in the elastic bearing zone between the tunnel vault and karst cave. It indicates that after the tunnel is excavated, water inrush from the upper karst cave occurs into the tunnel through the shear-slip fracture zones on the left and right sides instead of along the shortest path. Therefore, two water inrush points exist on the tunnel surface.
4.3.3. Change Law of Permeability Coefficients of Surrounding Rocks
In Figure 11, after the tunnel is excavated, the plastic principal strain increases accordingly with the continuous release of surrounding-rock stress. As a result, the permeability coefficients of the surrounding rock increase, especially the permeability coefficient of the rock mass in the shear-slip fracture zone. Although the rock mass in the shear-slip fracture zone has entered the residual stage, its permeability coefficients further increase due to plastic principal strain. In particular, the two shear-slip fracture zones above the tunnel have formed seepage channels. Under the water pressure and shear tension, not only does the permeable area become larger, but also the permeability coefficient increases rapidly, which is about 15–50 times larger than that of the original state.
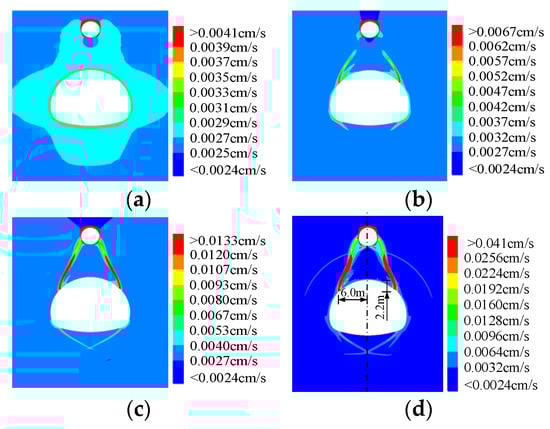
Figure 11.
Changes for permeability coefficients of karst-tunnel surrounding rocks under different solution steps. (a) Step 800, (b) Step 4800, (c) Step 9800, and (d) Step 14,800.
Figure 10 and Figure 11 are compared to show that the plastic zone range can only represent the surrounding rocks in the yielding state rather than the further evolution of the fracture or seepage channels after the surrounding rocks enter plastic yielding. Therefore, analyzing the change law of the permeability coefficients of the surrounding rocks can more truly reflect whether there is a seepage channel between the tunnel and karst cave, as well as the permeable area and water inrush speed of the seepage channel.
4.4. Comparison with the Test Results of the Physical Model
According to the engineering geological conditions of the above karst tunnel, a physical model test was carried out with a self-developed test device. The length × width × height of the physical model was 1200 mm × 100 mm × 550 mm, and the bulk density of similar materials was about 17.5 kN/m3. According to the similarity theory criterion, the geometric similarity ratio, time similarity ratio, and bulk density similarity ratio of the physical simulation test were 52.3, 7.23, and 1.2, respectively, and the size of the actual surrounding rock was 62.8 m × 5.2 m × 28.8 m. The uniaxial compressive strength of rock was taken as the main index to prepare the model material. The material ratios were as follows: quartz sand: light calcium carbonate: heavy crystal powder = 7:3:1, white cement: gypsum = 3:7, aggregate: cementing material = 17:1. The mass of silicone oil is 3% of the total mass of aggregate and cementing material.
During the test, the tunnel was excavated at the back of the model, and the pressurized water pump was used to load the karst cave. A digital camera connected with a computer was used to measure and analyze the deformation and fracture of the surrounding rocks during the excavation of the model tunnel (Figure 12). The diameter of the tunnel excavated in the physical model was 300 mm. According to the similarity ratio of the boundary surface force, the load on the top of the model should be 64 kPa during the excavation of the model tunnel, and the water pressure in the cave should be 24 kPa.
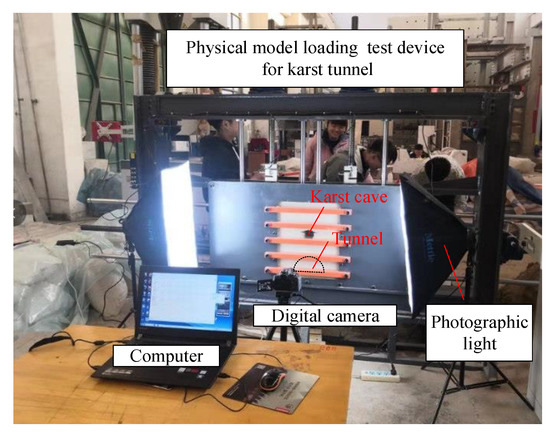
Figure 12.
Physical model test of the Karst Tunnel.
Figure 13 shows the total displacement and fracture distribution of rock masses between the tunnel and the karst cave after tunnel excavation. According to the geometric similarity ratio, Figure 13a shows that the maximum displacement of the karst tunnel after excavation is 1.01 m, about 4.5 m away from the vault position. At the same time, the rocks between the karst cave and the tunnel have also undergone integral sliding. Compared with Figure 9d, the deformation distribution law of surrounding rocks obtained from the model test and numerical simulation is the same, while the maximum displacement has a certain difference. When the maximum displacement of the surrounding rocks calculated by numerical simulation reaches 0.4 m, the surrounding rocks have been unstable and damaged, and no further calculation is made. If the calculation is continued, the displacement of the surrounding rocks will further increase until the calculation error occurs in the model due to grid distortion.
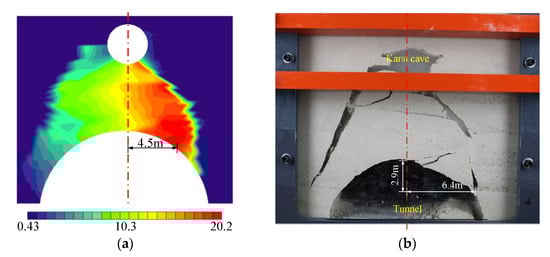
Figure 13.
Physical test results of the karst tunnel. (a) Total displacement nephogram. (b) Surrounding-rock damage.
Figure 13b shows that there are mainly two seepage channels between the tunnel and the cave after the excavation of the model tunnel, which is roughly symmetrical and located on both sides of the tunnel vault, respectively. Their shape is generally arc-shaped, starting from the position where the tunnel vault deviates from the vault by about 6.4 m and ending at the inclined lower corner of the karst cave. Compared with Figure 11d, the shape and position of seepage channels of the karst tunnel obtained from the model test and numerical simulation are generally consistent. It shows that the above numerical simulation results are reliable.
5. Discussion
The deformation of rock is generally nonlinear in geotechnical engineering such as tunnel excavation. For the practical needs of theoretical analysis of complex engineering problems, it is necessary to simplify the nonlinear deformation characteristics of rocks properly. Some scholars have also carried out research in the area. The main contribution of the work is that when the nonlinear deformation characteristics of rocks are simplified, the strain hardening stage and shear dilatant of rocks near the yield strength point are fully considered. In addition, the total stress–strain curve and volumetric strain–axial strain curve of rocks under triaxial compression are simplified into four corresponding linear stages.
Then, the strain hardening–softening model is established to derive the relationship between rock mechanical parameters and plastic strain and that between seepage characteristic parameters and volumetric strain. In addition, taking a karst tunnel in Chongqing, China, as an engineering case, the work demonstrates how to use the program language FISH to apply the above constitutive model to the FLAC numerical simulation, which analyzes the stability and water inrush characteristics of the karst tunnel. It provides a new idea for similar research and engineering analysis.
6. Conclusions
- (1)
- The results of triaxial compression tests of two kinds of carbonate rocks by other scholars were cited. The simplified stress hardening–softening model of rocks was established by analyzing the deviator stress and volumetric strain curves of two kinds of carbonate rocks. The total stress–strain curve of rocks was simplified into four linear stages: the linear elastic stage, strain hardening stage, strain-softening stage, and residual stage. The volumetric strain–axial strain curve was simplified into four corresponding linear stages: the elastic expansion stage, slow expansion stage, rapid expansion stage, and stable expansion stage.
- (2)
- The stress hardening–softening model was used to deduce the relationship between the rocks’ mechanical parameters such as cohesion, internal friction angle, dilatancy angle, and plastic strain, as well as the relationship between seepage characteristic parameters such as the permeability coefficient and porosity, and volumetric strain.
- (3)
- The stress-hardening–softening constitutive model and seepage characteristic parameters were applied to the FLAC numerical simulation using programming language FISH to analyze the stability and water inrush characteristics of karst tunnels in overlying confining karst caves. Rock masses between the cave and tunnel were prone to overall sliding instability. Confined water in the karst cave intruded into the tunnel through the shear-slip fracture zones on both sides instead of the shortest path. Two water inrush points existed on the tunnel surface. The variation law of the permeability coefficients of the surrounding rocks could more truly reflect whether there was a seepage channel between the tunnel and karst cave, as well as the permeable area and water inrush speed of the seepage channel.
Author Contributions
Investigation, J.L. and H.L. (Huajie Liang); Methodology, Z.L. and C.L.; Validation, B.Z. and C.W.; Writing—original draft, H.L. (Hongyang Liu). All authors have read and agreed to the published version of the manuscript.
Funding
This work is supported by the National Natural Science Foundation of China (51778215, 52174072), the Education Department of Guizhou Province Fund (Qianjiaohe KY Zi [2017] 265, Qianjiaohe KY Zi [2017] 266, Qianjiaohe KY Zi [2019] 073, Qianjiaohe KY Zi [2020] 050, and Qianjiao XKTJ [2020] 23), the Science and Technology Department of Guizhou Province Fund (Qiankehe Platform Talent [2019] 5620 and Qiankehe Platform Talent-YSZ [2021] 001), the Natural Science Foundation of Shandong Province (ZR2021QE170), and the Liupanshui Science and Technology Bureau fund (52020-2018-04-08).
Institutional Review Board Statement
Not applicable.
Informed Consent Statement
Not applicable.
Data Availability Statement
The original contributions presented in the study are included in the article; further inquiries can be directed to the corresponding author.
Conflicts of Interest
The authors declare no conflict of interest.
References
- Li, J.; Hong, A.H.; Yuan, D.X.; Jiang, Y.J.; Deng, S.J.; Cao, C.; Liu, J. A new distributed karst-tunnel hydrological model and tunnel hydrological effect simulations. J. Hydrol. 2021, 593, 125639. [Google Scholar] [CrossRef]
- Xu, Z.H.; Lin, P.; Xing, H.L.; Pan, D.D.; Huang, X. Hydro-mechanical Coupling Response Behaviors in Tunnel Subjected to a Water-Filled Karst Cave. Rock Mech. Rock Eng. 2021, 54, 3737–3756. [Google Scholar] [CrossRef]
- Zhang, L.K.; Qin, X.Q.; Tang, J.S.; Liu, W.; Yang, H. Review of arsenic geochemical characteristics and its significance on arsenic pollution studies in karst groundwater, Southwest China. Appl. Geochem. 2017, 77, 80–88. [Google Scholar] [CrossRef]
- Wang, Z.M.; Rawal, K.; Hu, L.B.; Yang, R.D.; Yang, G.L. A study of dissolution and water-bearing characteristics of the restricted platform dolomite facies in the karst areas of Guizhou, China. Environ. Earth Sci. 2017, 76, 124. [Google Scholar] [CrossRef]
- Yu, L.; Lv, C.; Wang, Z.H.; Sun, Y.; Yang, N.; Wang, Z.L.; Wang, M.N. Upper Bound Analysis of Collapse Failure in Deep Buried Tunnel Under Upper Cave. China J. Highw. Transp. 2021, 34, 209–219. [Google Scholar]
- Ma, G.M.; Zhang, X.L.; Yang, H.Q. Study on Water Inrush Mechanism and Safety Critical Conditions of Karst Tunnels. Saf. Environ. Eng. 2022, 29, 64–70. [Google Scholar]
- Zhang, L.W.; Fu, H.; Wu, J.; Zhang, X.Y.; Zhao, D.K. Effects of Karst Cave Shape on the Stability and Minimum Safety Thickness of Tunnel Surrounding Rock. Int. J. Geomech. 2021, 21, 04021150. [Google Scholar] [CrossRef]
- Song, J.; Chen, D.Y.; Wang, J.; Bi, Y.F.; Liu, S.; Zhong, G.Q.; Wang, C. Evolution Pattern and Matching Mode of Precursor Information about Water Inrush in a Karst Tunnel. Water 2021, 13, 1579. [Google Scholar] [CrossRef]
- Tian, Q.Y.; Zhang, J.T.; Zhang, Y.L. Similar simulation experiment of expressway tunnel in karst. Constr. Build. Mater. 2018, 178, 1–13. [Google Scholar] [CrossRef]
- Yang, W.M.; Fang, Z.D.; Wang, H.; Li, L.P.; Shi, S.S.; Ding, R.S.; Bu, L.; Wang, M.X. Analysis on Water Inrush Process of Tunnel with Large Buried Depth and High Water Pressure. Processes 2019, 7, 134. [Google Scholar] [CrossRef] [Green Version]
- He, Y.W.; Fu, H.L.; Luo, L.F.; Liu, Y.S.; Rao, J.Y. Theoretical Solution of the Influence of Karst Cavern Beneath Tunnel on the Stability of Tunnel Structure. China Civ. Eng. J. 2014, 47, 128–135. [Google Scholar]
- Fraldi, M.; Guarracino, F. Limit Analysis of Collapse Mechanisms in Cavities and Tunnels According to the Hoek-Brown Failure Criterion. Int. J. Rock. Mech. Min. 2009, 46, 665–673. [Google Scholar] [CrossRef]
- Fraldi, M.; Guarracino, F. Evaluation of Impending Collapse in Circular Tunnels by Analytical and Numerical Approaches. Tunn. Undergr. Sp. Technol. 2011, 26, 507–516. [Google Scholar] [CrossRef]
- Fraldi, M.; Guarracino, F. Analytical Solutions for Collapse Mechanisms in Tunnels with Arbitrary Cross Sections. Int. J. Solids Struct. 2010, 47, 216–223. [Google Scholar] [CrossRef]
- Yang, X.L.; Li, Z.W. Collapse Analysis of Tunnel Floor in Karst Area Based on Hoek-Brown Rock Media. J. Cent. South Univ. 2017, 24, 957–966. [Google Scholar] [CrossRef]
- Huang, F.; Zhao, L.H.; Ling, T.H.; Yang, X.L. Rock Mass Collapse Mechanism of Concealed Karst Cave Beneath Deep Tunnel. Int. J. Rock Mech. Min. 2017, 91, 133–138. [Google Scholar] [CrossRef]
- Li, Z. Study on Design Methodology and Key Technologies of Railway Tunnels in Low Mountains and Hills. Ph.D. Thesis, Southwest Jiaotong University, Chengdu, China, 2018. [Google Scholar]
- Sun, J.L.; Wang, F.; Wang, X.L.; Wu, X. A Quantitative Evaluation Method Based on Back Analysis and the Double-Strength Reduction Optimization Method for Tunnel Stability. Adv. Civ. Eng. 2021, 2021, 8899685. [Google Scholar] [CrossRef]
- Liu, Z.W.; He, M.C.; Wang, S.R. Study on karst water burst mechanism and prevention countermeasures in Yuanliangshan tunnel. Rock Soil Mech. 2006, 2, 228–232. [Google Scholar]
- Wan, F.; Xu, P.W.; Zhang, P.; Qu, H.F.; Wang, L.H.; Zhang, X. Quantitative Inversion of Water-Inrush Incidents in Mountain Tunnel beneath a Karst Pit. Adv. Civ. Eng. 2021, 2021, 9971944. [Google Scholar] [CrossRef]
- Yu, J.X. Risk Assessment of Water Inrush and Mud in Karst Tunnel and Influence of Surrounding Rock Stability. Ph.D. Thesis, Chang’an University, Xi’an, China, 2018. [Google Scholar]
- Yang, T.H.; Tang, C.A.; Tan, Z.H.; Zhu, W.C.; Feng, Q.Y. State of The Art of Inrush Models in Rock Mass Failure and Developing Trend for Prediction and Forecast of Groundwater Inrush. Chin. J. Rock Mech. Eng. 2007, 2, 268–277. [Google Scholar]
- Huang, M.L.; Wang, F.; Lu, W.; Tan, Z.S. Numerical study on the process of water inrush in Karst caves with hydraulic pressure caused by tunnel excavation. Strateg. Study CAE 2009, 11, 93–96. [Google Scholar]
- Zhang, Q.; Huang, B.X.; He, M.C.; Guo, S. A Numerical Investigation on the Hydraulic Fracturing Effect of Water Inrush during Tunnel Excavation. Geofluids 2020, 2020, 6196327. [Google Scholar] [CrossRef]
- Sun, F. Study on The Key Technique of Composite Grouting for Water Blockage in Weathered Slot of Subsea Tunnel. Ph.D. Thesis, Beijing Jiaotong University, Beijing, China, 2010. [Google Scholar]
- Wang, Y.; Lu, Y.G.; Ni, X.D.; Li, D.T. Study on mechanism of water burst and mud burst in deep tunnel excavation. J. Hydraul. Eng. 2011, 42, 595–601. [Google Scholar]
- Gao, Y. Research on the Safety Distance That Water Inrush Disaster Prevention of DeJiang Tunnel Roof under Complicated hydrogeological Conditions. Ph.D. Thesis, Guizhou University, Guiyang, China, 2016. [Google Scholar]
- Zhu, W.X. Study on Mechanism of Water Inrush in Muddy Limestone Karst Tunnel after Wetting and Drying Cycles. Ph.D. Thesis, China University of Mining and Technology, Beijing, China, 2018. [Google Scholar]
- Liu, H.Y.; Qin, S.Q.; Li, H.E.; Ma, P.; Sun, Q.; Yang, J.H. Simulation of rock slope seepage failure by numerical manifold method. Hydrogeol. Eng. Geol. 2007, 1, 66–69. [Google Scholar]
- Yan, C.Z.; Zheng, H.; Sun, G.H.; Ge, X.R. Combined finite-discrete element method for simulation of hydraulic fracturing. Rock Mech. Rock Eng. 2016, 49, 1389–1410. [Google Scholar] [CrossRef]
- Yan, C.Z.; Jiao, Y.Y. A 2D fully coupled hydro-mechanical finite discrete element model with real pore seepage for simulating the deformation and fracture of porous medium driven by fluid. Comput. Struct. 2018, 196, 311–326. [Google Scholar] [CrossRef]
- Yan, C.Z.; Jiao, Y.Y.; Zheng, H. A fully coupled three-dimensional hydro-mechanical finite discrete element approach with real porous seepage for simulating 3D hydraulic fracturing. Comput. Geotech. 2018, 96, 73–89. [Google Scholar] [CrossRef]
- Zhang, R.; Yan, L.; Qian, Z.W.; Sun, X.W.; Liu, W. Study on the Evolution Relationship of the Deformation Mechanism and Permeability of Underground Rock. Chin. J. Undergr. Space Eng. 2022, 18, 129–135. [Google Scholar]
- Wang, J.A.; Park, H.D. Fluid permeability of sedimentary rock in a complete stress-strain process. Eng. Geol. 2002, 63, 291–300. [Google Scholar] [CrossRef]
- Peng, S.P.; Meng, Z.P.; Wang, H.; Ma, C.L.; Pan, J.N. Testing study on pore ration and permeability of sandstone under different confining pressures. Chin. J. Rock Mech. Eng. 2003, 22, 742–746. [Google Scholar]
- Peng, S.P.; Qu, H.L.; Luo, L.P.; Wang, L.; Duan, Y.E. An experimental study on the penetrability of sedimentary rock during the complete stress-strain path. J. China Coal Soc. 2000, 25, 113–116. [Google Scholar]
- Yang, Y.J.; Chu, J.; Huan, D.Z.; Li, L. Experimental of coal’s strain-permeability rate under solid and liquid coupling condition. J. China Coal Soc. 2008, 33, 760–764. [Google Scholar]
- Li, S.P.; Li, Y.S.; Wu, Z.Y. The permeability-strain equations relating to complete stress-strain path of the rock. Chin. J. Geotech. Eng. 1995, 17, 13–19. [Google Scholar]
- Zhang, C.H.; Yue, H.L.; Wang, L.G.; Guo, X.K.; Wang, Y.J. Strain softening and permeability evolution model based on brittle modulus coefficient. J. China Coal Soc. 2016, 41, 255–264. [Google Scholar]
- Liu, C.Y.; Du, L.Z.; Zhang, X.P.; Wang, Y.; Hu, X.M.; Han, Y.L. A New Rock Brittleness Evaluation Method Based on the Complete Stress-Strain Curve. Lithosphere 2021, 2021, 4029886. [Google Scholar] [CrossRef]
- Yuan, S.C.; Harrison, J.P. An empirical dilatancy index for the dilatant deformation of rock. Int. J. Rock Mech. Min. 2004, 41, 679–686. [Google Scholar] [CrossRef]
- Yuan, S.C.; Harrison, J.P. Development of a hydro-mechanical local degradation approach and its application to modelling fluid flow during progressive fracturing of heterogeneous rocks. Int. J. Rock Mech. Min. 2005, 42, 961–984. [Google Scholar] [CrossRef]
- Wang, D.; Han, X.G.; Zhou, X.M. Limestone failure law and post-failure constitutive relation in the control of lateral deformation. J. China Coal Soc. 2010, 35, 2022–2027. [Google Scholar]
- Jing, W.; Xue, W.P.; Yao, Z.S. Variation of the internal friction angle and cohesion of the plastic softening zone rock in roadway surrounding rock. J. China Coal Soc. 2018, 43, 2203–2210. [Google Scholar]
- Lu, Y.D.; Ge, X.R.; Jiang, Y.; Ren, J.X. Study on Conventional Triaxial Compression Test of Complete Process for Marble and Its Constitutive Equation. Chin. J. Rock Mech. Eng. 2004, 23, 2489–2493. [Google Scholar]
- Zhao, X.G.; Cai, M.; Cai, M.F. A rock dilation angle model and its verification. Chin. J. Rock Mech. Eng. 2010, 29, 970–981. [Google Scholar]
- Meng, Q.B.; Wang, J.; Han, L.J.; Sun, W.; Qiao, W.G.; Wang, G. Physical and mechanical properties and constitutive model of very weakly cemented rock. Rock Soil Mech. 2020, 41, 19–29. [Google Scholar]
- Zhao, X.G.; Li, P.F.; Ma, L.K.; Su, R.; Wang, J. Damage and dilation characteristics of deep granite at Beishan under cyclic loading-unloading conditions. Chin. J. Rock Mech. Eng. 2014, 33, 1740–1748. [Google Scholar]
- Zhang, N.X.; Sheng, Z.P.; Li, X.; Li, S.D.; Hao, J.M. Study of relationship between poisson’s ratio and angle of internal friction for rocks. Chin. J. Rock Mech. Eng. 2011, 30, 2599–2609. [Google Scholar]
- Zhang, N.X.; Li, S.D.; Sheng, Z.P. The method for estimating tensile strength by using shear strength parameters and discussions. J. Eng. Geol. 2018, 26, 446–456. [Google Scholar]
- Zhang, B.Y.; Bai, H.B.; Zhang, K. Research on permeability characteristics of karst collapse column fillings in complete stress-strain process. J. Min. Saf. Eng. 2016, 33, 734–740. [Google Scholar]
- Sun, C.; Zhang, S.G.; Jia, B.X.; Wu, Z.Q. Physical and numerical model tests on post-peak mechanical properties of granite. Chin. J. Geotech. Eng. 2015, 37, 847–852. [Google Scholar]
Publisher’s Note: MDPI stays neutral with regard to jurisdictional claims in published maps and institutional affiliations. |
© 2022 by the authors. Licensee MDPI, Basel, Switzerland. This article is an open access article distributed under the terms and conditions of the Creative Commons Attribution (CC BY) license (https://creativecommons.org/licenses/by/4.0/).