Article

Research on Sandstone Damage Characteristics and Acoustic Emission Precursor Features under Cyclic Loading and Unloading Paths

1
School of Safety Engineering, China University of Mining and Technology, Xuzhou 221116, China
2
Architectural Engineering College, Guizhou Minzu University, Guiyang 550025, China
3
Guizhou Branch of Shijiazhuang Design and Research Institute of Coal Industry Company Limited, Guiyang 550025, China
4
Guizhou Anhe Mining Science and Technology Engineering Company Limited, Guiyang 550081, China
5
Mining College, Guizhou University, Guiyang 550025, China
6
Liangbei Coal Mine, Henan Shenhuo Grp Company Limited, Xuchang 461000, China
*
Authors to whom correspondence should be addressed.
Sustainability 2022, 14(19), 12024; https://doi.org/10.3390/su141912024
Submission received: 3 September 2022 / Revised: 17 September 2022 / Accepted: 20 September 2022 / Published: 23 September 2022
(This article belongs to the Special Issue Hazard Control and Emergency Rescue in Underground Engineering)

Abstract

:
The deformation and failure features of rock formation in deep coal mines are basic mechanical problems in the complex geology environment and complicated excavation process. Under the effect of cyclic loading and unloading, the bearing capacity weakens and damage degree exacerbates significantly, which seriously threatens the safety and stability of the working face. To study the damage characteristics of sandstone, especially the precursor characteristics of acoustic emission (AE), this paper conduct the AE response experiments on sandstone under cyclic loading and unloading. The results show that with the increasing number of cycles, the loading modulus, unloading modulus, total strain energy, elastic energy, and dissipation energy of sandstone in the cycle stage all increase continuously. In the initial loading stage, the sandstone has fewer cycles and lower stress levels, fewer AE ringing counts and energy, and less rock damage. With the increasing cyclic times and loading stress, the damage degree of sandstone increases rapidly in a very short time. The damage variable represented by ringing count is more sensitive than by energy. Just before rock failure, the ringing count and the energy value increase significantly, and the damage curve rises sharply. In addition, AE waveform signals have obvious aggregation characteristics and four main bands. Just before sandstone failure, the main frequency band becomes wider, the low frequency bands f1 and f2 become connected, and the main signal frequency appears abnormally low and high. The waveform signals before sandstone instability and failure show a phenomenon where the low-frequency amplitude is generally at a high level, the high-frequency signal decreases, the amplitude becomes low, and the multipeak phenomenon weakens. The above characteristics of the AE time domain and waveform analysis can be used as the precursor characteristics of sandstone failure and instability. This study can reveal the process of the sandstone deterioration and AE response under the cyclic loading and unloading condition, and has certain guiding significance for roof and floor control in deep roadway, instability warming monitor of working faces, and guarantees for safety production.

1. Introduction

In the process of coal mining, coal and rock masses are often subjected to repeated loading and unloading, such as in the disturbance of the front coal and rock mass by the tunnel boring machine in the tunneling process of the coal roadway, the periodic weighting of the roof strata during the mining of the working face, and the periodic loading of the coal and rock mass caused by structural stresses such as earthquakes [1,2,3]. The mechanical properties of the coal and rock mass gradually deteriorate, and the bearing capacity gradually decreases under cyclic loading, which has a great influence on the safety of the coal mining face [4,5,6,7,8]. Therefore, studying the damage caused by mechanical properties of coal and rock masses under cyclic loading and unloading has important practical significance and engineering value. Table 1 shows the latest relevant research.
Under cyclic loading and unloading, the mechanical characteristics of coal and rock are markedly different from those under uniaxial loading [9,10]. The deformation capacity, strength, and damage of rock is directly correlated with its stress state and loading history [11,12,13]. The cyclic loading tests are conducted on a press machine, repeating loading and unloading until the rock is broken. The loading methods can be divided into two ways: force control and displacement control, depending on the demand of research. Usually, the loading and unloading rate are kept the same. To study the mechanical properties of sandstone during cyclic loading and unloading, Richards et al. [14] developed an elastic constitutive model that combined experimentally observed stress and plastic strain with the evolution of the elastic bulk modulus and shear modulus. The nonlinear stress dependence of the bulk modulus was modified by the plastic volumetric strain, which accumulated during hydrostatic pressure and eccentric loading. Hagengruber et al. [15] discovered that increasing permeability was inversely proportional to confining pressure because increasing confining pressure inhibited the growth, coalescence, and expansion of microcracks. When compared to the previous cycle, the permeability increased in each unloading-reloading cycle, which was consistent with the increased damage in the form of an extended microcrack network. Taheri et al. [16] discovered that during cyclic loading of the system, the tangent Young’s modulus (E-tan) continued to degenerate, and the stiffness decline rate increased rapidly until large plastic deformation occurred. The damage effect during cyclic loading increased with the unloading stress level and unloading amplitude, and the confined specimen had a longer fatigue life than the unconfined specimen.
AE is a natural phenomenon where part of the strain energy stored in the rock body is released in the form of elastic waves when the rock is damaged, fractured, or destabilized by external loads [17,18,19]. Quantitatively analyzing AE monitoring signals can reveal the evolution of lattice dislocations and microcracks inside the rock, which can characterize the degree of damage during the deformation and damage of the rock to a certain extent and provide precursor information for the expansion of damage and destruction of the rock [20,21,22,23]. To characterize the AE response to sandstone fractures, Makhnenko et al. [24] found that the onset of the inelastic response in fluid-saturated rocks (similar to dry rocks) was consistent with an increase in the AE rate. The clustering of AE events and the onset of nonuniform deformation inferred from displacement measurements were closely related to model predictions of the onset of local deformation under various rock–fluid interaction conditions. Charalampidou et al. [25] described the spatiotemporal evolution of the developmental deformation zone using the AE source location and mechanism. The main mechanism for reaching peak stress was shearing, and the growth of the shear band was primarily controlled by compression. The compaction zone formed at the tip of the preexisting shear zone and extended circumferentially around the specimen.
To study the damage characteristics of sandstone, Panteleev et al. [26] developed an isotropic nonlinear damage rheological model with damage parameters that accounted for the mutation of the effective elastic modulus when stress inversion occurs. To evaluate fracture deterioration, the ultrasonic P wave velocity and sound emission in the three major directions were examined. The nonlinear stress—strain behavior and longitudinal wave velocity change in sandstone were adequately described by the model. Xi et al. [27] assessed the impacts of the heating temperature and cooling technique on the dynamic mechanical characteristics of high-temperature rock and analyzed the thermal shock damage progression and mechanism. The fractal approach was used to analyze the debris distribution, and the link between the fractal dimension, heat treatment temperature, and cooling mode was determined. Different cooling procedures could be used to assess the damage caused by the high-temperature rock after impact. There have been many studies on the physical and mechanical properties, AE count energy, and other features of coal and rock under various cyclic loading and unloading situations, as evidenced above.
Table 1. The latest relevant research about rock deformation.
NumberYearAuthorsWorks
[14]2022Richards
et al.
Establish a coupled elastic constitutive model to predict the mechanical unloading response of high porosity sandstones
[24]2020Makhnenko
et al.
The clustering of AE events and the onset of nonuniform deformation were related to predictions of the onset of local deformation
[26]2021Panteleev
et al.
Developed an isotropic nonlinear damage rheological model to describe the nonlinear stress—strain behavior and longitudinal wave velocity
However, rock failure is a cumulative process, and there has been little research on the damage process and failure antecedent of sandstone under cyclic loading and unloading utilizing AE time domain and frequency domain parameters. There is still an emergent need to establish the relation of AE parameters and rock mechanism.
Therefore, cyclic loading and unloading tests on sandstone are conducted. Four factors are included in the analysis of the mechanical development of sandstone during the damage and failure process. The degree of the rock loading damage is quantitatively analyzed using the AE count, energy, and primary frequency. Moreover, the features of the time domain and frequency domain establish the precursor characteristics of rock instability and failure. The combination analysis of the sandstone failure and acoustic characteristic reveals the evolution of energy and damage. The in-depth research on the AE response precursor of sandstone failure can offer some theory support for monitoring the deformation of surrounding rock and predicting the instability of roadway. It is of great significance for analysis of the excavation disaster mechanism as well as recognizing and preventing the dynamic disasters, especially rock burst.

2. Sandstone AE Response Experiment with Cyclic Loading and Unloading

2.1. Experimental Sample Preparation

The sandstone samples utilized in this article originated from a mine and came from the same full rock block. The sandstone sample was processed into a rectangular shape with a size of 50 mm × 50 mm × 100 mm, and the parallelism of the end face of the sample was regulated to within 0.02 mm. The bulk density of sandstone was 2200 kg/m3. To avoid weathering, the sample was wrapped in preservative film, meeting ISRM requirements [28].

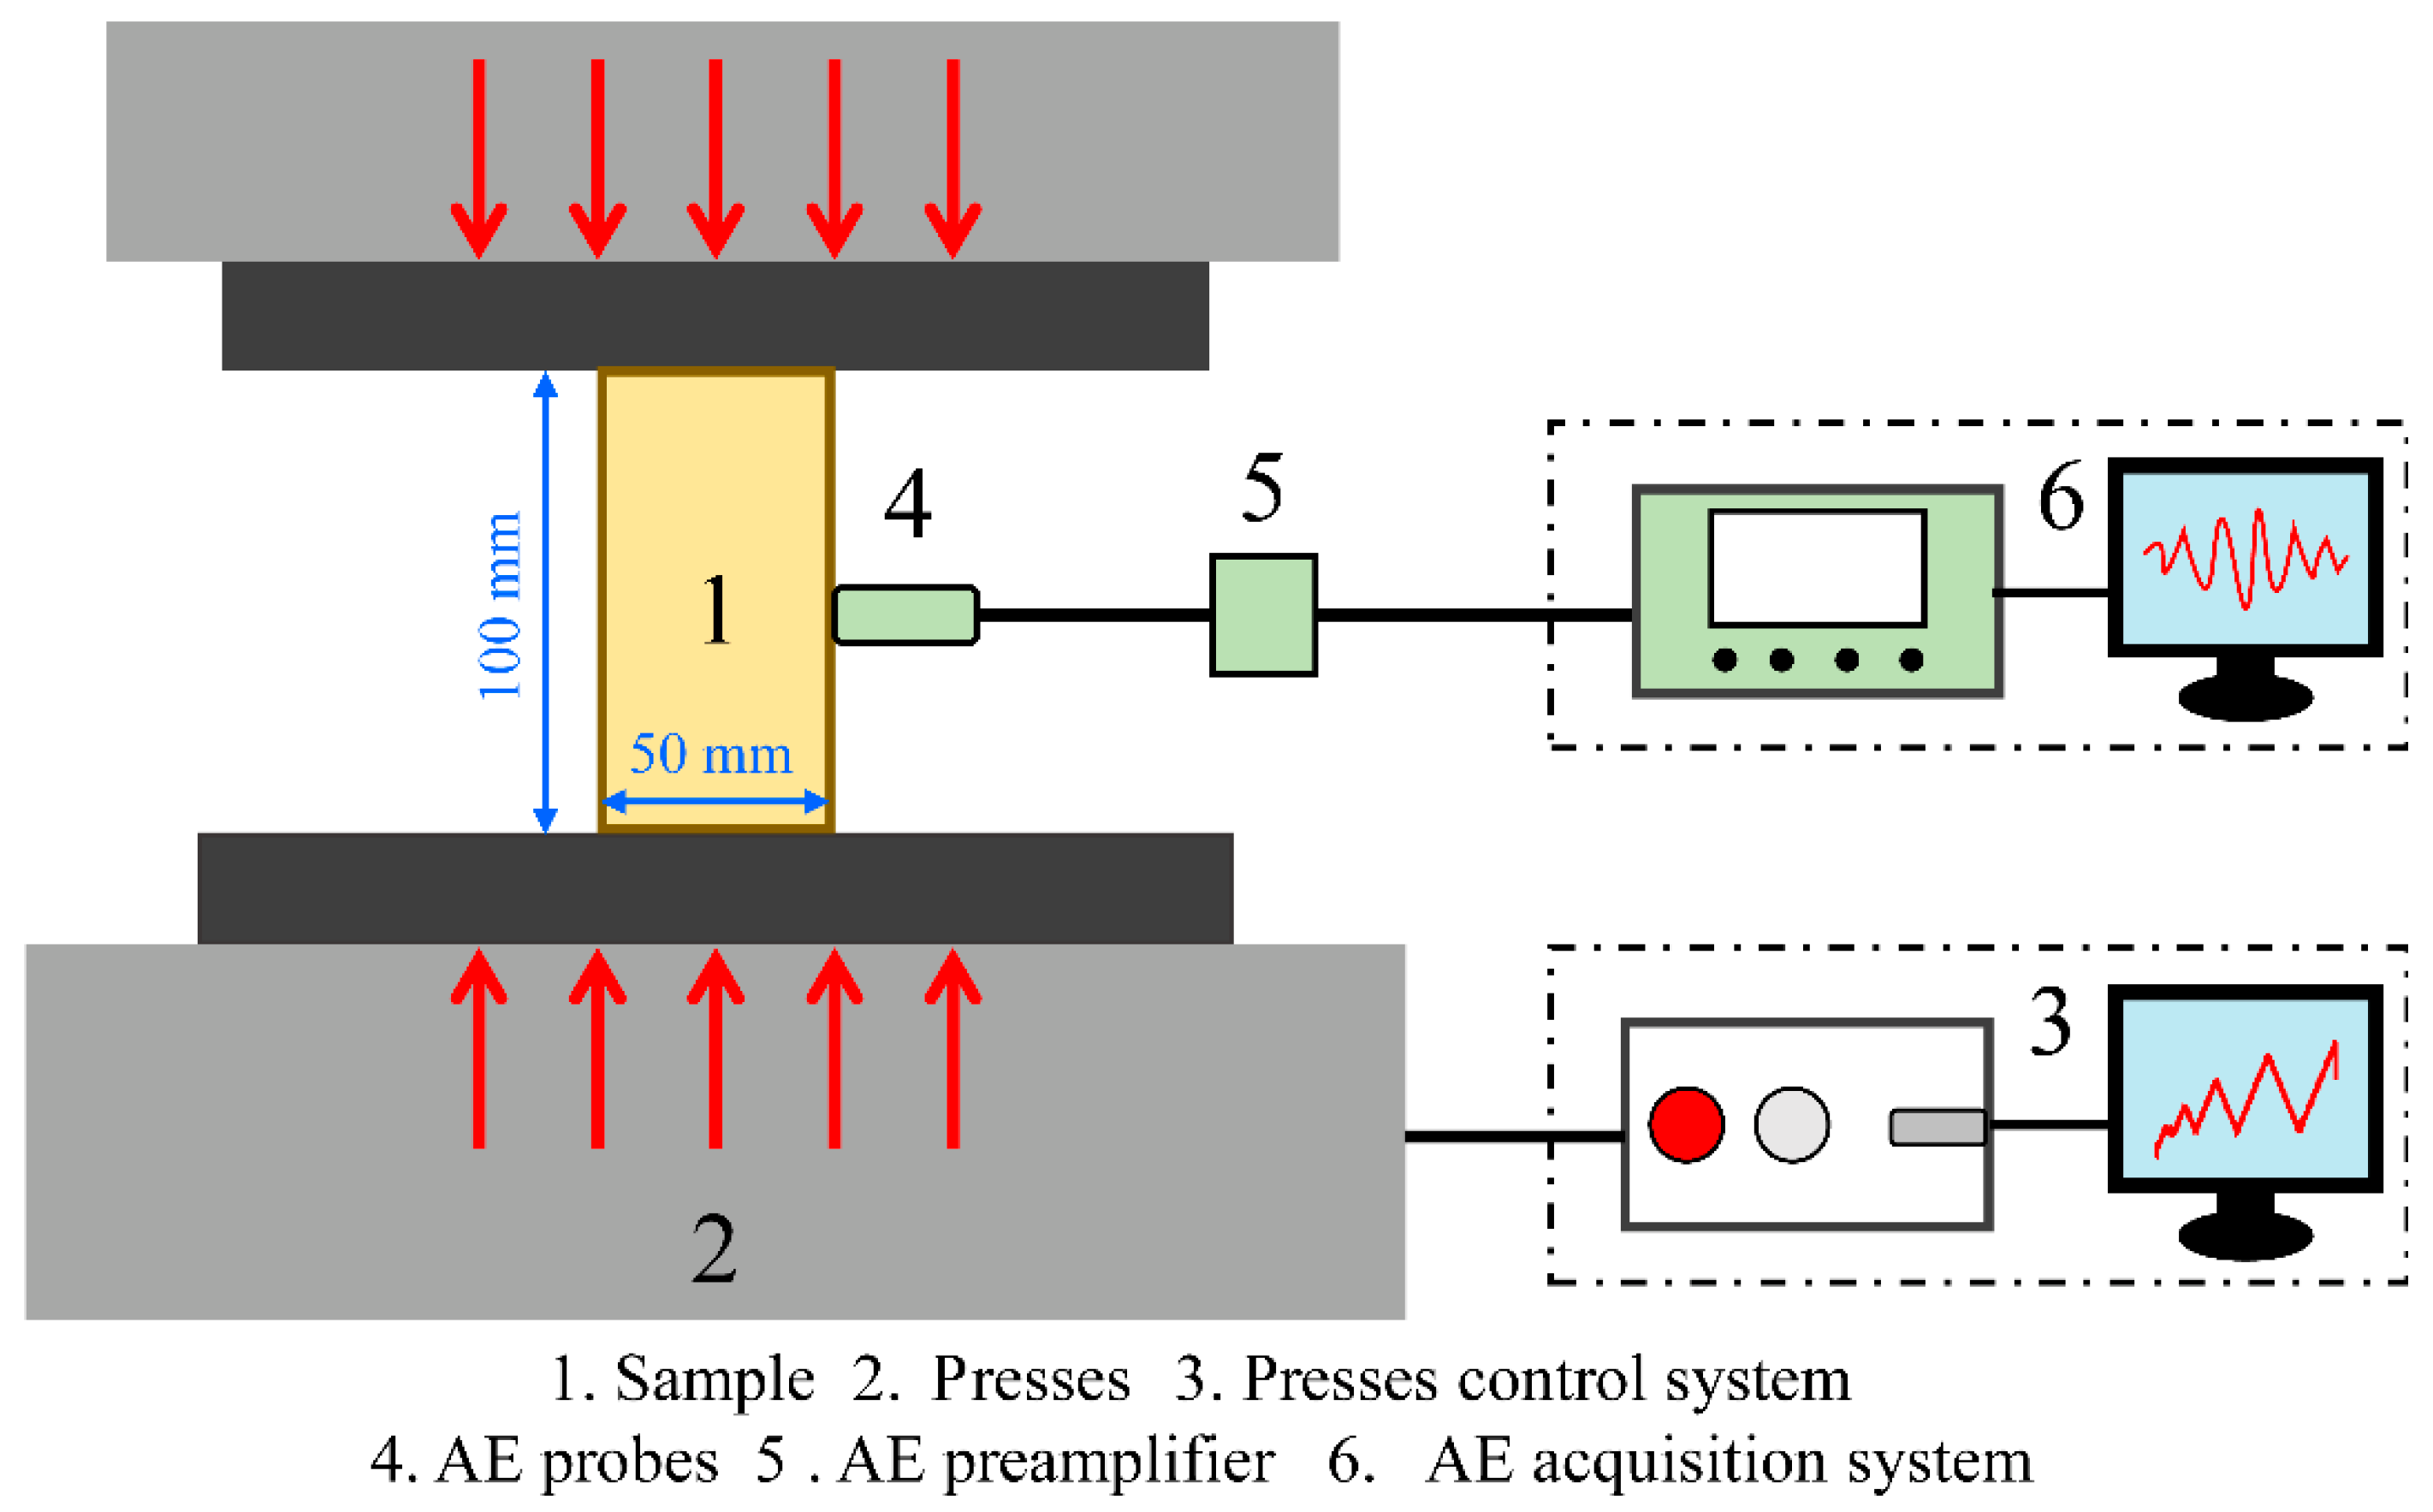
2.2. Instruments for Experimentation

The experimental equipment consists mostly of a loading system and an AE test system. A new SANS microcomputer-controlled electrohydraulic servo pressure testing equipment served as the loading system, which comprised a press, a DCS controller, and a PowerTestV3.3 control application. The maximum load was 3000 kN, allowing for load control, displacement control, and other closed-loop control methods to be used with excellent control precision and dependability. The displacement sensor is measuring the axial displacement of the sample by monitoring the moving distance of the based loading platform while the top platform is kept still. The AE test system made use of the CTA-I dynamic acoustic and electrical data collecting system (Physical Acoustics, USA), which can collect AE signals from 24 channels at the same time. To avoid ambient interference, the AE acquisition system threshold, preamplifier gain value, and sampling frequency were all set to 40 dB and 2 MSPS. Coupling adhesive was applied between the AE probe and the sample. Figure 1 depicts the experimental system.

2.3. Experimental Procedure

(1)
Glue the Vaseline-coated AE probe to the sample surface, then examine the AE signal using the lead breaking method to remove noise interference, and make sure the AE test system to be normal.
(2)
Mount the sandstone samples on the press, put the insulating gasket between the spacemen and the press, and keep the contact well by using the adjustable base.
(3)
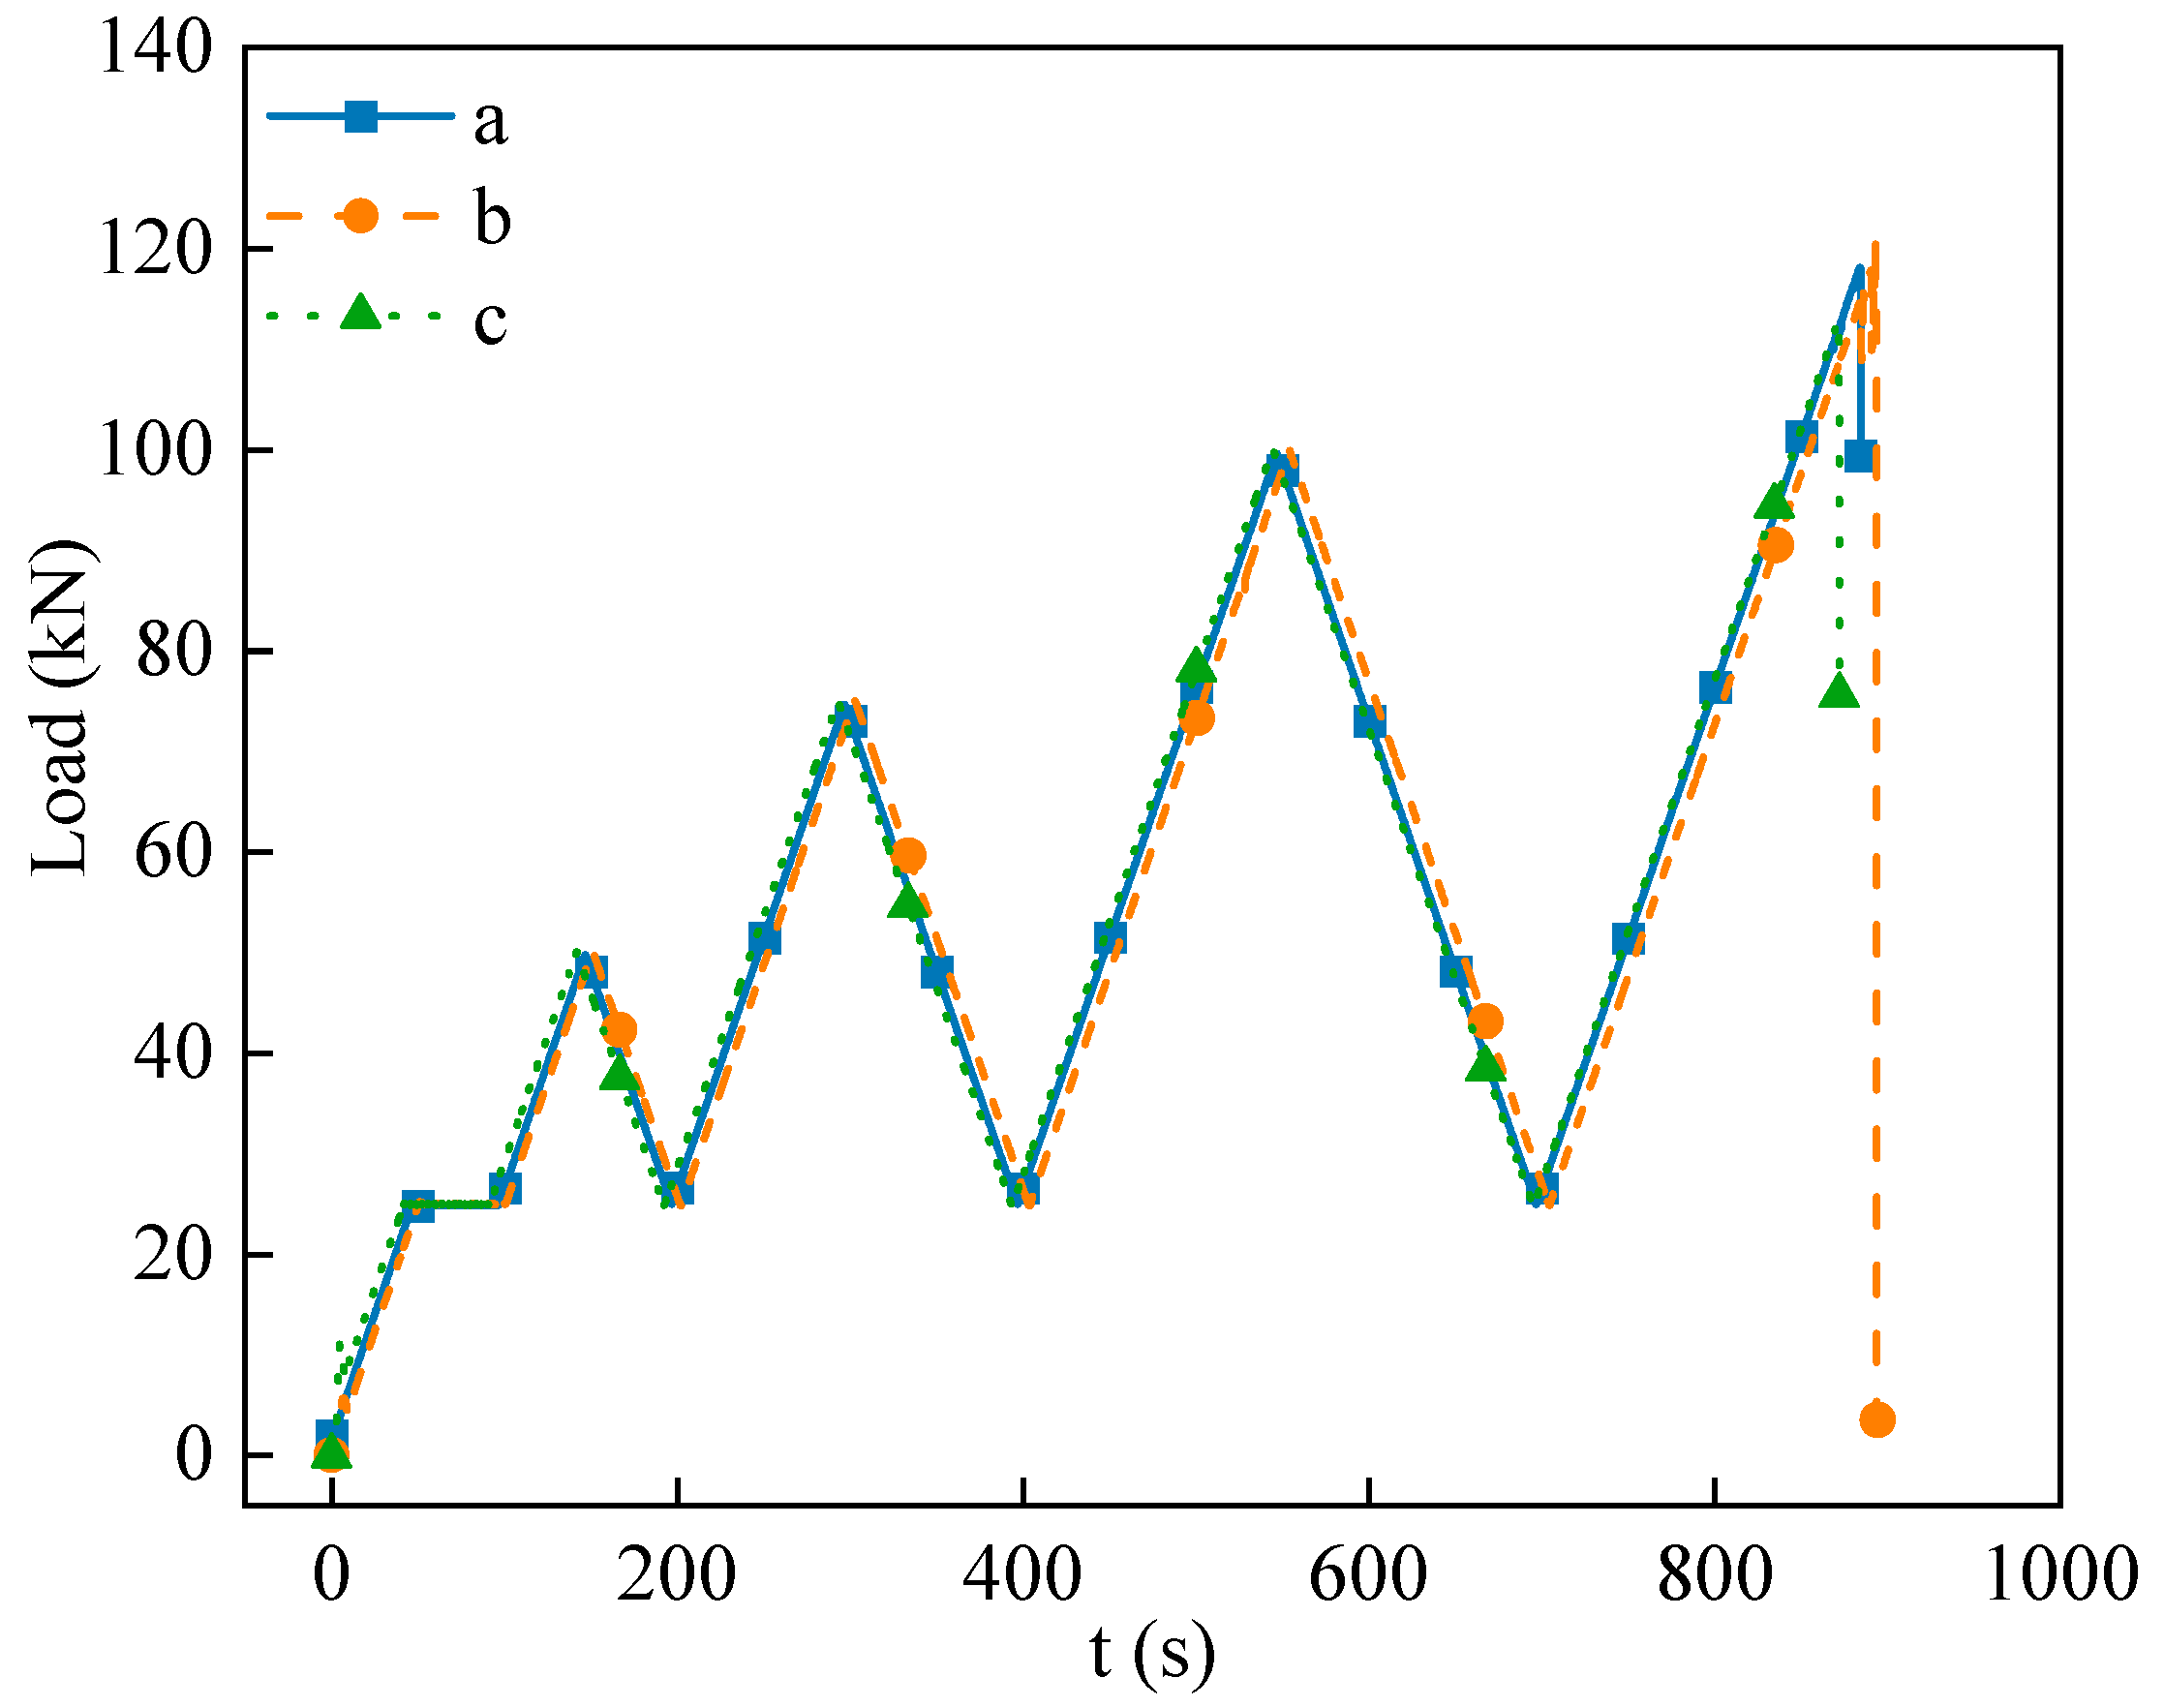
Apply the loading and unloading method, that is, loading at the speed of 0.5 kN/s and unloading at the same speed, until the sandstone breaks.
(4)
Repeat the above process until all the samples are tested. Clean up the laboratory. Collect and analyse the relevant data.
Figure 2 depicts the loading and unloading path of the experiment. To prevent the interference of experimental error, the experiment was performed three times. Three samples were tested and broken at the fourth loading cycle.

3. Experimental Results and Discussion

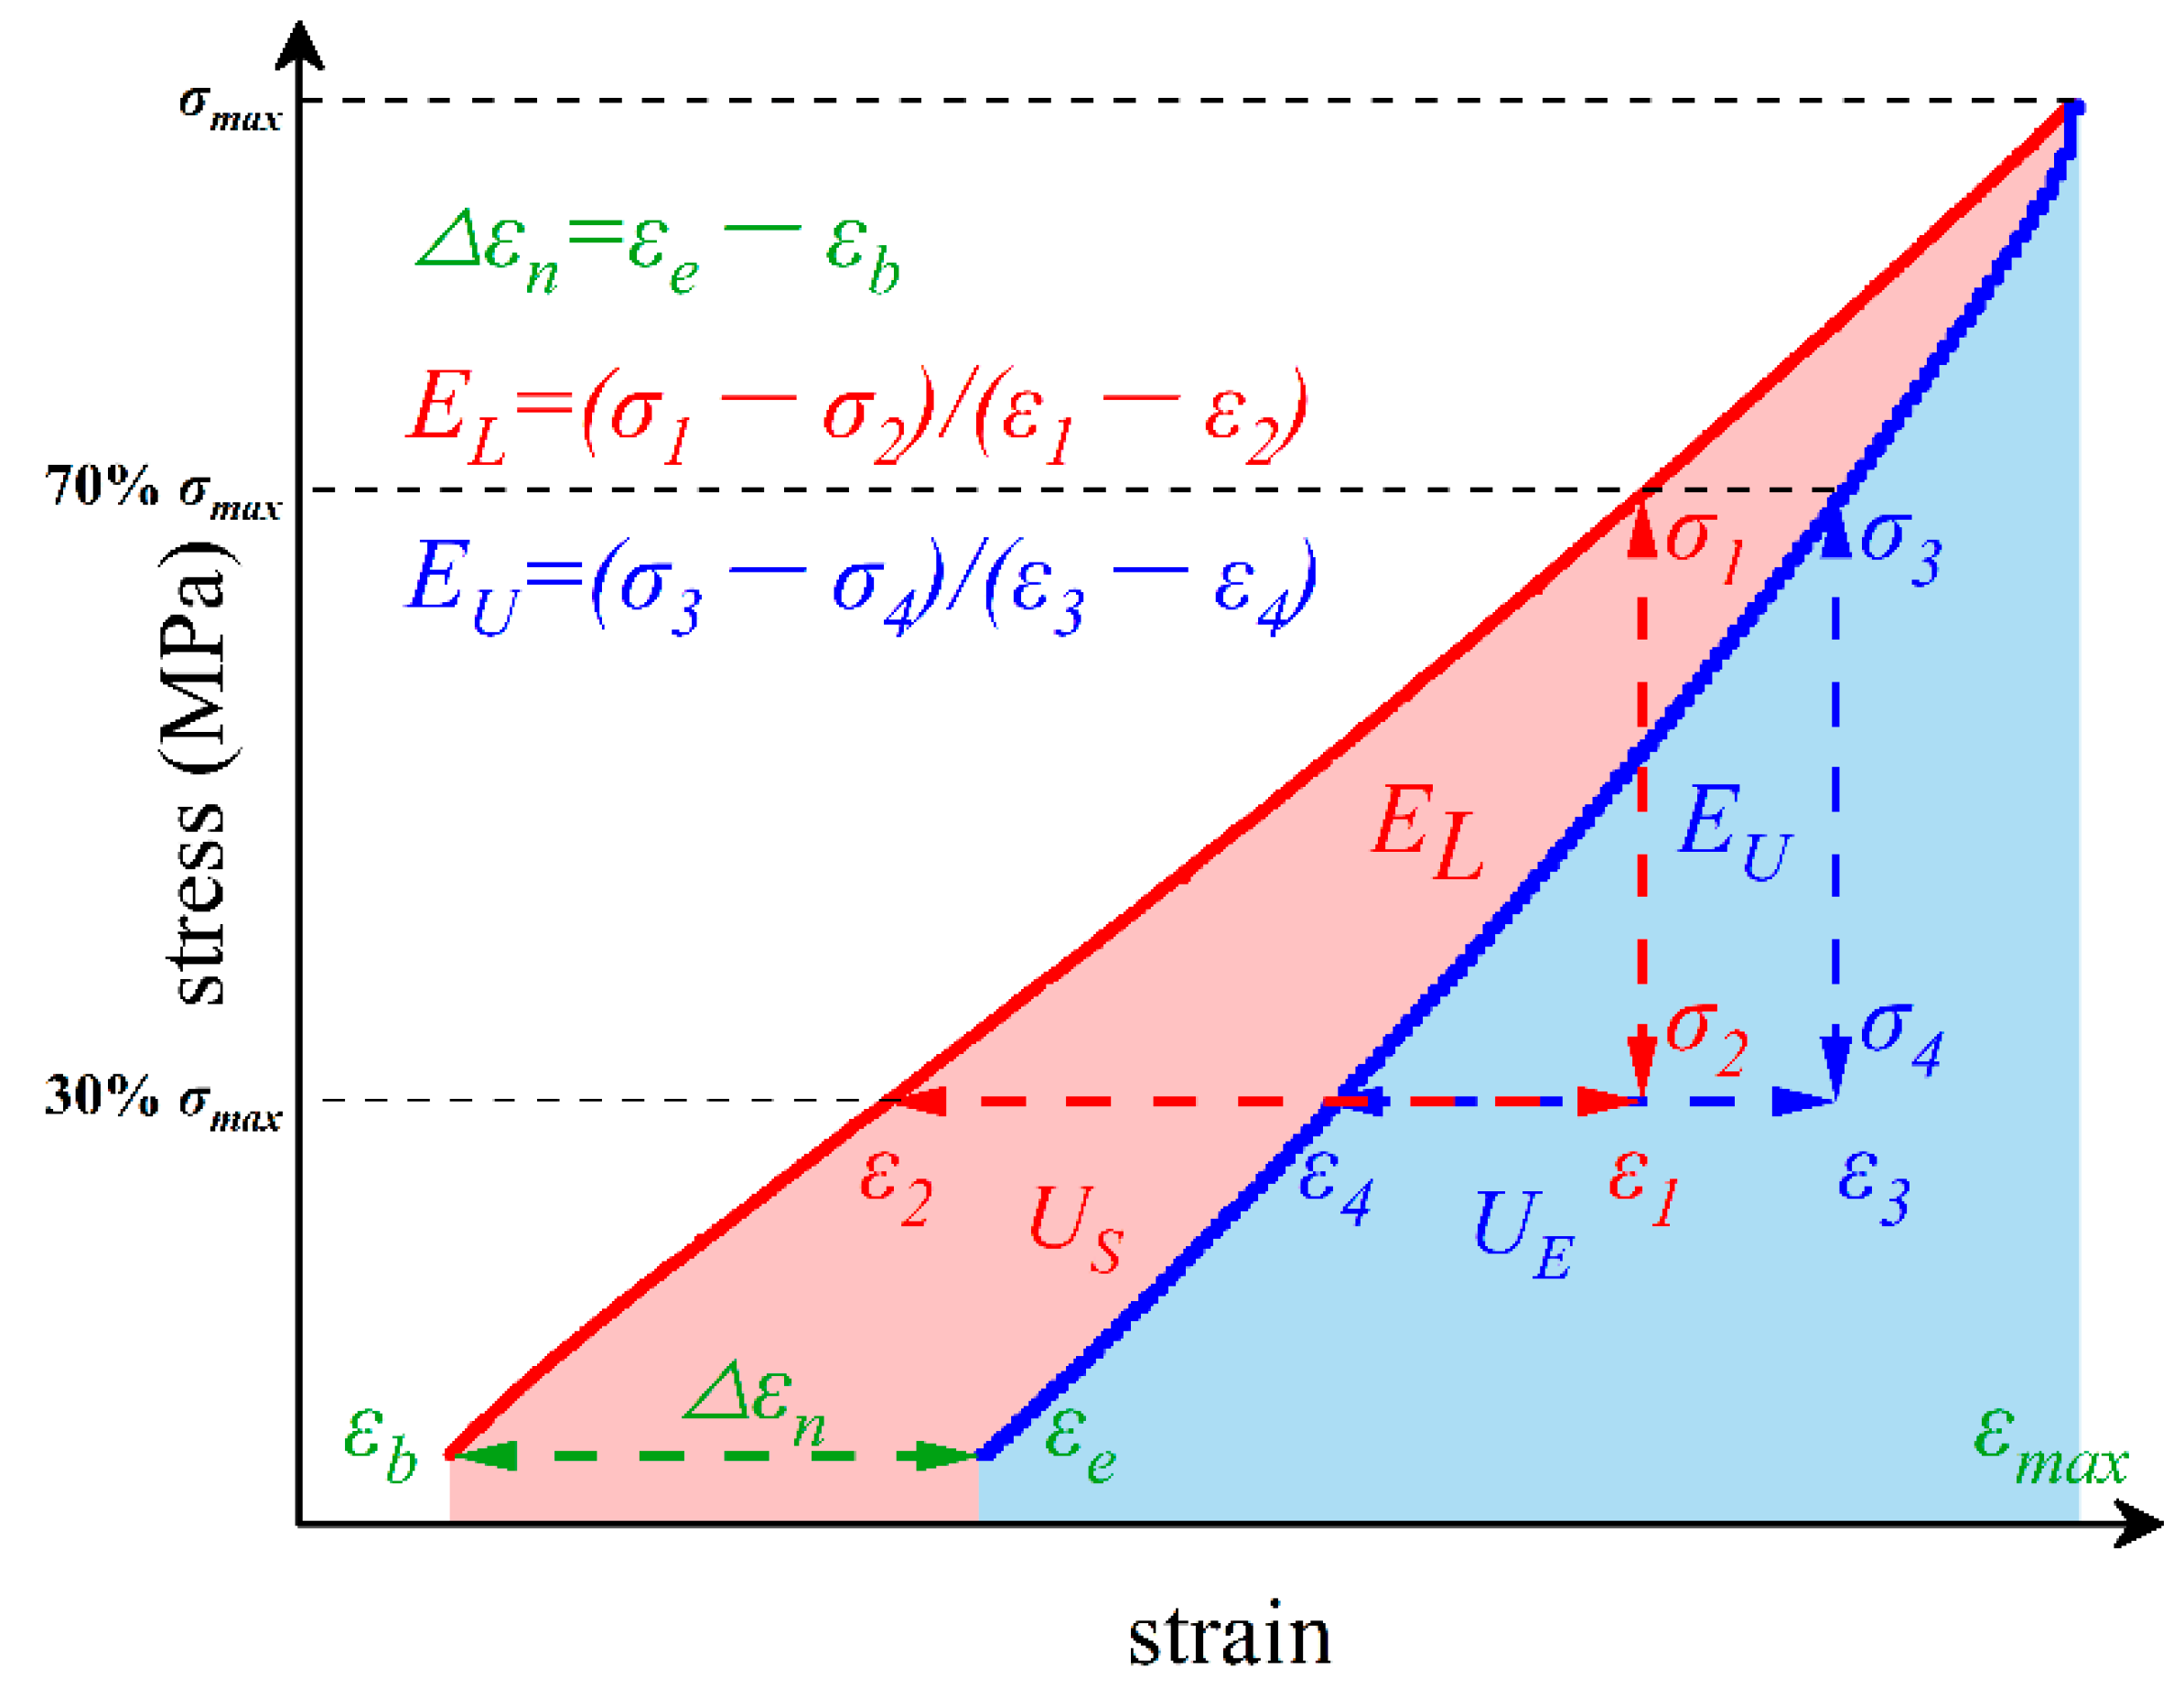
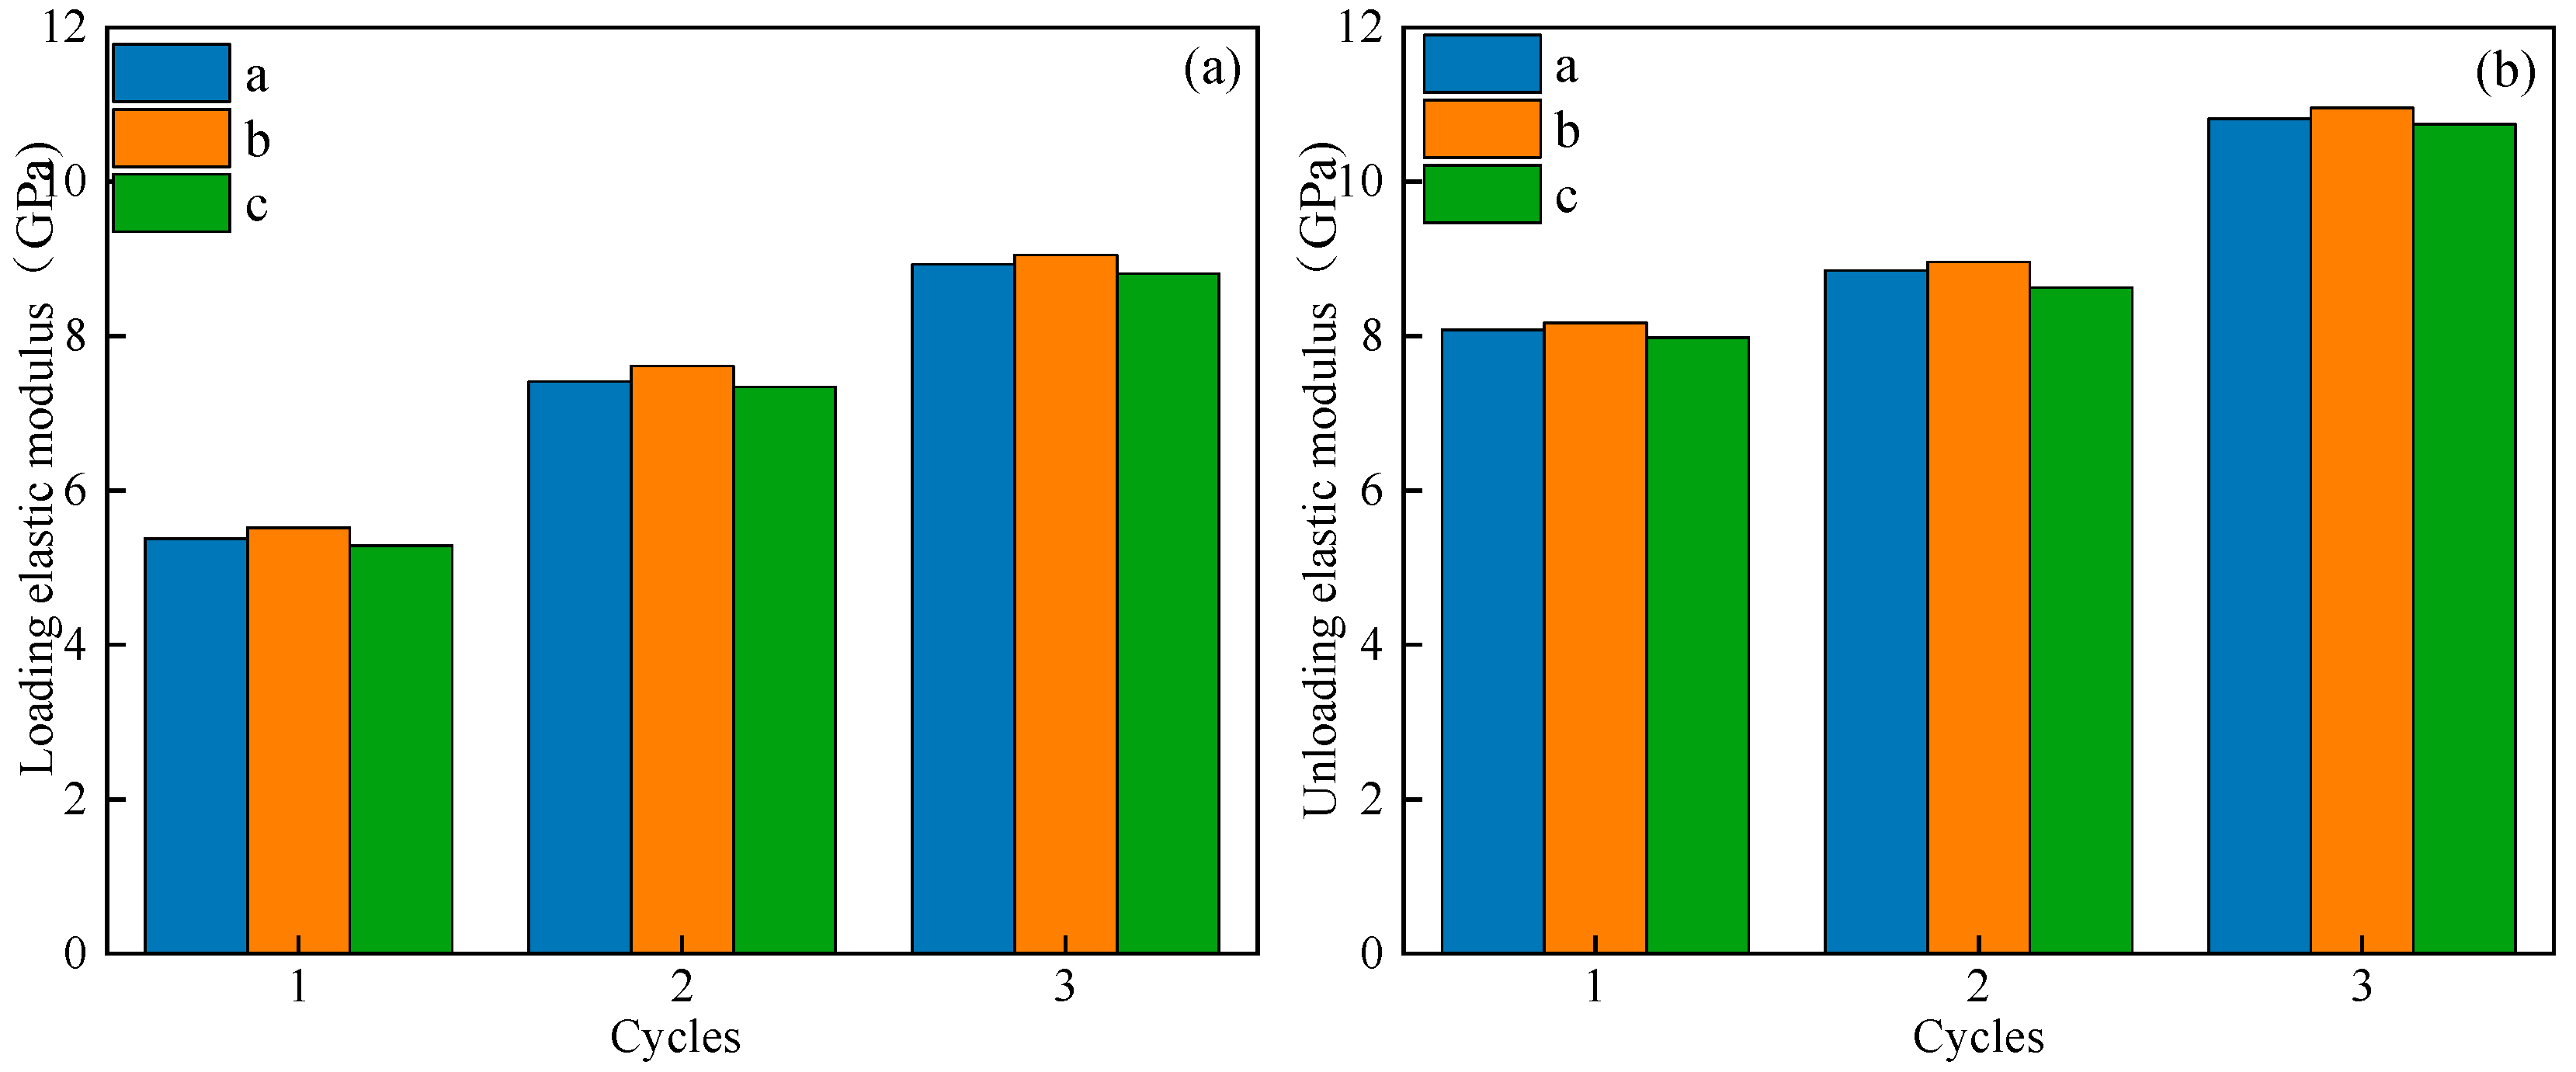
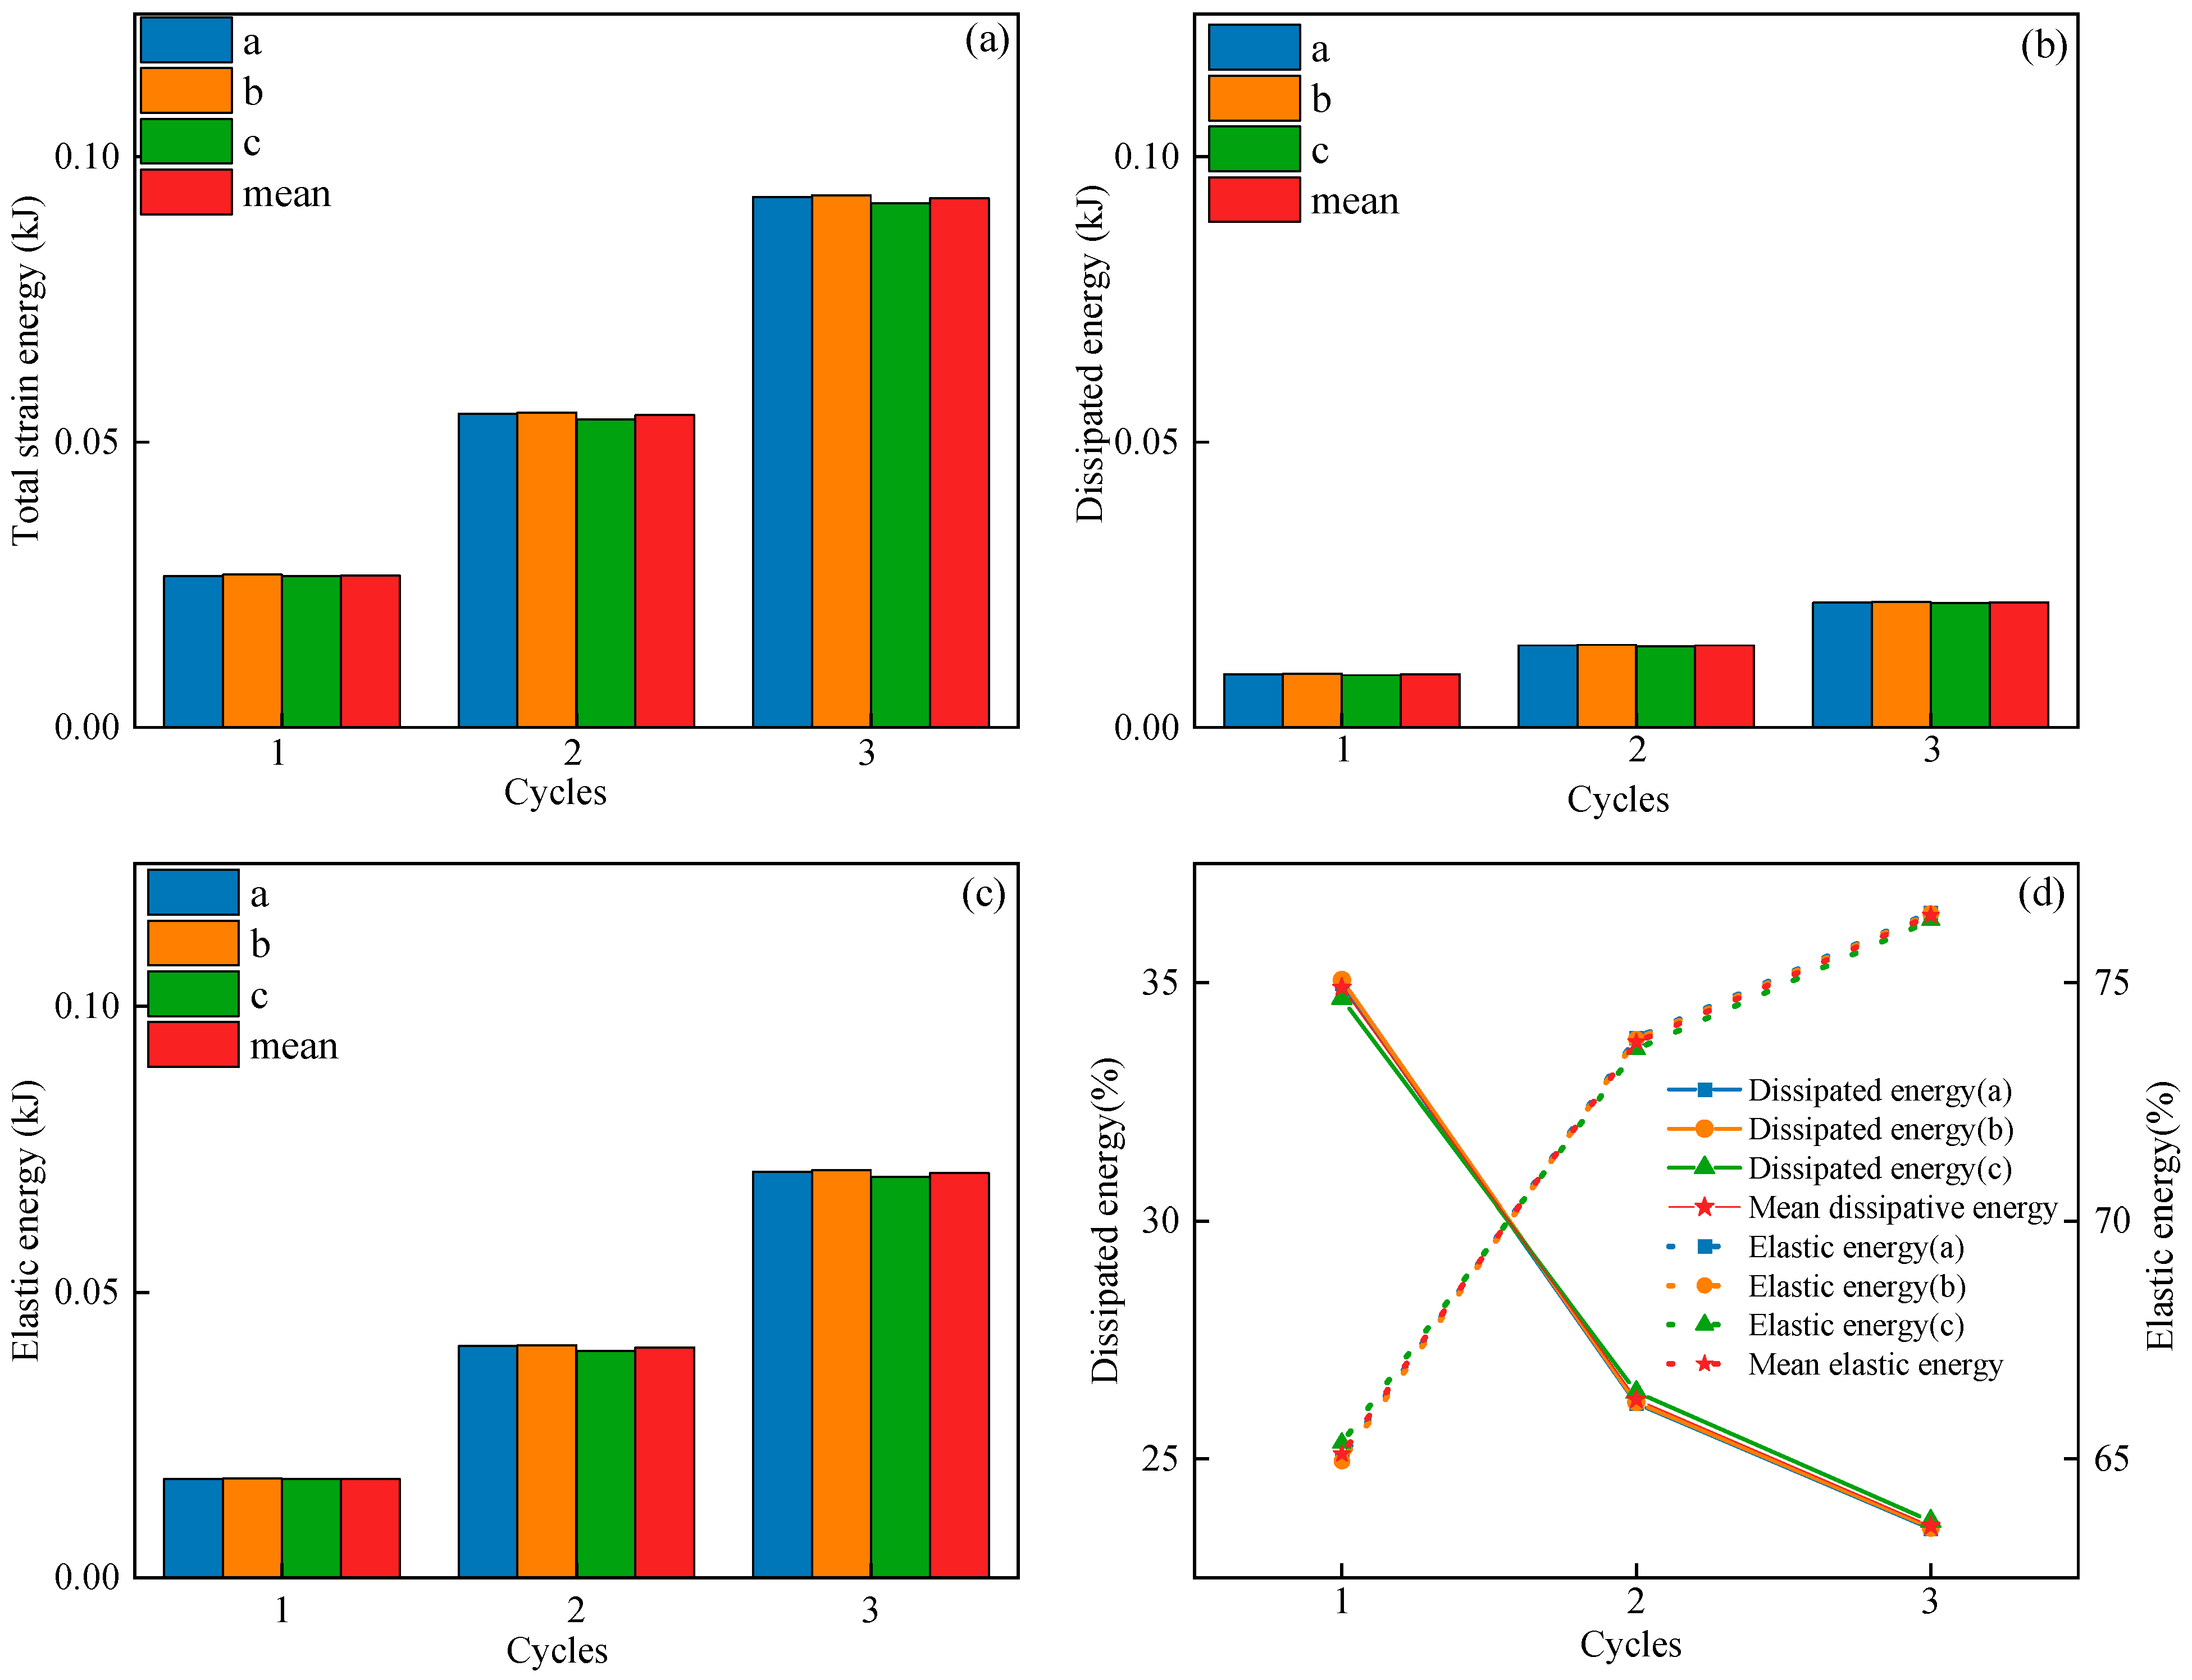
3.1. Mechanical Characteristics

The basic mechanical parameters of sandstone damage and failure under cyclic loading and unloading paths are shown in Table 2.
The table shows that the mechanical parameters of the three trials are comparable, indicating that the experiment is dependable, and the findings are accurate. In the three studies, the average peak stress of sandstone was 46.44 MPa, the peak strain was 0.0195, and the failure load was 116.10 kN. After reaching the peak stress, the sandstone samples were broken in the form of split damage mainly penetrating the sample and shear damage in some partial area.
The elastic modulus of sandstone determines its compressive strength and the formation of fractures in samples [29,30,31]. The elastic modulus of sandstone in the loading and unloading stages is computed in this study using the following formula:
E L = σ 1 σ 2 ε 1 ε 2
E U = σ 3 σ 4 ε 3 ε 4
E L and E U are elastic strains in the loading and unloading stages, respectively. σ 1 and σ 2 represent 70% stress and 30% stress in the loading stage, respectively; ε 1 and ε 2 are the strains corresponding to σ 1 and σ 2 , respectively; σ 3   and   σ 4 represent 70% stress and 30% stress in the unloading stage, respectively; and ε 3   and   ε 4 are the strains corresponding to σ 3   and   σ 4 , respectively.
Sandstone is a nonideal elastomer with some plasticity. The strain created during the loading stage and recovered during the unloading stage is referred to as elastic strain. The strain that cannot be recovered during the unloading step when the cracks and holes are compressed is referred to as residual strain (plastic strain) [29,30,31]. The residual strain and cumulative residual strain are calculated as:
Δ ε n = ε e ε b
ε n = 1 n Δ ε n
where ε e is the end strain at each unloading; ε b is the initial strain at each loading; Δ ε n is the residual strain; and ε n is the cumulative residual strain.
Under cyclic loading and unloading, sandstone degradation and failure is a progressive cumulative process accompanied by energy transfer and conversion. The analysis of energy evolution in this process is useful in revealing the damage and failure process [32,33,34,35]. As shown in Figure 3, the energies for sandstone deterioration and failure during cyclic loading and unloading are calculated as:
U = ε b ε m a x d ε
U E = ε e ε m a x d ε
U S = U U E
where U , U E , and U S are the total strain energy, elastic energy, and dissipation energy of coal samples, respectively; ε b and ε e are the minimum stress levels associated with the loading and unloading curves, respectively; and ε m a x is the strain associated with the maximum stress level.
The change in the loading and unloading elastic module under different cycles is shown in Figure 4. The average elastic modulus of sandstone in the loading and unloading stages increased as the number of cycles increases. The average elastic modulus during the loading and unloading stages of the sandstone during the first cycle was 5.40 GPa and 8.08 GPa, respectively. The average elastic modulus during the loading and unloading stages was 8.93 GPa and 10.04 GPa when the number of cycles was increased to three. The increases were 65.37 percent and 24.26 percent, respectively, with the loading stage increasing more than the unloading stage. The elastic modulus during the unloading stage was larger than that during the loading stage in the same cycle state. This is because the principal pores and fissures inside the rock are compressed early in the cyclic loading stage, and the unrecoverable deformation of the sandstone in the unloading stage causes the elastic modulus of the unloading stage to be larger than that of the loading stage. The difference between the elastic moduli at the unloading stage and the loading stage diminished constantly as the number of cycles increases, i.e., as the upper limit stress level increased. The elastic modulus increased with the number of cycles in the loading and unloading stage, indicating that the stress of elastic deformation of sandstone was larger, i.e., the stiffness of the sandstone was greater. The internal fracture was closed when loading, while the fractures rubbed with each other when unloading, which restricted the rebound deformation and contributed to the plastic failure to a certain extent. There is a close relation between the mature degree of internal cracks and the elastic module.
The changes in the total strain energy, dissipation energy, and elastic energy of sandstone at different cycle stages are shown in Figure 5. The total strain energy, dissipation energy, and elastic energy of coal samples varied significantly among cycles. The total strain energy, dissipation energy, and elastic energy of coal samples continuously rose as the number of cycles increased. The mean values of total strain energy, dissipation energy, and elastic energy in the first cycle were 0.0266, 0.0093, and 0.0173, respectively. The total strain energy, dissipation energy, and elastic energy of sandstone during the third cycle were 0.0927, 0.0219, and 0.0708, respectively. These values increased by 248.50 percent, 135.48 percent, and 309.25 percent, respectively, when compared to the first cycle.
The ratios of dissipation energy and elastic energy to total strain energy of sandstone varied dramatically throughout the cycles. The amount of dissipation energy decreased as the number of cycles increased, whereas the fraction of elastic energy grew. The proportions of dissipation energy and elastic energy of sandstone in the first cycle were 34.85 percent and 65.15 percent, respectively. The proportions of dissipation energy and elastic energy of sandstone in the third cycle were 23.60 percent and 76.40 percent, respectively. The dissipation energy ratio fell by 11.25 percent compared to the first cycle, but the elastic energy ratio increased by 11.25 percent. The strain energy was converted mostly into elastic energy, with some going into dissipation energy. The mechanical characteristics of sandstone were continually degraded due to the dissipation energy, and the elastic energy provided the surface energy necessary for crack initiation. When the elastic energy reached a particular amount, it was immediately released, promoting the rapid proliferation of micro-fissures and resulting in plastic deformation. The sandstone collapsed entirely and was ruined. It is clear that the dissipation energy reflects the degree of the sandstone damage, due to the micro-fracture surfaces. Every next cycle loading exacerbates the damage, and the energy is released in the form of dissipation.

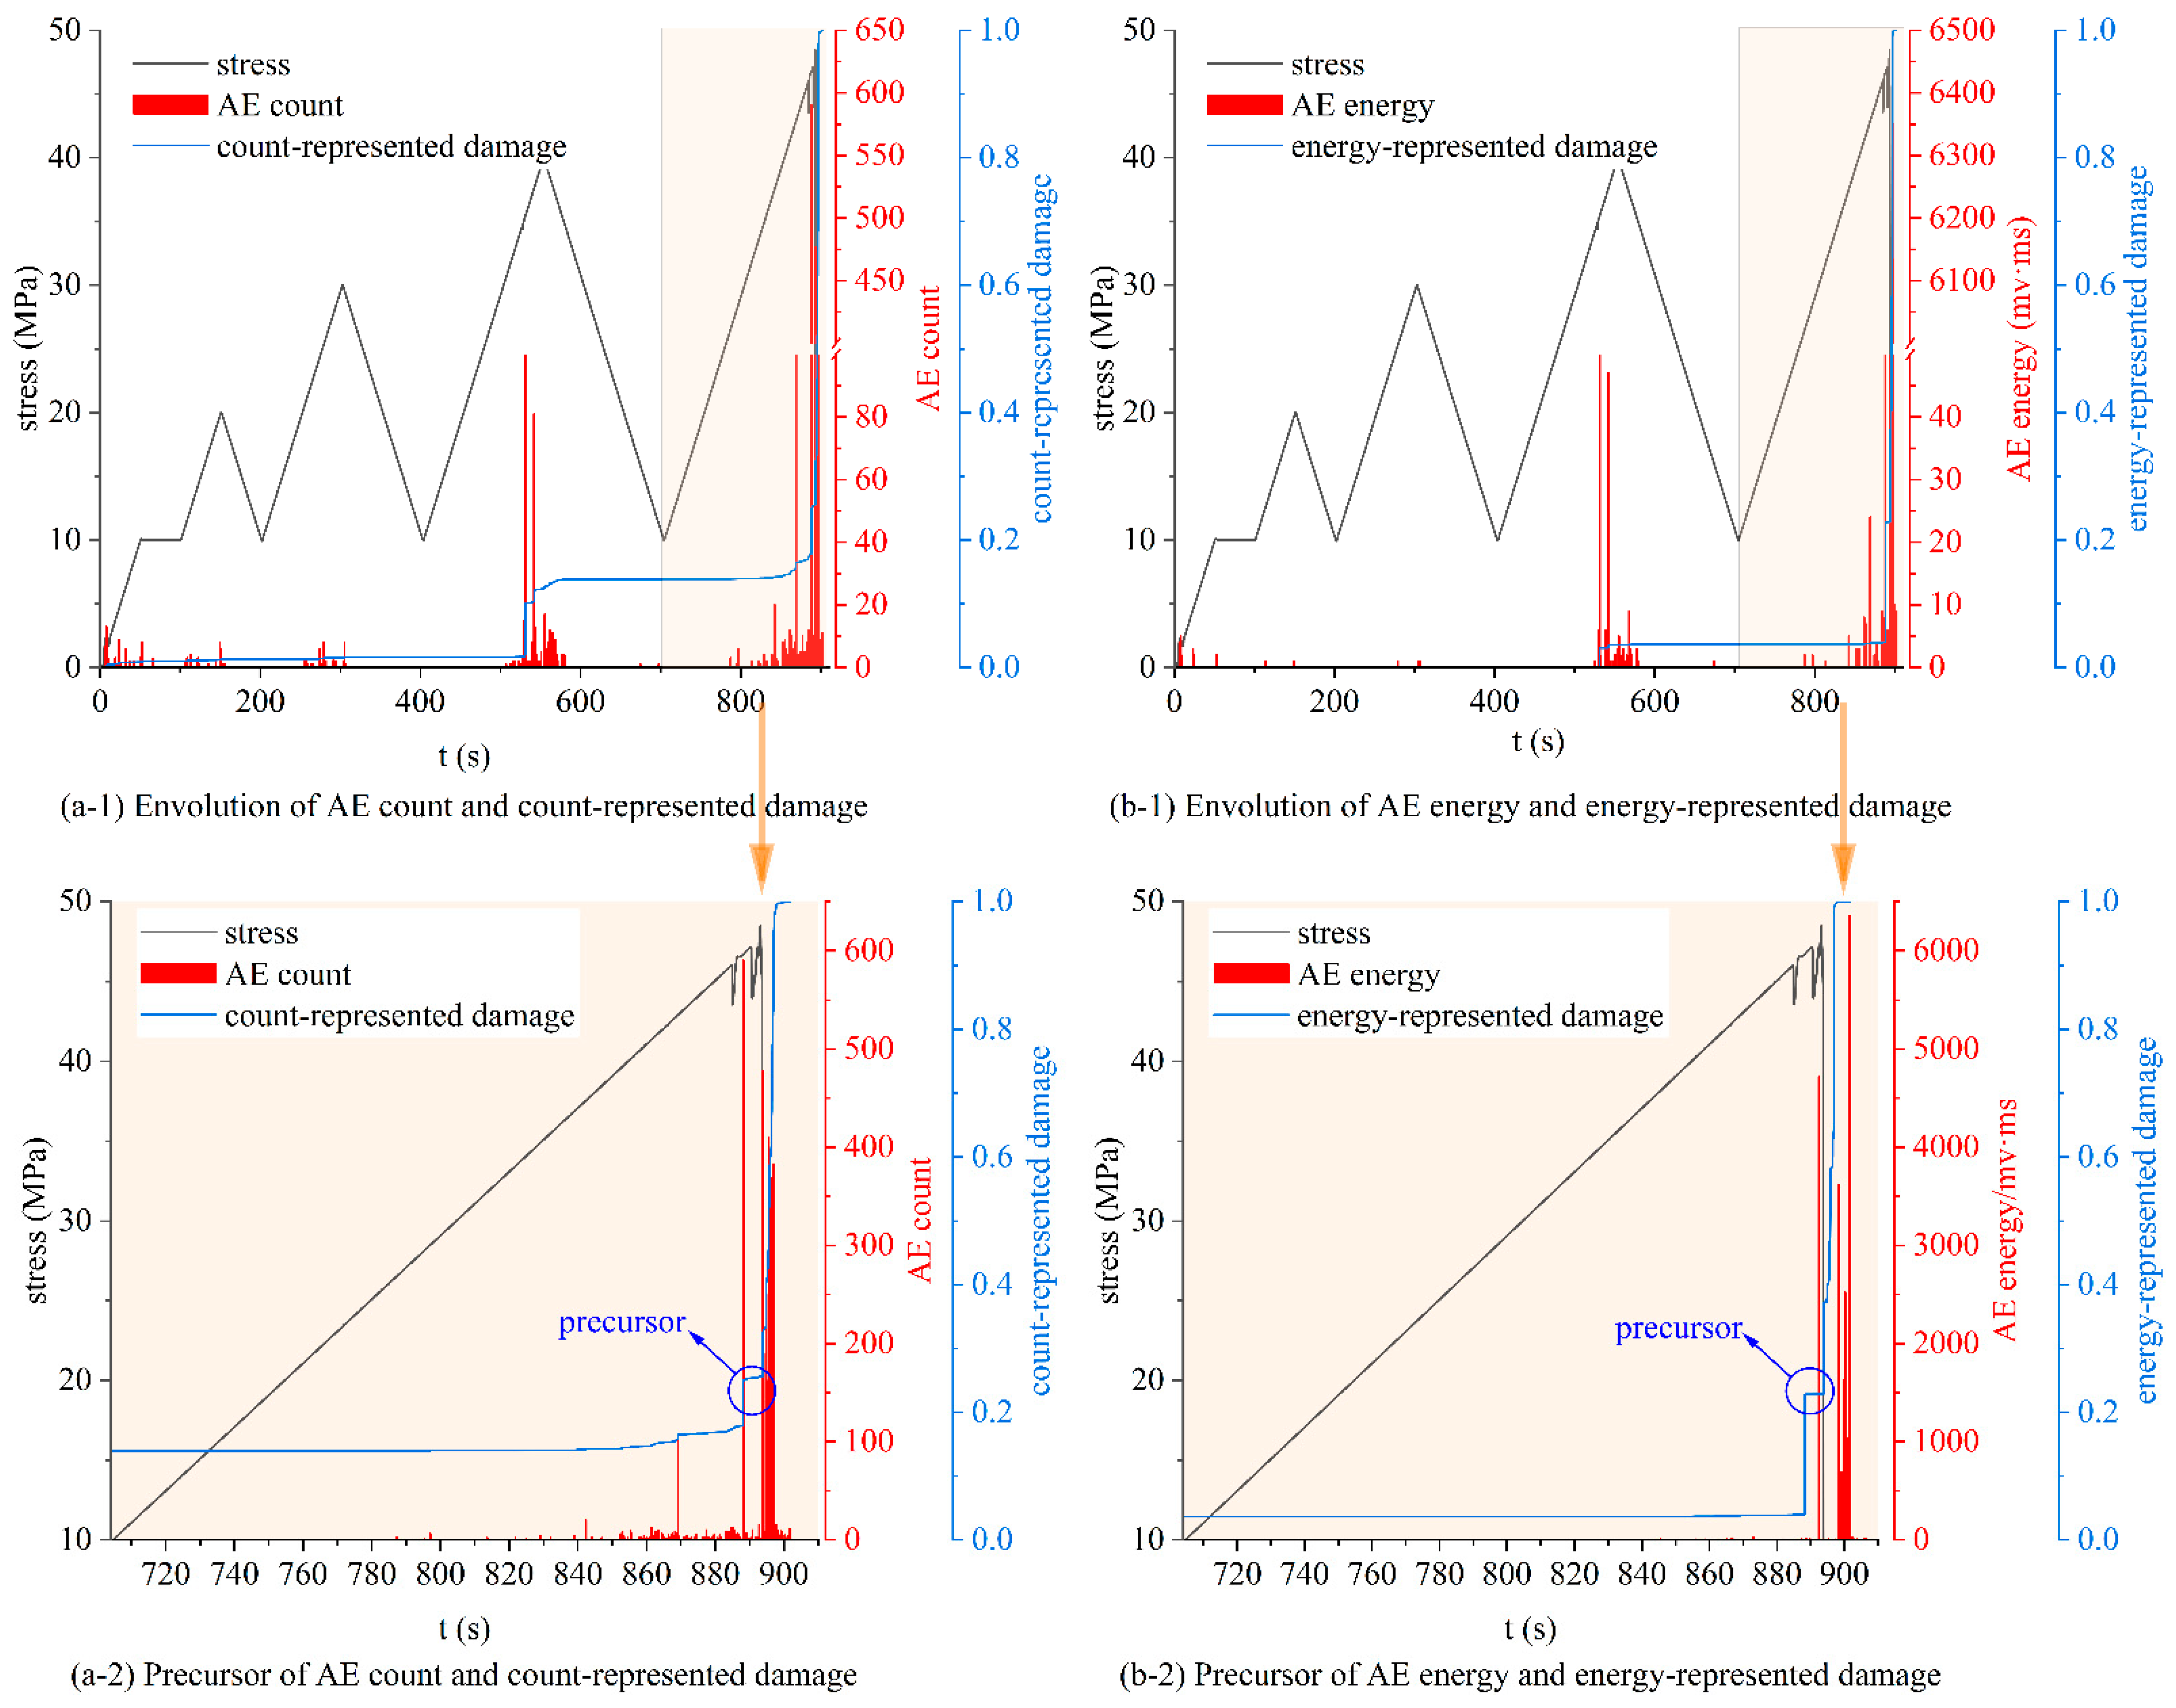
3.2. Characteristics of Damage and Instability Precursors

Many domestic and international researchers employ AE to monitor the fracture activity of coal and rock masses during the loading process. A long-term study revealed that the ringing count and energy of AE may accurately indicate the degree of damage to coal and rock masses [36,37,38,39,40]. Therefore, this paper mainly used the ringing count and cumulative energy to quantitatively describe the damage characteristics of sandstone during cyclic loading and unloading experiments.
The damage and failure of sandstone during cyclic loading and unloading obey a Weibull distribution [41,42], and the internal micro-element strength damage can be expressed as:
φ ε = m α ε m 1 exp ε m α
where ε is the strain value of sandstone during cyclic loading and unloading; m is a structural parameter suitable for sandstone; α is the sandstone sample parameter of the specimen; and φ ε is the time differential damage rate.
Kachanov [43,44] defines the damage variable as:
D = A d A
where A d is all the areas of microdefects on the bearing section and A   is the initial nondestructive area.
The relationship between the damage variable D and the microelement damage rate is as follows:
ϕ ε = d D   d ε
Through Formulas (9) and (10), the damage variable D is expressed as:
D = 0 ε φ x d x = 1 exp ε m α
When the cumulative AE ringing count and cumulative energy of the whole section area A of the nondestructive material are N 0 and E 0 , the cumulative AE ringing count N W and the cumulative energy E W of the unit area infinitesimal damage are:
N w = N 0 A
E w = E 0 A
When the damage area of the cross section is A d , the cumulative AE ringing count and energy are:
N d = N w A d = N 0 A A d
E d = E w A d = E 0 A A d
Thus, there are:
D N = N t N 0
D E = E t E 0
where N t is the cumulative rising count when the loading time is t; E t is the cumulative energy when the loading time is t; N 0 is the cumulative AE rise count when the sample is completely destroyed; E 0 is the cumulative energy when the specimen is completely destroyed; D N is the damage variable represented by the AE ringing count at time t; and D E is the damage variable represented by the AE energy at time t.
Figure 6 depicts the stress, AE ringing count, energy, damage, and duration of sandstone under cyclic loading and unloading. At the load beginning, the AE signal was in a relevant silent phase. The rock was at the compression stage of primary fracture and the elastic deformation stage in the early stages of the cyclic loading and unloading experiment, that is, during the first two loading and unloading cycles. In these two loading and unloading periods, there were fewer new fractures, and the AE activity of the rock was low, as seen in the low number and energy of ringing AEs. The maximum number of rings was only 12, and the maximum energy of AE was 5 mv·ms. The damage degree within the sandstone was likewise minimal, with D expressed by count of 0.014 and energy of 0.002. After the continued deterioration, there were generating more internal cracks, which were the source of acoustic emission. When the load surpassed the maximum stress of the previous cycle’s loading and unloading, the AE activity became strong, the ringing count grew dramatically, and the energy also greatly increased. This began with the third cyclic loading and unloading. The highest ringing count was 279, and the maximum AE energy was 590 mv·ms. The rock entered the steady microfracture development stage, during which a high number of microfractures were generated inside the sandstone and the damage degree of the sandstone steadily increased. The count and energy values for the rock damage D were 0.14 and 0.036, respectively. When the load reached the maximum stress of the first loading and unloading cycle, the AE activity became severe at the beginning of the fourth loading and unloading cycle. As the sandstone progressed into the unstable fracture growth stage, the maximum AE ringing count rose to 590, and the maximum AE rose to 6351 mv·ms. In a relatively short period of time, the damage amount D of sandstone, which was measured in terms of counts and energy, went from 0.14 and 0.039, respectively, of the previous time to 1, indicating that the sandstone achieved its maximum strength, and that the specimen was damaged. The coal rock fracture process was accelerated by the influence of cyclic loading and unloading, and the collected AE energy was rapidly released during the fracture process. Higher AE ringing counts and energy arose in the middle of the coal and rock mass loading stage; however, the two were generally quiet in the unloading stage. In the pre-peak stress stage, there was a long-lasting high value ringing count signal, and the AE early warning of the coal rock fracture process was quite clear.
Figure 6(a-2,b-2) shows a local magnification of the unstable stage of the formation of rock fractures, or the fourth cyclic loading and unloading phase, to evaluate the precursor features of rock instability more clearly. The features of the rock damage described by the AE ringing count and energy are extremely comparable. The two damage characterization approaches have one thing in common: the first loading phase is marked by a protracted period of silence. The damage values will gradually rise when the load exceeds the maximum value of the loading and unloading stress of the preceding cycle in both the stable microfracture development stage and the unstable fracture development stage. In the whole loading and unloading cycle, heterogeneity refers to the damage sent by energy. At each level, the damage value represented by energy is often lower than the damage value represented by the ringing count. Figure 6 illustrates how the damage values of the two characterization methods rose gradually, followed by a brief period of calmness before rock instability and failure. As the load increased, however, the damage curve became steeper, the stress curve exhibited frequent stress drops, and the number of AE rings also rose significantly. When the precursor happens, the sandstone enters into the stage of accelerating failure. The aforementioned traits can be employed as sandstone failure and instability precursors, and they offer some theoretical context for associated engineering rock mass catastrophe warning.

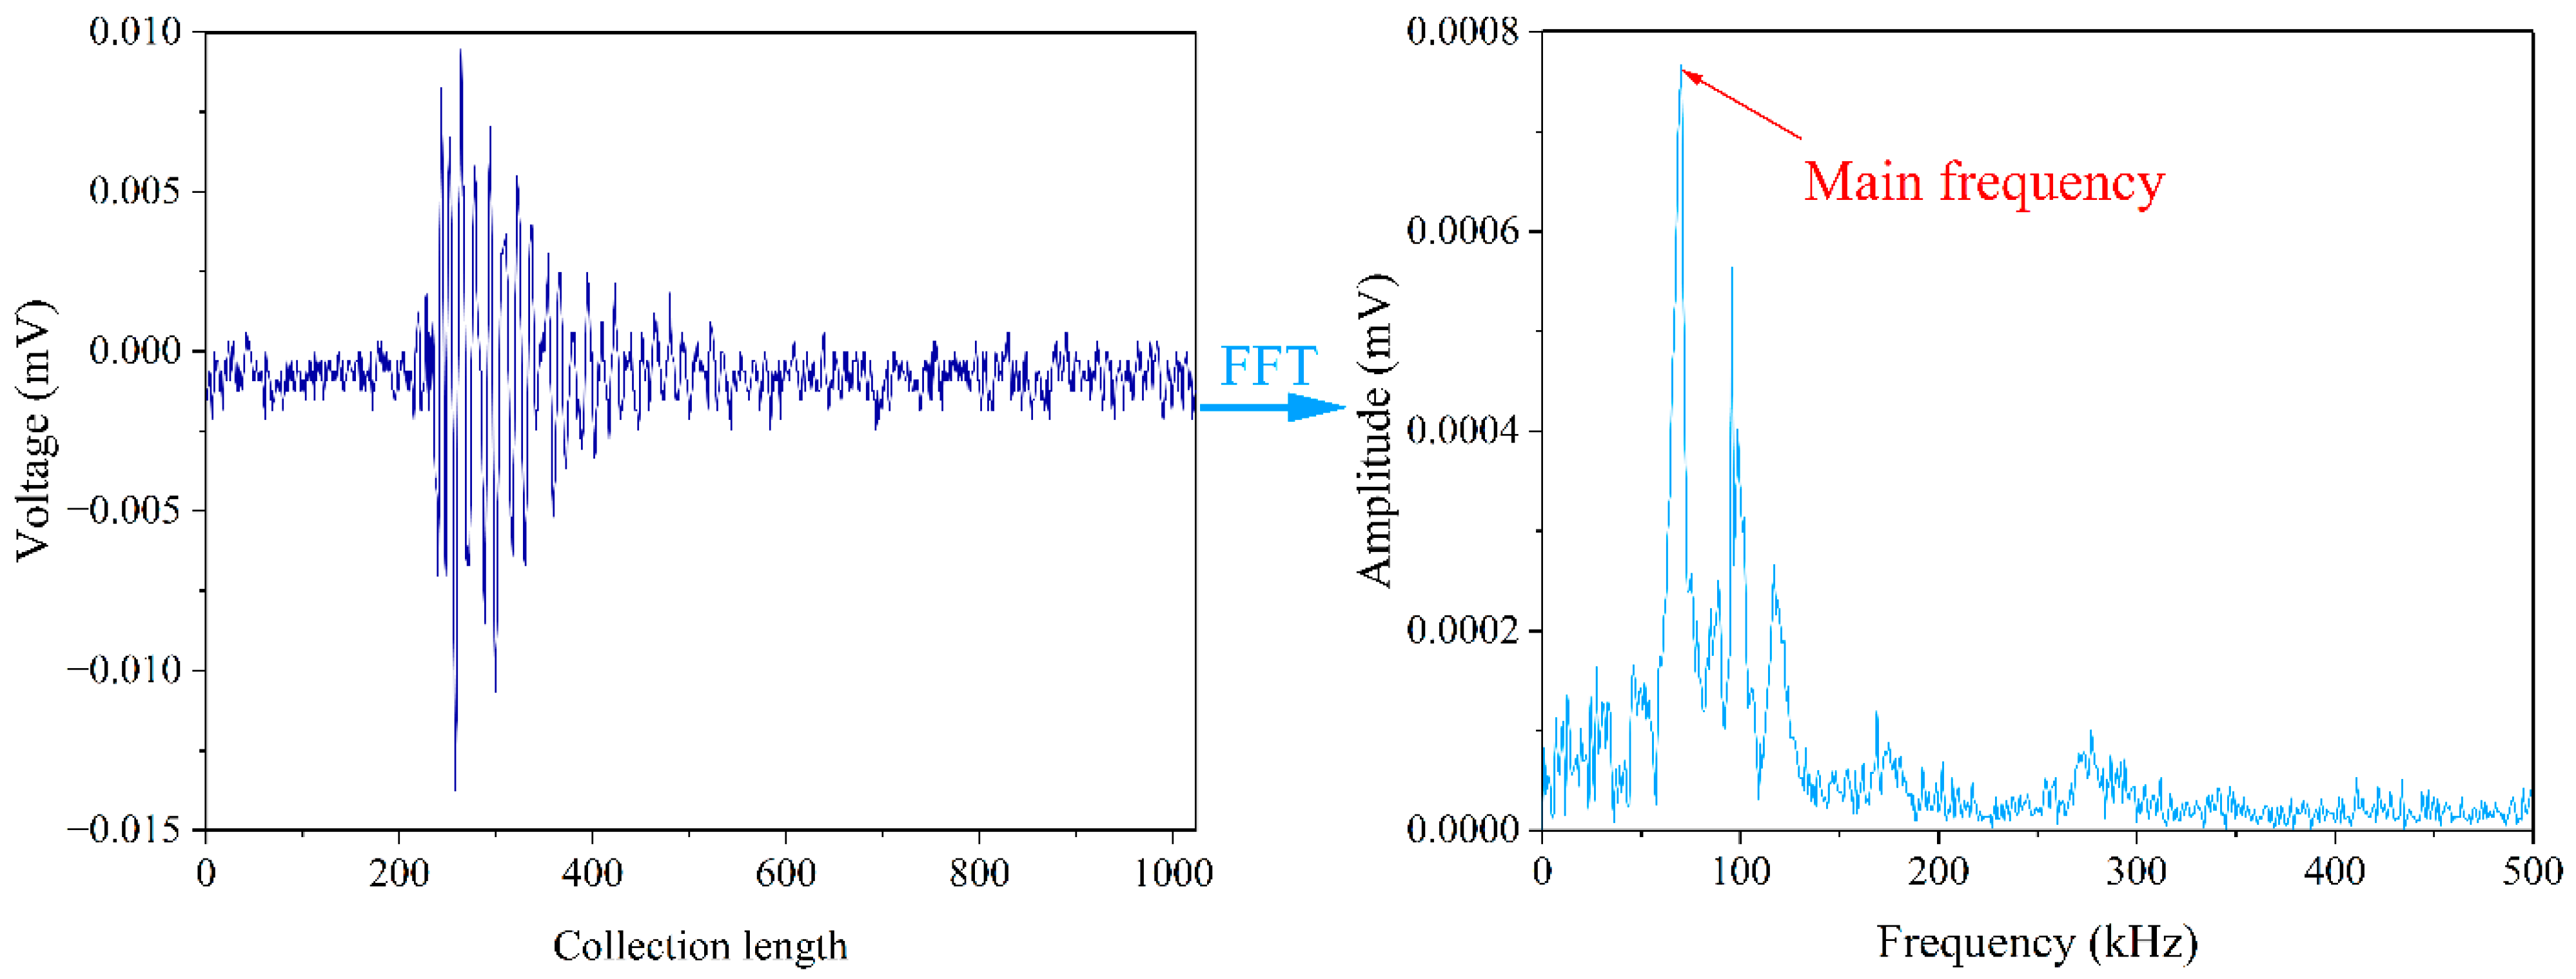
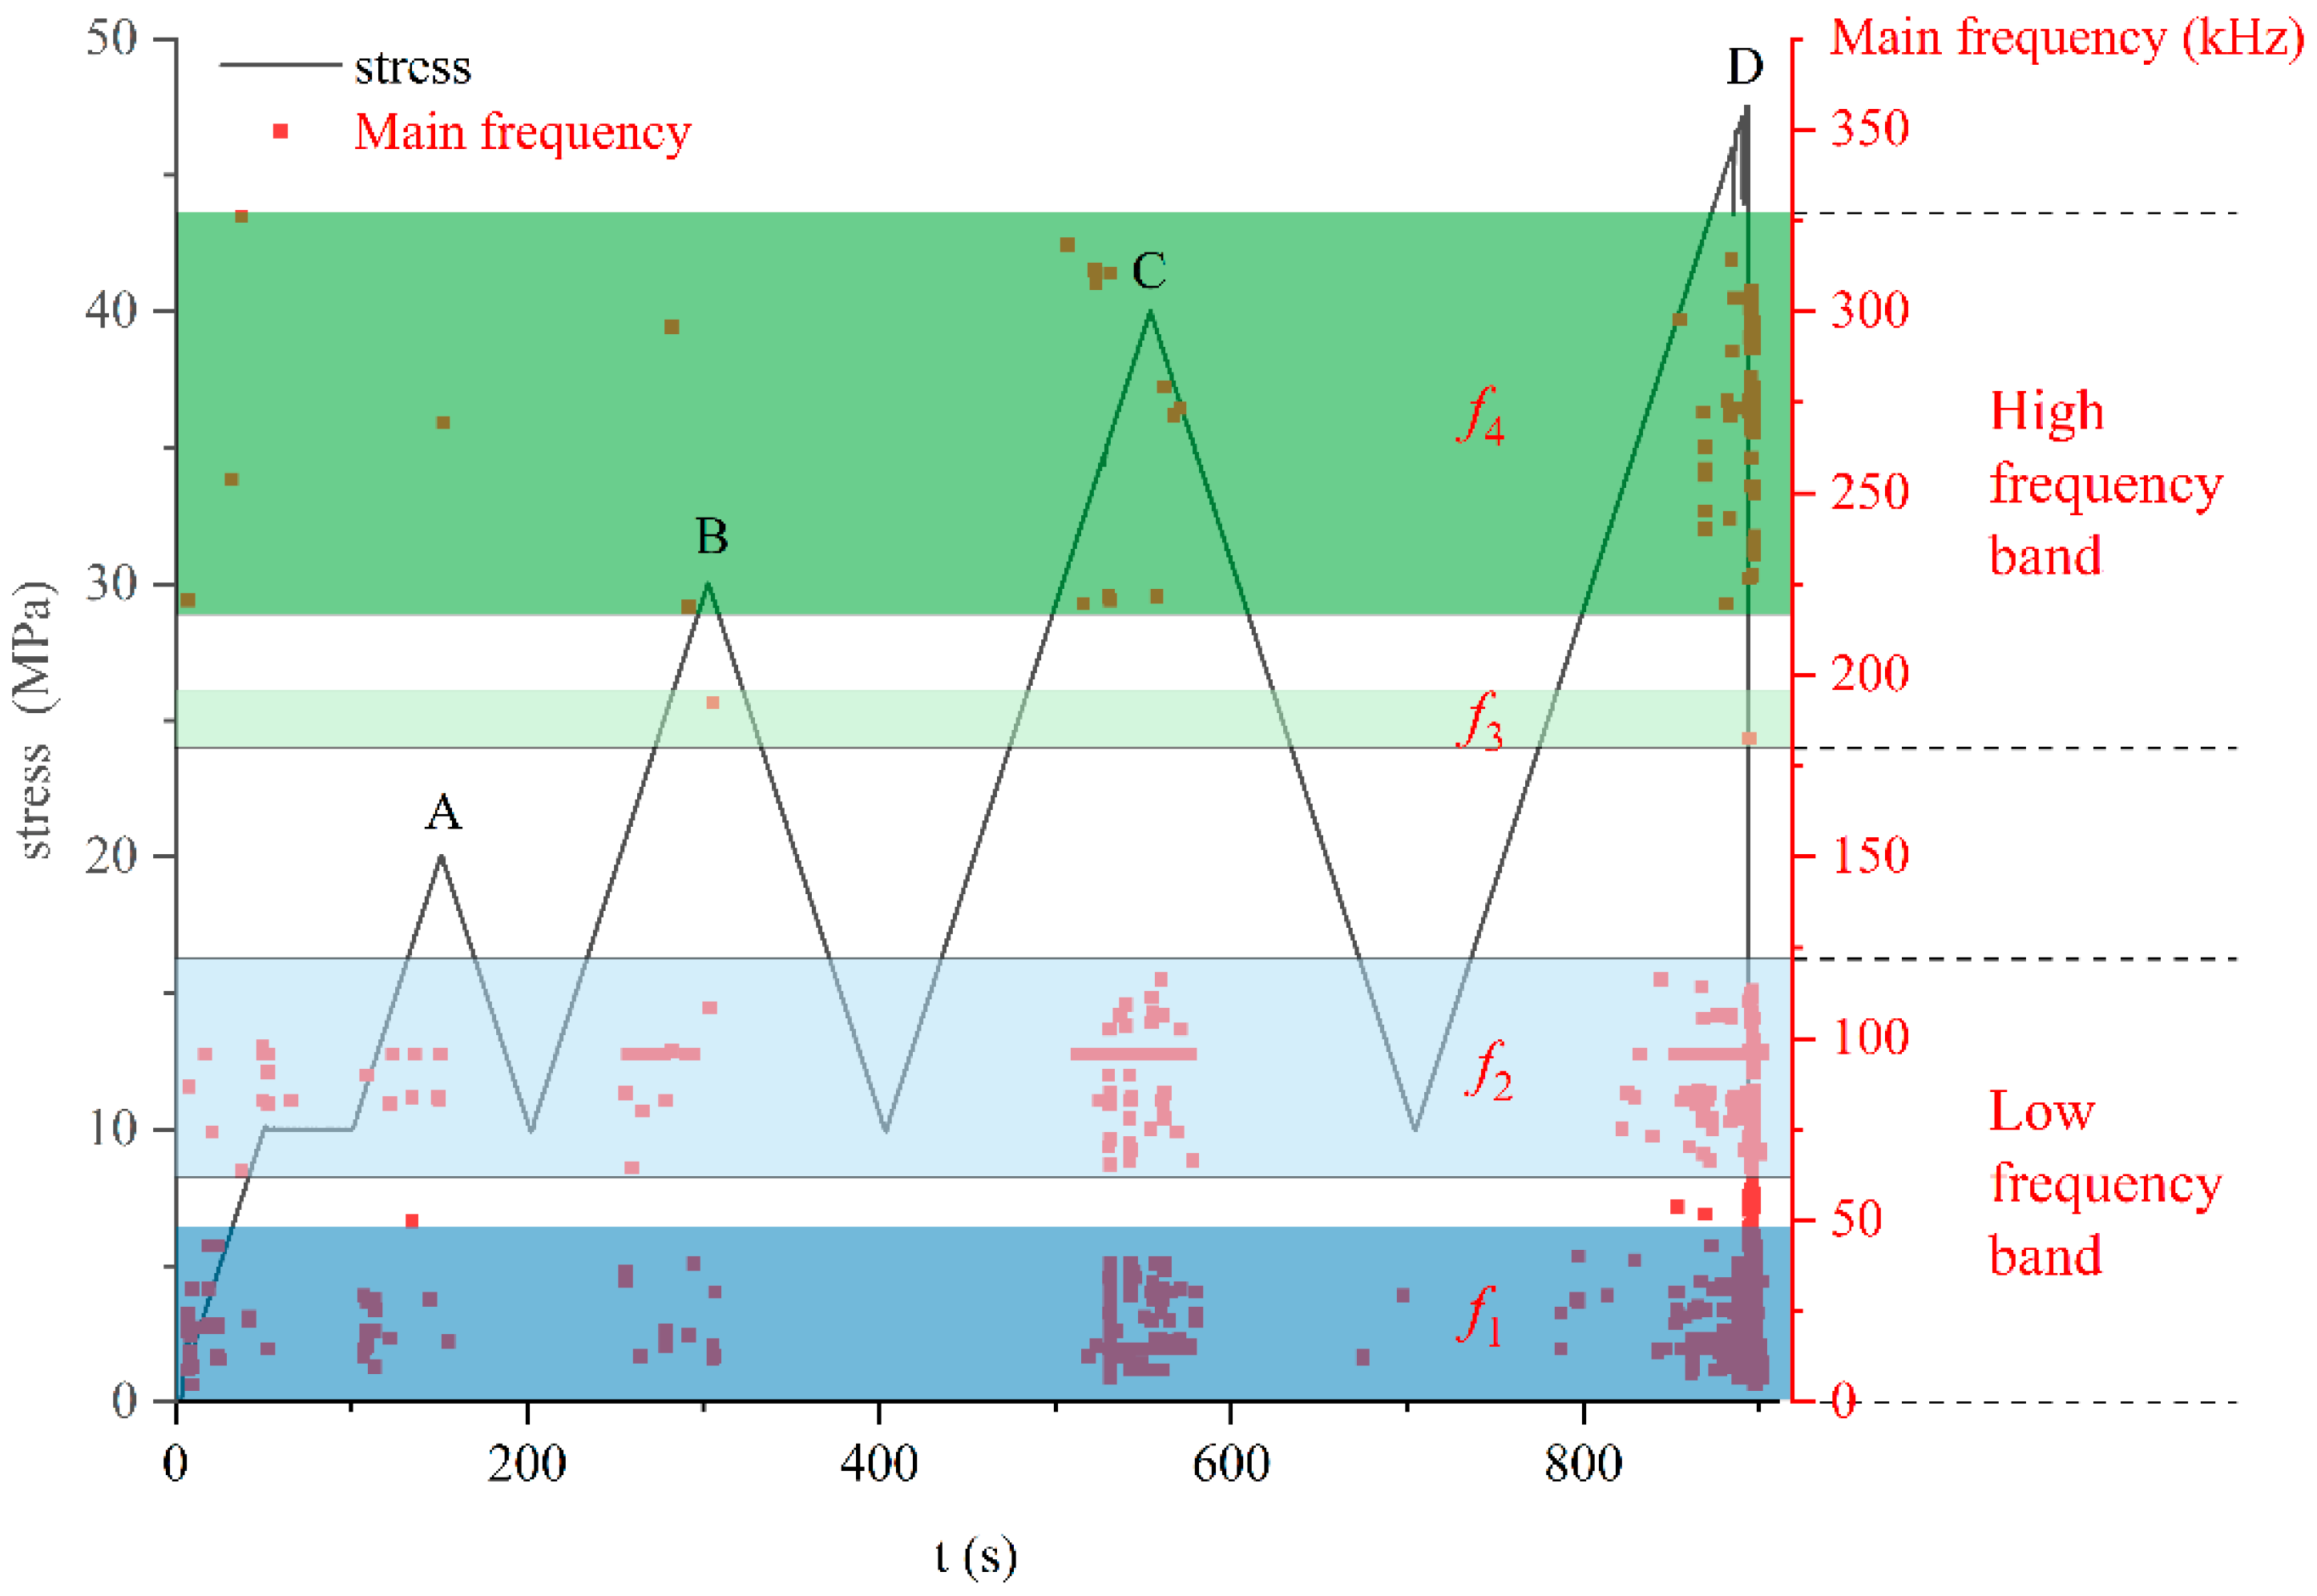
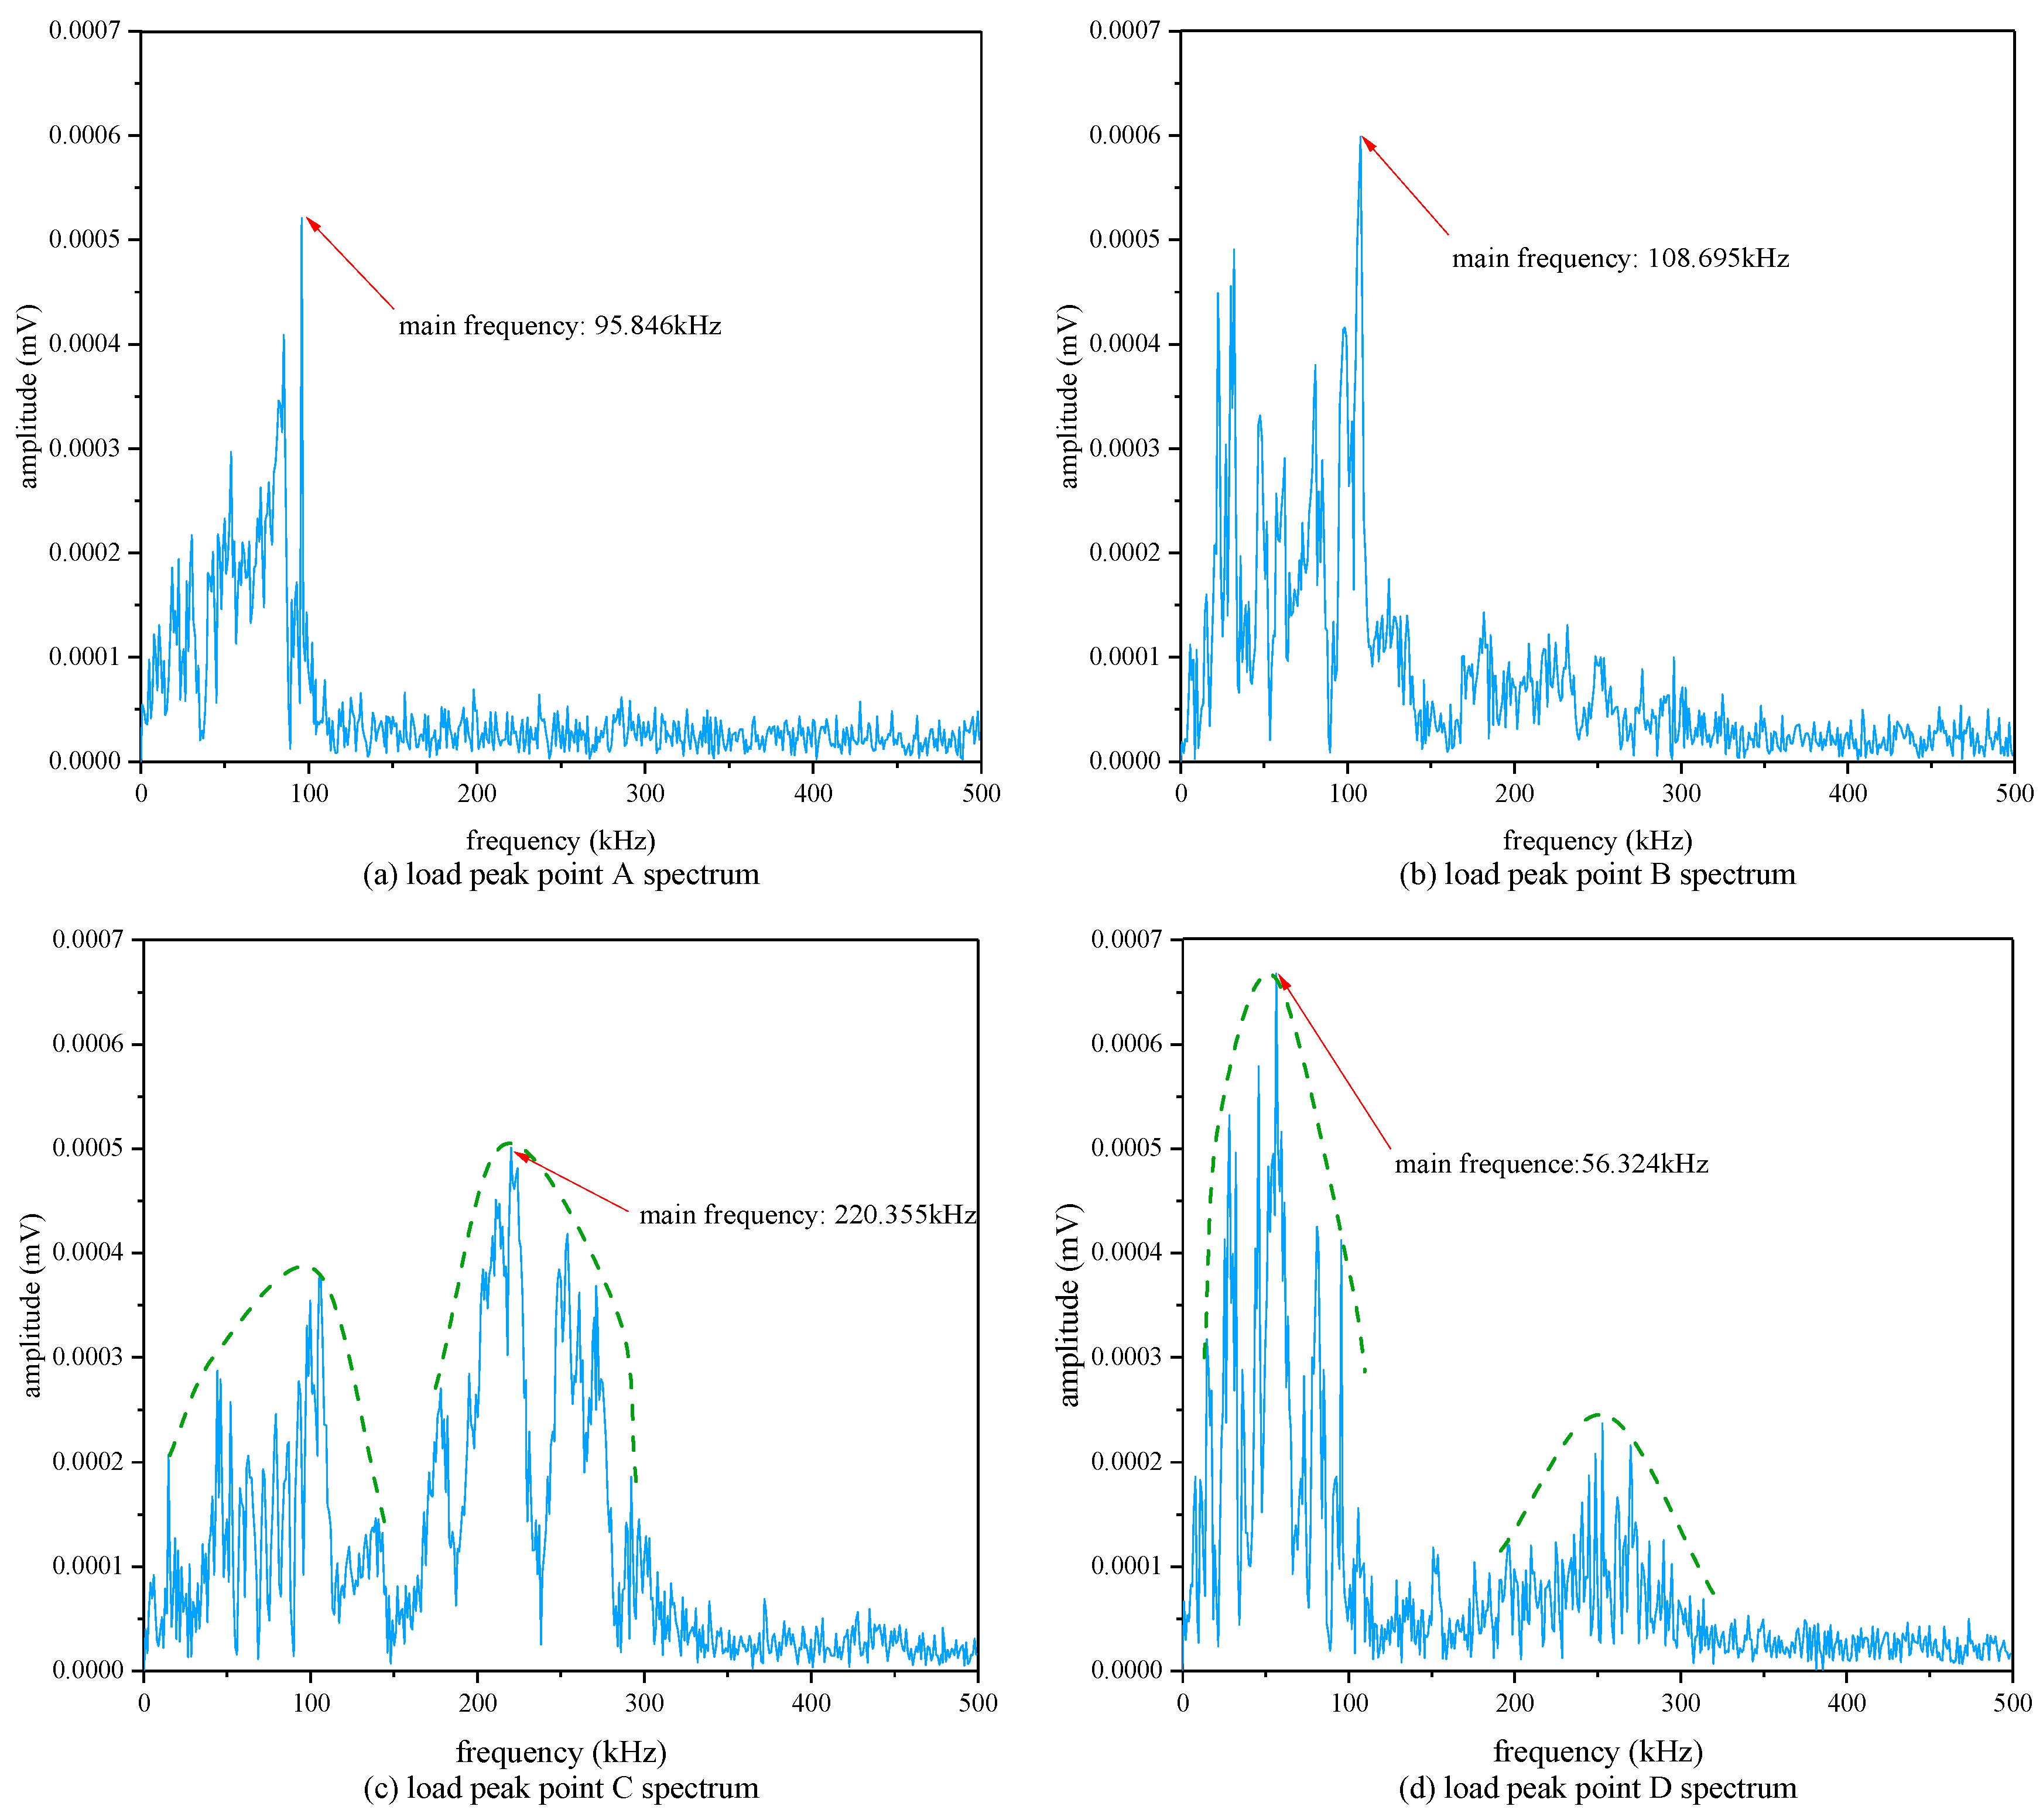
3.3. Distribution of the Failure Instability Precursor Features in the Frequency Domain of AE

The AE signal is unpredictable and nonstationary, and not all the signal information can be found in a time-domain parameter analysis. The spectrum of various frequency bands is split into the components of the AE signal. The properties that are challenging to observe in the time domain can be efficiently analyzed using spectral analysis [45,46,47].
It is straightforward and rapid to process the AE waveform signal using fast Fourier spectrum analysis (FFT), which transforms the frequency domain of the AE signal [48,49]. The evolution of the amplitude and frequency of the AE signal can be clearly obtained, and the spectral characteristics of the AE signal can be well reflected, as shown in Figure 7 (the frequency corresponding to the peak amplitude in the spectrum is defined as the main frequency of the waveform signal). The AE waveform signal is altered using the fast DFT technique (FFT), calculated as follows:
X k = j = 1 N x j ω N j 1 k 1
where X j is the data column for spectrum analysis, and N is the number of frequency points, ω N = e 2 π i / N .
Each waveform file had 1024 points in it. The fast Fourier transform (FFT) of each AE waveform signal was programmed using MATLAB software in loading and unloading cycles. The resulting two-dimensional spectrum of each waveform signal was then obtained, and the primary frequency was retrieved [50,51,52]. The major frequencies of each waveform are shown in a time-main frequency diagram in chronological order in Figure 8 to make it easier to analyze rock damage and failure features using the frequency domain data.
The sandstone samples were selected and cut down from the homogeneous bed rock. During the experiment, no initial crack and insert of other rock layers was found in the sample. Figure 8 shows the four primary frequency bands that make up the AE waveform signal: f1 (0–50 kHz), f2 (75–125 kHz), f3 (175–200 kHz), and f4 (220–325 kHz). There is a negative relation between the AE signal frequency changes and the size of maturing cracks, especially the little size fracture which can generate the high frequent AE signal. The fracture event and AE frequency were increasing when loading, whereas the deformation and frequency were decreasing when unloading. The low frequency bands f1 and f2, and the high frequency band f4, are where the majority of the AE signals emerged during the first loading period. In contrast to the first two stages of initial loading, the low-frequency bands f1 and f2 and the high-frequency band f4 were still present in the steady microfracture growth stage, but the high-frequency band f3 also appeared and there were more AE signals in the three frequency bands. There were dense regions in the low-frequency bands, f1 and f2. This suggests that both large and tiny rock fractures—particularly major ones—increase throughout this time. The low-frequency bands f1 and f2 and high-frequency band f4 occurred in more concentrated regions than in the previous three phases of rock fracture formation, and the three frequency bands were continually enlarged. The frequency bands f1 and f2 increasingly converged, and the primary frequency of the signal exhibited abnormally low and high values, indicating that the rock was about to disintegrate and become unstable. The frequency domain features can be utilized to identify rock instability in advance. The tensile and shear microfracture properties of the rock are reflected in the primary frequency band. Microtensile fractures are represented by the low main frequency band, whereas microshear fractures are represented by the high main frequency band. Sandstone mostly develops shear fractures as a result of repetitive loading and unloading. Tensile cracks primarily appear at the prepeak stage of stress as time goes on, whereas shear fractures continue to grow in the early stage.
The frequency and amplitude of AE signals at the highest load of each loading and unloading cycle were extracted and are depicted in Figure 9 to help assess the frequency domain features of rock in various loading stages [53,54,55]. Figure 9a demonstrates that the waveform characteristics of the initial loading peak A point were mostly low frequency, high amplitude, high frequency, and low amplitude. At point B of the second loading peak, the spectrum moved to high frequency overall relative to point A, and the amplitude of the high frequency band somewhat increased from 150 kHz to 300 kHz. Previous research has shown that low frequency is correlated with large cracks, whereas high frequency is correlated with minor cracks. In the second loading step, rock specimens formed tiny fissures and showed the characteristic coexistence of high and low frequencies. The spectrum exhibited a multipeak form and complicated spectral features at point C of the third loading peak, and there was a noticeable rise in the primary frequency. The amplitude of the high-frequency band, 150 kHz to 300 kHz, was quite high. The amplitude in the low frequency band was also at a high level, even though it was typically lower than that in the high frequency band. This shows that the internal damage to the rock was severe and that numerous large and tiny cracks emerged at this point. The low-frequency amplitude in the spectrum was often at a high level at point D of the fourth loading peak, whereas the high-frequency signal weakened and had a low amplitude. The multipeak phenomena were diminished, and the primary frequency returned to 56.324 kHz, indicating that the rock was primarily forming large low-frequency cracks. After several cycles of loading and unloading, the rock suffered severe internal damage. Numerous cracks widened and condensed as the stress level rose, resulting in macroscopic collapse of the rock.

4. Conclusions

The cyclic loading and unloading tests of sandstone samples were carried out to monitor the evolution of the failure and AE response. The mechanical properties and AE frequency were used to quantify the sandstone damage characteristics and the precursor features of sandstone instability and failure. With the increasing cycles, there were maturing micro-fractures in the sandstone that were deteriorating the compression strength and bearing capacity. The AE precursor happened just before reaching the strength peak, and then the large crack penetrated the specimen, and failure mode is dominated by the splitting failure. The following are the primary conclusions:
The loading and unloading modulus increased constantly as the number of cycles, namely the upper limit stress level, increased. The unloading modulus was larger than the loading modulus, and the gap between the two continually narrowed. The proportion of dissipation energy decreased while the proportion of total strain energy, dissipation energy, and elastic energy increased.
The sandstone damage degree D increased rapidly in a short period as the loading cycle increased. The damage variable symbolized by the ringing count was more sensitive than by the energy. The ringing count increased dramatically prior to rock collapse, as did the energy value, and the damage curve climbed quickly. The time domain analysis features can be utilized to predict sandstone failure and instability.
AE waveform signals exhibited evident aggregation features in the four main frequency bands, which became wider before rock failure, and the main frequency of the signal appeared abnormally low and high. The amplitude of the low-frequency signal was generally at a high level, and vice versa. The multipeak phenomenon weakened. The frequency domain analysis features can be utilized to predict sandstone instability.

Author Contributions

Conceptualization, Y.W. and C.D.; methodology, Z.D.; software, F.H.; validation, X.F., D.W. and Q.H.; formal analysis, X.Z.; investigation, Y.W.; resources, C.D.; data curation, Z.D.; writing—original draft preparation, F.H.; writing—review and editing, X.F.; visualization, Q.H.; supervision, X.Z.; project administration, Z.D.; funding acquisition, X.F. All authors have read and agreed to the published version of the manuscript.

Funding

This research was funded by the National Natural Science Foundation of China (51934007, 51634001, 52004267) and China Postdoctoral Science Foundation (2020M672235).

Institutional Review Board Statement

Not applicable.

Informed Consent Statement

Not applicable.

Data Availability Statement

Not applicable.

Conflicts of Interest

The authors declare no conflict of interest.

References

  1. Kruczek, P.; Polak, M.; Wy\lomańska, A.; Kawalec, W.; Zimroz, R. Application of Compound Poisson Process for Modelling of Ore Flow in a Belt Conveyor System with Cyclic Loading. Int. J. Min. Reclam. Environ. 2018, 32, 376–391. [Google Scholar] [CrossRef]
  2. Feng, X.; Ding, Z.; Ju, Y.; Zhang, Q.; Ali, M. “Double Peak” of Dynamic Strengths and Acoustic Emission Responses of Coal Masses Under Dynamic Loading. Nat. Resour. Res. 2022, 31, 1705–1720. [Google Scholar] [CrossRef]
  3. Wang, X.; Wang, E.; Liu, X.; Zhou, X. Failure Mechanism of Fractured Rock and Associated Acoustic Behaviors under Different Loading Rates. Eng. Fract. Mech. 2021, 247, 107674. [Google Scholar] [CrossRef]
  4. Fan, L.; Liu, S. Evaluation of Permeability Damage for Stressed Coal with Cyclic Loading: An Experimental Study. Int. J. Coal Geol. 2019, 216, 103338. [Google Scholar] [CrossRef]
  5. Li, T.; Pei, X.; Wang, D.; Huang, R.; Tang, H. Nonlinear Behavior and Damage Model for Fractured Rock under Cyclic Loading Based on Energy Dissipation Principle. Eng. Fract. Mech. 2019, 206, 330–341. [Google Scholar] [CrossRef]
  6. Li, X.; Peng, J.; Xie, Y.; Li, Q.; Zhou, T.; Wang, J.; Zheng, W. Influence of High-Temperature Treatment on Strength and Failure Behaviors of a Quartz-Rich Sandstone under True Triaxial Condition. Lithosphere 2022, 2022, 3086647. [Google Scholar] [CrossRef]
  7. Feng, X.; Ding, Z.; Hu, Q.; Zhao, X.; Ali, M.; Banquando, J.T. Orthogonal Numerical Analysis of Deformation and Failure Characteristics of Deep Roadway in Coal Mines: A Case Study. Minerals 2022, 12, 185. [Google Scholar] [CrossRef]
  8. Wang, X.; Asem, P.; Hu, C.; Labuz, J.F. Microcracking in Tensile Fracture of a Brittle Rock. Eng. Fract. Mech. 2021, 251, 107789. [Google Scholar] [CrossRef]
  9. Peng, K.; Zhou, J.; Zou, Q.; Zhang, J.; Wu, F. Effects of Stress Lower Limit during Cyclic Loading and Unloading on Deformation Characteristics of Sandstones. Constr. Build. Mater. 2019, 217, 202–215. [Google Scholar] [CrossRef]
  10. Cerfontaine, B.; Collin, F. Cyclic and Fatigue Behaviour of Rock Materials: Review, Interpretation and Research Perspectives. Rock Mech. Rock Eng. 2018, 51, 391–414. [Google Scholar] [CrossRef]
  11. Ma, D.; Wang, J.; Cai, X.; Ma, X.; Zhang, J.; Zhou, Z.; Tao, M. Effects of Height/Diameter Ratio on Failure and Damage Properties of Granite under Coupled Bending and Splitting Deformation. Eng. Fract. Mech. 2019, 220, 106640. [Google Scholar] [CrossRef]
  12. Liu, Y.; Dai, F. A Damage Constitutive Model for Intermittent Jointed Rocks under Cyclic Uniaxial Compression. Int. J. Rock Mech. Min. Sci. 2018, 103, 289–301. [Google Scholar] [CrossRef]
  13. Gautam, P.K.; Verma, A.K.; Jha, M.K.; Sharma, P.; Singh, T.N. Effect of High Temperature on Physical and Mechanical Properties of Jalore Granite. J. Appl. Geophys. 2018, 159, 460–474. [Google Scholar] [CrossRef]
  14. Richards, M.C.; Issen, K.A.; Ingraham, M.D. A Coupled Elastic Constitutive Model for High Porosity Sandstone. Int. J. Rock Mech. Min. Sci. 2022, 150, 104989. [Google Scholar] [CrossRef]
  15. Hagengruber, T.; Taha, M.M.R.; Rougier, E.; Knight, E.E.; Stormont, J.C. Evolution of Permeability in Sandstone During Confined Brazilian Testing. Rock Mech. Rock Eng. 2022, 55, 2651–2664. [Google Scholar] [CrossRef]
  16. Taheri, A.; Yfantidis, N.; Olivares, C.L.; Connelly, B.J.; Bastian, T.J. Experimental Study on Degradation of Mechanical Properties of Sandstone under Different Cyclic Loadings. Geotech. Test. J. 2016, 39, 673–687. [Google Scholar] [CrossRef]
  17. Saeedifar, M.; Zarouchas, D. Damage Characterization of Laminated Composites Using Acoustic Emission: A Review. Compos. Part B Eng. 2020, 195, 108039. [Google Scholar] [CrossRef]
  18. Muir, C.; Swaminathan, B.; Almansour, A.S.; Sevener, K.; Smith, C.; Presby, M.; Kiser, J.D.; Pollock, T.M.; Daly, S. Damage Mechanism Identification in Composites via Machine Learning and Acoustic Emission. NPJ Comput. Mater. 2021, 7, 95. [Google Scholar] [CrossRef]
  19. Du, K.; Li, X.; Tao, M.; Wang, S. Experimental Study on Acoustic Emission (AE) Characteristics and Crack Classification during Rock Fracture in Several Basic Lab Tests. Int. J. Rock Mech. Min. Sci. 2020, 133, 104411. [Google Scholar] [CrossRef]
  20. Triantis, D.; Kourkoulis, S. Fracture Precursor Phenomena in Marble Specimens under Uniaxial Compression by Means of Acoustic Emission Data. Frat. Integrità Strutt. 2019, 13, 537–547. [Google Scholar] [CrossRef] [Green Version]
  21. Triantis, D. Acoustic Emission Monitoring of Marble Specimens under Uniaxial Compression. Precursor Phenomena in the near-Failure Phase. Procedia Struct. Integr. 2018, 10, 11–17. [Google Scholar] [CrossRef]
  22. Jianjun, Z.; Qi, F.A.N.; Pengfei, L.I.; Sushen, L.I.; Guo, W.; Mingli, X.I.E. Acoustic Emission b Value Characteristics and Failure Precursor of the Dacite under Different Stress Paths. J. Eng. Geol. 2019, 27, 487–496. [Google Scholar]
  23. Dexing, L.; Enyuan, W.; Xiangguo, K.; Haishan, J.; Dongming, W.; Muhammad, A. Damage Precursor of Construction Rocks under Uniaxial Cyclic Loading Tests Analyzed by Acoustic Emission. Constr. Build. Mater. 2019, 206, 169–178. [Google Scholar] [CrossRef]
  24. Makhnenko, R.Y.; Ge, C.; Labuz, J.F. Localization of Deformation in Fluid-Saturated Sandstone. Int. J. Rock Mech. Min. Sci. 2020, 134, 104455. [Google Scholar] [CrossRef]
  25. Charalampidou, E.-M.; Stanchits, S.; Dresen, G. Compaction Bands in a Porous Sandstone Sample with Pre-Induced Shear Bands. In Proceedings of the Bifurcation and Degradation of Geomaterials with Engineering Applications, Limassol, Cyprus, 21–25 May 2017; Papamichos, E., Papanastasiou, P., Pasternak, E., Dyskin, A., Eds.; Springer International Publishing AG: Cham, Switzerland, 2017; pp. 391–398. [Google Scholar]
  26. Panteleev, I.; Lyakhovsky, V.; Browning, J.; Meredith, P.G.; Healy, D.; Mitchell, T.M. Non-Linear Anisotropic Damage Rheology Model: Theory and Experimental Verification. Eur. J. Mech.-Solids 2021, 85, 104085. [Google Scholar] [CrossRef]
  27. Xi, Y.; Wang, H.; Li, J.; Dong, W.; Li, H.; Guo, B. Experimental Comparison of Mechanical Properties and Fractal Characteristics of Geothermal Reservoir Rocks after Different Cooling Treatments. Energy Rep. 2022, 8, 5158–5176. [Google Scholar] [CrossRef]
  28. Ulusay, R. (Ed.) The ISRM Suggested Methods for Rock Characterization, Testing and Monitoring: 2007–2014; Springer International Publishing: Cham, Switzerland, 2015; ISBN 978-3-319-07712-3. [Google Scholar]
  29. Ying, P.; Zhu, Z.; Ren, L.; Deng, S.; Niu, C.; Wan, D.; Wang, F. Deterioration of Dynamic Fracture Characteristics, Tensile Strength and Elastic Modulus of Tight Sandstone under Dry-Wet Cycles. Theor. Appl. Fract. Mech. 2020, 109, 102698. [Google Scholar] [CrossRef]
  30. Huang, S.; Wang, J.; Qiu, Z.; Kang, K. Effects of Cyclic Wetting-Drying Conditions on Elastic Modulus and Compressive Strength of Sandstone and Mudstone. Processes 2018, 6, 234. [Google Scholar] [CrossRef]
  31. Baeza, J.R.; Compán, V.; Castillo, G.; Cámara, M.; Pachón, P. Determining Static Elastic Modulus of Weak Sandstone in Andalusian Historical Constructions from Non-Destructive Tests: San Cristóbal’s Stone. J. Build. Eng. 2022, 57, 104864. [Google Scholar] [CrossRef]
  32. Wasantha, P.L.P.; Ranjit, P.G.; Permata, G.; Bing, D. Damage Evolution and Deformation Behaviour of Dry and Saturated Sandstones: Insights Gleaned from Optical Measurements. Measurement 2018, 130, 8–17. [Google Scholar] [CrossRef]
  33. Okubo, C.H.; Schultz, R.A. Evolution of Damage Zone Geometry and Intensity in Porous Sandstone: Insight Gained from Strain Energy Density. J. Geol. Soc. 2005, 162, 939–949. [Google Scholar] [CrossRef]
  34. Mubarak, H.; Saji, R.P.; Sousa, R.; Sassi, M.; Abu Al-Rub, R.K. Quantification of Plasticity and Damage in Berea Sandstone through Monotonic and Cyclic Triaxial Loading under High-Confinement Pressures. J. Mater. Civ. Eng. 2022, 34, 04022116. [Google Scholar] [CrossRef]
  35. Gautam, P.K.; Jha, M.K.; Verma, A.K.; Singh, T.N. Evolution of Absorption Energy per Unit Thickness of Damaged Sandstone. J. Therm. Anal. Calorim. 2019, 136, 2305–2318. [Google Scholar] [CrossRef]
  36. Yoon, D.J.; Jung, J.C.; Park, P.; Lee, S.S. AE Characteristics for Monitoring Fatigue Crack in Steel Bridge Members. In Nondestructive Evaluation of Highways, Utilities, and Pipelines IV; Aktan, E.M., Gosselin, S.R., Eds.; SPIE-Int Soc Optical Engineering: Bellingham, WA, USA, 2000; Volume 3995, pp. 153–162. [Google Scholar]
  37. Ukpai, J.I.; Barker, R.; Hu, X.; Neville, A. Determination of Particle Impacts and Impact Energy in the Erosion of X65 Carbon Steel Using Acoustic Emission Technique. Tribol. Int. 2013, 65, 161–170. [Google Scholar] [CrossRef]
  38. Steadman, R.; Herrmann, C.; Livne, A. ChromAIX2: A Large Area, High Count-Rate Energy-Resolving Photon Counting ASIC for a Spectral CT Prototype. Nucl. Instrum. Methods Phys. Res. Sect.-Accel. Spectromet. Detect. Assoc. Equip. 2017, 862, 18–24. [Google Scholar] [CrossRef]
  39. Sharma, S.; Kapil, J.C.; Shahi, J.S.; Arora, R. Crack Growth under Three-Point Beam Bending and Fracture Energy Estimation for Snow in Relation to Acoustic Emission Responses. Theor. Appl. Fract. Mech. 2020, 109, 102683. [Google Scholar] [CrossRef]
  40. Kuutti, J.; Sepponen, R.E.; Saarikko, P. Escalator Power Consumption Compared to Pedestrian Counting Data. In Proceedings of the 2013 International Conference on Applied Electronics, Pilsen, Czech Republic, 10–12 September 2013; IEEE: New York, NY, USA, 2013; pp. 169–172. [Google Scholar]
  41. Hauert, A.; Rossoll, A.; Mortensen, A. Ductile-to-Brittle Transition in Tensile Failure of Particle-Reinforced Metals. J. Mech. Phys. Solids 2009, 57, 473–499. [Google Scholar] [CrossRef]
  42. Bazant, Z.P. Design of Quasibrittle Materials and Structures to Optimize Strength and Scaling at Probability Tail: An Apercu. Proc. R. Soc.-Math. Phys. Eng. Sci. 2019, 475, 20180617. [Google Scholar] [CrossRef]
  43. Kachanov, M.; Mishakin, V.; Pronina, Y. On Low Cycle Fatigue of Austenitic Steel. Part II: Extraction of Information on Microcrack Density from a Combination of the Acoustic and Eddy Current Data. Int. J. Eng. Sci. 2021, 169, 103569. [Google Scholar] [CrossRef]
  44. Kachanov, V.A.; Danilov, Y.B.; Shepil’, T.E.; Gvozdikova, E.K.; Kabashnyi, A.I.; Kozin, V.Y.; Ivanuna, S.M. Corrosion of Structure Materials and Their Weld Joints in the Environments of Monoethanolamine Gas Cleaning in Ammonia Production. Prot. Met. Phys. Chem. Surf. 2009, 45, 777–781. [Google Scholar] [CrossRef]
  45. Zhou, X.-P.; Zhang, J.-Z. Damage Progression and Acoustic Emission in Brittle Failure of Granite and Sandstone. Int. J. Rock Mech. Min. Sci. 2021, 143, 104789. [Google Scholar] [CrossRef]
  46. Li, H.; Qiao, Y.; Shen, R.; He, M.; Cheng, T.; Xiao, Y.; Tang, J. Effect of Water on Mechanical Behavior and Acoustic Emission Response of Sandstone during Loading Process: Phenomenon and Mechanism. Eng. Geol. 2021, 294, 106386. [Google Scholar] [CrossRef]
  47. Huang, Z.; Gu, Q.; Wu, Y.; Wu, Y.; Li, S.; Zhao, K.; Zhang, R. Effects of Confining Pressure on Acoustic Emission and Failure Characteristics of Sandstone. Int. J. Min. Sci. Technol. 2021, 31, 963–974. [Google Scholar] [CrossRef]
  48. Park, S.-J.; Lee, H.-S.; Jeong, H. Signal Analysis of CMP Process Based on AE Monitoring System. Int. J. Precis. Eng. Manuf.-Green Technol. 2015, 2, 15–19. [Google Scholar] [CrossRef]
  49. Świt, G.; Krampikowska, A.; Pala, T.; Lipiec, S.; Dzioba, I. Using AE Signals to Investigate the Fracture Process in an Al-Ti Laminate. Materials 2020, 13, 2909. [Google Scholar] [CrossRef] [PubMed]
  50. Voznesenskii, A.S.; Ertuganova, E.A.; Vil’yamov, S.V.; Tavostin, M.N. Studying the Mechanism of Acoustic Emission in Failure of Rock Salt by Dissolving. J. Min. Sci. 2006, 42, 35–42. [Google Scholar] [CrossRef]
  51. Unander, T.E. Analysis of Acoustic Emission Waveforms in Rock. Res. Nondestruct. Eval. 2004, 15, 119–148. [Google Scholar] [CrossRef]
  52. Ebrahimian, Z.; Ahmadi, M.; Sadri, S.; Li, B.Q.; Moradian, O. Wavelet Analysis of Acoustic Emissions Associated with Cracking in Rocks. Eng. Fract. Mech. 2019, 217, 106516. [Google Scholar] [CrossRef]
  53. Soleimani-Dashtaki, S.; Moayedi, F.; Ventura, C.E. Effect of Foundation Rocking on the Dynamic Characteristics of a 30-Story Concrete Shear Wall Building. In Dynamics of Civil Structures; Caicedo, J., Pakzad, S., Eds.; Springer: New York, NY, USA, 2015; Volume 2, pp. 11–30. [Google Scholar]
  54. Ito, F.; Tsukazawa, S.; Komazaki, M.; Ujihira, M.; Kawamura, Y.; Tokunaga, T. Evaluation of the Weight of Fallen Object Using the Wave Forms Measured by Cable Sensor and Mobile Multimedia Network System. In Proceedings of the Mine Planning and Equipment Selection 2001, New Delhi, India, 19–21 November 2001; Singhal, R.K., Singh, B.P., Eds.; Science Publishers Inc.: Enfield, UK, 2001; pp. 755–760. [Google Scholar]
  55. Flegner, P.; Kacur, J.; Durdan, M.; Lesso, I.; Laciak, M. Measurement and Processing of Vibro-Acoustic Signal from the Process of Rock Disintegration by Rotary Drilling. Measurement 2014, 56, 178–193. [Google Scholar] [CrossRef]
Figure 1. The experimental system on AE response.
Sustainability 14 12024 g001
Figure 2. The cyclic loading and unloading path of sandstone samples a, b, c.
Sustainability 14 12024 g002
Figure 3. Schematic diagram of the mechanical parameters calculation.
Sustainability 14 12024 g003
Figure 4. The elastic modulus for loading (a) and unloading (b) processes, respectively.
Sustainability 14 12024 g004
Figure 5. The three energies evolution characteristics during three cycles. (a) the total strain energy; (b) the dissipated energy; (c) the elastic energy; (d) The ratios of dissipation energy and elastic energy to total strain energy of sandstone.
Sustainability 14 12024 g005
Figure 6. Temporal evolution and precursor of the AE response.
Sustainability 14 12024 g006
Figure 7. Fourier transform processing of AE waveform signals.
Sustainability 14 12024 g007
Figure 8. The features of four main frequency bands. A, B, C, D represent the peak points of stress under different loading cycles, respectively.
Sustainability 14 12024 g008
Figure 9. Spectrograms of the four loading peak points.
Sustainability 14 12024 g009
Table 2. Basic parameters of sandstone mechanics.
SamplePeak Stress (MPa)Peak StrainBreaking Load (kN)
a46.920.0196117.31
b47.140.0202117.85
c45.260.0187113.14
Mean46.440.0195116.10
Publisher’s Note: MDPI stays neutral with regard to jurisdictional claims in published maps and institutional affiliations.

