Article

Techno-Economic Analysis of Indonesia Power Generation Expansion to Achieve Economic Sustainability and Net Zero Carbon 2050

by
Satria Putra Kanugrahan
1,2,*,
Dzikri Firmansyah Hakam
1,2,3 and
Herry Nugraha
1,3
1
PT Perusahaan Listrik Negara (Persero), Jakarta 12160, Indonesia
2
School of Business and Management, Institut Teknologi Bandung, Bandung 40132, Indonesia
3
Faculty of Technology and Energy Business, Institut Teknologi PLN, Jakarta 11750, Indonesia
*
Author to whom correspondence should be addressed.
Sustainability 2022, 14(15), 9038; https://doi.org/10.3390/su14159038
Submission received: 28 June 2022 / Revised: 17 July 2022 / Accepted: 19 July 2022 / Published: 23 July 2022

Abstract

:
Indonesia’s power generation roadmap aspires to achieve 23%, 28%, and 31% of power from renewable energy by 2025, 2038, and 2050, respectively. This study presents a technoeconomic analysis of Indonesia’s power generation development plans using the LEAP model in the post-COVID-19 period, with a focus on achieving the renewable target. In this study, four scenarios were modeled: business as usual (BAU), cost optimization (CO), national plan (NP), and zero-carbon (ZC). The BAU scenario is based on the PLN Electricity Business Plan 2019–2028, which does not include a target for renewable energy. The CO scenario aims to meet the renewable energy mandate at the lowest possible cost. The NP scenario aims to achieve renewable energy, with an additional natural gas target of 22% by 2025 and 25% by 2038. The ZC scenario aims to achieve 100% renewable energy by 2050 at the lowest possible cost. In comparison to the other scenarios, the BAU scenario has the highest total cost of power production, with a total of 180.51 billion USD by 2050. The CO scenario has the lowest total cost of production with a total of 89.21 billion USD; however, it may not be practical to implement.

1. Introduction

Indonesia is the biggest energy market in Southeast Asia, making up more than 36% of the region’s energy demand. In response to continued economic and demographic drivers, electricity demand will grow steadily. Electricity demand may double by 2040 [1]. Therefore, the role of energy planning in Indonesia has become a critical aspect of Indonesia’s energy policy. In 2019, the Indonesian Ministry of Energy and Mineral Resources (MEMR) released the National Energy Plan 2019–2038 (NEP 2019–2038) to establish the country’s future goals for electricity [2]. Indonesia expects to use up to 23% of electricity from renewable sources by 2025 and 28% by 2038 as part of the NEP 2019–2038. Furthermore, Indonesia aims to utilize 31% of electricity from renewable energy by 2050 [2,3,4]. Recently, there has been talk of the more ambitious goal of achieving 100% renewable energy [5]. These goals for renewable energy are also aligned with Indonesia’s nationally determined contribution (NDC) to the Paris Climate Agreement [6]. In order to meet its goal of using renewable energy, Indonesia must create a comprehensive long-term electricity plan [7].
This study intends to provide insight into Indonesia’s power generation expansion future model in the post coronavirus disease 2019 (COVID-19) period, by considering economic and energy sustainability in order to meet the renewable energy targets of 23% by 2025, 28% by 2038, and 31% by 2050 [2,3,4]. In addition, this study also created a scenario to achieve 100% renewable energy by 2050. Therefore, this study adds to the repertoire of literature for Indonesia related to achieving net-zero carbon by 2050, in accordance with the Paris Agreement on climate change targets. Indonesia currently intends to reach a zero-carbon target by 2060 [8]. This study offers a choice that is quicker than the Indonesian government’s current target while remaining consistent with the goal of the international community. In comparison to earlier studies, this study has two novelties. First, this research modeled Indonesia’s power generation expansion plan for 2020–2050 in the post-COVID-19 era as a single system. Second, this research created a model to achieve Indonesia’s zero-carbon target by 2050.
The remaining portions of this paper proceed as follows: Section 2 elaborates on Indonesia’s existing power system’s condition, the LEAP modeling methodology, the simulation scenarios, and the input data used in this study. Section 3 describes the result of the LEAP model. Section 4 discusses and analyzes the LEAP modeling result. Finally, Section 5 concludes the findings of this research, and offers suggestions for future research.

2. Materials and Methods

2.1. Indonesia’s Power System Overview

Since 2015, the government of Indonesia has initiated the 35,000 MW program to fulfill the increasing electricity demand. The 35,000 MW program increased Indonesia’s power generation capacity from 40.3 GW in 2015 to 63.3 GW in 2020 [9,10]. Ever since, fossil power plants have been the most widely built due to their low investment cost [11]. However, power outages remain common up to these days across Sumatera, Kalimantan, Sulawesi, and eastern Indonesia’s systems [3].
On the other hand, the Java-Bali system, the largest electricity consumer in Indonesia, experienced overcapacity due to the high reserve margin capacity available in the system [12]. Overcapacity results in inefficiencies, particularly for PLN, because the power purchase agreement between PLN and independent power plants (IPPs) is based on the take-or-pay agreement, which requires PLN to pay for all power generated even if the system is overloaded [13]. The overcapacity problem was worsened by the drop in electricity demand caused by the COVID-19 pandemic [14].
In Indonesia, electricity is generated via a variety of power plants, with coal power stations having the biggest total capacity. Indonesia’s total power generation capacity was 63,336.12 megawatts (MW) in 2020. PT PLN (Persero) and its subsidiaries operated 45,615 MW, while independent power plants (IPPs) operated the rest [15].
Figure 1 shows the percentage of Indonesia’s power generation capacity in 2020. Coal-fired power plants accounted for 47%, natural gas for 28%, oil for 10%, hydro for 10%, and geothermal for 5% of the total generating capacity. Solar PV, wind, and biomass power plants were also available, accounted for less than 0.01% of the total capacity. Indonesia’s power generation output in 2020 can be seen in Figure 2. Indonesia’s overall power production output in 2020 was 274.8 terawatt hours (TWh), with coal accounted for 62.85%, natural gas for 21.4%, oil for 0.88%, hydro for 6%, geothermal for 5.11%, solar PV for 0%, biomass for 2.98%, and wind and other RE for 0.17% [15].
Coal-fired power plants serve as base-load generators in the Indonesian power system due to several factors, such as their widespread availability, low cost, and ease of transport [16]. Meanwhile, gas and diesel power plants, which are the second and third largest in the energy mix, serve as intermediate-load power plants due to their high ramping rate characteristics that can adjust electricity demand more flexibly than coal [17,18]. Hydro, wind, geothermal, and other forms of renewable energy serve as peak-load generators due to their low availability and intermittency characteristics [19,20]. The intermittency characteristic of renewable energy means that renewable energy cannot always consistently produce energy at all hours of the day due to seasonal or weather changes. The intermittency characteristic may affect the power system’s reliability due to the stress caused by the change in electricity demand and supply [18].
According to the National Energy Council Republic of Indonesia, data on Indonesia’s potential for renewable energy [21] is shown in Table 1. Indonesia has a 441.7 GW renewable energy potential, made up of 94.3 GW of hydropower, 28.5 GW of geothermal energy, 32.6 GW of biopower, 207.8 GWp of solar power, 60.6 GW of wind power, and 17.9 GW of ocean power. In spite of this, renewable energy sources are still expensive in Indonesia [22]. The cost of solar energy in Indonesia is the highest among ASEAN members, coming in at 165 USD/MWh [23]. Renewable energy cannot be used economically in Indonesia since there are no homegrown industries to produce the necessary components. This condition affects the country’s attractiveness to renewable energy investors [22,24].
The Indonesian state-owned electricity company, PT PLN (Persero), has a monopoly on the retail electricity market and has become the only consumer of electricity generated by independent power producers (IPPs). Transmission and distribution (T and D) networks are also completely owned and run by PLN [20,24]. Seven major transmission networks exist in Indonesia: the Java-Bali, Sumatera, Sulawesi, Kalimantan, Nusa Tenggara, Papua, and Maluku systems [16,18]. The main one is the Java-Bali electricity system. The electricity consumption for the Java-Bali system in 2019 was 173,592 GWh, which was equivalent to 70.7 percent of Indonesia’s total electricity consumption in 2020 [15]. The Sumatera electrical system came in second with 36,698 GWh, or 15% of the total electricity demand [15]. The archipelago characteristic featured a special inter-island and inter-subsystem transmission that demanded for complex modeling and analysis of the Indonesia’s electricity market [26].

2.2. LEAP Software

The low emissions analysis platform, or LEAP is a scenario-based modeling tool that may be used to monitor energy production, consumption, and resource extraction across various economic sectors. The LEAP simulation’s scenarios model takes into account variables that could vary over time, such as those that might change as a result of shifting assumptions about policy and power generation technologies [27]. The scenario can be constructed and contrasted with other scenarios to examine the costs, benefits, energy needs, and environmental effects of each. The base model, which is a dataset of existing power generation parameters, is shared by all of the simulation scenarios. The base model data may include information about the current state of the power system from one year or from a number of prior years. The scenarios will then be projected from the first scenario year to the final scenario year.
All of the modules of LEAP are connected, therefore, the outcomes of one module will also affect those of the other modules. Since LEAP adopts a demand-driven, end-use methodology, the study begins with the final energy use [28]. By altering various future condition criteria in LEAP, scenarios can be generated. To alter a future parameter, one of three techniques can be used: setting particular values for specific years; calculating yearly growth rates from the previous year; or utilizing a set equation as a function of another parameter. Through the use of various assumptions for various scenarios, we can produce multiple scenarios [27].
Figure 3 illustrates how this research model is separated into three analyses. Demand module, transformation module, and cost module are the three key LEAP modules being used in the analysis. The LEAP demand module is used in power demand analysis to calculate the expected electricity demand for each scenario. The LEAP transformation module is used in power generation analysis to calculate the total power generation capacity required to meet the demand as well as the total output produced by the power plant. Cost analysis examines the total investment and production costs from the previously mentioned transformation module using the LEAP cost module.
The demand module represents society as a hierarchical tree structure with three levels: sectors, end-uses, and gadgets. The future electricity demand for Indonesia is forecasted in this study based on the PLN Electricity Business Plan 2019–2028 growth projection [3] and “Indonesia Energy Outlook 2020–Special Edition: COVID-19 Impact on Indonesia Energy Sector” released by the Agency for the Assessment and Application of Technology [29].
After the final energy demand for electricity is calculated, the transformation module must produce electricity using prime energy, such as coal or another source of energy. We can model the efficiency, losses, and processes involved in power generation in the transformation module to determine how much primary energy is needed in total to generate the final energy that is required. We may develop numerous scenarios using various conversion technology parameters, much like in energy demand analysis. For various combinations of demand and transformation scenarios, LEAP can automatically determine the total amount of fuel needed.
The overall annual demand figure is then used as the basis for determining the total amount of power generation capacity required to meet the demand, along with an additional percentage of reserve margin capacity that is also incorporated into the power system. These calculations result in the total capacity increased along the power generation energy mix for the particular year. The annual electricity production for each energy source is calculated by dispatching the generated power in accordance with the annual demand load curve. The resource module also accounts for the efficiency of power generation when calculating the overall amount of primary energy sources used to produce electricity.
The LEAP module will be able to determine the overall cost required for the entire power generation process if the cost parameter is entered [24,30]. Using LEAP’s optimization mode, LEAP is also able to select the best power generation option based on the lowest total expense throughout the whole projection time. The open-source energy modeling system (OSeMOSYS) and the next energy modeling system for optimization are two independent optimizing frameworks that are integrated to work in LEAP’s optimization mode (NEMO). The LEAP parameter will then be automatically entered into the OSeMOSYS or NEMO system. The frameworks’ results are then used as feedback for the recurring calculations [31].
The cost result can be reported as either the net present value for the base year or the true cost for the given year. The optimizing mode can also be constrained to certain requirements, such as satisfying energy demands or reducing emissions. When determining the best power generation option under a given constraint, LEAP will take into account a number of factors, including the capital costs or the initial investment cost for the power generation technology, the salvage values of the power plant, and the societal cost, which may include a pollution tax, the cost of fuel, and variable O/M expenses [24,27,31].

2.3. Research Model

The first step is to create a scenario projection in LEAP by creating a base model of Indonesia’s existing power system. As shown in Table 2, the LEAP base model needs several parameters to simulate the Indonesian power system. The base model is composed of Indonesia’s power system historical data from 2011 to 2019, which was acquired from the PLN statistic document [10,12,15,32,33]. The transmission and distribution losses for 2019 were also used as the basis for these calculations [34]. Figure 4 is the annual load shape model of Indonesia’s power system. The load shape was derived based on hourly load data [35], represented by 84 time-slices of a year. In addition, several model parameters for power generation were taken from previous studies [19,30,36,37,38,39], as shown in Table 3.
A demand model is developed once the base model has been established. Since LEAP is a demand-driven model, the anticipated outcome of electricity generation will depend on the estimated demand parameter. In this study, two demand assumptions—the pre-COVID-19 (PRC) and post-COVID-19 (POC) demand, as depicted in Figure 5, respectively—will be modeled. The PRC demand is based on the PLN Electricity Business Plan 2019–2028 growth projection [3]. The PRC electricity demand growth will range from 6.2% to 7.2% per year. The POC demand, meanwhile, is based on the “Indonesia Energy Outlook 2020-Special Edition: COVID-19 Impact on Indonesia Energy Sector” report issued by the Agency for the Assessment and Application of Technology [29]. The POC demand growth will vary from −0.4% in 2020 to 6.5% in 2030. In 2020, Indonesia’s electricity demand was −0.4% in 2019 [29]. The electricity demand is estimated to grow by an average of 2.5% per year from 2021 to 2025, and then 5% until 2029 [29]. From 2030 onward, both PRC and POC demand growth is assumed to be fixed at 6.5% annually. The 6.5% growth is based on the projected average growth for the next ten years in PLN Electricity Business Plan 2019–2028 growth projection [3].
LEAP will determine the overall power of the power generation module that must be produced after determining the total demand. As shown in Figure 6, there are four projected power generation expansion scenarios in this research: business as usual (BaU) scenario, cost optimization (CO) scenario, national plan scenario (NP), and zero-carbon (ZC) scenario. The PRC demand assumption will be applied to the business-as-usual (BAU) power generation scenario, while the POC demand assumption will be applied to the cost optimization (CO) scenario, national plan (NP) scenario, and zero-carbon (ZC) scenario.
The future renewable energy target is one of the key components of this study model [2,3,46]. The minimal renewable energy target that each scenario must meet is one of the factors that separates one scenario from another. There is no renewable energy target in the BAU scenario. As depicted in Figure 6, the CO, NP, and ZC scenarios, on the other hand, attempt to meet particular renewable energy targets. The total amount of renewable energy potential in all scenarios is restricted to Indonesia’s potential as shown in Table 1 [21].
The BAU scenario’s power generation projection for 2020–2028 is based on the PLN Electricity Business Plan 2019–2028 [3]. In 2020–2028, the BAU model is set to add a specific amount of power plant capacity as planned in the PLN Electricity Business Plan 2019–2028 [3]. The capacities being added for 2020–2028 are listed in Table A5 in the Appendix A. From 2029 onward, the power generation is set to fulfill the demand at the lowest cost possible using LEAP’s optimization mode.
The CO scenario aims to achieve the minimum renewable energy percentage at the lowest cost possible. The power generation assumption is set to achieve the minimum percentage of renewable energy targets of 23% by 2025, 28% by 2038, and 31% by 2050 [2]. The CO scenario uses LEAPs’ built-in optimization mode to find the least cost option to achieve the renewable energy target. Therefore, the CO scenario provides an insight into the theoretical future configuration of an energy system that will yield the lowest cost of production. However, such pathways may not represent realistic options to be implemented for several reasons. First, Indonesia must use a variety of energy resources to maintain its energy security [24,27]. Second, power dispatchers may also have trouble managing the power system, as the renewable energy power plant’s output can’t be quickly ramped up or down to adjust the power demand.
The NP scenario was created to address the CO scenario’s energy security issue as stated in NEP 2019–2038 [2]. This scenario is set to achieve renewable energy and natural gas energy targets based on the NEP 2019–2038 [2]. The renewable energy targets are 23% by 2025, 28% by 2038, and 31% by 2050. In the same period, natural gas targets are 22% by 2025 and 25% by 2038. A large percentage of natural gas is expected to maintain the stability of the electrical system in the event of a rapid change in power demand [20].
The last scenario of this research is the ZC scenario. Recently, there have been several discussions about Indonesia’s plan to become zero-carbon by 2050 [5,46]. The ZC scenario aims to provide an insight for Indonesia to achieve 100% renewable energy by 2050. This scenario also aims to achieve the 23% and 28% renewable targets by 2025 and 2038, respectively.

3. Results

This section is divided into two sections. The simulation results for the four models described in Section 2.3 are explained in the first section. The second part discusses the simulation results regarding investment costs, and compares them with previous studies of the Indonesian electricity system.

3.1. Research Simulation

3.1.1. Indonesia’s Total Electricity Demand

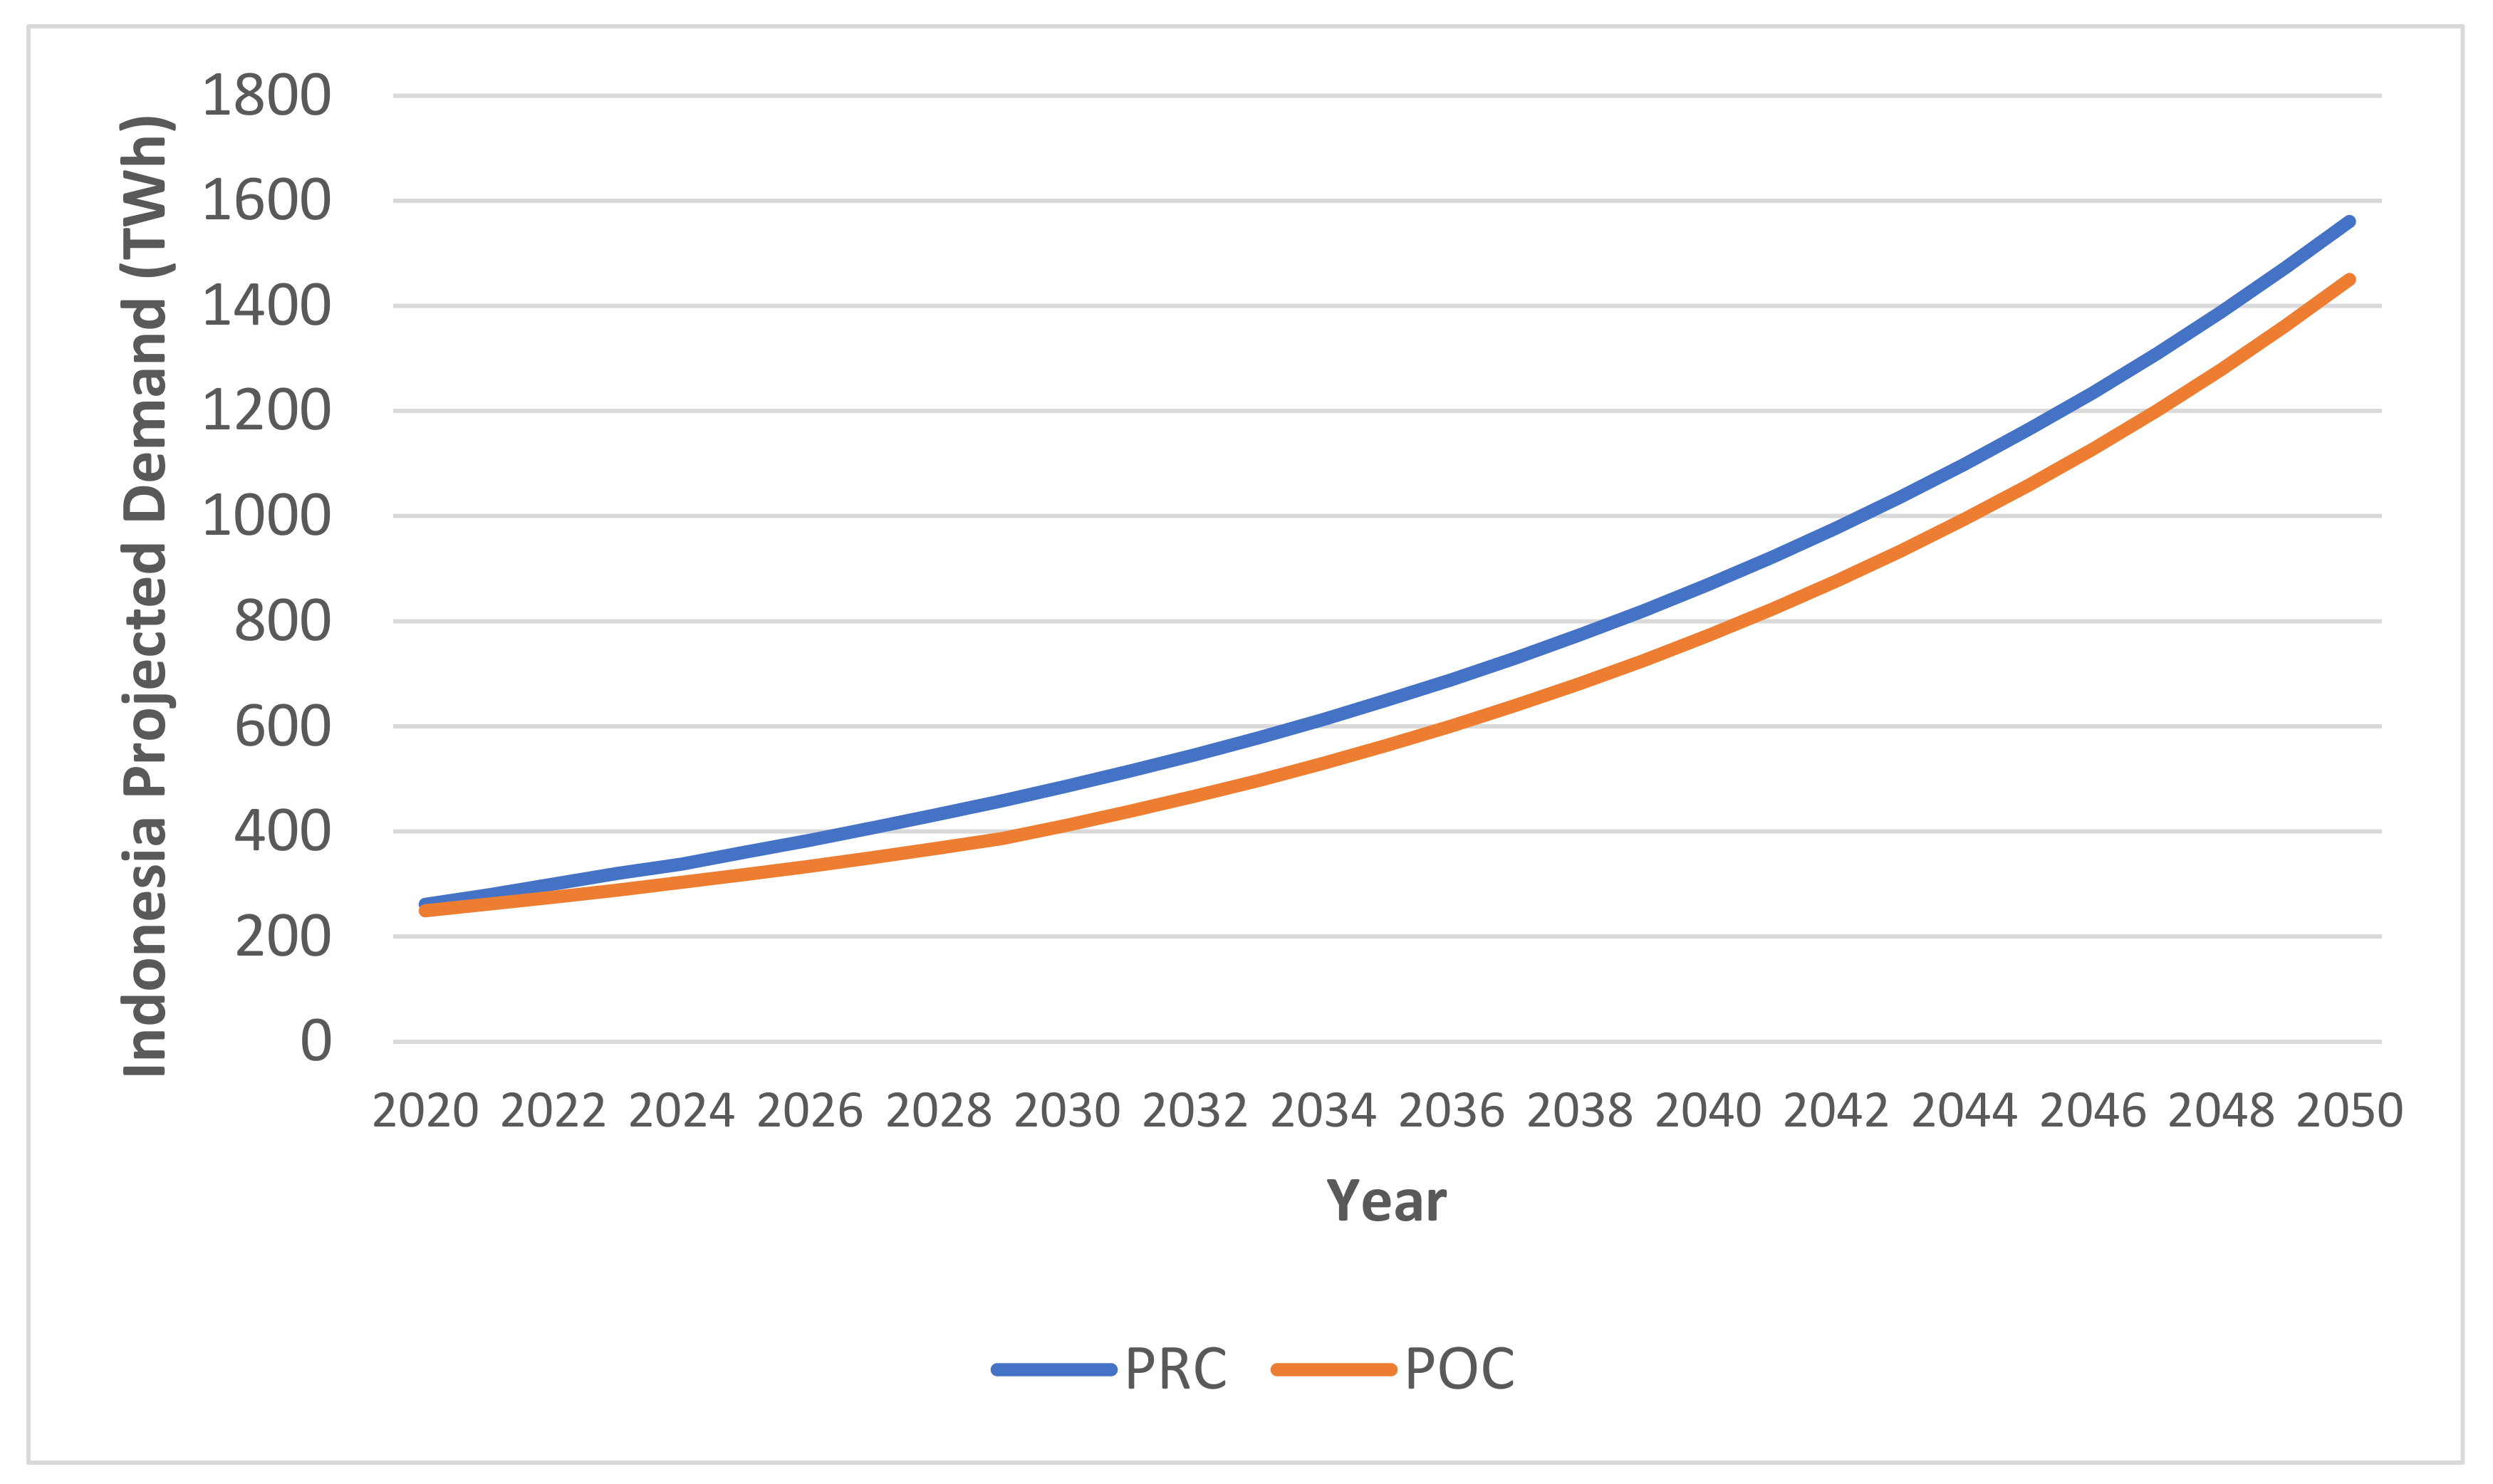
The total electricity demand for both the PRC and POC assumptions from 2020 to 2050 is depicted in Figure 7. In PRC conditions, Indonesia’s electricity demand is projected to reach 360.9 TWh by 2025 and 1561 TWh by 2050. However, COVID-19 is reducing the demand for electricity. The year 2020 saw a 243.5 TWh overall demand for electricity in Indonesia [15]. The predicted total power demand in 2025 under the POC demand assumption will be 318 TWh, which is 12% less than the demand under the BAU scenario for the same year. The overall power demand for Indonesia in 2050 will be 1450.5 TWh if, after 2030, the demand for electricity can recover to an average increase of 6.5 percent each year.

3.1.2. Business as Usual (BaU) Scenario

The BAU scenario projection results indicate that, in the absence of a renewable energy target constraint on Indonesia’s future power generating expansion, coal and natural gas power plants will have the largest capacity in the country’s energy mix. In the BAU scenario, the total projected power generated output will increase from 283.5 TWh in 2020 to 390.2 TWh in 2025, 832.0 TWh in 2038, and 1678.7 TWh in 2050, as shown in Figure 8. Indonesia’s total power generation capacity will be 105.59 GW, 169.5 GW, and 332.29 GW in 2025, 2038, and 2050, respectively, as shown in Figure 9.
In 2025, the entire output of BAU power generation will be 390.2 TWh. The energy mix is made up of hydropower (9.92%), geothermal (11.87%), biomass (0.19%), solar photovoltaics (0.68%), wind (0.78%), natural gas (0%), coal (76%), and oil (0.0%). As for 2025, there will be 105.59 GW of total power generation capacity, made up of hydropower (10.78 GW), geothermal (6.61 GW), biomass (0.17 GW), solar photovoltaic (1.38 GW), wind (1.24 GW), natural gas (27.42 GW), coal (50.53 GW), and oil (7.46 GW).
The total power generation output by 2038 will be 832.0 TWh. The energy mix consists of hydro (5.54%), geothermal (5.77%), biomass (0.14%), solar PV (0.32%), wind (0.38%), natural gas (41.60%), coal (46.24%), and oil (0%). In 2038, the total capacity will be 169.5 GW, consisting of hydro 12.84 GW, geothermal 6.86 GW, biomass 0.17 GW, solar PV 1.38 GW, wind 1.3 GW, natural gas 84.41 GW, coal 54.9 GW, and oil 7.64 GW.
The energy mix in 2050 consists of hydro (2.75%), geothermal (2.86%), biomass (0.07%), solar PV (0.16%), wind (0.19%), natural gas (28.48%), coal (65.49%), and oil (0%). In 2050, the total capacity will be 333.29 GW, consisting of hydro 12.84 GW, geothermal 6.86 GW, biomass 0.17 GW, solar PV 1.38 GW, wind 1.3 GW, natural gas 104.21 GW, coal 156.87 GW, and oil 48.66 GW.
The simulation reveals that the BAU scenario, which corresponds with PLN’s Electricity Business Plan 2019–2028, is still on track to achieve a 23 percent renewable energy objective by 2025, even if it lacks a renewable energy target. However, if the development of power generation is based on the least-cost approach, coal and natural gas will continue to be the most dominant energy sources through 2050. The simulation also indicates that there will be an overcapacity in power generation, which would cause the reserve margin to increase to a maximum of 76.7 percent between 2020 and 2031, as shown in Figure 10.
The potential overcapacity between 2020 and 2031 will make PLN financially inefficient. PLN will be required to pay for the construction of power plants that were outlined in the PLN Electricity Business Plan 2019–2028 [3], despite the fact that the demand can be met with the existing capacity until 2031. The overall cost of producing power under the BAU scenario up to 2050 will be 180.5 billion USD, as shown in Figure 11. For the years 2020–2050, the BAU scenario will need a 3.5 billion USD investment in power generation annually.

3.1.3. Cost Optimization (CO) Scenario

The CO scenario is set to achieve the renewable energy targets at the lowest cost possible. The scenario offers an intriguing insight that Indonesia might be able to attain its renewable energy target at a reasonable cost by combining geothermal, biomass, hydroelectric, and wind power. As can be seen in Figure 12, the total power generated output will be 343.8 TWh in 2025, 732.5 TWh in 2038, and 1559.5 TWh in 2050. In Figure 13, the total power generation capacity for Indonesia will be 70.37 GW, 148.71 GW, and 347.4 GW in 2025, 2038, and 2050, respectively.
The energy mix in 2025 consists of hydro (5.2%), geothermal (17.32%), biomass (0.35%), solar PV (0.04%), wind (0.9%), natural gas (17.1%), coal (59.9%), and oil (0%). The total power generation capacity in 2025 will be 70.36 GW, which consists of hydro 4.98 GW, geothermal 8.49 GW, biomass 0.17 GW, solar PV 0.06 GW, wind 0.13 GW, natural gas 20.95 GW, coal 29.4 GW, and oil 6.18 GW.
The energy mix in 2038 consists of hydro (2.44%), geothermal (25.33%), biomass (0.16%), solar PV (0.02%), wind (0.04%), natural gas (43.87%), coal (28.13%), and oil (0%). Meanwhile, in 2038, the total capacity will be 148.71 GW, which consists of hydro 4.98 GW, geothermal 26.48 GW, biomass 0.17 GW, solar PV 0.06 GW, wind 0.13 GW, natural gas 81.30 GW, coal 29.4 GW, and oil 6.18 GW.
The energy mix in 2050 consists of hydro (1.15%), geothermal (12.81%), biomass (7.51%), solar PV (0.01%), wind (9.53%), natural gas (26.06%), coal (42.94%), and oil (0%). Meanwhile, in 2050, the total capacity will be 347.7 GW, which consists of hydro 4.98 GW, geothermal 28.5 GW, biomass 16.71 GW, solar PV 0.06 GW, wind 60.6 GW, natural gas 91.62 GW, coal 95.5 GW, and oil 49.42 GW.
As shown in Figure 14, the CO scenario’s up until 2050, total cost of power production will be 89.21 billion USD. For the years 2020–2050, the CO scenario required an investment of 1.8 billion USD in power generation annually. However, more research on the power system is required to ascertain whether it is feasible to rely on renewable energy sources in large quantities, taking into account their availability and the power system’s reliability. The intermittent nature of renewable energy will also drastically decrease its availability. Power dispatchers may also experience difficulties controlling the power system due to the comparatively low proportion of natural gas in the energy mix, especially when the system is transitioning from off-peak to peak load. In order to address the change in demand for electricity, the output of a natural gas power plant can be increased or decreased rapidly. The natural gas power plants’ capability to adjust their output quickly will help power dispatchers in controlling the power system [18,20].

3.1.4. National Plan (NP) Scenario

The NP scenario aims to maintain a balance between fossil fuels and renewable energy to ensure the reliability and security of the electricity supply based on the National Electricity Plan 2019–2038. Figure 15 shows the total power generated output for the NP scenario, which is 343.8 TWh in 2025, 732.5 TWh in 2038, and 1559.5 TWh in 2050. In 2025, 2038, and 2050 the NP’s total power generation capacity will reach 70.61 GW, 152 GW, and 347.44 GW, respectively, as can be seen in Figure 16.
The energy mix in 2025 consists of hydro (5.2%), geothermal (17.32%), biomass (0.35%), solar PV (0.04%), wind (0.09%), natural gas (22.04%), coal (54.96%), and oil (0%). The total power generation capacity in 2025 will be 70.61 GW, which consists of hydro 4.98 GW, geothermal 9.71 GW, biomass 0.17 GW, solar PV 0.06 GW, wind 0.13 GW, natural gas 22.6 GW, coal 26.96 GW, and oil 6 GW.
The energy mix in 2038 consists of hydro (2.44%), geothermal (23.86%), biomass (0.16%), solar PV (0.02%), wind (1.52%), natural gas (25.19%), coal (46.81%), and oil (0%). Meanwhile, in 2038, the total capacity will be 151.97 GW, which consists of hydro 4.98 GW, geothermal 28.5 GW, biomass 0.17 GW, solar PV 0.06 GW, wind 4.53 GW, natural gas 58.81 GW, coal 48.92 GW, and oil 6 GW.
The energy mix in 2050 consists of hydro (1.15%), geothermal (11.21%), biomass (9.11%), solar PV (0.01%), wind (9.53%), natural gas (8.64%), coal (60.36%), and oil (0%). Meanwhile, in 2050, the total capacity will be 347.4 GW, which consists of hydro 4.98 GW, geothermal 28.5 GW, biomass 20.27 GW, solar PV 0.06 GW, wind 60.6 GW, natural gas 89.76 GW, coal 137.27 GW, and oil 6 GW.
Figure 17 shows that up until 2050, the NP scenario’s total cost of power production will be 124.63 billion USD. The NP scenario requires an annual investment in electricity generation of 2.7 billion USD on average from 2020 to 2050. The entire cost of producing power under the NP is 35.42 billion USD, which is 39.7% more expensive than under the CO scenario. In order to maintain Indonesia’s energy security while attaining the renewable energy objective, there will be a financial trade-off in the NP scenario, increasing the overall cost of production and investment.

3.1.5. Zero-Carbon (ZC) Scenario

The ZC scenario seeks to give a comprehensive view of Indonesia’s expansion of power generation in terms of achieving 100 percent renewable energy by 2050. In the ZC scenario, as shown in Figure 18, the total power generated output is 343.8 TWh in 2025, 732.5 TWh in 2038, and 1559.5 TWh in 2050. In Figure 19, the ZC’s total power generation capacity will reach 79.51 GW, 172.71 GW, and 789.11 GW in 2025, 2038, and 2050, respectively.
The energy mix in 2025 consists of hydro (23.07%), geothermal (10.77%), biomass (0.26%), solar PV (0.04%), wind (0.09%), natural gas (8.88%), coal (56.88%), and oil (0%). The total power generation capacity in 2025 will be 79.51 GW, which consists of hydro 22.08 GW, geothermal 6.04 GW, biomass 0.17 GW, solar PV 0.06 GW, wind 0.13 GW, natural gas 16.56 GW, coal 28.47 GW, and oil 6 GW.
The energy mix in 2038 consists of hydro (28.99%), geothermal (11.59%), biomass (0.16%), solar PV (0.02%), wind (0.04%), natural gas (32.03%), coal (27.18%), and oil (0%). Meanwhile, in 2038, the total capacity will be 172.71 GW, which consists of hydro 59.13 GW, geothermal 13.84 GW, biomass 0.17 GW, solar PV 0.06 GW, wind 0.13 GW, natural gas 58.61 GW, coal 28.41 GW, and oil 12.36 GW.
The energy mix in 2050 consists of hydro (17.61%), geothermal (11.21%), biomass (4.7%), solar PV (56.95%), wind (9.53%), natural gas (0%), coal (0%), and oil (0%). Meanwhile, in 2050, the total capacity will be 789.1 GW, which consists of hydro 93.3 GW, geothermal 28.5 GW, biomass 32.6 GW, solar PV 460.86 GW, wind 60.6 GW, natural gas 58.61 GW, coal 28.41 GW, and oil 26.2 GW.
As shown in Figure 20, the ZC scenario’s overall cost of power production up until 2050 will be 134.06 billion USD. For the years 2020–2050, the ZC scenario will need a 3.7 billion USD investment in power generation annually. According to the modeling results, the ZC scenario will require 789.1 GW of power generation capacity by 2050, which is 227% more than what is required by the CO and NP scenarios. Furthermore, the results demonstrated that Indonesia’s existing renewable energy potential is insufficient to supply the required amount of power by 2050. As of now, Indonesia has a 441.7 GW potential for renewable energy [21]. Meanwhile, the ZC scenario requires 675.89 GW of renewable energy generating capacity, with solar PV accounting for the largest generator at 460.86 GW. For Indonesia to be carbon-free by 2050, there is a gap in available renewable energy sources of up to 234.19 GW. Indonesia will need to explore new renewable energy potentials and introduce cutting-edge renewable energy technologies to increase the effectiveness of renewable energy conversion.

4. Discussion

Table 4 compares the results of this research and several previous research, such as from Kamia Handayani, Subhash Kumar, and IESR. Even though the three studies’ research methodologies and scopes differ, they can be utilized as a benchmark for this study’s findings. In order to meet the renewable energy targets of 23% by 2025, 28% by 2038, and 31% by 2050, Kamia Handayani studied power generation in the Java-Bali system [30,47,48]. With a total electrical demand that accounts for 70.7% of all demand in Indonesia, the Java-Bali system is Indonesia’s largest electricity infrastructure [15]. Next, Subhash Kumar conducted research on the Indonesian system [37]. The study, which was conducted before COVID-19, also aims to achieve the 23% and 38% renewable energy targets by 2025 and 2050, respectively. However, scenarios where Indonesia uses 100% renewable energy by 2050 were not covered by Subhash Kumar. Finally, research from IESR explored initiatives to reach Indonesia’s 100% renewable energy by 2050. The LUT energy system model used by the IESR to conduct research on the power, heating, and transportation sectors in Indonesia as a single model [46].
In 2050, Indonesia would have a total power generation capacity of 347.4 GW, according to the NP scenario. With a post-COVID-19 demand, the NP scenario sets a target for renewable energy of 23% by 2025, 28% by 2038, and 31% by 2050. A model of the Java-Bali system using pre-COVID-19 demand developed by Kamia Handayani was studied [24]. The overall power generation capacity for Kamia Handayani in 2050 is 244 GW, or 70.3 percent of the NP scenario used in this study. The percentage closely reflects the actual power generation conditions in Indonesia in the year 2020, when Java-Bali accounted for 64.3 percent of the total capacity and the rest of Indonesia was at 35.6 percent [15]. By 2050, Indonesia’s total generation capacity will be 370 GW, according to IESR’s study, which models the Indonesian system with the same renewable energy targets in post-COVID-19 demand [46]. The IESR outcome was 7% higher than the NP scenario in this study. Therefore, this study can be concluded to have a reasonable outcome.
The Indonesian system also discussed Subash Kumar’s REP scenario, which has the same renewable energy objective as the NP scenario used in this study [37]. According to Subhash Kumar’s estimation, the cost of producing electricity will equal 120 billion USD by 2050 in the REP scenario. Meanwhile, the overall cost of producing electricity in this study’s NP scenario is 124 billion USD by 2050, or only 3% higher. In conclusion, this research’s results are in line with the previous research of Kamia Handayani, Subhash Kumar, and IESR.
Figure 21 shows a comparison of the four scenarios’ total cost of energy production. Compared to the other three scenarios, the total cost of producing electricity is highest in the BAU scenario. The entire cost of producing electricity under the BAU scenario is 180.51 billion USD up until 2050. The overcapacity in current and planned power plants that are included in the PLN Electricity Business Plan 2019–2028 [3] as a part of the 35,000 MW program is the cause of the high overall cost. The BAU overall cost is higher by 55.88 billion USD when compared to the NP scenario. As mentioned before, the NP scenario refers to the 2019–2038 National Electricity Plan [2]. Therefore, the expansion plan for Indonesia’s power generation should be based on the NP scenario.
In Figure 21, the CO scenario has the lowest total cost. Even though the investment costs for renewable energy are still expensive, the cheap marginal cost of renewable energy makes the total cost of electricity production low [49]. The same factor can be seen in the ZC scenario, where the ZC’s total cost in 2050 has the almost same cost as the NP scenario. The ZC scenario has a total cost of 134.06 billion USD, which is 9.4 billion USD higher than the NP scenario. However, the ZC scenario achieves the 100% renewable energy target, while the NP is only at 31% by 2050.
Due to its limited availability and efficiency, renewable energy currently has a higher investment cost in Indonesia compared to fossil fuels. A renewable energy power plant will also require up to twice the capacity of a fossil fuel power plant in order to produce the same amount of power as the fossil power plant. In addition, the intermittency characteristics of renewable energy make it necessary to invest in energy storage systems, such as, battery systems or pump storage hydro. An additional fossil power plant may also be needed to operate as a system balancer during periods of low renewable energy supply. All of this additional investment increases the required investment cost of renewable energy.
The addition of fossil power plants is important to fill the renewable energy availability gap. The system’s ability to adapt such shift a in demand must be taken into account if the renewable energy target ought to be achieved. Fossil power plants give power dispatchers flexibility to fulfill the load requirements through the allocation of a balanced composition between base-load, intermediate-load, and peak-load power plants. On the other hand, the total cost of producing electricity using renewable energy is much cheaper than using fossil fuels because the fuel cost for renewable energy is cheaper than fossil. There is no margin cost for solar PV, wind, and hydro energy. Lower production costs make it possible to sell power for a higher profit, which can be used to offset the high upfront expenses of renewable energy.
The annual investment costs required if Indonesia wants to reach 31% renewable energy by 2050 will range from 1.8 to 2.7 billion USD. Indonesia will need to invest up to 3.7 billion USD annually if it wants to reach 100% renewable energy by 2050. The CO, NP, and ZC scenarios in this study have annual investment costs that are greater than the average annual investment cost of renewable energy in Indonesia in the last 5 years. Indonesia spends over 2 billion USD on renewable energy annually on average [46].
The government of Indonesia should immediately increase the attractiveness of the renewable energy business to attract more investors. The government can do this by enacting laws that encourage the use of renewable energy sources. Additionally, maintaining a favorable business climate depends on the consistency of renewable energy targets and the political support from key stakeholders. Given the nature of investments in electricity generation, which will have a lengthy payback period, investors must be given an assurance that they won’t experience losses in the future [50].

5. Conclusions

Even with pre-COVID-19 demand assumptions, the BAU scenario shows that Indonesia’s existing power plants, as envisaged in PLN’s Electricity Business Plan 2019–2028, are able to supply electricity demand up until 2031. If the COVID-19-induced drop in electricity demand continues for the next several years, Indonesia will experience power plant overcapacity. The overcapacity will increase Indonesia’s power generation reserve margin up to 76.7%. Of course, in terms of operational and investment expenses, the overcapacity condition is inefficient. The “Take or Pay” contract with the independent power plant (IPP) will make this situation worse for PLN. Under the “Take or Pay” contract, PLN is obligated to pay for the electricity generated by the IPP despite the fact that it does not require it.
PLN’s Electricity Business Plan 2019–2028 is on track to achieve Indonesia’s target of 23% renewable energy by 2025. However, due to overcapacity in 2020–2031, the BAU scenario is not financially efficient when compared to the cost optimization (CO), national plan (NP), and zero-carbon (ZC) scenarios. In addition, according to PLN’s Electricity Business Plan 2019–2028 [3], coal power plants capacity will increase to 57 GW by 2028. As a result, coal will play a significant role in Indonesia’s future energy mix. To meet Indonesia’s renewable energy targets of 28% by 2038 and 31% by 2050, biomass co-firing or early decommissioning of coal power plants will be required. The process must take into account PLN’s financial viability, so that contract renegotiation and decommissioning of existing fossil power plants do not result in fines or “Take or Pay” payment obligations for the company.
Indonesia is expected to meet its renewable energy objective at the lowest possible cost under the cost optimization (CO) scenario. The overall cost of energy production in the CO scenario until 2050 is 89.21 billion USD, with an annual investment of 1.8 billion USD on average. Geothermal, hydro, biomass, and wind energy are the main sources of renewable energy in the energy mix. However, more research on the power system’s capability in implementing the CO scenario is required, especially to address the intermittency characteristics of renewable energy. Furthermore, as the percentage of natural gas in this scenario is so low, the power system dispatcher’s ability to manage energy demand variations will be limited.
The national plan (NP) scenario is the second scenario. The NP scenario attempts to maintain a balance between fossil fuels and renewable energy, with natural gas targets of 22% by 2025 and 25% by 2038 along the renewable energy target [2]. For the period 2020–2050, the total cost of electricity production is 124.63 billion USD, with an average annual investment of 2.7 billion USD. The NP model showed that to achieve the renewable energy target while also keeping the system’s reliability will cost 35.42 billion USD more than the CO scenario.
For the zero-carbon (ZC) scenario, the total cost of electricity production from 2020 to 2050 is 134.06 billion USD, with an annual investment of 3.7 billion USD. According to the simulation results, Indonesia’s existing renewable energy potential capacity is insufficient to achieve a 100% renewable energy mix by 2050. The ZC’s total renewable energy power generation capacity in 2050 is 675.89 GW, however, Indonesia’s renewable energy potential capacity is limited to 441.7 GW [21]. Advances in renewable energy conversion technology will be required to produce more power from lower generating capacities in order to achieve zero-carbon by 2050. In addition, new renewable energy sources must be explored in order to boost renewable energy’s potential. Nuclear technology can potentially be used to make up for the shortfall in renewable energy generation capacity [51]. In a way to mitigate the effect of renewable energy’s intermittency characteristics, the installation of energy storage such as pumped storage and batteries will be essential [18].

Author Contributions

Conceptualization, S.P.K., D.F.H. and H.N.; methodology, S.P.K., D.F.H. and H.N.; software, S.P.K.; validation, D.F.H. and H.N.; formal analysis, S.P.K.; investigation, S.P.K.; resources, D.F.H. and H.N.; data curation, S.P.K.; writing—original draft preparation, S.P.K.; writing—review and editing, S.P.K.; visualization, S.P.K.; supervision, D.F.H.; project administration, S.P.K.; funding acquisition, H.N. All authors have read and agreed to the published version of the manuscript.

Funding

This research received no external funding.

Institutional Review Board Statement

Not applicable.

Informed Consent Statement

Not applicable.

Data Availability Statement

All data produced or studied during the current work are included in the published article.

Conflicts of Interest

The authors declare no conflict of interest.

Appendix A. LEAP Model Parameter

Table A1. Indonesia Electricity Demand History 2011–2019 *.
Branch201120122013201420152016201720182019
Household64.6671.6476.6783.5088.0893.0093.8497.14102.92
Business27.7730.0832.8535.5236.1638.9940.8743.2446.12
Public9.7810.6111.3412.2713.0114.0514.6415.7016.88
Industry54.2659.6663.8065.3363.5667.6371.7276.4577.14
* In Terawatt-hour (TWh).
Table A2. Indonesia Power Generation Capacity 2011–2019 *.
Branch201120122013201420152016201720182019
Hydro3.923.944.094.164.294.404.864.944.98
Geothermal1.151.221.261.321.311.372.101.722.44
Biomass0.000.000.000.030.040.040.150.170.17
Solar PV0.000.010.010.010.010.010.020.030.06
Wind0.000.000.000.000.000.000.000.070.13
Natural Gas12.9714.4514.7214.8215.0615.8114.6515.1617.44
Coal14.8217.4918.6620.5421.0823.8425.6926.4129.40
Oil6.857.347.867.627.227.228.167.926.50
Total39.7144.4346.5948.4949.0252.6955.6356.4261.13
* In Gigawatt (GW).
Table A3. Indonesia Power Generation Output 2011–2019 *.
Branch201120122013201420152016201720182019
Hydro12.4212.8016.9215.1613.7419.3718.6316.9417.20
Geothermal9.379.429.4110.0410.0510.6512.6712.5914.10
Biomass0.000.000.000.210.440.580.590.520.52
Solar PV0.000.000.000.040.020.020.030.020.02
Wind0.000.000.000.000.000.010.000.170.17
Natural Gas36.5545.2850.2654.4757.6565.3259.3859.3859.91
Coal77.74100.71110.42119.61129.81134.07147.83160.90169.88
Oil42.1929.8726.6925.9119.2116.0614.2715.1811.29
* In Terawatt-hour (TWh).
Table A4. Power Generation Fuel Price.
BranchUnit20192025203020352040
OilUSD/Barrel54.492.0100.4109.8117.2
CoalUSD/Tonne85.080.083.084.085.0
Natural GasUSD/MBTU6.59.29.49.59.8
Table A5. BAU Scenario’s 2020–2028 Power Generation Addition.
Type of Generation (in MW)202020212022202320242025202620272028
Hydro326755-18214843,0471294661467
Geothermal15114745524541527594514555
Wind21731684647015641951742
Natural Gas307310113155153584540280400485
Coal604736412780459030901184169513751093
Oil24648120321523527202010
Total10,06063517439723762257476217424233152

References

  1. IEA. E4 Country Profile: Energy Efficiency Indonesia, Int. Energy Agency. 2021. Available online: https://www.iea.org/articles/e4-country-profile-energy-efficiency-indonesia (accessed on 18 June 2021).
  2. MEMR. National Electricity General Plan 2019–2038, 1st ed.; Ministry of Energy and Mineral Resources: Jakarta, Indonesia, 2019; Available online: https://jdih.esdm.go.id/index.php/web/result/1973/detail (accessed on 13 February 2021).
  3. PT PLN (Persero). Electricity Power Supply Business Plan 2019–2028; PT PLN (Persero): Jakarta, Indonesia, 2019; Available online: https://web.pln.co.id/statics/uploads/2021/08/5b16d-kepmen-esdm-no-39-k-20-mem-2019-tentang-pengesahan-ruptl-pt-pln-2019-2028.pdf (accessed on 10 February 2021).
  4. PT PLN (Persero). RUPTL 2021–2030 (Electricity Power Supply Business Plan 2021–2030); PT PLN (Persero): Jakarta, Indonesia, 2021. [Google Scholar]
  5. Rahman, D.F. PLN Pledges Carbon Neutrality by 2050—Business—The Jakarta Post, Jakarta Post. 2021. Available online: https://www.thejakartapost.com/news/2021/05/07/pln-pledges-carbon-neutrality-by-2050.html (accessed on 10 May 2021).
  6. MEMR. First Nationally Determined Contribution Submitted to UNFCCC, Ministry of Energy and Mineral Resources, Jakarta, Indonesia. 2016. Available online: https://www4.unfccc.int/sites/ndcstaging/PublishedDocuments/IndonesiaFirst/FirstNDCIndonesia_submittedtoUNFCCCSet_November2016.pdf (accessed on 13 February 2021).
  7. IRENA. Renewable Energy Prospects: Indonesia, International Renewable Energy Agency, Abu Dhabi. 2017. Available online: http://www.irena.org/remap (accessed on 20 March 2021).
  8. Hakam, D.F.; Nugraha, H.; Wicaksono, A.; Rahadi, R.A.; Kanugrahan, S.P. Mega conversion from LPG to induction stove to achieve Indonesia’s clean energy transition. Energy Strateg. Rev. 2022, 41, 100856. [Google Scholar] [CrossRef]
  9. PT PLN (Persero). Investor Presentation; PT PLN (Persero): Jakarta, Indonesia, 2020; Available online: https://web.pln.co.id/statics/uploads/2020/08/Triwulan-1-2020.pdf (accessed on 12 February 2021).
  10. PT PLN (Persero). PLN Statistics 2015, 2015th ed.; Corporate Secretary PT PLN (Persero): Jakarta, Indonesia, 2015; Available online: https://web.pln.co.id/statics/uploads/2017/06/Statistik-PLN-2015-English.pdf (accessed on 23 March 2021).
  11. Kurniawan, R.; Trencher, G.P.; Edianto, A.S.; Setiawan, I.E.; Matsubae, K. Understanding the multi-faceted drivers of increasing coal consumption in Indonesia. Energies 2020, 13, 3660. [Google Scholar] [CrossRef]
  12. PT PLN (Persero). PLN Statistic 2019, 2019th ed.; Corporate Secretary PT PLN (Persero): Jakarta, Indonesia, 2020; Available online: https://web.pln.co.id/statics/uploads/2020/11/Statistik-Indonesia-2019.pdf (accessed on 23 March 2021).
  13. Hamdi, E. Racing Towards 23% Renewable Energy FIT to Start, but New Policies to Support Competition Are the Key to Indonesia’ s Renewables Future; IEEFA: Lakewood, OH, USA, 2020. [Google Scholar]
  14. Fuqoha, I.; Kresnawan, M.R. ACE Report: COVID-19 vs ASEAN Energy Sector-Electricity Recap of 2020, Jakarta, Indonesia. 2021. Available online: https://aseanenergy.org/covid-19-vs-asean-energy-sector-electricity-recap-of-2020/ (accessed on 15 April 2021).
  15. PT PLN (Persero). PLN Statistics 2020, 2020th ed.; Corporate Secretary PT PLN (Persero): Jakarta, Indonesia, 2021; Available online: https://web.pln.co.id/statics/uploads/2021/07/Statistik-PLN-2020.pdf (accessed on 23 March 2021).
  16. PwC. Power in Indonesia Investment and Taxation Guide, Jakarta, Indonesia. 2018. Available online: https://www.pwc.com/id/en/energy-utilities-mining/assets/power/power-guide-2017.pdf (accessed on 3 April 2021).
  17. Hakam, D.F.; Wiyono, S.K.; Hariyanto, N. Competition in Power Generation: Ex-ante Analysis of Indonesia’s Electricity Market. Energies 2020, 13, 6741. [Google Scholar] [CrossRef]
  18. Tambunan, H.B.; Hakam, D.F.; Prahastono, I.; Pharmatrisanti, A.; Purnomoadi, A.P.; Aisyah, S.; Wicakson, Y.; Sandy, I.G.R. The Challenges and Opportunities of Renewable Energy Source (RES) Penetration in Indonesia: Case Study of Java-Bali Power System. Energies 2020, 13, 5903. [Google Scholar] [CrossRef]
  19. Kresnawan, M.R.; Safitri, I.A.; Darmawan, I. Long term projection of electricity generation sector in east kalimantan province: LEAP model application. In Proceedings of the 2018 12th South East Asian Technical University Consortium (SEATUC), Yogyakarta, Indonesia, 12–13 March 2018. [Google Scholar] [CrossRef]
  20. Hakam, D.F.; Asekomeh, A.O. Gas monetisation intricacies: Evidence from indonesia. Int. J. Energy Econ. Policy 2018, 8, 174–181. [Google Scholar]
  21. DEN. Indonesia Energy Outlook 2019, 2019th ed.; DEN: Jakarta, Indonesia, 2020; Available online: https://www.esdm.go.id/assets/media/content/content-indonesia-energy-outlook-2019-english-version.pdf (accessed on 20 February 2021).
  22. Halimatussadiah, A.; Amanda, A.; Maulia, R.F. Unlocking Renewable Energy Potential in Indonesia: Assessment on Project Viability; LPEM-FEB UI: Jakarta, Indonesia, 2020. [Google Scholar]
  23. Darghouth, N.; McCall, J.; Keyser, D.; Aznar, A.; Gokhale-Welch, C. Distributed Photovoltaic Economic Impact Analysis in Indonesia; National Renewable Energy Lab.: Golden, CO, USA, 2020. [Google Scholar] [CrossRef]
  24. Handayani, K. Electricity and Climate Change: Seeking for the Triple Nexus of Electrification, Climate Change Mitigation, and climate Change Adaptation. Ph.D. Thesis, University of Twente, Enschede, The Netherlands, 2019. [Google Scholar] [CrossRef]
  25. Krüger, C.; Kravchik, A. Standard Test Conditions. 2017. Available online: https://wiki.openmod-initiative.org/wiki/Standard_test_conditions (accessed on 27 June 2022).
  26. Hakam, D.F. Mitigating the risk of market power abuse in electricity sector restructuring: Evidence from Indonesia. Util. Policy 2019, 56, 181–191. [Google Scholar] [CrossRef]
  27. Heaps, C.G. LEAP: The Low Emissions Analysis Platform; [Software Version: 2020.1.20]; Stockholm Environment Institute: Somerville, MA, USA, 2020. [Google Scholar]
  28. Siteur, J. The Long-range Energy Alternatives Planning model (LEAP) and Wood Energy Planning Overview and Exercises PART I: The LEAP Model 2; RWEDP: Bangkok, Thailand, 2018. [Google Scholar]
  29. BPPT. Indonesia Energy Outlook 2020—Special Edition Dampak Pandemi COVID-19 Terhadap Sektor Energi di Indonesia; Pusat Pengkajian Industri Proses dan Energi (PPIPE), Badan Pengkajian dan Penerapan Teknologi (BPPT): Jakarta, Indonesia, 2020. [Google Scholar]
  30. Handayani, K.; Filatova, T.; Krozer, Y.; Anugrah, P. Seeking for a climate change mitigation and adaptation nexus: Analysis of a long-term power system expansion. Appl. Energy 2020, 262, 114485. [Google Scholar] [CrossRef]
  31. Awopone, A.K.; Zobaa, A.F.; Banuenumah, W. Assessment of optimal pathways for power generation system in Ghana. Cogent Eng. 2017, 4, 1314065. [Google Scholar] [CrossRef]
  32. PT PLN (Persero). PLN Statistics 2017, 2017th ed.; Corporate Secretary PT PLN (Persero): Jakarta, Indonesia, 2018; Available online: https://web.pln.co.id/statics/uploads/2018/07/PLN-Statistics-2017-English.pdf (accessed on 23 March 2021).
  33. PT PLN (Persero). PLN Statistics 2018, 2018th ed.; Corporate Secretary PT PLN (Persero): Jakarta, Indonesia, 2019; Available online: https://web.pln.co.id/statics/uploads/2019/07/STATISTICS-English-26.7.19.pdf (accessed on 23 March 2021).
  34. PT PLN (Persero)—Pusat Pengatur Beban. Evaluasi Operasi Sistem Jawa Bali 2019; PT PLN (Persero): Jakarta, Indonesia, 2020. [Google Scholar]
  35. PT PLN (Persero)—Pusat Pengatur Beban. Indonesia Load Curve 2019; PT PLN (Persero): Jakarta, Indonesia, 2019. [Google Scholar]
  36. Suhono, S. Long-term electricity demand forecasting of Sumatera system based on electricity consumption intensity and Indonesia population projection 2010–2035. Energy Procedia 2015, 68, 455–462. [Google Scholar] [CrossRef] [Green Version]
  37. Kumar, S. Assessment of renewables for energy security and carbon mitigation in Southeast Asia: The case of Indonesia and Thailand. Appl. Energy 2016, 163, 63–70. [Google Scholar] [CrossRef]
  38. Windarta, J.; Purwanggono, B.; Hidayanto, F. Application of LEAP model on long-term electricity demand forecasting in Indonesia, period 2010–2025. In SHS Web of Conferences; EDP Sciences: Les Ulis, France, 2018; Volume 49, p. 02007. [Google Scholar] [CrossRef] [Green Version]
  39. Nugrahanto, C.A.; Windarta, J.; Aminata, J. Analysis of Causality Relationship Energy Consumption and CO2 Emissions to Economic Growth based on the LEAP Model Case Study of Energy Consumption in Indonesia 2010–2025. In E3S Web of Conferences; EDP Sciences: Les Ulis, France, 2018; Volume 73. [Google Scholar] [CrossRef] [Green Version]
  40. BPS. Proyeksi Penduduk Indonesia 2015–2045; Revision, Badan Pusat Statistik Republik Indonesia: Jakarta, Indonesia, 2018. [Google Scholar]
  41. IEA. World Energy Model Documentation; International Energy Agency: Paris, France, 2018; Available online: http://www.worldenergyoutlook.org/weomodel/ (accessed on 1 March 2021).
  42. EIA. Cost and Performance Characteristics of New Generating Technologies, Annual Energy Outlook 2021, Energy Information Administration, Washington, D.C. United States. 2021. Available online: https://www.eia.gov/outlooks/aeo/assumptions/pdf/table_8.2.pdf (accessed on 4 May 2021).
  43. IESR. Levelized Cost of Electricity in Indonesia; Institute for Essential Services Reform (IESR): Jakarta, Indonesia, 2019; Available online: http://iesr.or.id/wp-content/uploads/2020/01/LCOE-Full-Report-ENG.pdf (accessed on 8 March 2021).
  44. World Wildlife Fund (WWF); Intelligent Energy Systems (IES); Mekong Economics Ltd. (MKE). Thailand Power Sector Vision 2050; World Wildlife Fund: Bangkok, Thailand, 2016; Available online: https://wwfasia.awsassets.panda.org/downloads/thailand_power_sector_vision_full.pdf (accessed on 1 May 2021).
  45. MEMR. National Electricity General Plan 2015–2034; Draft; Ministry of Energy and Mineral Resources: Jakarta, Indonesia, 2015. [Google Scholar]
  46. IESR. Deep Decarbonization of Indonesia’s Energy System Deep Decarbonization of Indonesia’s Energy System: A Pathway to Zero Emissions by 2050; Institute for Essential Services Reform: Jakarta, Indonesia, 2021; Available online: https://iesr.or.id/en/pustaka/deep-decarbonization-of-indonesias-energy-system-a-pathway-to-zero-emissions-by-2050 (accessed on 6 May 2021).
  47. Handayani, K.; Filatova, T.; Krozer, Y. The vulnerability of the power sector to climate variability and change: Evidence from Indonesia. Energies 2019, 12, 3640. [Google Scholar] [CrossRef] [Green Version]
  48. Handayani, K.; Krozer, Y.; Filatova, T. Trade-offs between electrification and climate change mitigation: An analysis of the Java-Bali power system in Indonesia. Appl. Energy 2017, 208, 1020–1037. [Google Scholar] [CrossRef]
  49. Asian Development Bank (Ed.) ADB Renewable Energy Tariffs and and Incentives in Indonesia; Asian Development Bank: Manila, Philippines, 2020; ISBN 9789292623241. [Google Scholar]
  50. Hong, C.S.; Lee, E.B. Power plant economic analysis: Maximizing lifecycle profitability by simulating preliminary design solutions of steam-cycle conditions. Energies 2018, 11, 2245. [Google Scholar] [CrossRef] [Green Version]
  51. PT PLN (Persero). PLN Presentation–Investment Prioritization Mid/Long Term–14 June 2021; PT PLN (Persero): Jakarta, Indonesia, 2021. [Google Scholar]
Figure 1. Indonesia’s power generation capacity in 2020 [15].
Sustainability 14 09038 g001
Figure 2. Indonesia’s power generation output in 2020 [15].
Sustainability 14 09038 g002
Figure 3. Conceptual framework.
Sustainability 14 09038 g003
Figure 4. Load shape.
Sustainability 14 09038 g004
Figure 5. Electricity demand growth assumption.
Sustainability 14 09038 g005
Figure 6. Renewable energy target for projected scenarios.
Sustainability 14 09038 g006
Figure 7. Projected total electricity demand for Indonesia.
Sustainability 14 09038 g007
Figure 8. BAU scenario–power generation output.
Sustainability 14 09038 g008
Figure 9. BAU scenario–power generation capacity.
Sustainability 14 09038 g009
Figure 10. BAU scenario–reserve margin.
Sustainability 14 09038 g010
Figure 11. BAU scenario–total cost of electricity production.
Sustainability 14 09038 g011
Figure 12. CO Scenario–Power Generation Output.
Sustainability 14 09038 g012
Figure 13. CO scenario–power generation capacity.
Sustainability 14 09038 g013
Figure 14. CO scenario–total cost of electricity production.
Sustainability 14 09038 g014
Figure 15. NP scenario–power generation output.
Sustainability 14 09038 g015
Figure 16. NP scenario–power generation capacity.
Sustainability 14 09038 g016
Figure 17. NP scenario–total cost of electricity production.
Sustainability 14 09038 g017
Figure 18. ZC scenario–power generation output.
Sustainability 14 09038 g018
Figure 19. ZC scenario–power generation capacity.
Sustainability 14 09038 g019
Figure 20. ZC scenario–total cost of electricity production.
Sustainability 14 09038 g020
Figure 21. Total cost of electricity production comparison.
Sustainability 14 09038 g021
Table 1. Indonesia’s Renewable Energy Potential [21].
Energy SourcePotential
Hydro94.3 GW
Geothermal28.5 GW
Bioenergy32.6 GW
Solar207.8 GWp 1
Wind60.6 GW
Ocean17.9 GW
1 Gigawatts-peak, or GWp is used to describe the maximum power output of solar power systems, which would be achieved under the standard test conditions (STC). The STC for a photovoltaic solar panel or module is defined as being 1000 W/m2 (1 kW/m2) of full solar noon sunshine (irradiance) when the panel and cells are at a standard ambient temperature of 25 °C with a sea level air mass (AM) of 1.5 [25].
Table 2. Base model parameter.
Input ParameterDataSource
Population 2011–2019242.4–267.2 million persons[10,12,15,32,33]
Population 2020–2050270.2–330.9 million persons[40]
Electricity Demand History 2011–2019Table A1[10,12,15,32,33]
T and D Losses 2011–20198.29–10.12%[10,12,15,32,33]
Load Shape 1Figure 4[35]
Power Generation CapacityTable A2[10,12,15,32,33]
Power Generation OutputTable A3[10,12,15,32,33]
Fuel CostTable A4[41]
LifetimeTable 3[41]
EfficiencyTable 3[24]
Maximum AvailabilityTable 3[24]
Capacity CreditTable 3[24]
Capital Cost 2Table 3[24,41,42,43,44]
Fixed O/M CostTable 3[24,41,42,43,44]
Variable O/M CostTable 3[24,41,42,43,44]
Reserve Margin 335%[45]
Interest Rate12%[43]
1 The load shape (load curve) of Indonesia’s electricity demand is assumed to be similar each year for the whole projection period. 2 Cost per capacity of each type of power plant. 3 Reserve margin of 35% means that the power generation system has 35% excess capacity from the expected peak demand.
Table 3. Summary of the power generation model parameters.
BranchLifetime (years) 1Efficiency (%) 2 Maximum Availability 3 (%) Capacity Credit 4 (%) Capital Cost 5Fixed O/M Cost 6Variable O/M Cost 7
2020 82050 9
Hydro80100415127692427421.4
Geothermal40100808027722740137.51.17
Biomass201008010040771725126.34.85
Solar PV 102510022271612105232.30
Wind2510028351846128026.50
Natural Gas305580100108292614.22.56
Coal4040801003672243740.84.52
Oil303580100181347635.33.8
1 Lifetime, efficiency, maximum availability, and capacity credit source: [24]. 2 Common assumption for renewable energy efficiency is 100% [27]. 3 Maximum availability in LEAP is defined as the ratio of the maximum energy produced to what would have been produced if the process ran at full capacity for a given period (expressed as a percentage) [27]. 4 Capacity credit in LEAP is defined as the fraction of the rated capacity considered for calculating the reserve margin, which is calculated based on the ratio of the availability of the intermittent plant to the availability of a standard thermal plant (expressed as a percentage) [27]. 5 Capital cost in thousands of USD/MW. 6 Fixed O/M cost in thousands of USD/MW. 7 Variable O/M cost is in USD/MWh. 8 The 2020 capital cost source: [42]. 9 Capital cost source for 2050: [44]. 10 Battery storage cost included in solar PV and wind cost.
Table 4. Result comparison with previous research.
ResearchScenarioResearch ScopePower Generated (TWh)Capacity (GW)Total Cost (Billion USD) 1
SystemDemand202520402050202520402050202520402050
This ResearchBAUIndonesiaPre-COVID-19390.2935.01678.7105.6189.3332.342.7138.4180.5
COIndonesiaPost-COVID-19343.8884.01559.570.4172.7347.45.953.489.2
NPIndonesiaPost-COVID-19343.8884.01559.570.6179.3347.415.786.4124.6
ZCIndonesiaPost-COVID-19343.8884.01559.579.5195.0789.117.189.6134.1
Previous Research 2
Kamia Handayani [24]REFJava-BaliPre-COVID-19305.0650.01068.060.0150.0225.025.872.191.6
NREJava-BaliPre-COVID-19332.0-1159.069.6150.0244.428.882.4106.2
REN-low LRJava-BaliPre-COVID-19332.0-1159.069.6150.0244.430.984.593.4
REN-medium LRJava-BaliPre-COVID-19332.0-1159.069.6150.0244.428.882.4101.5
REN-high LRJava-BaliPre-COVID-19332.0-1159.069.6150.0244.427.880.495.6
Subhash Kumar [37]REFIndonesiaPre-COVID-19400.0800.01800.0125.0230.0400.022.649.992.6
REIndonesiaPre-COVID-19400.0800.01800.0125.0300.0450.023.771.2105.6
REPIndonesiaPre-COVID-19400.0800.01800.0125.0300.0450.035.693.8120.0
IESR [46]Best Policy ScenarioIndonesiaPost-COVID-19596.0834.01213.0--370.0---
1 Adjusted to 2020 billion USD. 2 Processed data from previous research.
Publisher’s Note: MDPI stays neutral with regard to jurisdictional claims in published maps and institutional affiliations.

