
Understanding Consumer Buying Intention of E-Commerce Airfares Based on Multivariate Demographic Segmentation: A Multigroup Structural Equation Modeling Approach

 , , ,
, , , 
Abstract
:1. Introduction
2. Literature Review
2.1. The Technology Acceptance Model
2.1.1. Perceived Usefulness
2.1.2. Perceived Ease of Use
2.1.3. Price Sensitivity
2.1.4. Hedonic Motivation
2.1.5. Behavioral Intention
2.2. Generations and E-Commerce Airfares
3. Materials & Methods
3.1. Sampling and Data Collection
3.2. Data Analysis
4. Results
4.1. Step 1: Cluster Analysis
4.2. Step 2: Measurement Model (CFA)
4.3. The Goodness of Fit (GOF)
4.4. Convergent Validity
4.5. Discriminant Validity
4.6. Step 3: Structural Model
4.7. Step 4: Multigroup Moderation Analysis
5. Discussion
5.1. Research Implications
5.2. Research Limitations and Future Research
6. Conclusions
Author Contributions
Funding
Institutional Review Board Statement
Informed Consent Statement
Data Availability Statement
Acknowledgments
Conflicts of Interest
Appendix A
- Yes
- No
- (1)
- Gender: a. Male b. Female
- (2)
- Generation: a. Gen X (born 1960–1979) b. Gen Y (born 1980–1994) c. Gen Z (born 1995–2010)
- (3)
- The income per month: a. less than 25,000 baht b. more than 25,000 baht
- (1)
- Perceived usefulness
- I find airline company e-commerce websites or online travel agencies’ websites very useful in the purchasing process.
- Using airline company e-commerce websites or online travel agencies’ websites helps me accomplish things more quickly in the purchasing process.
- I can save time when I use airline company e-commerce websites or online travel agency websites in the purchasing process.
- (2)
- Perceived ease of use
- The airline website or online travel agency websites are easy to use and simple to use.
- It is easy for me to become skillful at using airline company e-commerce websites or online travel agent websites.
- Using airline websites or online travel agency websites helps me purchase an airline ticket more conveniently.
- (3)
- Price sensitivity
- I can save money by examining the prices of different airline companies’ e-commerce websites or online travel agency websites.
- I like to search for cheap travel deals on different airline companies’ e-commerce websites or online travel agency websites.
- Airline company e-commerce websites or online travel agencies’ websites offer better value for my money.
- (4)
- Hedonic motivation
- Using airline company e-commerce websites or online travel agencies’ websites is fun.
- Using airline company e-commerce websites or online travel agency websites is very entertaining.
- Using airline company e-commerce websites or online travel agencies’ websites is enjoyable.
- (5)
- Behavioral intentions
- I will continue using airline e-commerce websites or online travel agency websites to purchase a ticket in the future.
- I am addicted to using airline company e-commerce websites or online travel agency websites.
- I plan to continue to use airline company e-commerce websites or online travel agency websites frequently to purchase a ticket.
References
- Ho, C.-I.; Lee, Y.-L. The development of an e-travel service quality scale. Tour. Manag. 2007, 28, 1434–1449. [Google Scholar] [CrossRef]
- Kim, W.G.; Ma, X.; Kim, D.J. Determinants of Chinese hotel customers’ e-satisfaction and purchase intentions. Tour. Manag. 2006, 27, 890–900. [Google Scholar] [CrossRef]
- Bilgihan, A.; Bujisic, M. The effect of website features in online relationship marketing: A case of online hotel booking. Electron. Commer. Res. Appl. 2015, 14, 222–232. [Google Scholar] [CrossRef]
- Deane, S. Over 60 Online Travel Booking Statistics. Available online: https://www.stratosjets.com/blog/online-travel-statistics/ (accessed on 18 May 2020).
- Weng, G.S.; Zailani, S.; Iranmanesh, M.; Hyun, S.S. Mobile taxi booking application service’s continuance usage intention by users. Transp. Res. Part D Transp. Environ. 2017, 57, 207–216. [Google Scholar] [CrossRef]
- Kunst, A. How Often do You Book Flights Online of at a Travel Agency or a Counter? Available online: https://www.statista.com/statistics/675508/flights-booked-online-united-kingdom-uk-by-age/ (accessed on 3 September 2019).
- DataReportal. Digital 2021: Thailand. Available online: https://datareportal.com/reports/digital-2021-thailand (accessed on 16 June 2022).
- Parsa, H.G.; Cobanoglu, C. Building a model of commitment for Generation Y: An empirical study on e-travel retailers. Tour. Manag. 2011, 32, 833–843. [Google Scholar]
- Chaiprasit, K.; Jariangprasert, N.; Chomphunut, A.; Naparat, D.; Jaturapataraporn, J. Tourist Expectations Toward Travel And Tourism Websites In Thailand. Int. Bus. Econ. Res. J. 2011, 10, 41–50. [Google Scholar] [CrossRef]
- Statista, 2020. Online Travel Agency Usage in Thailand as of November 2020. Available online: https://www.statista.com/statistics/1203524/thailand-online-travel-agency-usage/ (accessed on 31 January 2020).
- Travel Weekly. Online Travel Sector Faces Challenges. Available online: https://travelweekly.co.uk/articles/312706/special-report-online-travel-sector-faces-challenges (accessed on 20 December 2018).
- Davis, F.D. Perceived usefulness, perceived ease of use, and user acceptance of information technology. MIS Q. 1989, 13, 319–340. [Google Scholar] [CrossRef] [Green Version]
- Kamal, S.A.; Shafiq, M.; Kakria, P. Investigating acceptance of telemedicine services through an extended technology acceptance model (TAM). Technol. Soc. 2019, 60, 101212. [Google Scholar] [CrossRef]
- Sukendro, S.; Habibi, A.; Khaeruddin, K.; Indrayana, B.; Syahruddin, S.; Makadada, F.A.; Hakim, H. Using an extended Technology Acceptance Model to understand students’ use of e-learning during COVID-19: Indonesian sport science education context. Heliyon 2020, 6, e05410. [Google Scholar] [CrossRef]
- Davis, F.D.; Bagozzi, R.P.; Warshaw, P.R. User acceptance of computer technology: A comparison of two theoretical models. Manag. Sci. 1989, 35, 982–1003. [Google Scholar] [CrossRef] [Green Version]
- Legris, P.; Ingham, J.; Collerette, P. Why do people use information technology? A critical review of the technology acceptance model. Inf. Manag. 2003, 40, 191–204. [Google Scholar] [CrossRef]
- Jones, A.B.; Kauppi, K. Examining the antecedents of the technology acceptance model within e-procurement. Int. J. Oper. Prod. Manag. 2018, 38, 22–42. [Google Scholar] [CrossRef]
- Phonthanukitithaworn, C.; Sellitto, C.; Fong, M.W.L. A Comparative Study of Current and Potential Users of Mobile Payment Services. SAGE Open 2016, 6, 2158244016675397. [Google Scholar] [CrossRef]
- Min, S.; So, K.K.F.; Jeong, M. Consumer adoption of the Uber mobile application: Insights from diffusion of innovation theory and technology acceptance model. J. Travel Tour. Mark. 2019, 36, 770–783. [Google Scholar] [CrossRef]
- Naruetharadhol, P.; Ketkaew, C.; Hongkanchanapong, N.; Thaniswannasri, P.; Uengkusolmongkol, T.; Prasomthong, S.; Gebsombut, N. Factors Affecting Sustainable Intention to Use Mobile Banking Services. SAGE Open 2021, 11, 21582440211029925. [Google Scholar] [CrossRef]
- Tahar, A.; Riyadh, H.A.; Sofyani, H.; Purnomo, W.E. Perceived Ease of Use, Perceived Usefulness, Perceived Security and Intention to Use E-Filing: The Role of Technology Readiness. J. Asian Financ. Econ. Bus. 2020, 7, 537–547. [Google Scholar] [CrossRef]
- Wong, C.-H.; Tan, G.W.-H.; Loke, S.-P.; Ooi, K.-B. Adoption of mobile social networking sites for learning? Online Inf. Rev. 2015, 39, 762–778. [Google Scholar] [CrossRef]
- Park, E.; Ohm, J. Factors influencing users’ employment of mobile map services. Telemat. Inform. 2014, 31, 253–265. [Google Scholar] [CrossRef]
- Kumar, R.; Sachan, A.; Dutta, T. Examining the Impact of e-Retailing Convenience Dimensions on Behavioral Intention: The Mediating Role of Satisfaction. J. Internet Commer. 2020, 19, 466–494. [Google Scholar] [CrossRef]
- Bilgihan, A.; Barreda, A.; Okumus, F.; Nusair, K. Consumer perception of knowledge-sharing in travel-related Online Social Networks. Tour. Manag. 2016, 52, 287–296. [Google Scholar] [CrossRef]
- Gillenson, M.L.; Sherrell, D.L. Enticing online consumers: An extended technology acceptance perspective. Inf. Manag. 2002, 39, 705–719. [Google Scholar]
- Venkatesh, V. Determinants of Perceived Ease of Use: Integrating Control, Intrinsic Motivation, and Emotion into the Technology Acceptance Model. Inf. Syst. Res. 2000, 11, 342–365. [Google Scholar] [CrossRef] [Green Version]
- Jiang, L.; Yang, Z.; Jun, M. Measuring consumer perceptions of online shopping convenience. J. Serv. Manag. 2013, 24, 191–214. [Google Scholar] [CrossRef]
- Wu, J.J.; Chang, Y.S. Towards understanding members’ interactivity, trust, and flow in online travel community. Ind. Manag. Data Syst. 2005, 105, 937–954. [Google Scholar] [CrossRef]
- Phonthanukitithaworn, C.; Naruetharadhol, P.; Wongsaichia, S.; Mahajak, N.; Ketkaew, C. Identifying the relationship between Travel Agent’s Web Service Quality and E-brand Reputation. Cogent Bus. Manag. 2021, 8, 1999784. [Google Scholar] [CrossRef]
- Monroe, K.B. Buyers’ Subjective Perceptions of Price. J. Mark. Res. 1973, 10, 70. [Google Scholar]
- Anderson, E.W. Customer satisfaction and price tolerance. Mark. Lett. 1996, 7, 265–274. [Google Scholar] [CrossRef] [Green Version]
- Roy, R.; Rabbanee, F.; Sharma, P. Antecedents, outcomes, and mediating role of internal reference prices in pay-what-you-want (PWYW) pricing. Mark. Intell. Plan. 2016, 34, 117–136. [Google Scholar] [CrossRef]
- Goldsmith, R.E.; Kim, D.; Flynn, L.R.; Kim, W.-M. Price Sensitivity and Innovativeness for Fashion Among Korean Consumers. J. Soc. Psychol. 2005, 145, 501–508. [Google Scholar] [CrossRef]
- de Medeiros, J.F.; Ribeiro, J.L.D.; Cortimiglia, M.N. Influence of perceived value on purchasing decisions of green products in Brazil. J. Clean. Prod. 2016, 110, 158–169. [Google Scholar] [CrossRef]
- Li, Y.; Lu, Y.; Zhang, X.; Liu, L.; Wang, M.; Jiang, X. Propensity of green consumption behaviors in representative cities in China. J. Clean. Prod. 2016, 133, 1328–1336. [Google Scholar] [CrossRef]
- Moser, A.K. Consumers’ purchasing decisions regarding environmentally friendly products: An empirical analysis of German consumers. J. Retail. Consum. Serv. 2016, 31, 389–397. [Google Scholar] [CrossRef]
- Natarajan, T.; Balasubramanian, S.A.; Kasilingam, D.L. Understanding the intention to use mobile shopping applications and its influence on price sensitivity. J. Retail. Consum. Serv. 2017, 37, 8–22. [Google Scholar] [CrossRef]
- Chan, K.Y.; Gong, M.; Xu, Y.; Thong, J. Examining user acceptance of SMS: An empirical study in China and Hong Kong. In Proceedings of the Pacific Asia Conference on Information Systems, PACIS 2008, Suzhou, China, 4–7 July 2008; p. 294. [Google Scholar]
- Tak, P.; Panwar, S. Using UTAUT 2 model to predict mobile app based shopping: Evidences from India. J. Indian Bus. Res. 2017, 9, 248–264. [Google Scholar] [CrossRef]
- Brown, S.A.; Venkatesh, V. Model of Adoption of Technology in Households: A Baseline Model Test and Extension Incorporating Household Life Cycle. MIS Q. 2005, 29, 399–426. [Google Scholar] [CrossRef]
- Fard, S.S.; Alkelani, A.M.; Tamam, E. Habit as a moderator of the association of utilitarian motivation and hedonic motivation with purchase intention: Implications for social networking websites. Cogent Soc. Sci. 2019, 5, 1674068. [Google Scholar]
- Childers, T.L.; Carr, C.L.; Peck, J.; Carson, S. Hedonic and utilitarian motivations for online retail shopping behavior. J. Retail. 2002, 77, 511–535. [Google Scholar] [CrossRef]
- Salimon, M.G.; Bin Yusoff, R.Z.; Mokhtar, S.S.M. The mediating role of hedonic motivation on the relationship between adoption of e-banking and its determinants. Int. J. Bank Mark. 2017, 35, 558–582. [Google Scholar] [CrossRef]
- Wagner, G.; Schramm-Klein, H.; Steinmann, S. e-Shopping acceptance: A qualitative and meta-analytic review. J. Retail. Consum. Serv. 2016, 52, 44–60. [Google Scholar]
- To, P.-L.; Liao, C.; Lin, T.-H. Shopping motivations on Internet: A study based on utilitarian and hedonic value. Technovation 2007, 27, 774–787. [Google Scholar] [CrossRef]
- Liao, C.; To, P.-L.; Hsu, F.-C. Exploring knowledge sharing in virtual communities. Online Inf. Rev. 2013, 37, 891–909. [Google Scholar] [CrossRef]
- Venkatesh, V.; Thong, J.Y.L.; Chan, F.K.Y.; Hu, P.J.-H.; Brown, S.A. Extending the two-stage information systems continuance model: Incorporating UTAUT predictors and the role of context. Inf. Syst. J. 2011, 21, 527–555. [Google Scholar] [CrossRef]
- Zhou, T.; Lu, Y. The Effects of Personality Traits on User Acceptance of Mobile Commerce. Int. J. Hum. Comput. Interact. 2011, 27, 545–561. [Google Scholar] [CrossRef]
- Alalwan, A.A.; Dwivedi, Y.K.; Rana, N.P.; Williams, M.D. Consumer adoption of mobile banking in Jordan: Examining the role of usefulness, ease of use, perceived risk and self-efficacy. J. Enterp. Inf. Manag. 2016, 29, 118–139. [Google Scholar] [CrossRef]
- Chen, K.Y.; Chang, M.L. User acceptance of ‘near field communication’mobile phone service: An investigation based on the ‘unified theory of acceptance and use of technology’model. Serv. Ind. J. 2013, 33, 609–623. [Google Scholar] [CrossRef]
- Casey, T.; Wilson-Evered, E. Predicting uptake of technology innovations in online family dispute resolution services: An application and extension of the UTAUT. Comput. Hum. Behav. 2012, 28, 2034–2045. [Google Scholar] [CrossRef]
- Bere, A. Exploring determinants for mobile learning user acceptance and use: An application of UTAUT. In Proceedings of the 2014 11th International Conference on Information Technology: New Generations, Washington, DC, USA, 7–9 April 2014; IEEE: Piscataway, NJ, USA, 2014; pp. 84–90. [Google Scholar]
- Khare, A.; Khare, A.; Singh, S. Attracting shoppers to shop online—Challenges and opportunities for the Indian retail sector. J. Internet Commer. 2012, 11, 161–185. [Google Scholar] [CrossRef]
- Dholakia, R.R.; Uusitalo, O. Switching to electronic stores: Consumer characteristics and the perception of shopping benefits. Int. J. Retail Distrib. Manag. 2002, 30, 459–469. [Google Scholar] [CrossRef]
- Schewe, C.D.; Meredith, G.E.; Noble, S.M. Defining moments: Segmenting by cohorts. Mark. Manag. 2000, 9, 48–53. [Google Scholar]
- Mitchell, S. American Generations: Who They Are. How They Live, What They Think; New Strategists: Ithaca, NY, USA, 1998; pp. 85–86. [Google Scholar]
- Morgan, C.M.; Levy, D.J. Marketing to the Mindset of Boomers and Their Elders; Paramount Market Pub: Hong Kong, China, 2002. [Google Scholar]
- Kahle, L.R. Book Review: Marketing Research: An Applied Orientation. J. Mark. Res. 1994, 31, 137–139. [Google Scholar] [CrossRef]
- Showkat, N.; Parveen, H. Quantitative Methods: Survey; ePathchala: New Delhi, India, 2017. [Google Scholar]
- Buschmann, A. Conducting a Street-Intercept Survey in an Authoritarian Regime: The Case of Myanmar. Soc. Sci. Q. 2019, 100, 857–868. [Google Scholar] [CrossRef]
- Hair, J.F.; Anderson, R.E.; Babin, B.J.; Black, W.C. Multivariate Data Analysis: A Global Perspective, 7th ed.; Pearson Education: Boston, MA, USA, 2010. [Google Scholar]
- Tabachnick, B.G.; Fidell, L.S.; Ullman, J.B. Using Multivariate Statistics; Pearson: Boston, MA, USA, 2007; Volume 5, pp. 481–498. [Google Scholar]
- Kline, R.B. Principles and Practice of Structural Equation Modeling, 4th ed.; The Guilford Press: New York, NY, USA, 2018. [Google Scholar]
- Francis, T.; Hoefel, F. True Gen’: Generation Z and Its Implications for Companies; McKinsey & Company: Hong Kong, China, 2018; p. 12. [Google Scholar]
- Lissitsa, S.; Kol, O. Generation X vs. Generation Y–A decade of online shopping. J. Retail. Consum. Serv. 2016, 31, 304–312. [Google Scholar] [CrossRef]
- Reisenwitz, T.H.; Iyer, R. Differences in generation x and generation y: Implications for the organization and marketers. Mark. Manag. J. 2009, 19, 91–103. [Google Scholar]
- Peralta, E. Generation X: The Small but Financially Powerful Generation. Centro. Available online: https://goo.gl/wPYtfv (accessed on 20 December 2019).
- Lester, D.H.; Forman, A.M.; Loyd, D. Internet Shopping and Buying Behavior of College Students. Serv. Mark. Q. 2005, 27, 123–138. [Google Scholar] [CrossRef]
- Sullivan, P.; Heitmeyer, J. Looking at Gen Y shopping preferences and intentions: Exploring the role of experience and apparel involvement. Int. J. Consum. Stud. 2008, 32, 285–295. [Google Scholar] [CrossRef]
- Chakraborty, T.; Balakrishnan, J. Exploratory tendencies in consumer behaviour in online buying across gen X, gen Y and baby boomers. Int. J. Value Chain Manag. 2017, 8, 135–150. [Google Scholar] [CrossRef]
- Khan, N.; Hui, L.H.; Chen, T.B.; Hoe, H.Y. Impulse Buying Behaviour of Generation Y in Fashion Retail. Int. J. Bus. Manag. 2015, 11, 144. [Google Scholar] [CrossRef] [Green Version]
- Mohr, K.A.; Mohr, E.S. Understanding Generation Z students to promote a contemporary learning environment. J. Empower. Teach. Excell. 2017, 1, 9. [Google Scholar]
- Keep It Usable. The Future of E-Commerce: Generation Z. Available online: https://www.keepitusable.com/blog/the-future-of-ecommerce-generation-z/ (accessed on 20 December 2019).
- Dimock, M. Defining generations: Where Millennials end and Generation Z begins. Pew Res. Cent. 2019, 17, 1–7. [Google Scholar]
- World Health Organization. World Report on Ageing and Health; World Health Organization: Geneva, Switzerland, 2015. [Google Scholar]
- Donner, A.; Klar, N. Statistical considerations in the design and analysis of community intervention trials. J. Clin. Epidemiol. 1996, 49, 435–439. [Google Scholar] [CrossRef]
- Eisen, M.B.; Spellman, P.T.; Brown, P.O.; Botstein, D. Cluster analysis and display of genome-wide expression patterns. Proc. Natl. Acad. Sci. USA 1998, 95, 14863–14868. [Google Scholar] [CrossRef] [PubMed] [Green Version]
- Aldenderfer, M.S.; Blashfield, R.K. Cluster Analysis; Newberry Park: London, UK, 1984. [Google Scholar]
- Podsakoff, P.M.; MacKenzie, S.B.; Podsakoff, N.P. Sources of method bias in social science research and recommendations on how to control it. Annu. Rev. Psychol. 2012, 63, 539–569. [Google Scholar] [CrossRef] [PubMed] [Green Version]
- Byrne, B.M. Structural Equation Modeling with AMOS: Basic Concepts, Applications, and Programming, 2nd ed.; Multivariate Applications Series 1; Routledge: Milton, UK, 2016. [Google Scholar]
- Anderson, J.C.; Gerbing, D.W. Structural equation modeling in practice: A review and recommended two-step approach. Psychol. Bull. 1988, 103, 411. [Google Scholar] [CrossRef]
- Hair, J.F. Multivariate Data Analysis; Pearson: Upper Saddle River, NJ, USA, 1998. [Google Scholar]
- Fornell, C.; Larcker, D.F. Structural Equation Models with Unobservable Variables and Measurement Error: Algebra and Statistics. J. Mark. Res. 1981, 18, 382–388. [Google Scholar] [CrossRef]
- Henseler, J.; Ringle, C.M.; Sarstedt, M. A new criterion for assessing discriminant validity in variance-based structural equation modeling. J. Acad. Mark. Sci. 2015, 43, 115–135. [Google Scholar] [CrossRef] [Green Version]
- Phonthanukitithaworn, C.; Naruetharadhol, P.; Gebsombut, N.; Chanavirut, R.; Onsa-ard, W.; Joomwanta, P.; Chanyuan, Z.; Ketkaew, C. An investigation of the relationship among medical center’s image, service quality, and patient loyalty. SAGE Open 2020, 10, 2158244020982304. [Google Scholar] [CrossRef]
- Hu, L.T.; Bentler, P.M. Cutoff criteria for fit indexes in covariance structure analysis: Conventional criteria versus new alternatives. Struct. Equ. Model. Multidiscip. J. 1999, 6, 1–55. [Google Scholar] [CrossRef]
- Yu, S.-F. Price perception of online airline ticket shoppers. J. Air Transp. Manag. 2008, 14, 66–69. [Google Scholar] [CrossRef]
- Bialosiewicz, S.; Murphy, K.; Berry, T. An introduction to measurement invariance testing: Resource packet for participants. Am. Eval. Assoc. 2013, 27, 1–37. [Google Scholar]
- Byrne, B.M.; Shavelson, R.J.; Muthén, B. Testing for the equivalence of factor covariance and mean structures: The issue of partial measurement invariance. Psychol. Bull. 1989, 105, 456. [Google Scholar] [CrossRef]
- Browne, M.W.; Cudeck, R. Alternative ways of assessing model fit. Sociol. Methods Res. 1992, 21, 230–258. [Google Scholar] [CrossRef]
- Cotte, J.; Chowdhury, T.G.; Ratneshwar, S.; Ricci, L.M. Pleasure or utility? Time planning style and Web usage behaviors. J. Interact. Mark. 2006, 20, 45–57. [Google Scholar] [CrossRef]
- Zeng, F.; Yang, Z.; Li, Y.; Fam, K.-S. Small business industrial buyers’ price sensitivity: Do service quality dimensions matter in business markets? Ind. Mark. Manag. 2011, 40, 395–404. [Google Scholar] [CrossRef]


| Variable Constructs | Indicators | Definitions | Source/Reference |
|---|---|---|---|
| Perceived Usefulness | PU1 | Perceived usefulness was defined as the level to which utilizing technology will prepare customers to execute specific activities. | [12,15,16] |
| PU2 | |||
| PU3 | |||
| Perceived Ease of Use | PE1 | Perceived ease of use is described as the degree of ease related to the utilization of technology. | [12] |
| PE2 | |||
| PE3 | |||
| Price Sensitivity | PS1 | Price sensitivity is described as the scope of consciousness and response exhibited by customers when discovering differences in prices of goods and services. | [31] |
| PS2 | |||
| PS3 | |||
| Hedonic Motivation | HM1 | Hedonic motivation was described as the pleasure or enjoyment acquired from employing a technology. | [6,16,39] |
| HM2 | |||
| HM3 | |||
| Behavioral Intention | BI1 | Behavioral intention refers to how an individual has prepared conscious objectives regarding whether to conduct a specified future behavior. | [47] |
| BI2 | |||
| BI3 |
| Segment 1 | Segment 2 | Total | Significance | |||||
|---|---|---|---|---|---|---|---|---|
| Demographic Profile | Measure | n | % | n | % | n | % | Chi-Square Test |
| Segment Size | 1504 | 49 | 1560 | 51 | 3064 | 100 | ||
| Age | Gen X | 887 | 29 | 0 | 0 | 887 | 29 | *** |
| Gen Y | 617 | 20 | 1255 | 41 | 1872 | 61 | *** | |
| Gen Z | 0 | 0 | 305 | 10 | 305 | 10 | *** | |
| Income | Less than 25,000 Baht | 288 | 9 | 1486 | 49 | 1774 | 58 | *** |
| More than 25,000 Baht | 1216 | 40 | 74 | 2 | 1290 | 42 | *** | |
| Psychographic Profile | Measure | Segment 1 | Segment 2 | Mean Diff | t | t-Test | ||
|---|---|---|---|---|---|---|---|---|
| Mean | SD | Mean | SD | |||||
| Perceived Usefulness | PU1 | 3.44 | 0.62 | 3.53 | 0.60 | 0.09 | −4.02 | *** |
| PU2 | 3.55 | 0.70 | 3.65 | 0.72 | 0.10 | −3.99 | *** | |
| PU3 | 3.48 | 0.71 | 3.59 | 0.69 | 0.12 | −4.59 | *** | |
| Perceived Ease of Use | PE1 | 3.14 | 0.77 | 3.32 | 0.76 | 0.18 | −6.59 | *** |
| PE2 | 3.23 | 0.94 | 3.48 | 0.80 | 0.25 | −8.01 | *** | |
| PE3 | 3.20 | 0.95 | 3.50 | 0.81 | 0.30 | −9.34 | *** | |
| Price Sensitivity | PS1 | 3.13 | 0.90 | 3.40 | 0.82 | 0.26 | −8.48 | *** |
| PS2 | 3.20 | 0.89 | 3.35 | 0.85 | 0.15 | −4.71 | *** | |
| PS3 | 3.19 | 0.93 | 3.42 | 0.86 | 0.23 | −7.05 | *** | |
| Behavioral Intention | BI1 | 3.10 | 0.94 | 3.28 | 0.85 | 0.18 | −5.59 | *** |
| BI2 | 3.21 | 0.96 | 3.36 | 0.90 | 0.15 | −4.34 | *** | |
| BI3 | 3.37 | 0.90 | 3.51 | 0.79 | 0.14 | −4.65 | *** | |
| Hedonic Motivation | HM1 | 3.11 | 0.91 | 3.34 | 0.82 | 0.23 | −7.26 | *** |
| HM2 | 3.35 | 0.78 | 3.41 | 0.73 | 0.06 | −2.15 | 0.032 | |
| HM3 | 3.19 | 0.86 | 3.31 | 0.78 | 0.11 | −3.86 | *** | |
| Fit Indices | Value | Threshold | Assessment |
|---|---|---|---|
| p-value | ≤0.001 | Acceptable for complex model | |
| CFI | 0.939 | >0.900 | Pass |
| IFI | 0.940 | >0.900 | Pass |
| TLI | 0.921 | >0.900 | Pass |
| NFI | 0.937 | >0.900 | Pass |
| GFI | 0.927 | >0.900 | Pass |
| RMSEA | 0.085 | <0.100 | Pass |
| Construct | Indicator | Loading | p-Value | Cronbach’s Alphas (Threshold = 0.70) | AVE (Threshold = 0.50) | CR (Threshold = 0.70) |
|---|---|---|---|---|---|---|
| Perceived Usefulness | PU1 | 0.671 | *** | 0.724 | 0.456 | 0.715 |
| PU2 | 0.72 | *** | ||||
| PU3 | 0.632 | *** | ||||
| Perceived Ease of Use | PE1 | 0.619 | *** | 0.705 | 0.439 | 0.7 |
| PE2 | 0.621 | *** | ||||
| PE3 | 0.74 | *** | ||||
| Price Sensitivity | PS1 | 0.739 | *** | 0.821 | 0.597 | 0.816 |
| PS2 | 0.735 | *** | ||||
| PS3 | 0.84 | *** | ||||
| Behavioral Intention | BI1 | 0.818 | *** | 0.841 | 0.64 | 0.841 |
| BI2 | 0.878 | *** | ||||
| BI3 | 0.692 | *** | ||||
| Hedonic Motivation | HM1 | 0.812 | *** | 0.815 | 0.601 | 0.817 |
| HM2 | 0.637 | *** | ||||
| HM2 | 0.859 | *** |
| Fornell and Larcker Criterion | |||||
|---|---|---|---|---|---|
| HM | BI | PS | PE | PU | |
| HM | 0 . 775 | - | - | - | - |
| BI | 0.466 | 0 . 800 | - | - | - |
| PS | 0.416 | 0.474 | 0 . 773 | - | - |
| PE | 0.307 | 0.350 | 0.330 | 0 . 663 | - |
| PU | 0.241 | 0.274 | 0.250 | 0.213 | 0 . 675 |
| HTMT Ratio Approach | |||||
| HM | - | - | - | - | - |
| BI | 0.787 | - | - | - | - |
| PS | 0.804 | 0.891 | - | - | - |
| PE | 0.803 | 0.892 | 0.965 | - | - |
| PU | 0.712 | 0.789 | 0.827 | 0.973 | - |
| Fit Indices | Value | Threshold | Assessment |
|---|---|---|---|
| p-value | ≤0.001 | Acceptable for complex model | |
| CFI | 0.938 | >0.90 | Pass |
| IFI | 0.938 | >0.90 | Pass |
| TLI | 0.919 | >0.90 | Pass |
| NFI | 0.935 | >0.90 | Pass |
| GFI | 0.925 | >0.90 | Pass |
| RMSEA | 0.086 | <0.10 | Pass |
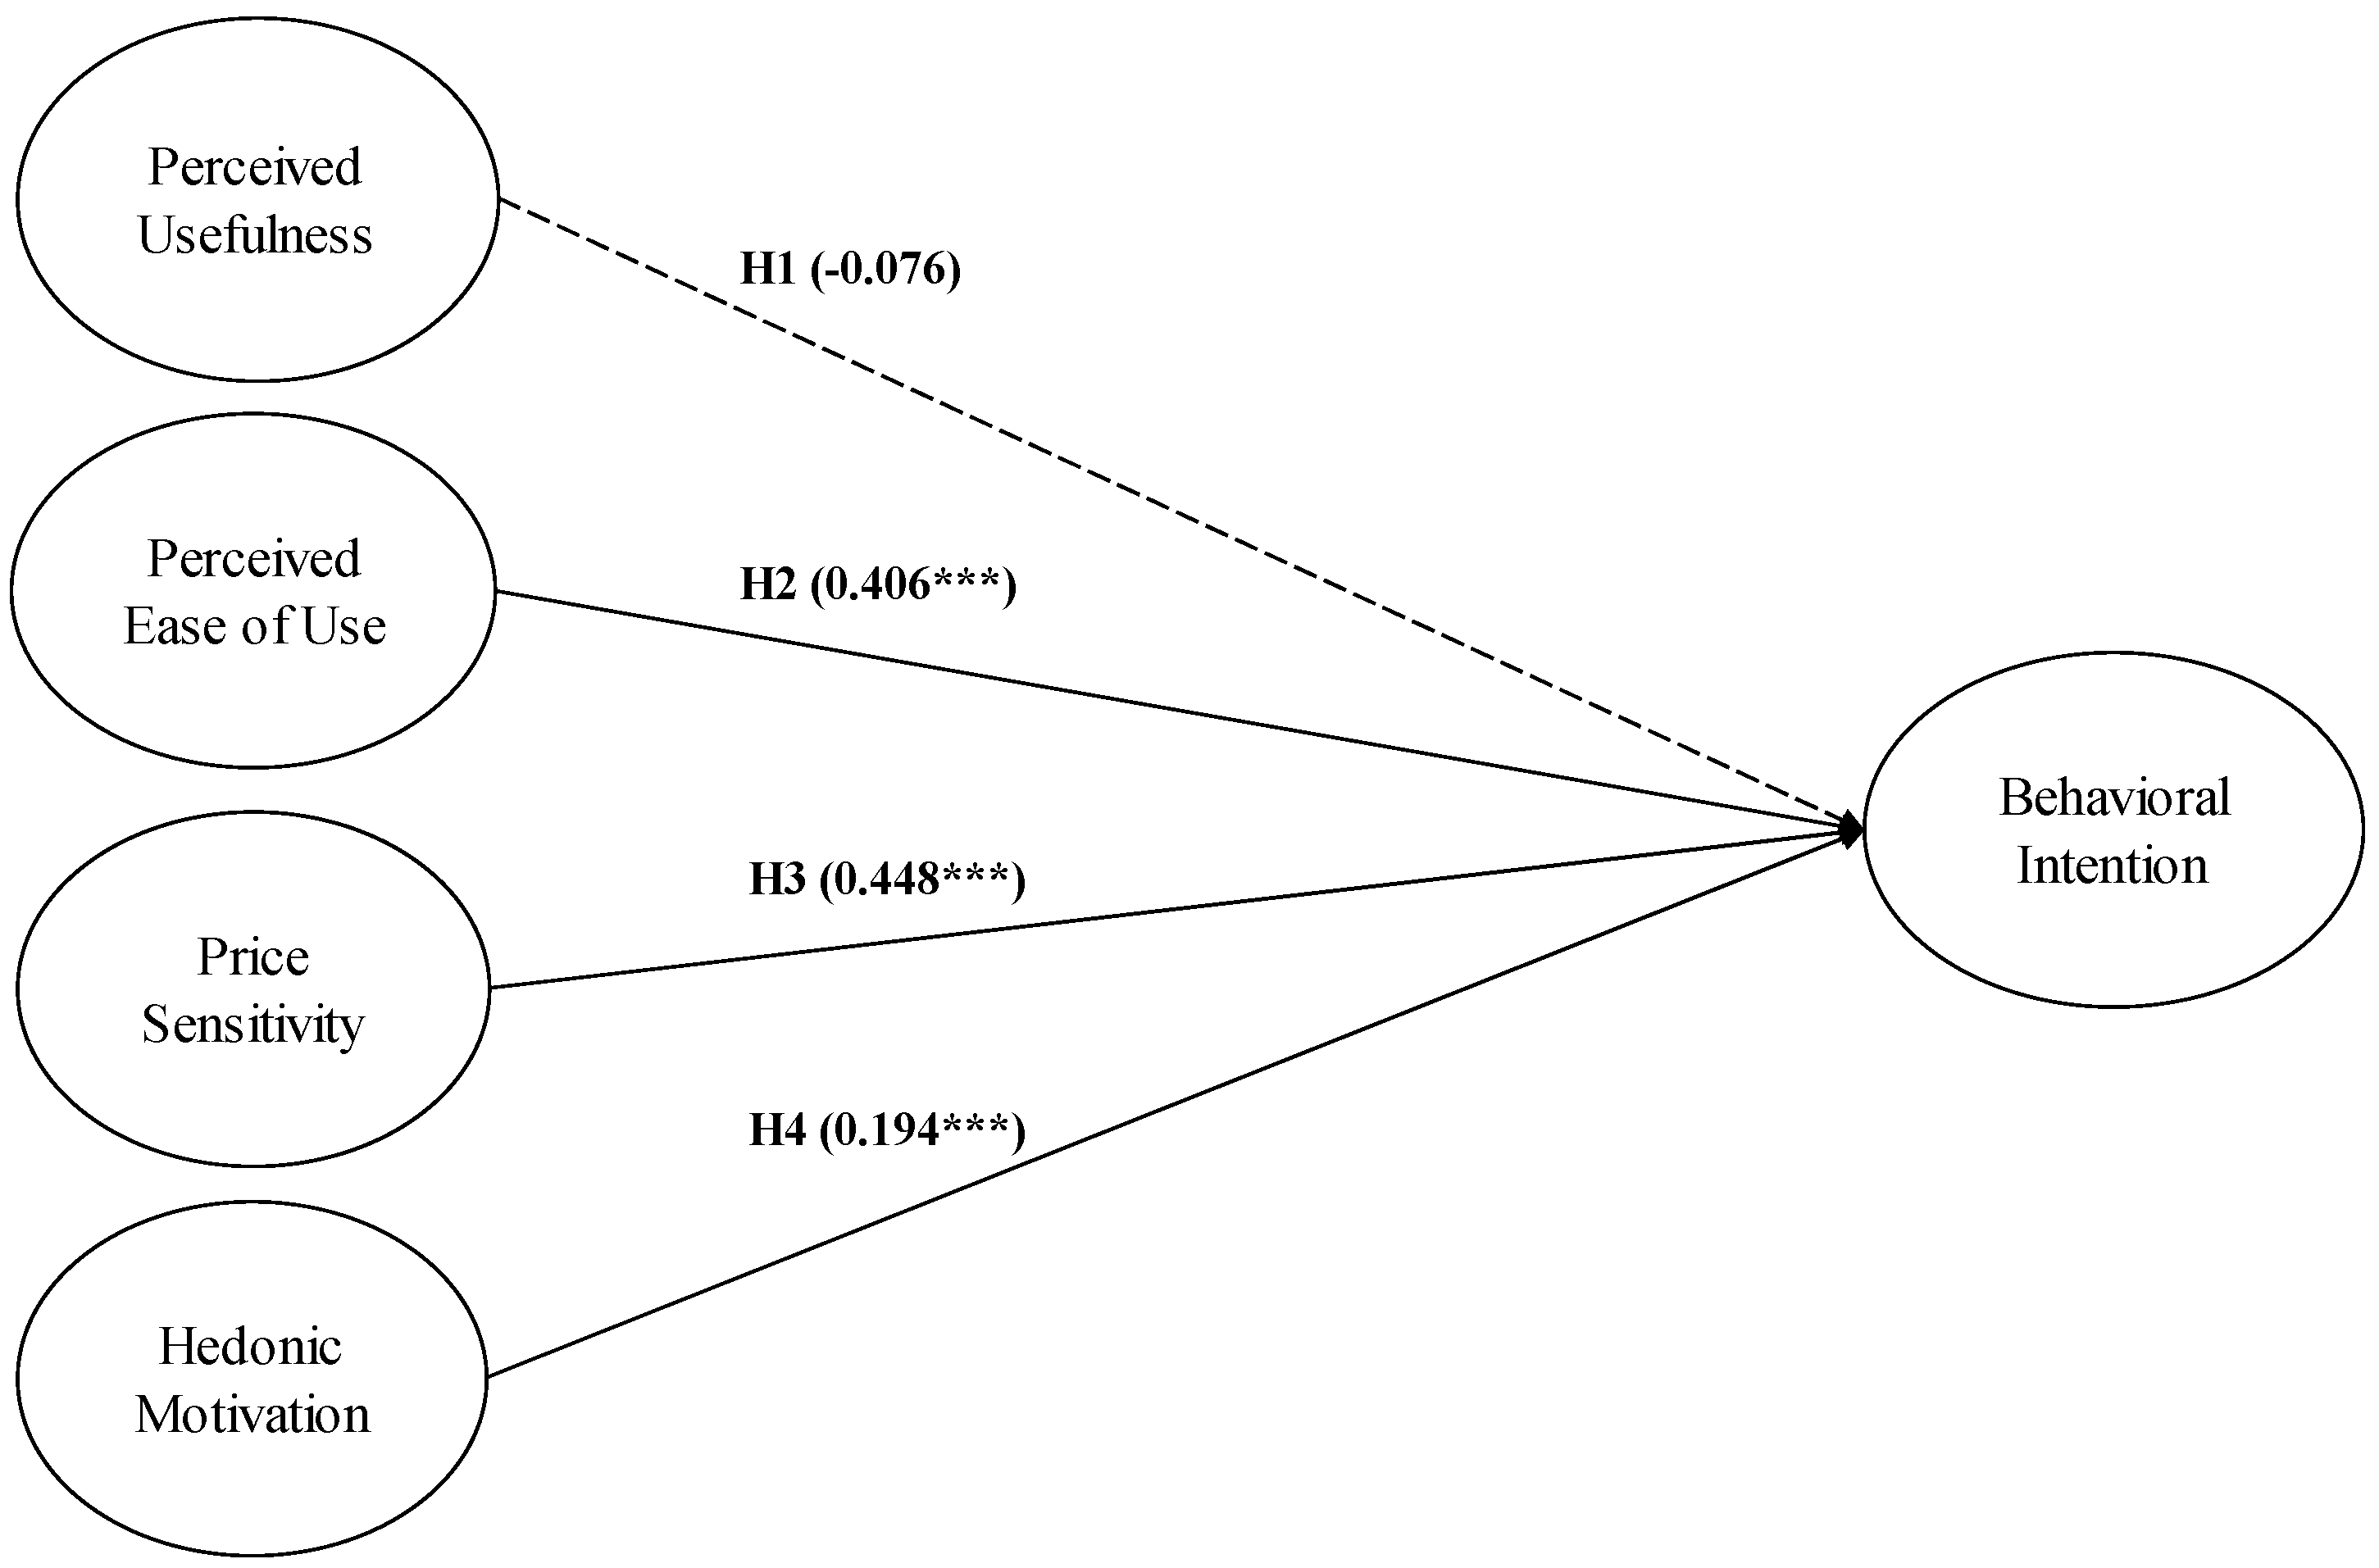
| Hypothesis | Endogenous Variable | Exogenous Variable | Standardized Estimate | p-Value | Result |
|---|---|---|---|---|---|
| H1 | Perceived usefulness | Behavioral intention | −0.076 | 0.183 | Rejected |
| H2 | Perceived ease of use | Behavioral intention | 0.406 | *** | Supported |
| H3 | Price sensitivity | Behavioral intention | 0.448 | *** | Supported |
| H4 | Hedonic motivation | Behavioral intention | 0.194 | *** | Supported |
| Fit Indices | Configural Invariance | Metric Invariance | Scalar Invariance | Threshold |
|---|---|---|---|---|
| p-value | ≤0.001 | ≤0.001 | ≤0.001 | |
| CFI | 0.919 | 0.917 | 0.914 | >9.00 |
| IFI | 0.919 | 0.917 | 0.917 | >0.90 |
| NFI | 0.914 | 0.912 | 0.908 | >0.90 |
| GFI | 0.903 | 0.901 | 0.896 | >0.90 |
| RMSEA | 0.070 | 0.069 | 0.067 | <0.10 |
| Acceptable | Acceptable | Not Passed |
| Fit Indices | Value | Threshold | Assessment |
|---|---|---|---|
| p-value | ≤0.001 | Acceptable for complex model | |
| CFI | 0.916 | >0.90 | Pass |
| IFI | 0.917 | >0.90 | Pass |
| NFI | 0.912 | >0.90 | Pass |
| GFI | 0.899 | >0.90 | Acceptable |
| RMSEA | 0.071 | <0.10 | Pass |
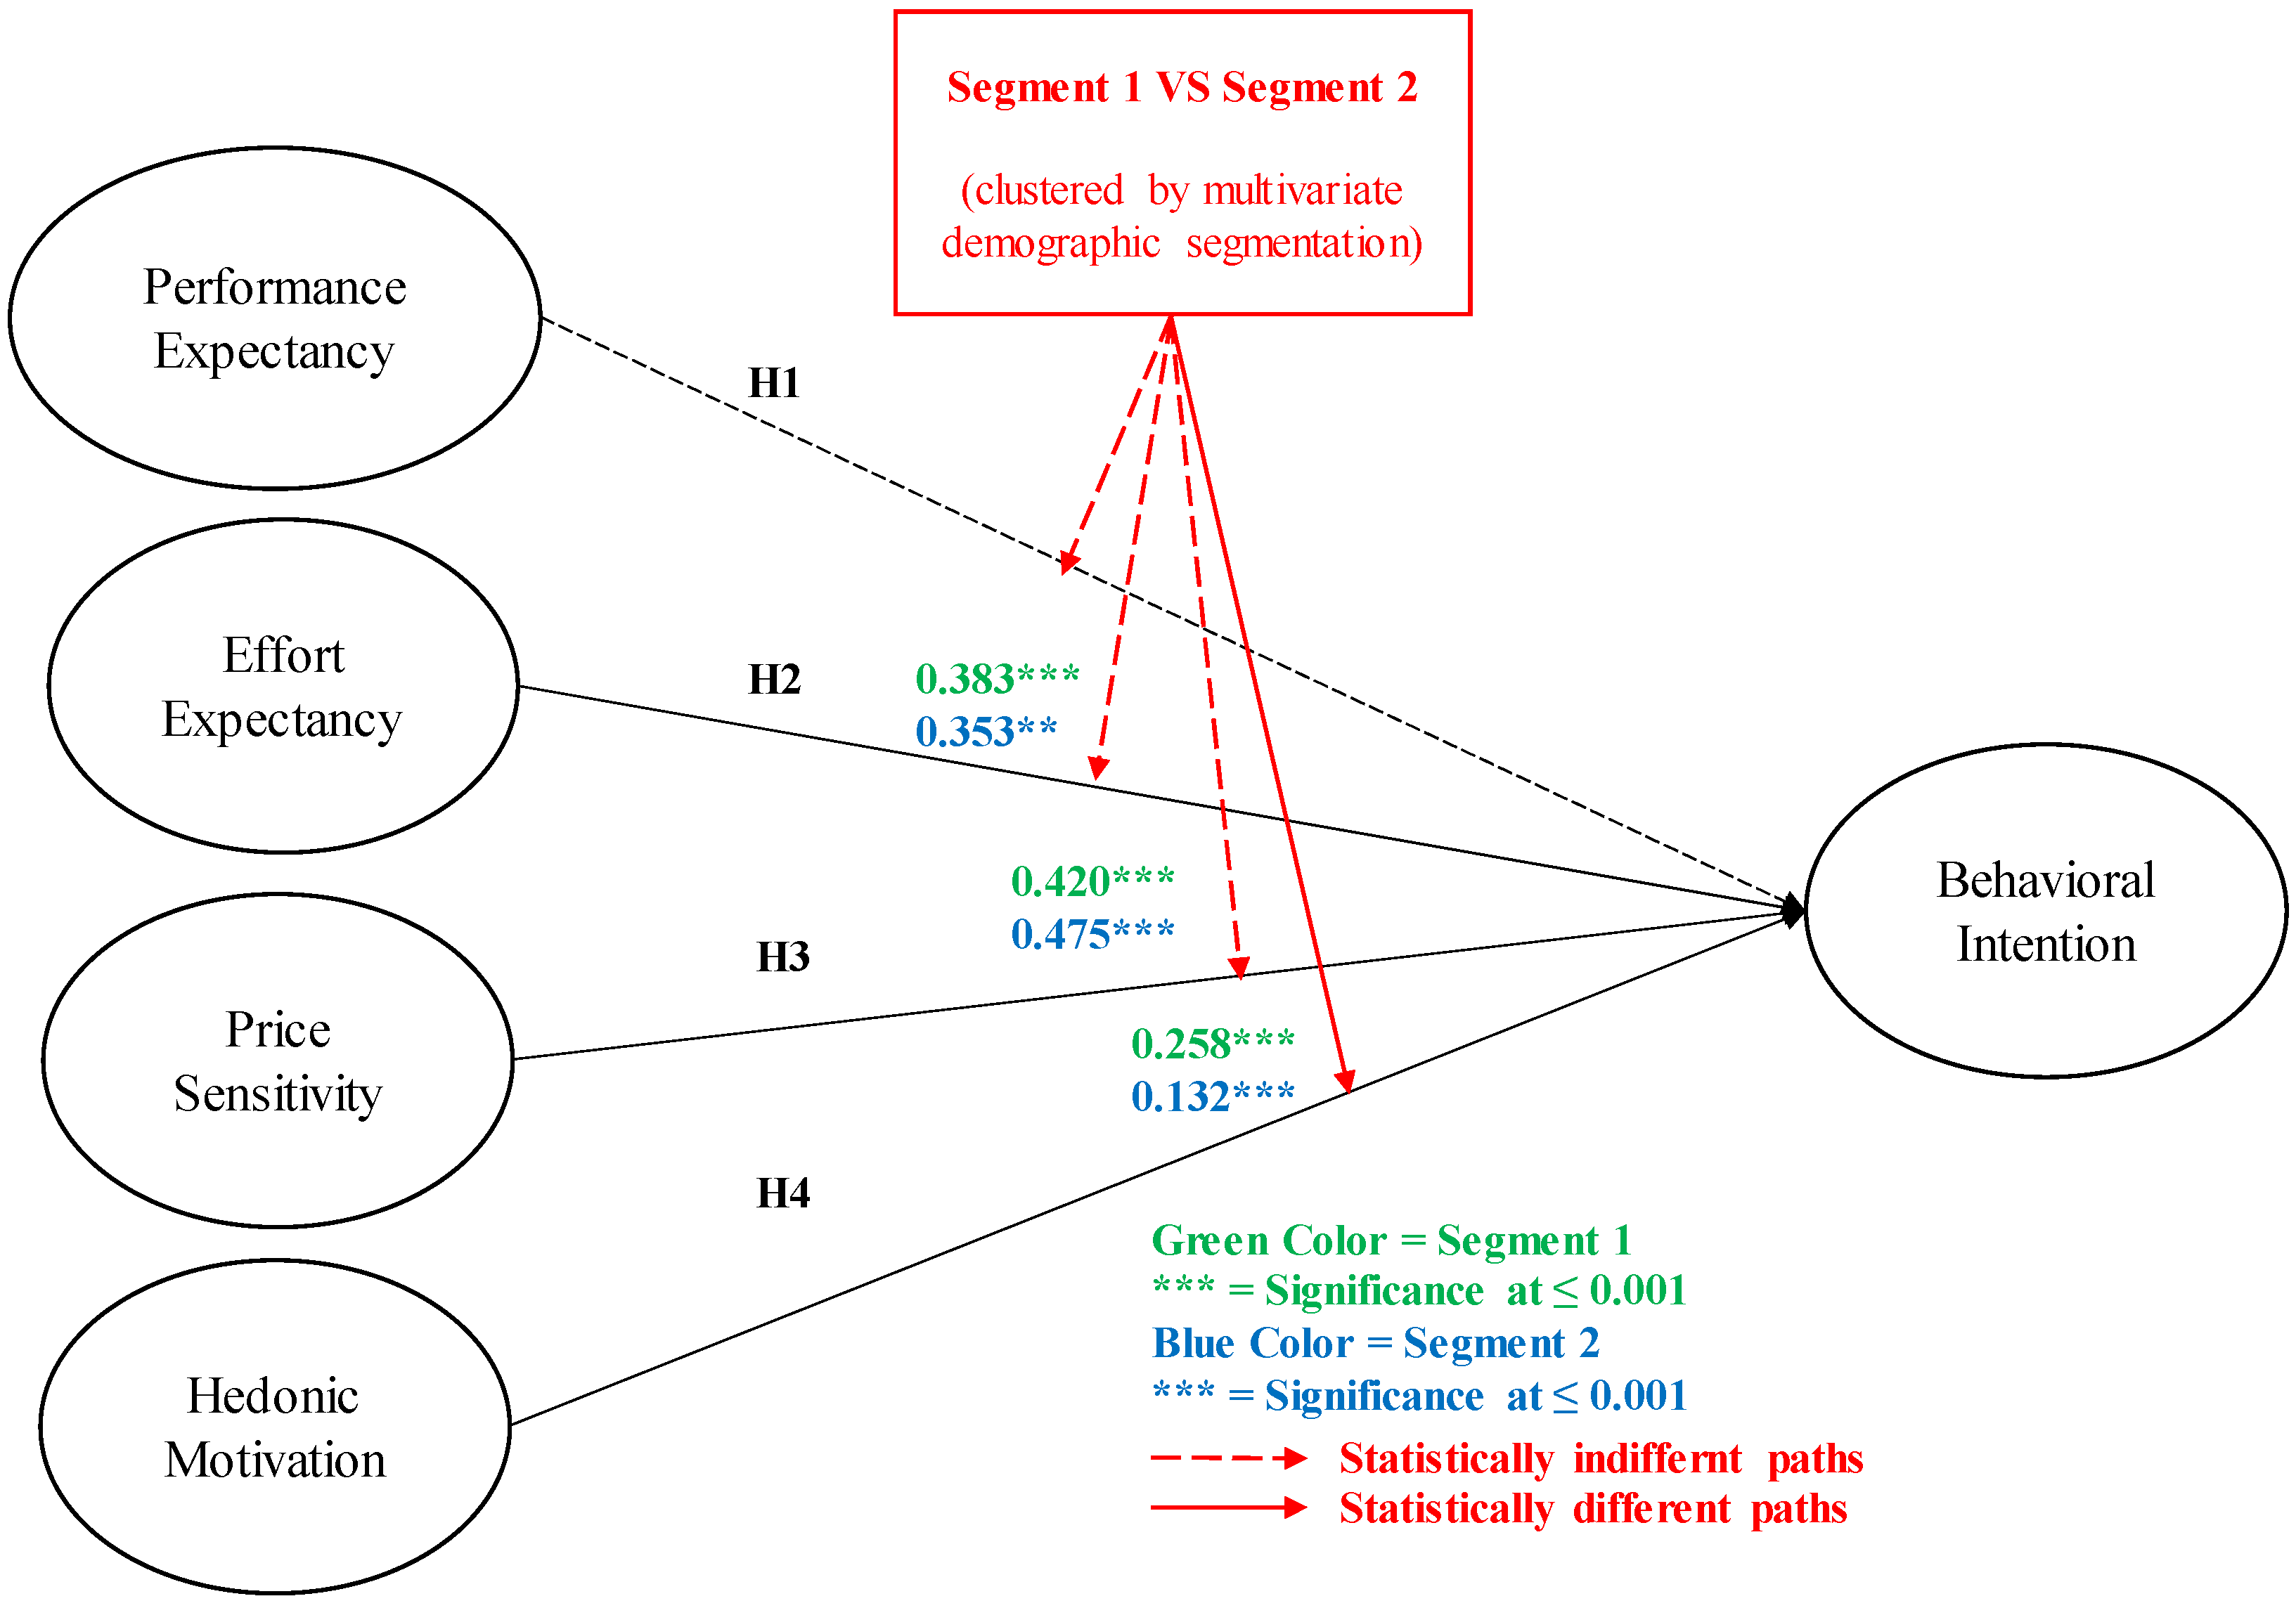
| Hypothesis | Relationship | Segment 1 | Segment 2 | Critical Ratio Difference | Threshold | ||||
|---|---|---|---|---|---|---|---|---|---|
| Std. Est. | p-Value | Std. Est. | p-Value | ||||||
| H1 | PU | → | BI | −0.097 | 0.093 | 0.024 | 0.852 | 0.839 | |1.96| |
| H2 | PE | → | BI | 0.383 | *** | 0.353 | 0.001 ** | −0.805 | |1.96| |
| H3 | PS | → | BI | 0.420 | *** | 0.475 | *** | −0.828 | |1.96| |
| H4 | HM | → | BI | 0.258 | *** | 0.132 | *** | −2.116 ** | |1.96| |
Publisher’s Note: MDPI stays neutral with regard to jurisdictional claims in published maps and institutional affiliations. |
© 2022 by the authors. Licensee MDPI, Basel, Switzerland. This article is an open access article distributed under the terms and conditions of the Creative Commons Attribution (CC BY) license (https://creativecommons.org/licenses/by/4.0/).
Share and Cite
Naruetharadhol, P.; Wongsaichia, S.; Zhang, S.; Phonthanukitithaworn, C.; Ketkaew, C. Understanding Consumer Buying Intention of E-Commerce Airfares Based on Multivariate Demographic Segmentation: A Multigroup Structural Equation Modeling Approach. Sustainability 2022, 14, 8997. https://doi.org/10.3390/su14158997
Naruetharadhol P, Wongsaichia S, Zhang S, Phonthanukitithaworn C, Ketkaew C. Understanding Consumer Buying Intention of E-Commerce Airfares Based on Multivariate Demographic Segmentation: A Multigroup Structural Equation Modeling Approach. Sustainability. 2022; 14(15):8997. https://doi.org/10.3390/su14158997
Chicago/Turabian StyleNaruetharadhol, Phaninee, Sasichakorn Wongsaichia, Shenying Zhang, Chanchai Phonthanukitithaworn, and Chavis Ketkaew. 2022. "Understanding Consumer Buying Intention of E-Commerce Airfares Based on Multivariate Demographic Segmentation: A Multigroup Structural Equation Modeling Approach" Sustainability 14, no. 15: 8997. https://doi.org/10.3390/su14158997
APA StyleNaruetharadhol, P., Wongsaichia, S., Zhang, S., Phonthanukitithaworn, C., & Ketkaew, C. (2022). Understanding Consumer Buying Intention of E-Commerce Airfares Based on Multivariate Demographic Segmentation: A Multigroup Structural Equation Modeling Approach. Sustainability, 14(15), 8997. https://doi.org/10.3390/su14158997