
An Interpretable Framework for an Efficient Analysis of Students’ Academic Performance

 , , , and
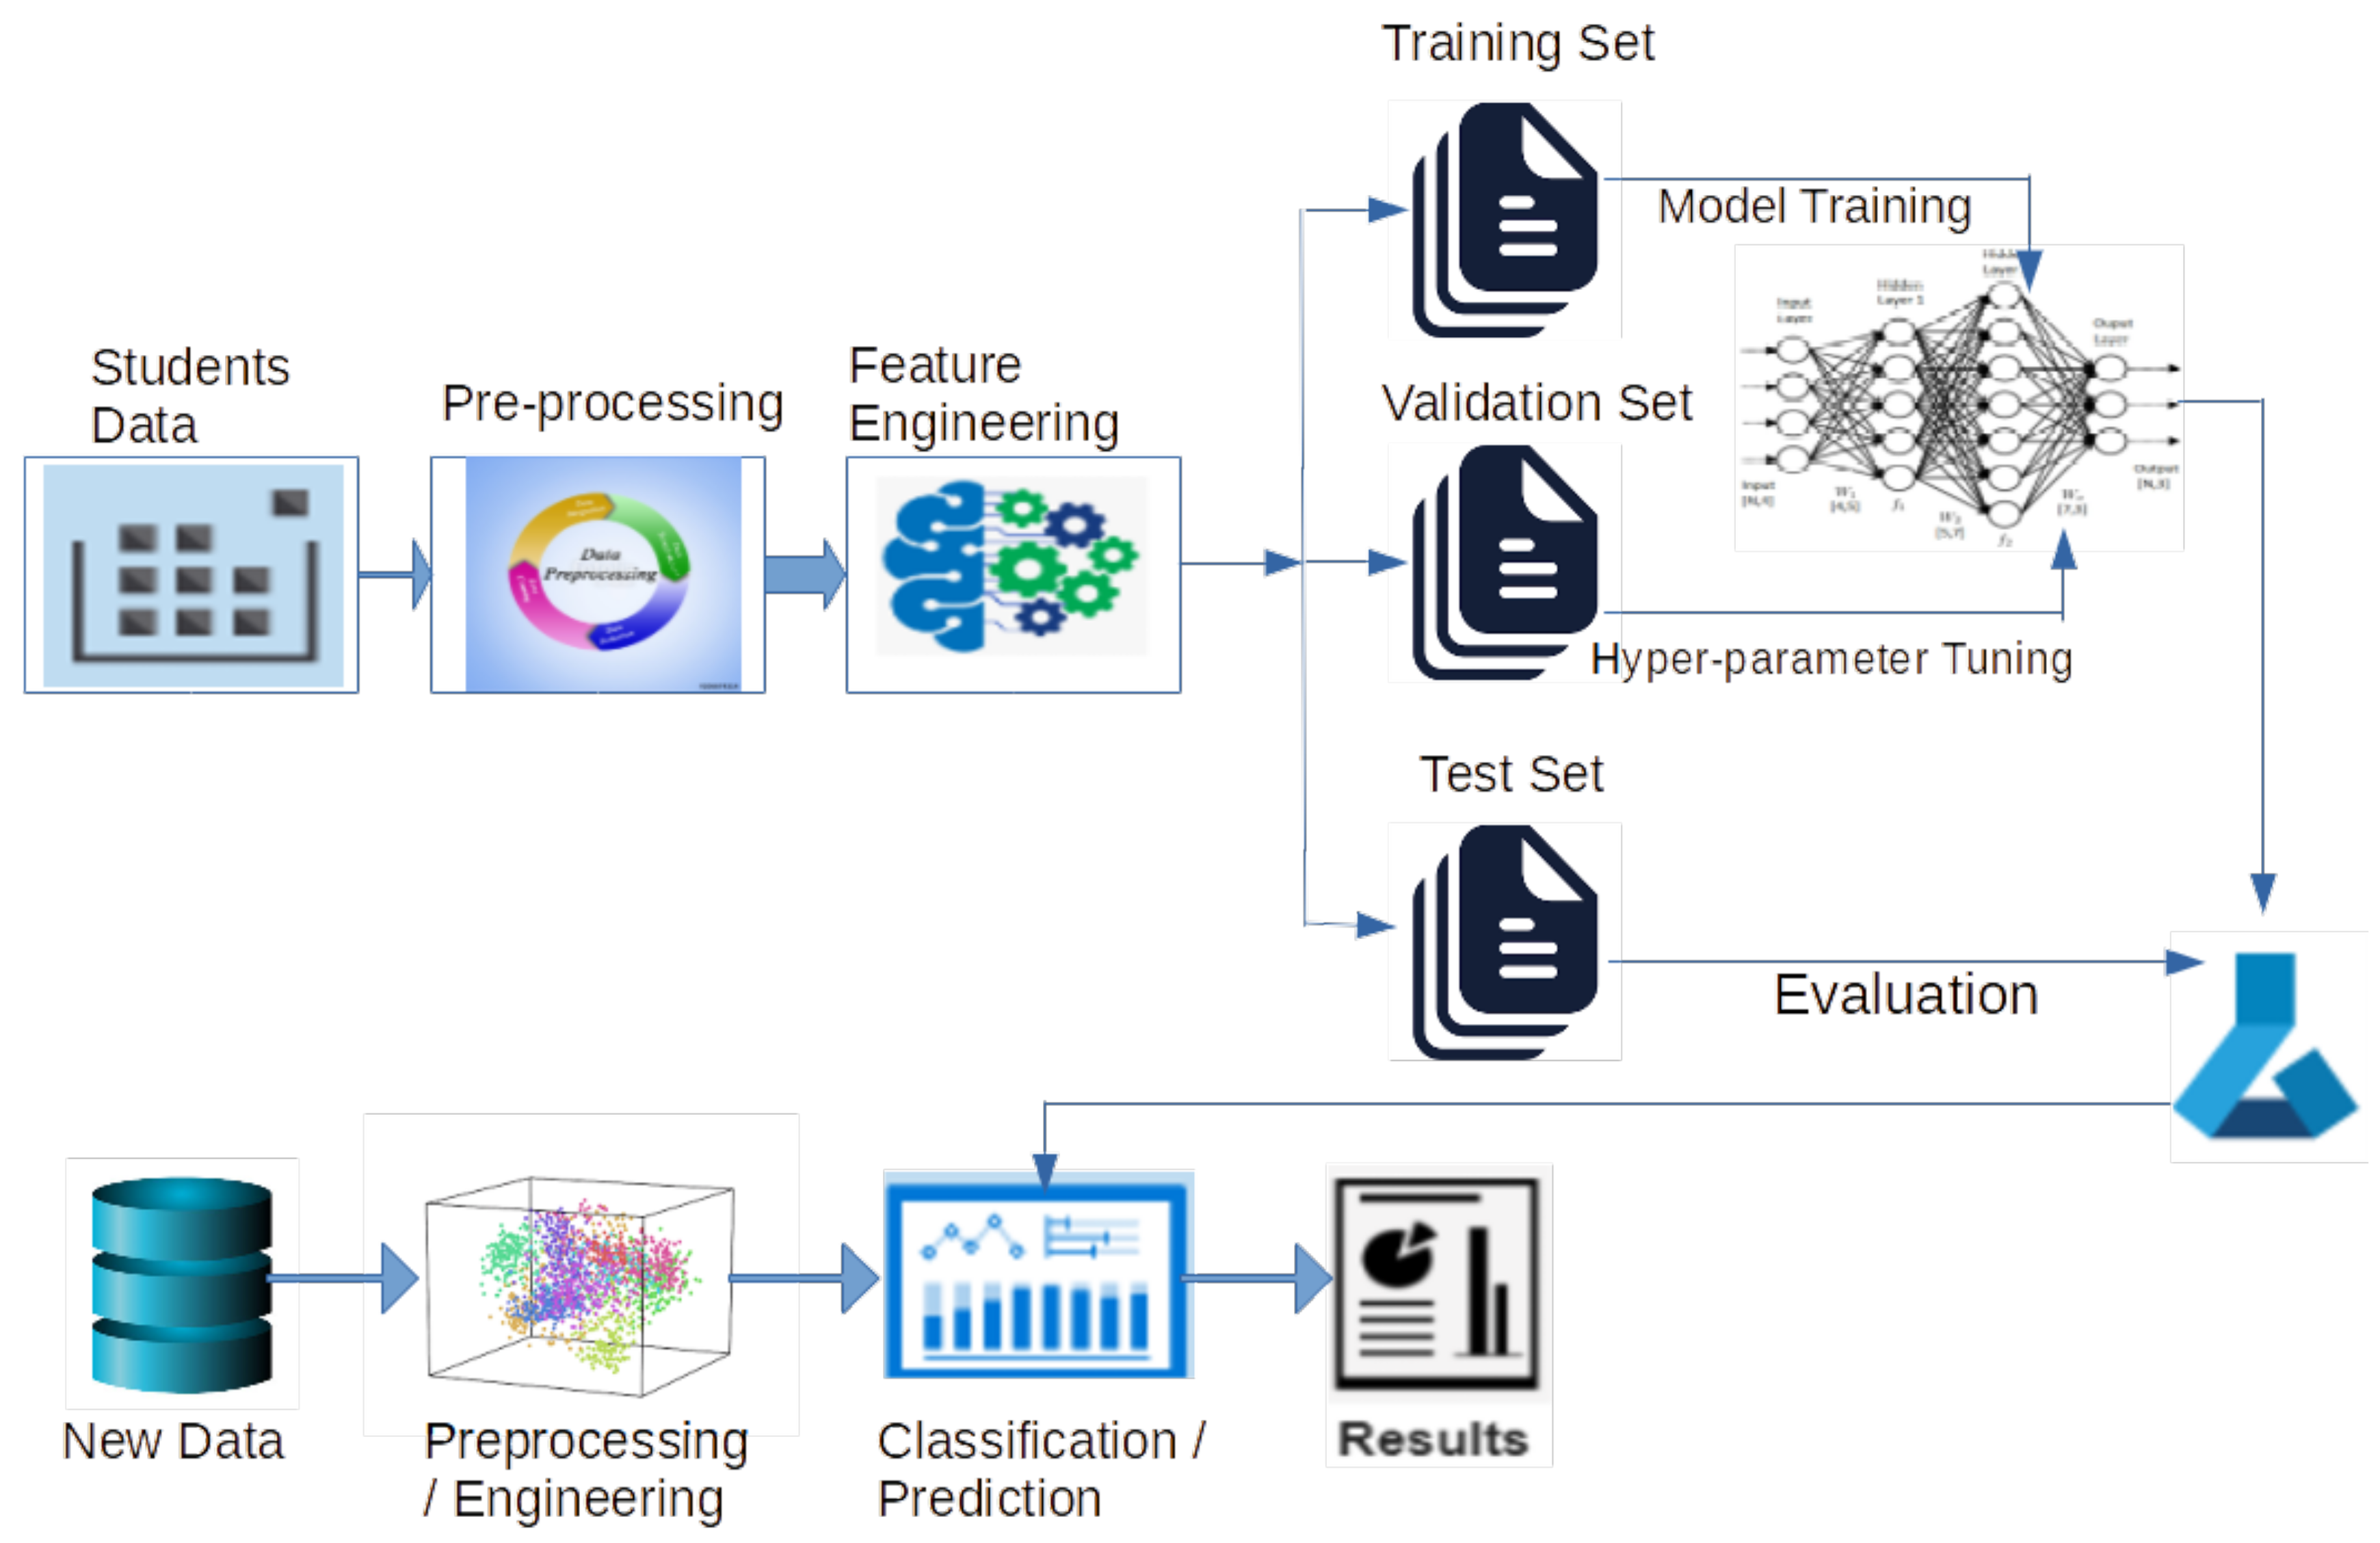
Abstract
:1. Introduction
2. Related Work
3. Machine Learning in Academic Analytics
3.1. Academic Analytics and Classification
3.2. Academic Analytics and Regression
3.3. Association Rules and Clustering in Academic Analytics
4. Proposed Framework and Implementation Details
4.1. Data Preparation and Pre-Processing
4.2. Data Encoding
- OrdinalEncoder to encode binary categorical variables;
- OneHotEncoder to encode nominal categorical variables;
- StandardScaler to standardize numerical variables.
4.3. Data Scaling
4.4. Feature Engineering
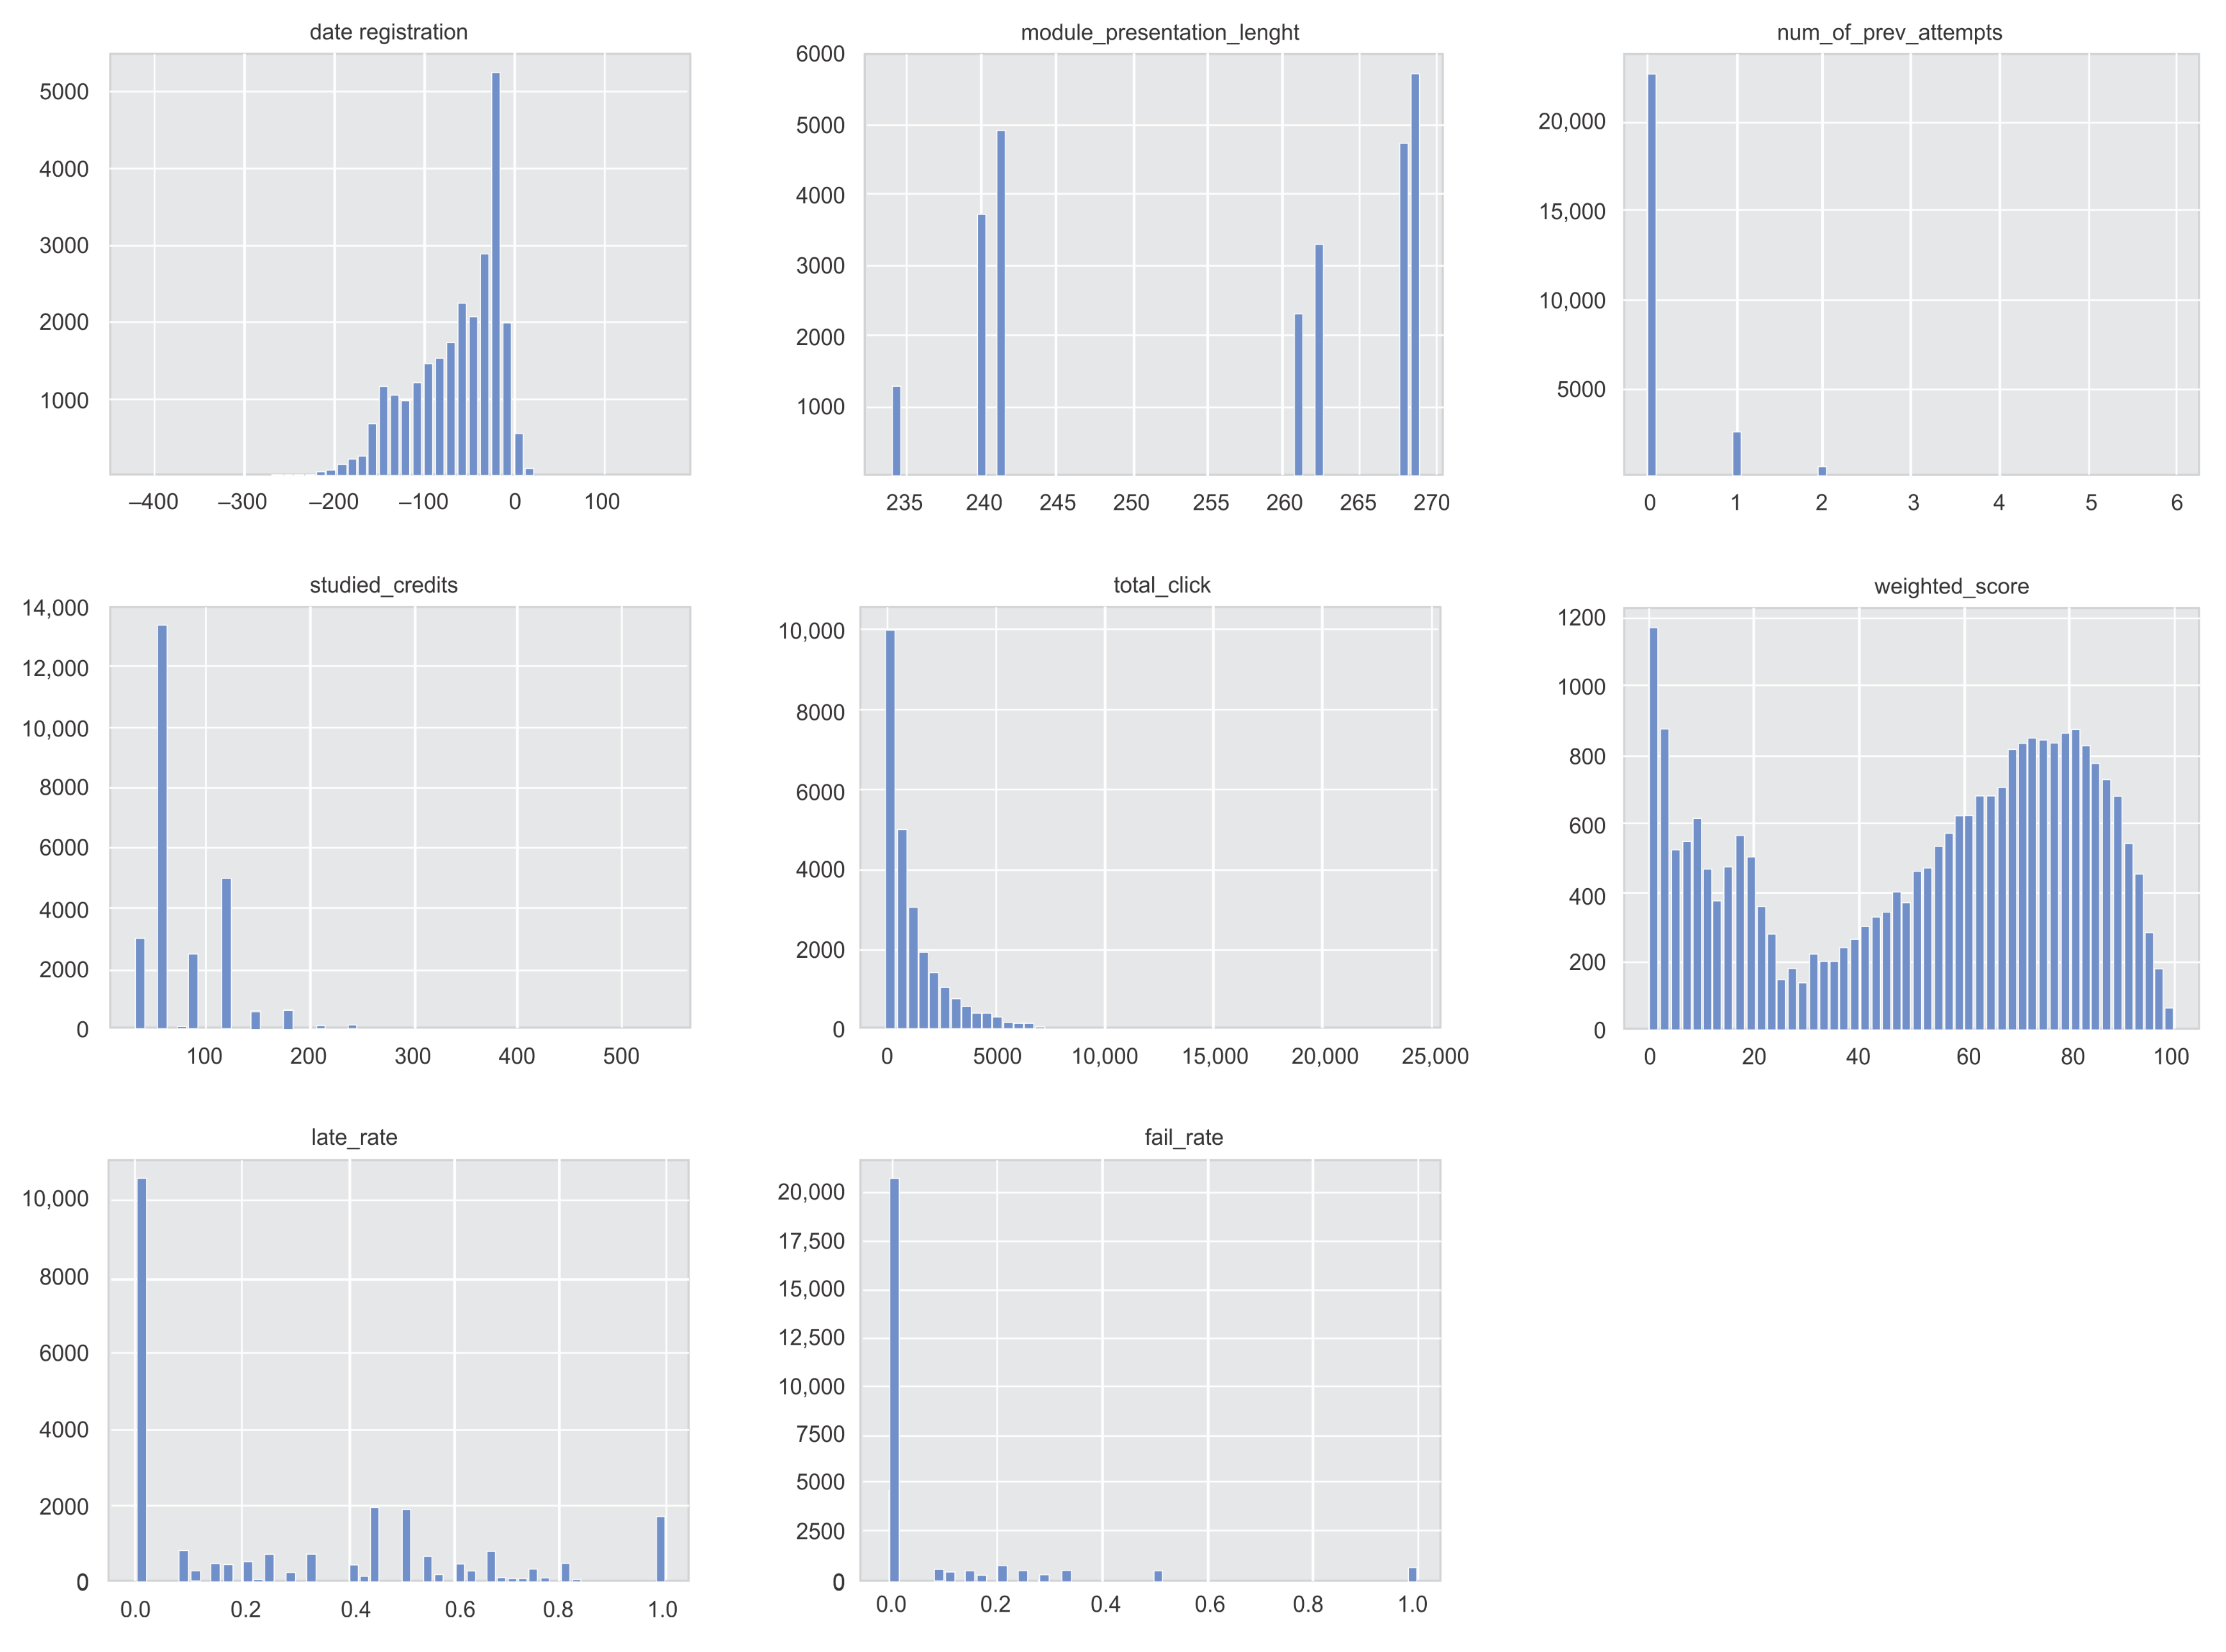
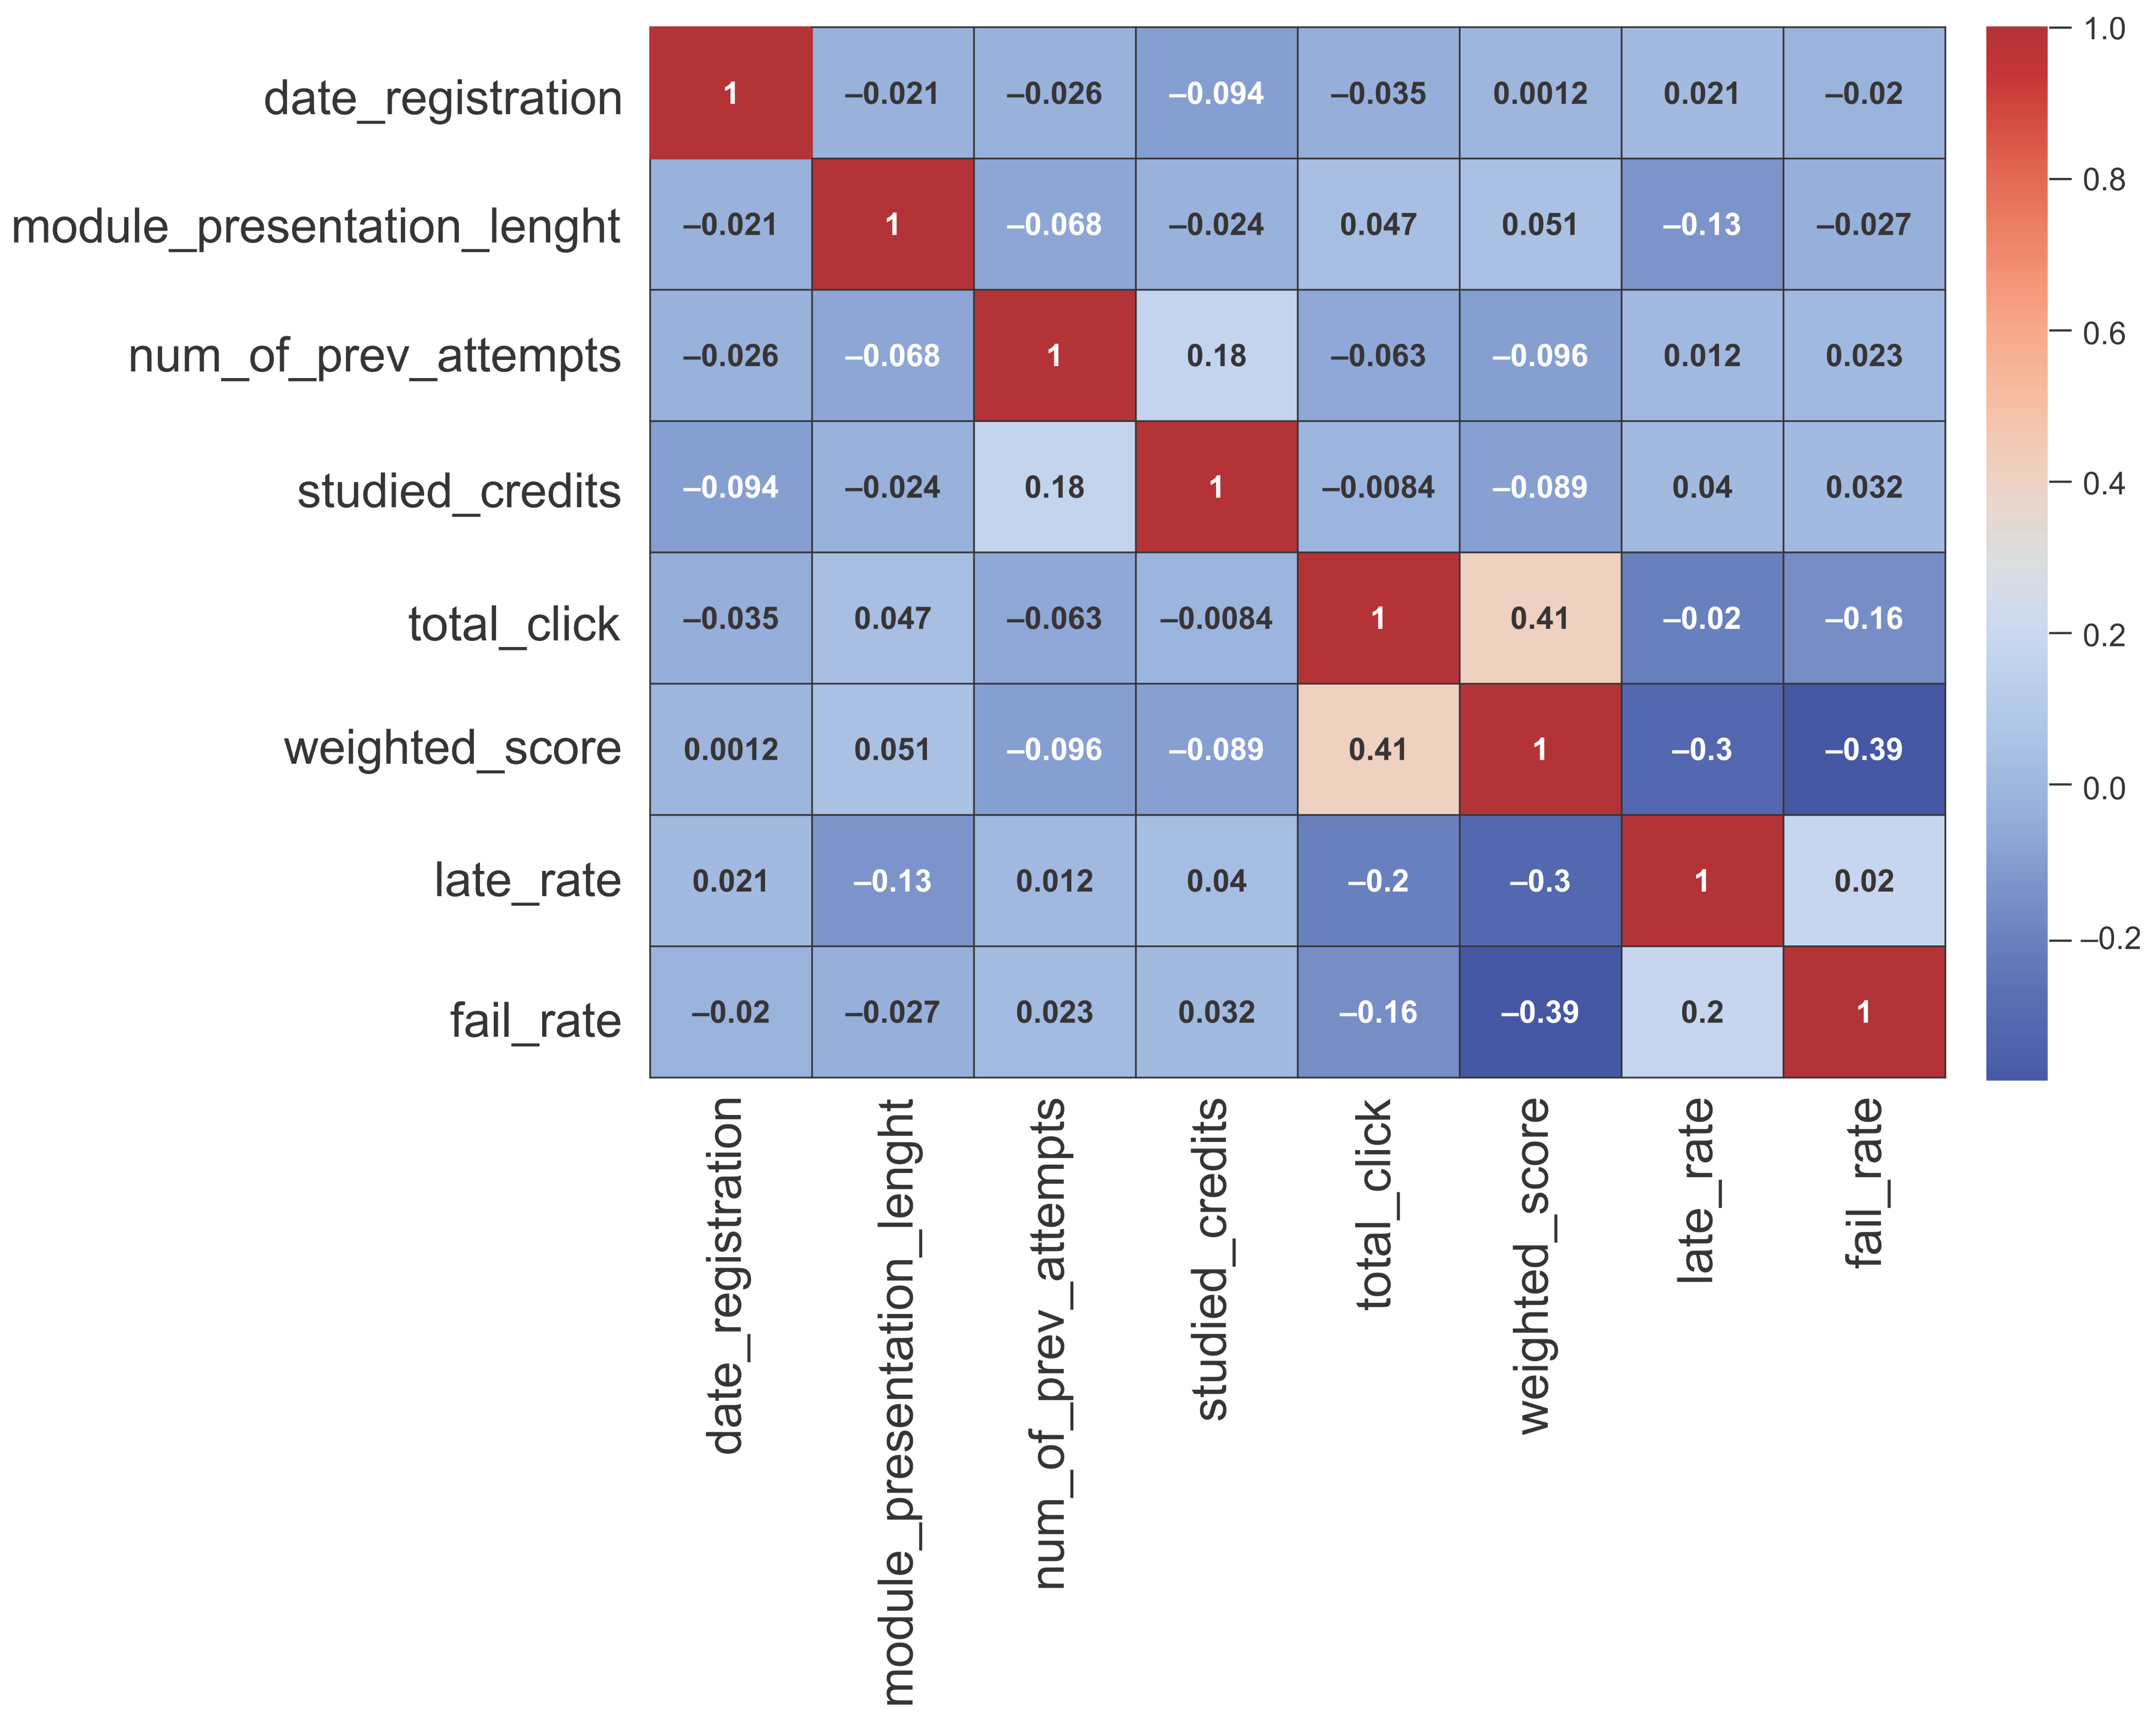
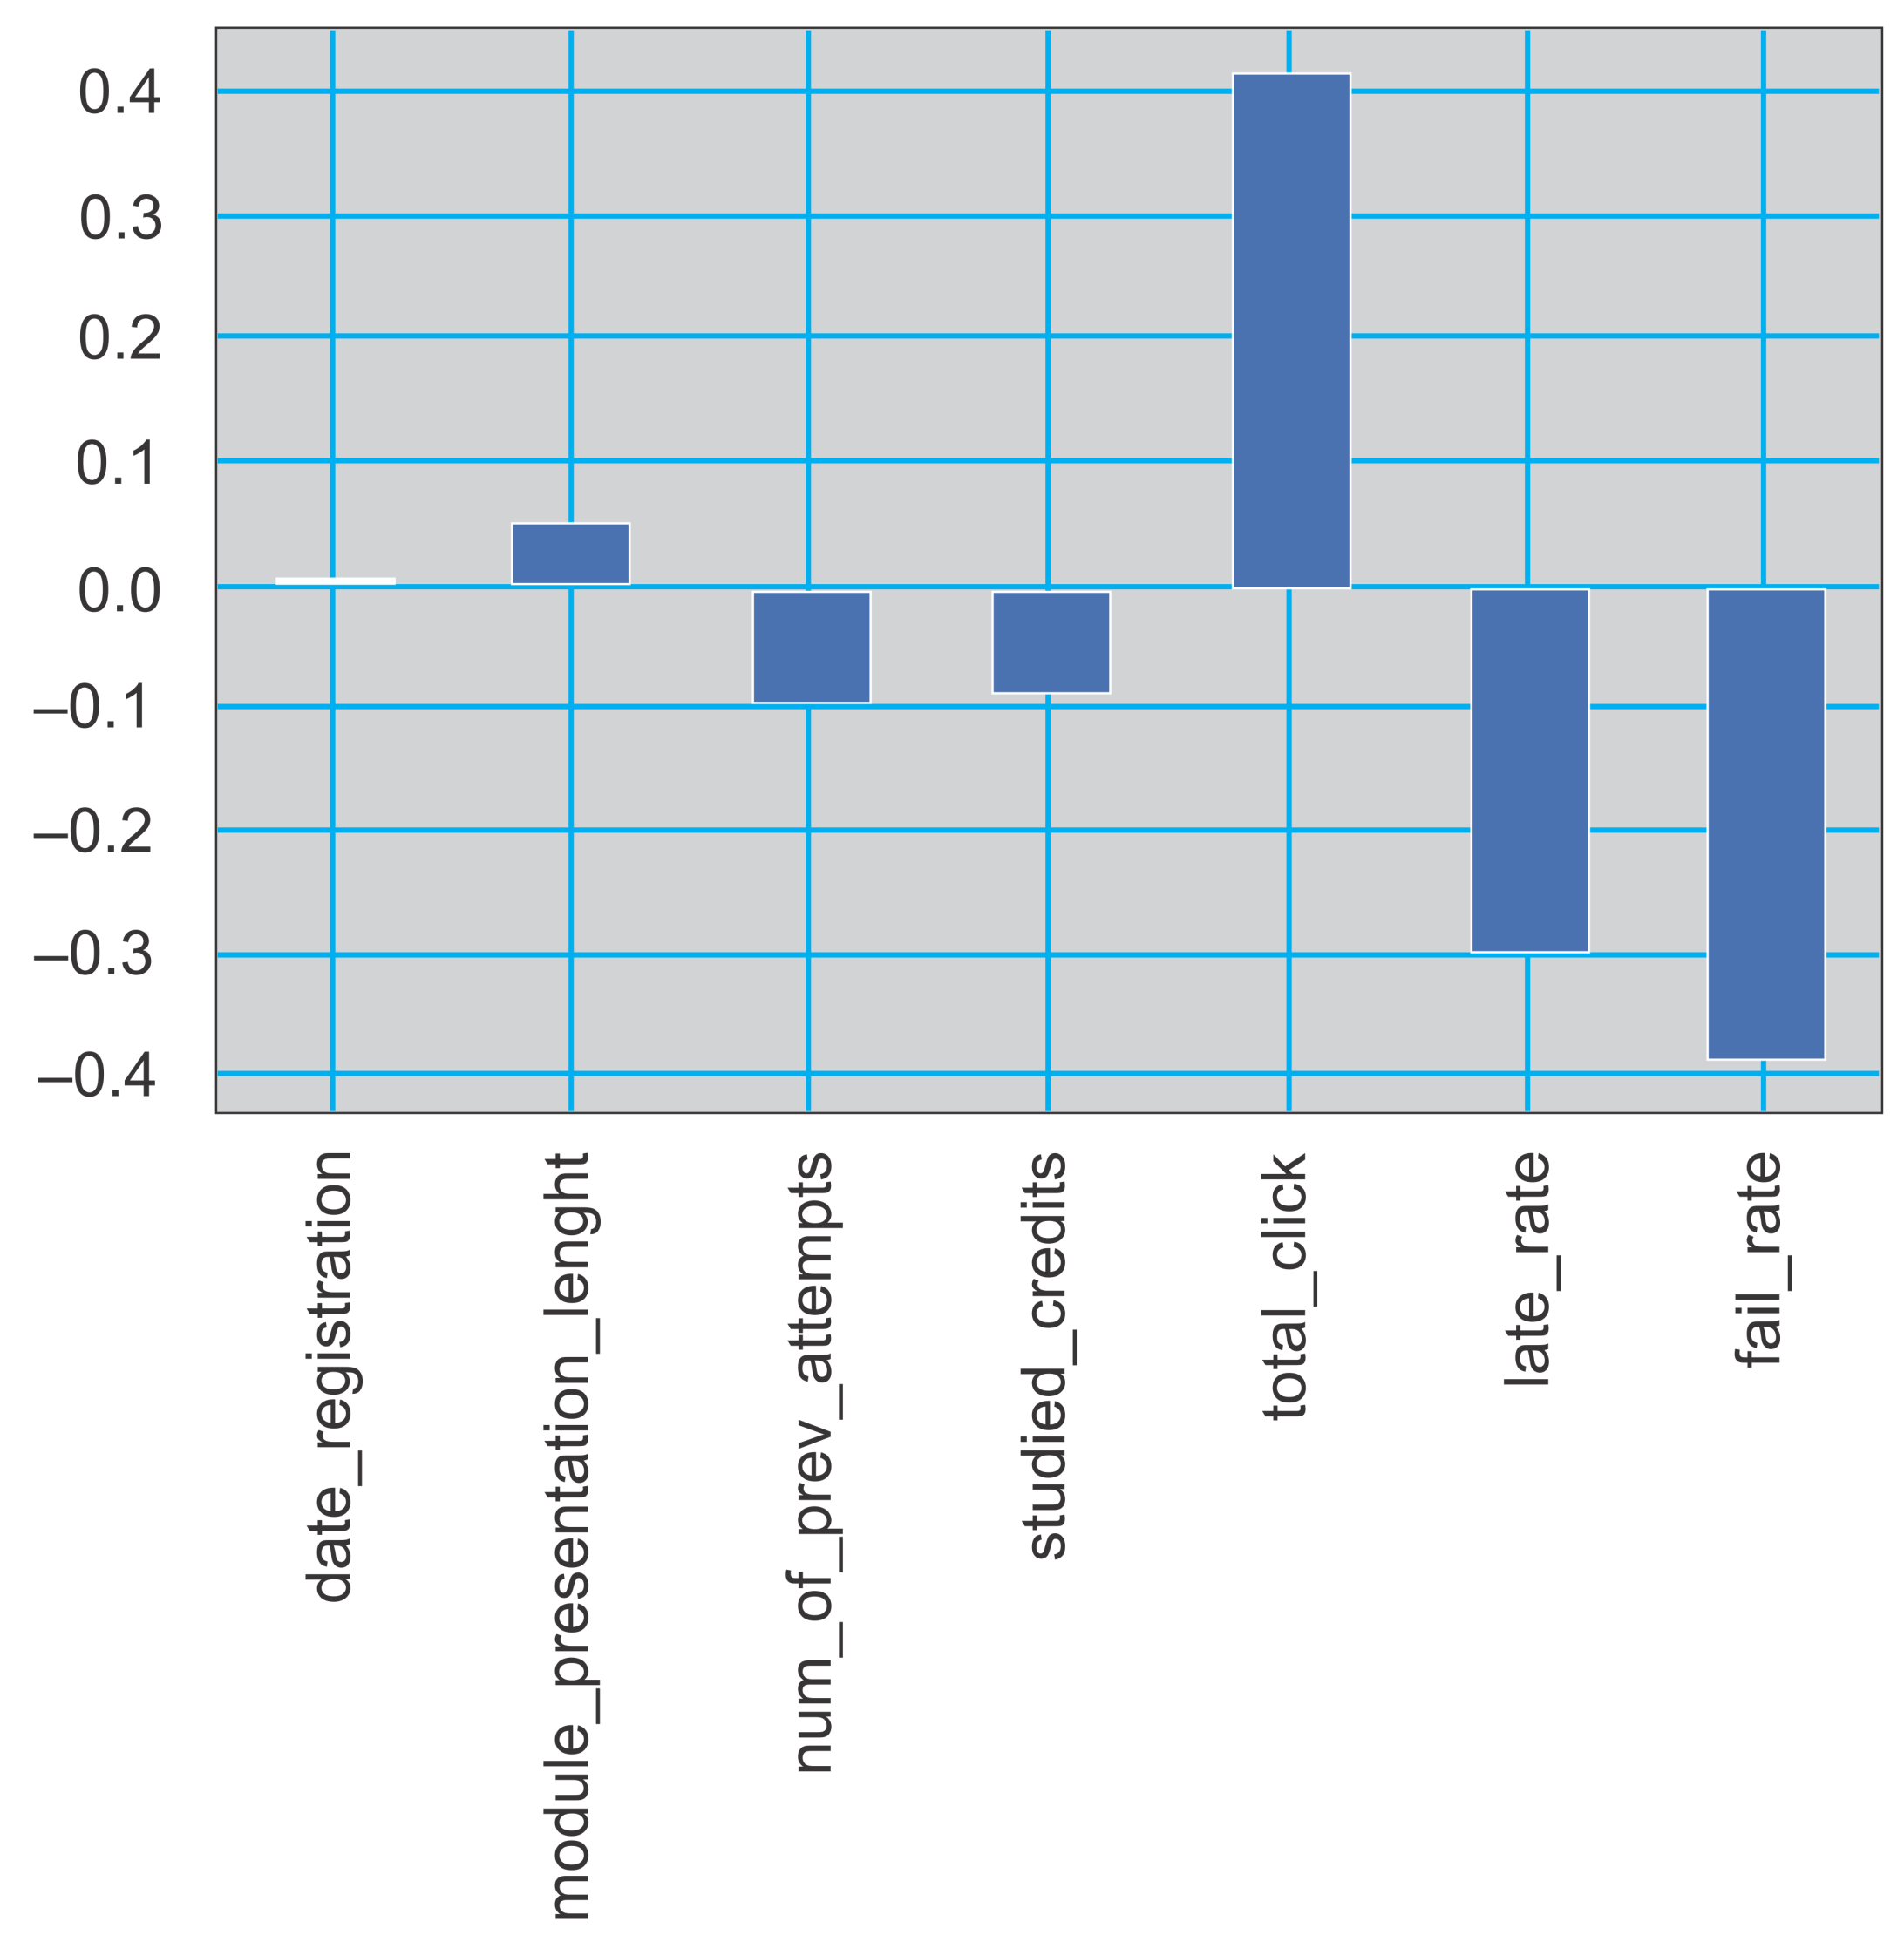
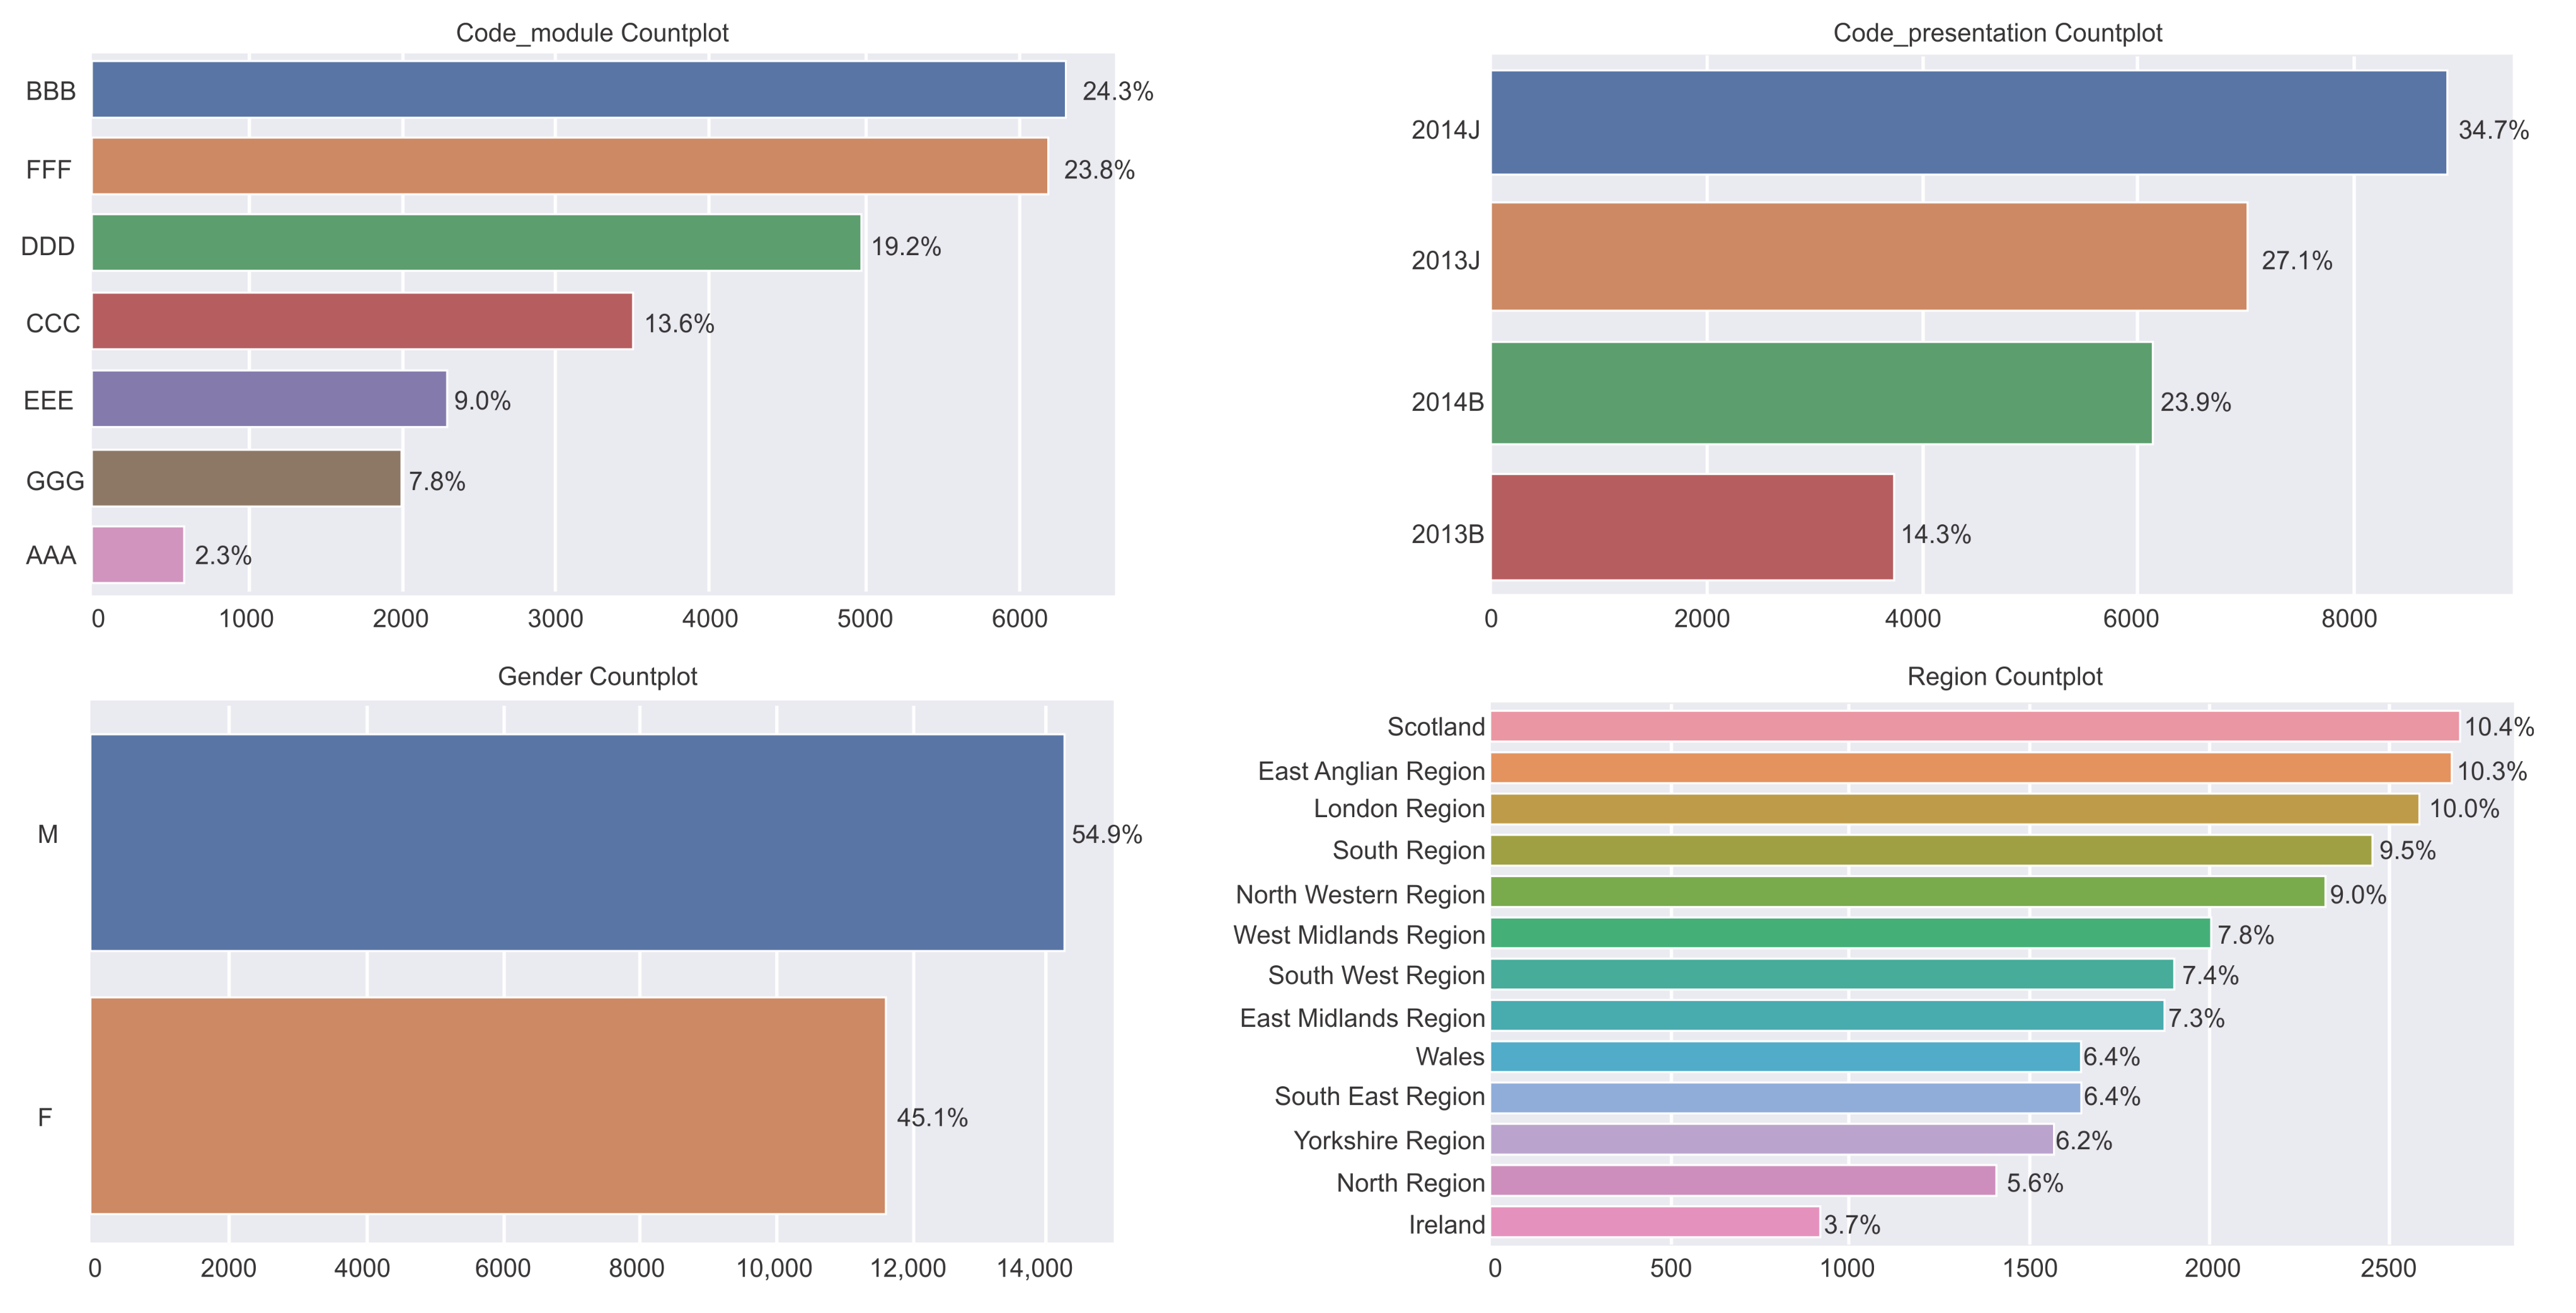
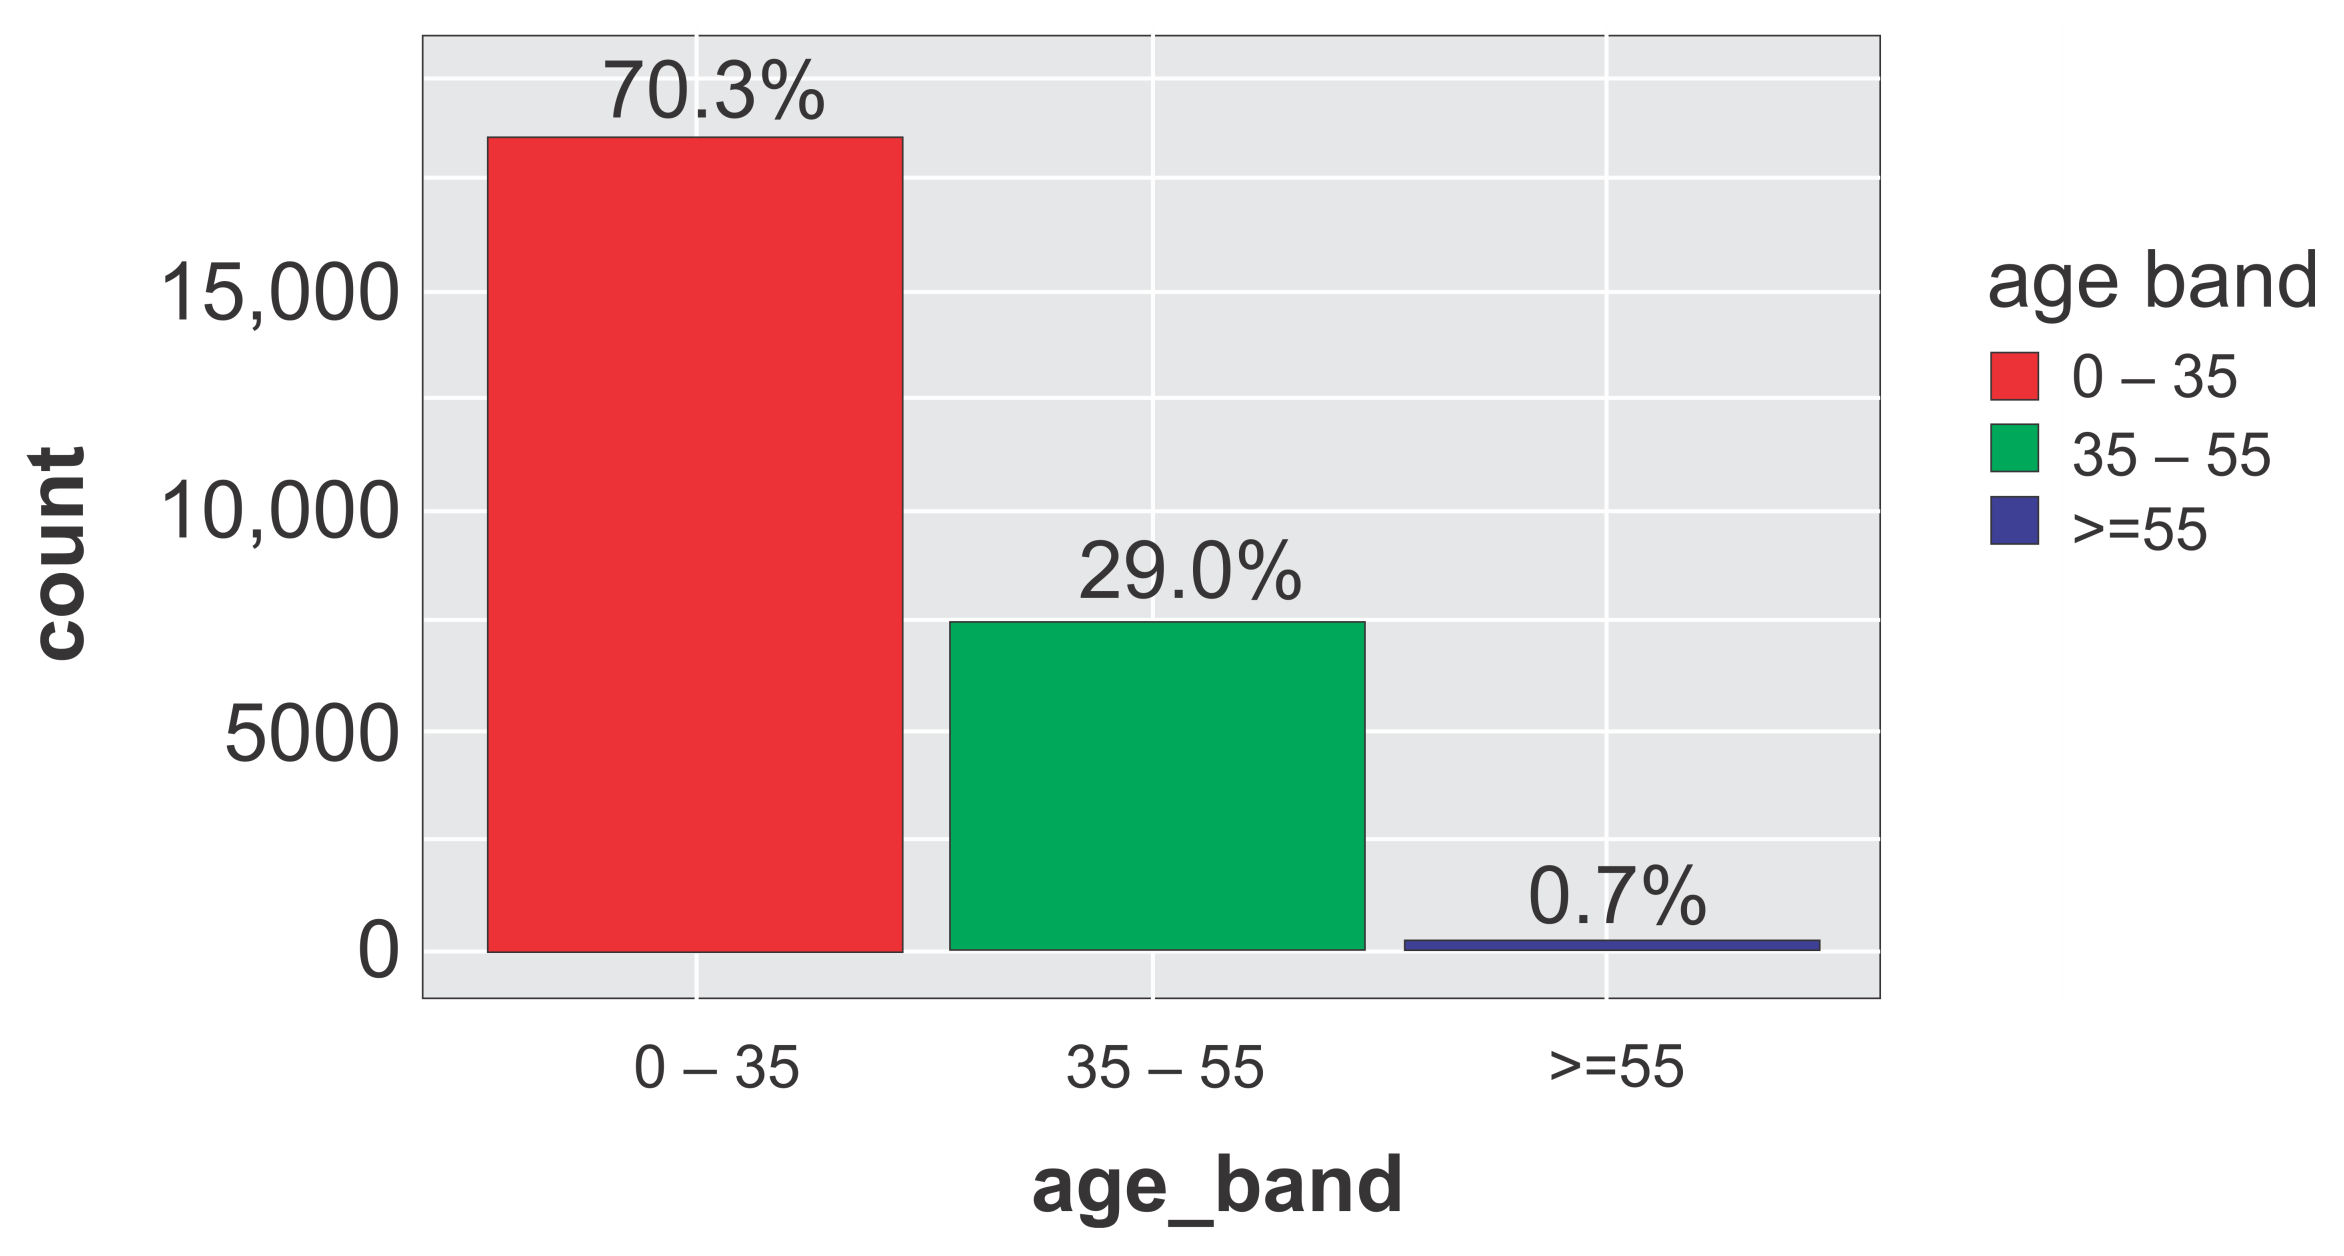
4.5. Exploratory Data Analysis
4.6. Stratified Sampling
4.7. Feature Selection and Reduction
4.8. Regression Analysis
4.9. Classification
4.10. System Optimization
5. Experimental Setup
5.1. Dataset
5.2. Tools and Technologies
5.3. Performance Metrics
6. Results and Discussion
6.1. Regression Analysis Results
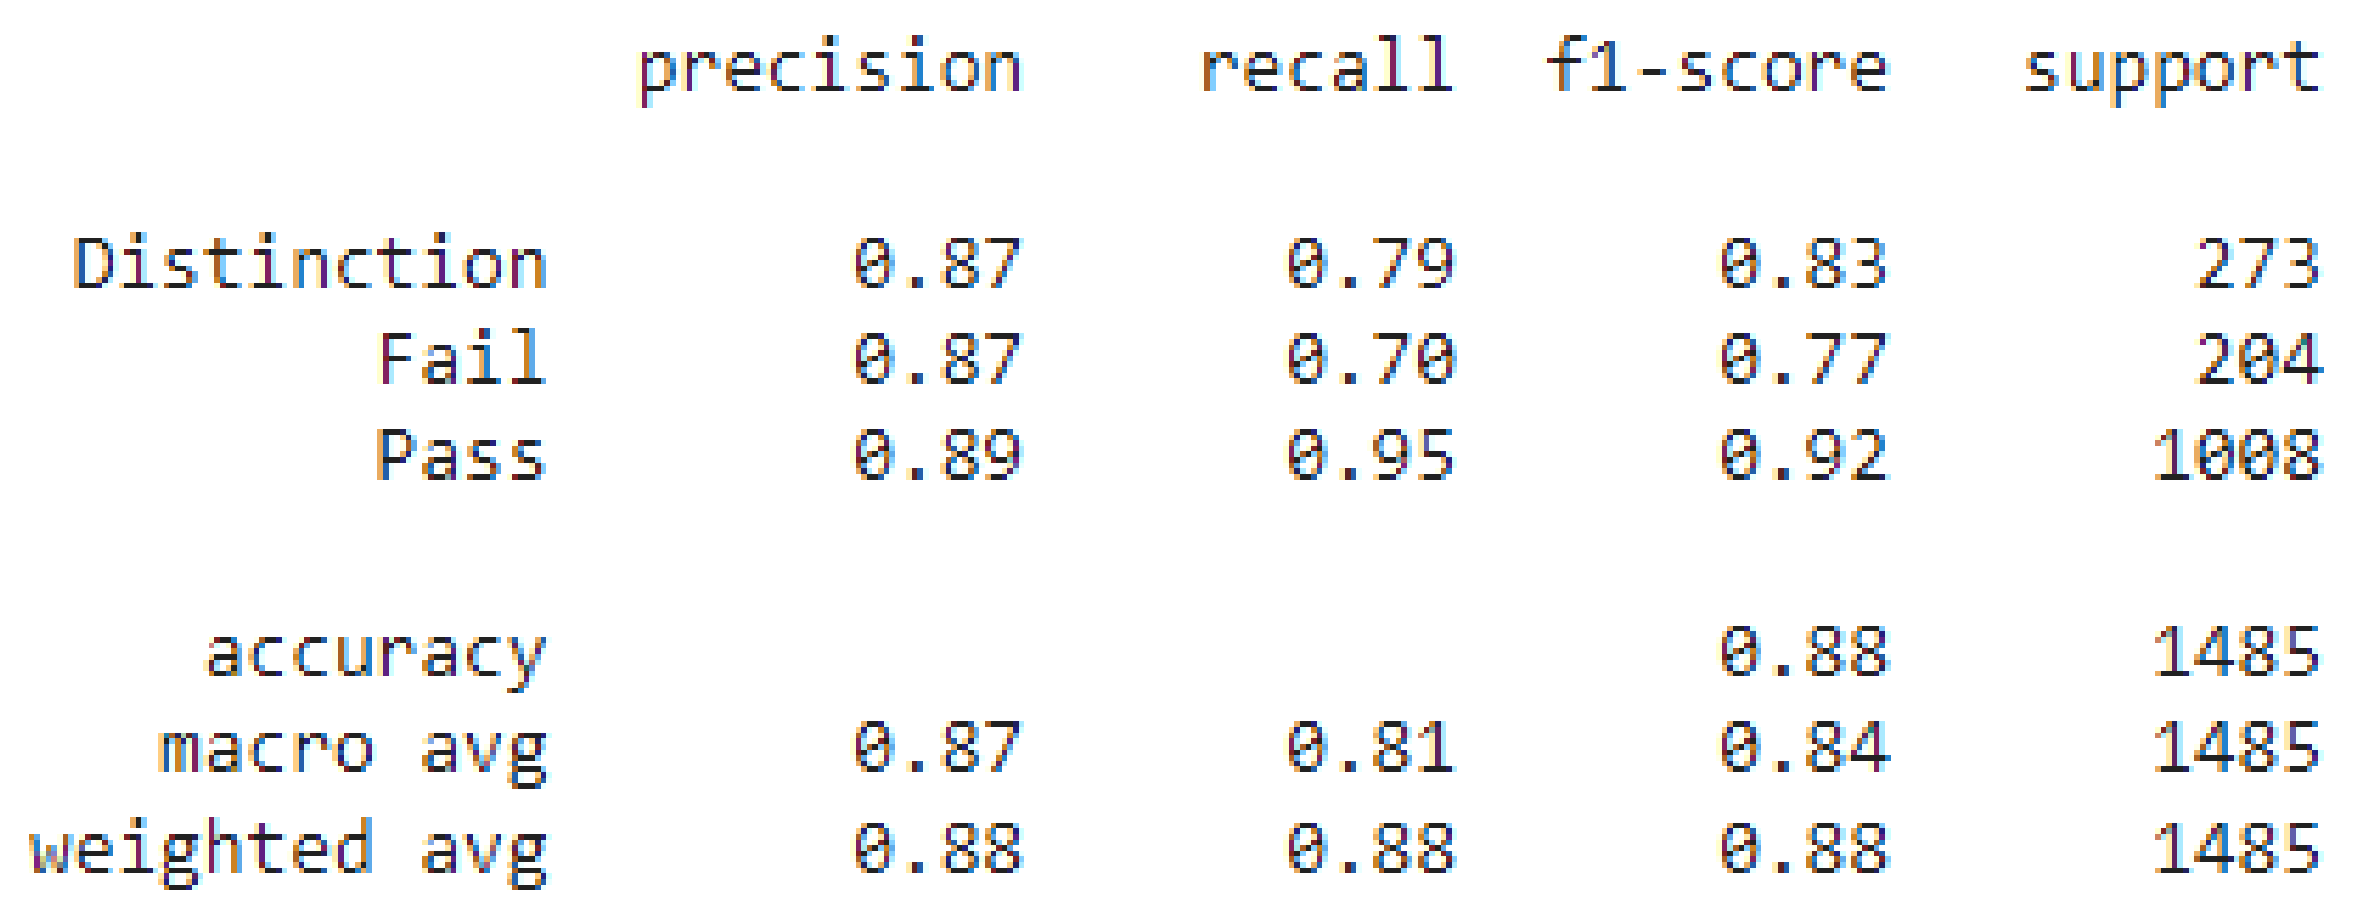
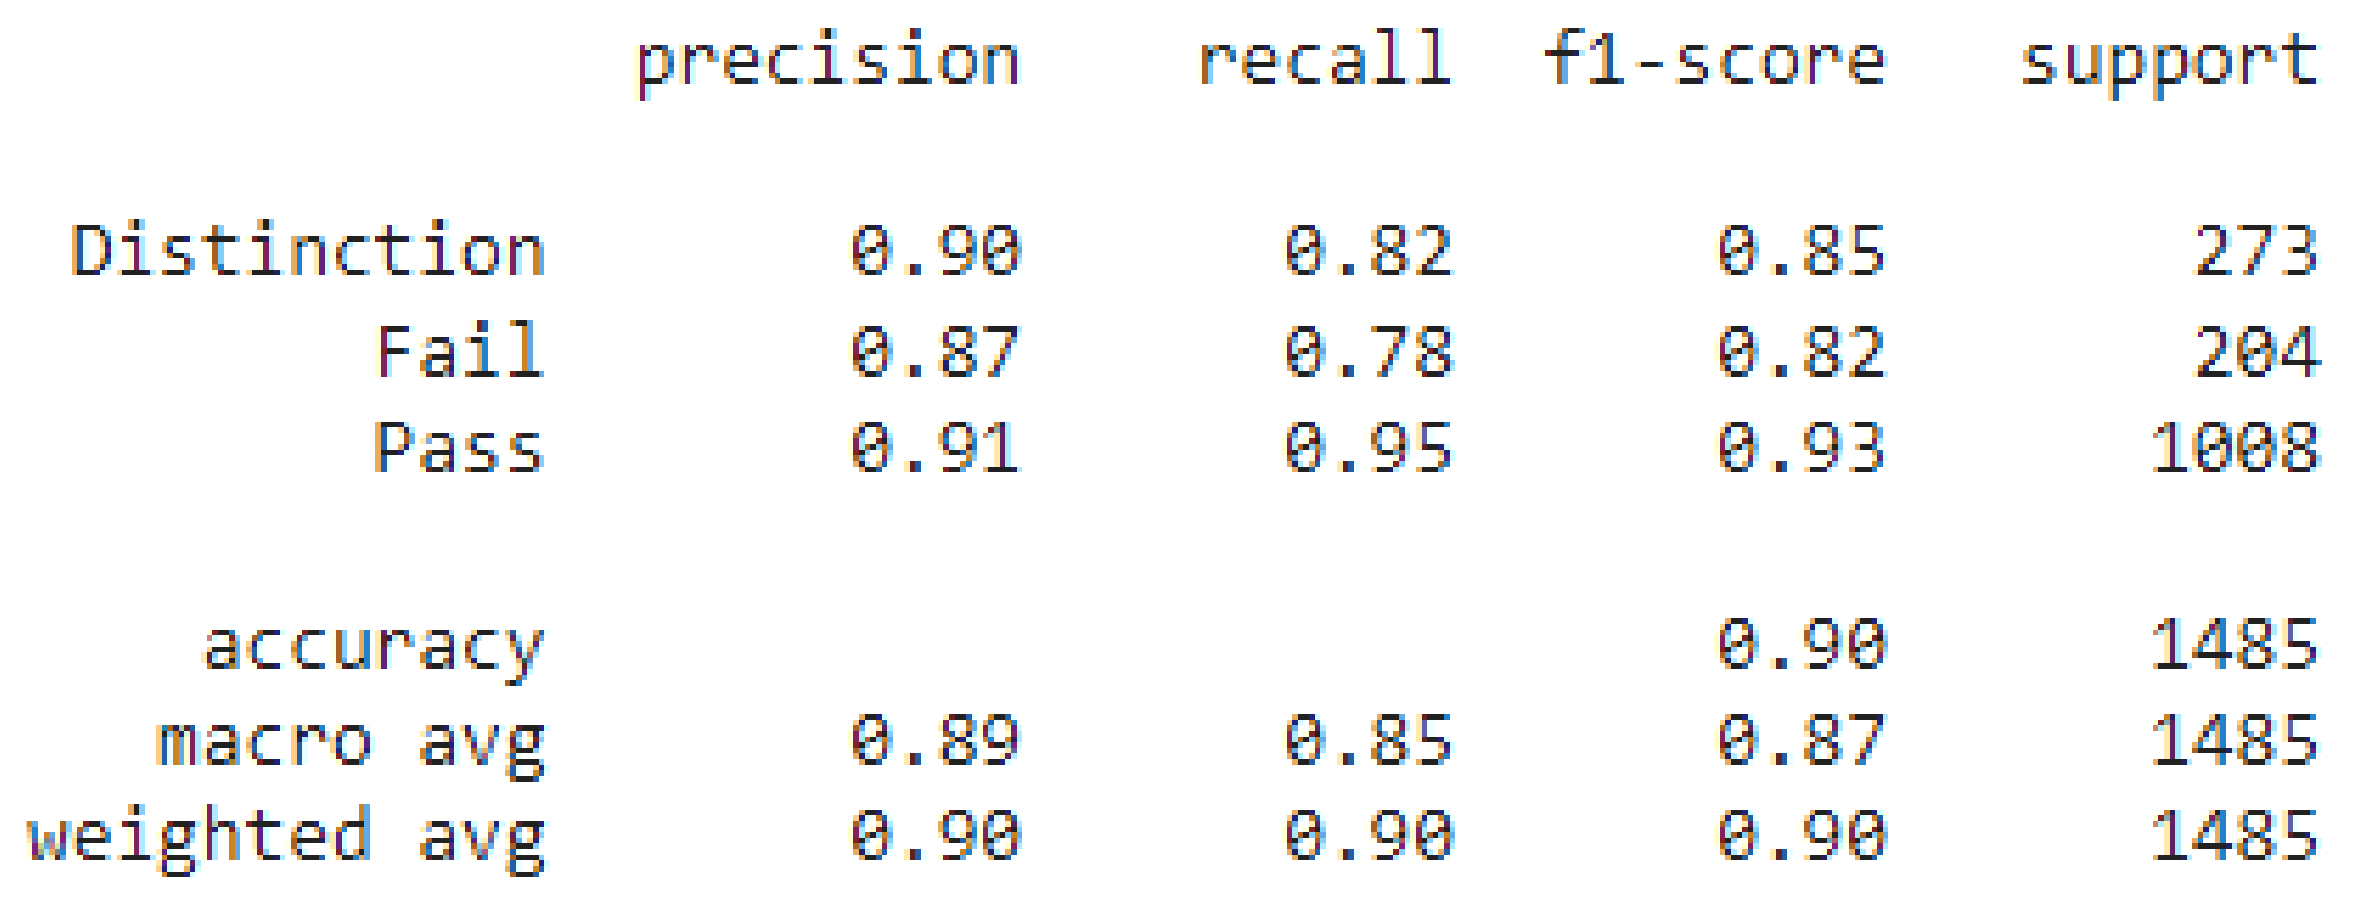
6.2. Classification Results
7. Conclusions and Future Work
Author Contributions
Funding
Institutional Review Board Statement
Informed Consent Statement
Data Availability Statement
Conflicts of Interest
References
- Sabi, H.M.; Uzoka, F.M.E.; Langmia, K.; Njeh, F.N. Conceptualizing a model for adoption of cloud computing in education. Int. J. Inf. Manag. 2016, 36, 183–191. [Google Scholar] [CrossRef]
- Ramírez-Montoya, M.S.; Andrade-Vargas, L.; Rivera-Rogel, D.; Portuguez-Castro, M. Trends for the Future of Education Programs for Professional Development. Sustainability 2021, 13, 7244. [Google Scholar] [CrossRef]
- Herodotou, C.; Rienties, B.; Hlosta, M.; Boroowa, A.; Mangafa, C.; Zdrahal, Z. The scalable implementation of predictive learning analytics at a distance learning university: Insights from a longitudinal case study. Internet High. Educ. 2020, 45, 100725. [Google Scholar] [CrossRef]
- Macfadyen, L.P.; Dawson, S. Mining LMS data to develop an “early warning system” for educators: A proof of concept. Comput. Educ. 2010, 54, 588–599. [Google Scholar] [CrossRef]
- Collberg, C.; Debray, S.; Kobourov, S.; Westbrook, S. Increasing Undergraduate Involvement in Computer Science Research. In Proceedings of the 8th World Conference on Computers in Education (WCCE), Cape Town, South Africa, 4–7 July 2005. [Google Scholar]
- Noblitt, L.; Vance, D.E.; Smith, M.L.D. A comparison of case study and traditional teaching methods for improvement of oral communication and critical-thinking skills. J. Coll. Sci. Teach. 2010, 39, 26–32. [Google Scholar]
- Li, Y.; Nishimura, N.; Yagami, H.; Park, H.S. An Empirical Study on Online Learners’ Continuance Intentions in China. Sustainability 2021, 13, 889. [Google Scholar] [CrossRef]
- Portillo, J.; Garay, U.; Tejada, E.; Bilbao, N. Self-Perception of the Digital Competence of Educators during the COVID-19 Pandemic: A Cross-Analysis of Different Educational Stages. Sustainability 2020, 12, 128. [Google Scholar] [CrossRef]
- Bowles, M. Learning to E-Learn Project: Rediscovering the benefits of e-learning. Malays. Online J. Instr. Technol. 2005, 2, EJ. [Google Scholar]
- Mothibi, G. A Meta-Analysis of the Relationship between E-Learning and Students’ Academic Achievement in Higher Education. J. Educ. Pract. 2015, 6, 6–9. [Google Scholar]
- Abulibdeh, E.S.; Hassan, S.S.S. E-learning interactions, information technology self efficacy and student achievement at the University of Sharjah, UAE. Australas. J. Educ. Technol. 2011, 27, 1014–1025. [Google Scholar] [CrossRef] [Green Version]
- Riahi, G. E-learning systems based on cloud computing: A review. Procedia Comput. Sci. 2015, 62, 352–359. [Google Scholar] [CrossRef] [Green Version]
- Baepler, P.; Murdoch, C.J. Academic analytics and data mining in higher education. Int. J. Scholarsh. Teach. Learn. 2010, 4, 17. [Google Scholar] [CrossRef]
- Bin Mat, U.; Buniyamin, N.; Arsad, P.M.; Kassim, R. An overview of using academic analytics to predict and improve students’ achievement: A proposed proactive intelligent intervention. In Proceedings of the 2013 IEEE 5th Conference on Engineering Education (ICEED), Kuala Lumpur, Malaysia, 4–5 December 2013; pp. 126–130. [Google Scholar]
- Huebner, R.A. A Survey of Educational Data-Mining Research. Res. High. Educ. J. 2013, 19, 1–13. [Google Scholar]
- Rodrigues, M.W.; Isotani, S.; Zárate, L.E. Educational Data Mining: A review of evaluation process in the e-learning. Telemat. Inform. 2018, 35, 1701–1717. [Google Scholar] [CrossRef]
- Romero, C.; Ventura, S. Educational data mining and learning analytics: An updated survey. Wiley Interdiscip. Rev. Data Min. Knowl. Discov. 2020, 10, e1355. [Google Scholar] [CrossRef]
- Cassells, L. The effectiveness of early identification of ‘at risk’ students in higher education institutions. Assess. Eval. High. Educ. 2017, 43, 515–526. [Google Scholar] [CrossRef] [Green Version]
- Tran, D.P.; Nguyen, G.N.; Hoang, V.D. Hyperparameter Optimization for Improving Recognition Efficiency of an Adaptive Learning System. IEEE Access 2020, 8, 160569–160580. [Google Scholar] [CrossRef]
- Gardner, J.; Brooks, C. Student success prediction in MOOCs. User Model. User-Adapt. Interact. 2018, 28, 127–203. [Google Scholar] [CrossRef] [Green Version]
- Liao, S.N.; Zingaro, D.; Thai, K.; Alvarado, C.; Griswold, W.G.; Porter, L. A robust machine learning technique to predict low-performing students. ACM Trans. Comput. Educ. 2019, 19, 18. [Google Scholar] [CrossRef]
- Gray, C.C.; Perkins, D. Utilizing early engagement and machine learning to predict student outcomes. Comput. Educ. 2019, 131, 22–32. [Google Scholar] [CrossRef]
- Asif, R.; Merceron, A.; Ali, S.A.; Haider, N.G. Analyzing undergraduate students’ performance using educational data mining. Comput. Educ. 2017, 113, 177–194. [Google Scholar] [CrossRef]
- Polyzou, A.; Karypis, G. Feature Extraction for Classifying Students Based on Their Academic Performance. In Proceedings of the 11th International Educational Data Mining Society, Buffalo, NY, USA, 15–18 July 2018. [Google Scholar]
- Ray, S.; Saeed, M. Applications of Educational Data Mining and Learning Analytics Tools in Handling Big Data in Higher Education. In Applications of Big Data Analytics: Trends, Issues, and Challenges; Springer: Cham, Switzerland, 2018; pp. 135–160. [Google Scholar] [CrossRef]
- Brohi, S.N.; Pillai, T.R.; Kaur, S.; Kaur, H.; Sukumaran, S.; Asirvatham, D. Accuracy Comparison of Machine Learning Algorithms for Predictive Analytics in Higher Education. In International Conference for Emerging Technologies in Computing; Springer: Cham, Switzerland, 2019; Volume 285, pp. 254–261. [Google Scholar] [CrossRef]
- Saqr, M.; Fors, U.; Tedre, M. How learning analytics can early predict under-achieving students in a blended medical education course. Med. Teach. 2017, 39, 757–767. [Google Scholar] [CrossRef] [PubMed]
- Chaichumpa, S.; Temdee, P. Multi-agents platform for mobile learning using objective distance based personalisation method. Int. J. Mob. Learn. Organ. 2018, 12, 293–310. [Google Scholar] [CrossRef]
- Baashar, Y.; Alkawsi, G.; Ali, N.; Alhussian, H.; Bahbouh, H.T. Predicting student’s performance using machine learning methods: A systematic literature review. In Proceedings of the International Conference on Computer and Information Sciences: Sustaining Tomorrow with Digital Innovation, ICCOINS, Kuching, Malaysia, 13–15 July 2021; pp. 357–362. [Google Scholar] [CrossRef]
- Chen, F.; Cui, Y. Utilizing Student Time Series Behaviour in Learning Management Systems for Early Prediction of Course Performance. J. Learn. Anal. 2020, 7, 1–17. [Google Scholar] [CrossRef]
- Saleem, F.; Ullah, Z.; Fakieh, B.; Kateb, F. Intelligent Decision Support System for Predicting Student’s E-Learning Performance Using Ensemble Machine Learning. Mathematics 2021, 9, 2078. [Google Scholar] [CrossRef]
- Al Duhayyim, M.; Newbury, P. Concept-based and Fuzzy Adaptive E-learning. In Proceedings of the 2018 3rd International Conference on Information and Education Innovations, London, UK, 30 June–2 July 2018; pp. 49–56. [Google Scholar] [CrossRef]
- Matazi, I.; Bennane, A.; Messoussi, R.; Touahni, R.; Oumaira, I.; Korchiyne, R. Multi-Agent System Based on Fuzzy Logic for E-Learning Collaborative System. In Proceedings of the International Symposium on Advanced Electrical and Communication Technologies, ISAECT 2018–Proceedings, Rabat, Morocco, 21–23 November 2018. [Google Scholar] [CrossRef]
- Noama, K.M.G.; Khalid, A.; Muharram, A.A.; Ahmed, I.A. Improvement of E-learning Based via Learning Management Systems (LMS) Using Artificial Neural Networks. Asian J. Res. Comput. Sci. 2019, 4, 1–9. [Google Scholar] [CrossRef]
- McGill, T.J.; Klobas, J.E. A task–technology fit view of learning management system impact. Comput. Educ. 2009, 52, 496–508. [Google Scholar] [CrossRef]
- Khanal, S.S.; Prasad, P.; Alsadoon, A.; Maag, A. A systematic review: Machine learning based recommendation systems for e-learning. Educ. Inf. Technol. 2020, 25, 2635–2664. [Google Scholar] [CrossRef]
- Chatti, M.A.; Dyckhoff, A.L.; Schroeder, U.; Thüs, H. A reference model for learning analytics. Int. J. Technol. Enhanc. Learn. 2012, 4, 318–331. [Google Scholar] [CrossRef]
- Masud, M.A.H.; Huang, X. A novel approach for adopting cloud-based e-learning system. In Proceedings of the 2012 IEEE/ACIS 11th International Conference on Computer and Information Science, Shanghai, China, 30 May–1 June 2012; pp. 37–42. [Google Scholar]
- Azzi, I.; Jeghal, A.; Radouane, A.; Yahyaouy, A.; Tairi, H. A robust classification to predict learning styles in adaptive E-learning systems. Educ. Inf. Technol. 2020, 25, 437–448. [Google Scholar] [CrossRef]
- Eggen, T.; Straetmans, G. Computerized adaptive testing for classifying examinees into three categories. Educ. Psychol. Meas. 2000, 60, 713–734. [Google Scholar] [CrossRef] [Green Version]
- Lykourentzou, I.; Giannoukos, I.; Nikolopoulos, V.; Mpardis, G.; Loumos, V. Dropout prediction in e-learning courses through the combination of machine learning techniques. Comput. Educ. 2009, 53, 950–965. [Google Scholar] [CrossRef]
- Khamparia, A.; Pandey, B. SVM and PCA based learning feature classification approaches for e-learning system. Int. J. Web-Based Learn. Teach. Technol. (IJWLTT) 2018, 13, 32–45. [Google Scholar] [CrossRef]
- Khamparia, A.; Singh, S.K.; Luhach, A.K.; Gao, X.Z. Classification and analysis of users review using different classification techniques in intelligent e-learning system. Int. J. Intell. Inf. Database Syst. 2020, 13, 139–149. [Google Scholar] [CrossRef]
- Sheeba, T.; Krishnan, R. Prediction of student learning style using modified decision tree algorithm in e-learning system. In Proceedings of the 2018 International Conference on Data Science and Information Technology, Singapore, 20–22 July 2018; pp. 85–90. [Google Scholar]
- Şuşnea, E. Using artificial neural networks in e-learning systems. UPB Sci. Bull. Ser. C 2010, 72, 91–100. [Google Scholar]
- Chang, H.S.; Hsu, H.J.; Chen, K.T. Modeling Exercise Relationships in E-Learning: A Unified Approach. In Proceedings of the International Conference on Educational Data Mining (EDM), Madrid, Spain, 26–29 June 2015; pp. 532–535. [Google Scholar]
- Yang, S.J.; Lu, O.H.; Huang, A.Y.; Huang, J.C.; Ogata, H.; Lin, A.J. Predicting students’ academic performance using multiple linear regression and principal component analysis. J. Inf. Process. 2018, 26, 170–176. [Google Scholar] [CrossRef] [Green Version]
- Rajalaxmi, R.; Natesan, P.; Krishnamoorthy, N.; Ponni, S. Regression model for predicting engineering students academic performance. Int. J. Recent Technol. Eng. 2019, 7, 71–75. [Google Scholar]
- Thompson, E.D.; Bowling, B.V.; Markle, R.E. Predicting student success in a major’s introductory biology course via logistic regression analysis of scientific reasoning ability and mathematics scores. Res. Sci. Educ. 2018, 48, 151–163. [Google Scholar] [CrossRef]
- Moubayed, A.; Injadat, M.; Shami, A.; Lutfiyya, H. Relationship between student engagement and performance in e-learning environment using association rules. In Proceedings of the 2018 IEEE World Engineering Education Conference (EDUNINE), Buenos Aires, Argentina, 11–14 March 2018; pp. 1–6. [Google Scholar]
- Angeline, D.M.D. Association rule generation for student performance analysis using apriori algorithm. SIJ Trans. Comput. Sci. Eng. Appl. (CSEA) 2013, 1, 12–16. [Google Scholar] [CrossRef]
- Govindasamy, K.; Velmurugan, T. Analysis of student academic performance using clustering techniques. Int. J. Pure Appl. Math. 2018, 119, 309–323. [Google Scholar]
- Shovon, M.; Islam, H.; Haque, M. An Approach of Improving Students Academic Performance by using k means clustering algorithm and Decision tree. arXiv 2012, arXiv:1211.6340. [Google Scholar]
- Waheed, H.; Hassan, S.U.; Aljohani, N.R.; Hardman, J.; Alelyani, S.; Nawaz, R. Predicting academic performance of students from VLE big data using deep learning models. Comput. Hum. Behav. 2020, 104, 106189. [Google Scholar] [CrossRef] [Green Version]
- Giannakas, F.; Troussas, C.; Voyiatzis, I.; Sgouropoulou, C. A deep learning classification framework for early prediction of team-based academic performance. Appl. Soft Comput. 2021, 106, 107355. [Google Scholar] [CrossRef]
- Hussain, M.; Zhu, W.; Zhang, W.; Abidi, S.M.R.; Ali, S. Using machine learning to predict student difficulties from learning session data. Artif. Intell. Rev. 2019, 52, 381–407. [Google Scholar] [CrossRef]
- Kuzilek, J.; Hlosta, M.; Zdrahal, Z. Open university learning analytics dataset. Sci. Data 2017, 4, 1–8. [Google Scholar] [CrossRef] [Green Version]


Publisher’s Note: MDPI stays neutral with regard to jurisdictional claims in published maps and institutional affiliations. |
© 2022 by the authors. Licensee MDPI, Basel, Switzerland. This article is an open access article distributed under the terms and conditions of the Creative Commons Attribution (CC BY) license (https://creativecommons.org/licenses/by/4.0/).
Share and Cite
Gligorea, I.; Yaseen, M.U.; Cioca, M.; Gorski, H.; Oancea, R. An Interpretable Framework for an Efficient Analysis of Students’ Academic Performance. Sustainability 2022, 14, 8885. https://doi.org/10.3390/su14148885
Gligorea I, Yaseen MU, Cioca M, Gorski H, Oancea R. An Interpretable Framework for an Efficient Analysis of Students’ Academic Performance. Sustainability. 2022; 14(14):8885. https://doi.org/10.3390/su14148885
Chicago/Turabian StyleGligorea, Ilie, Muhammad Usman Yaseen, Marius Cioca, Hortensia Gorski, and Romana Oancea. 2022. "An Interpretable Framework for an Efficient Analysis of Students’ Academic Performance" Sustainability 14, no. 14: 8885. https://doi.org/10.3390/su14148885
APA StyleGligorea, I., Yaseen, M. U., Cioca, M., Gorski, H., & Oancea, R. (2022). An Interpretable Framework for an Efficient Analysis of Students’ Academic Performance. Sustainability, 14(14), 8885. https://doi.org/10.3390/su14148885