
Assessment of Groundwater Suitability for Agricultural Purposes: A Case Study of South Oued Righ Region, Algeria

 ,
, 
 , ,
, ,  ,
,  ,
,
Abstract
:1. Introduction
2. Materials and Methods
2.1. Study Area Description
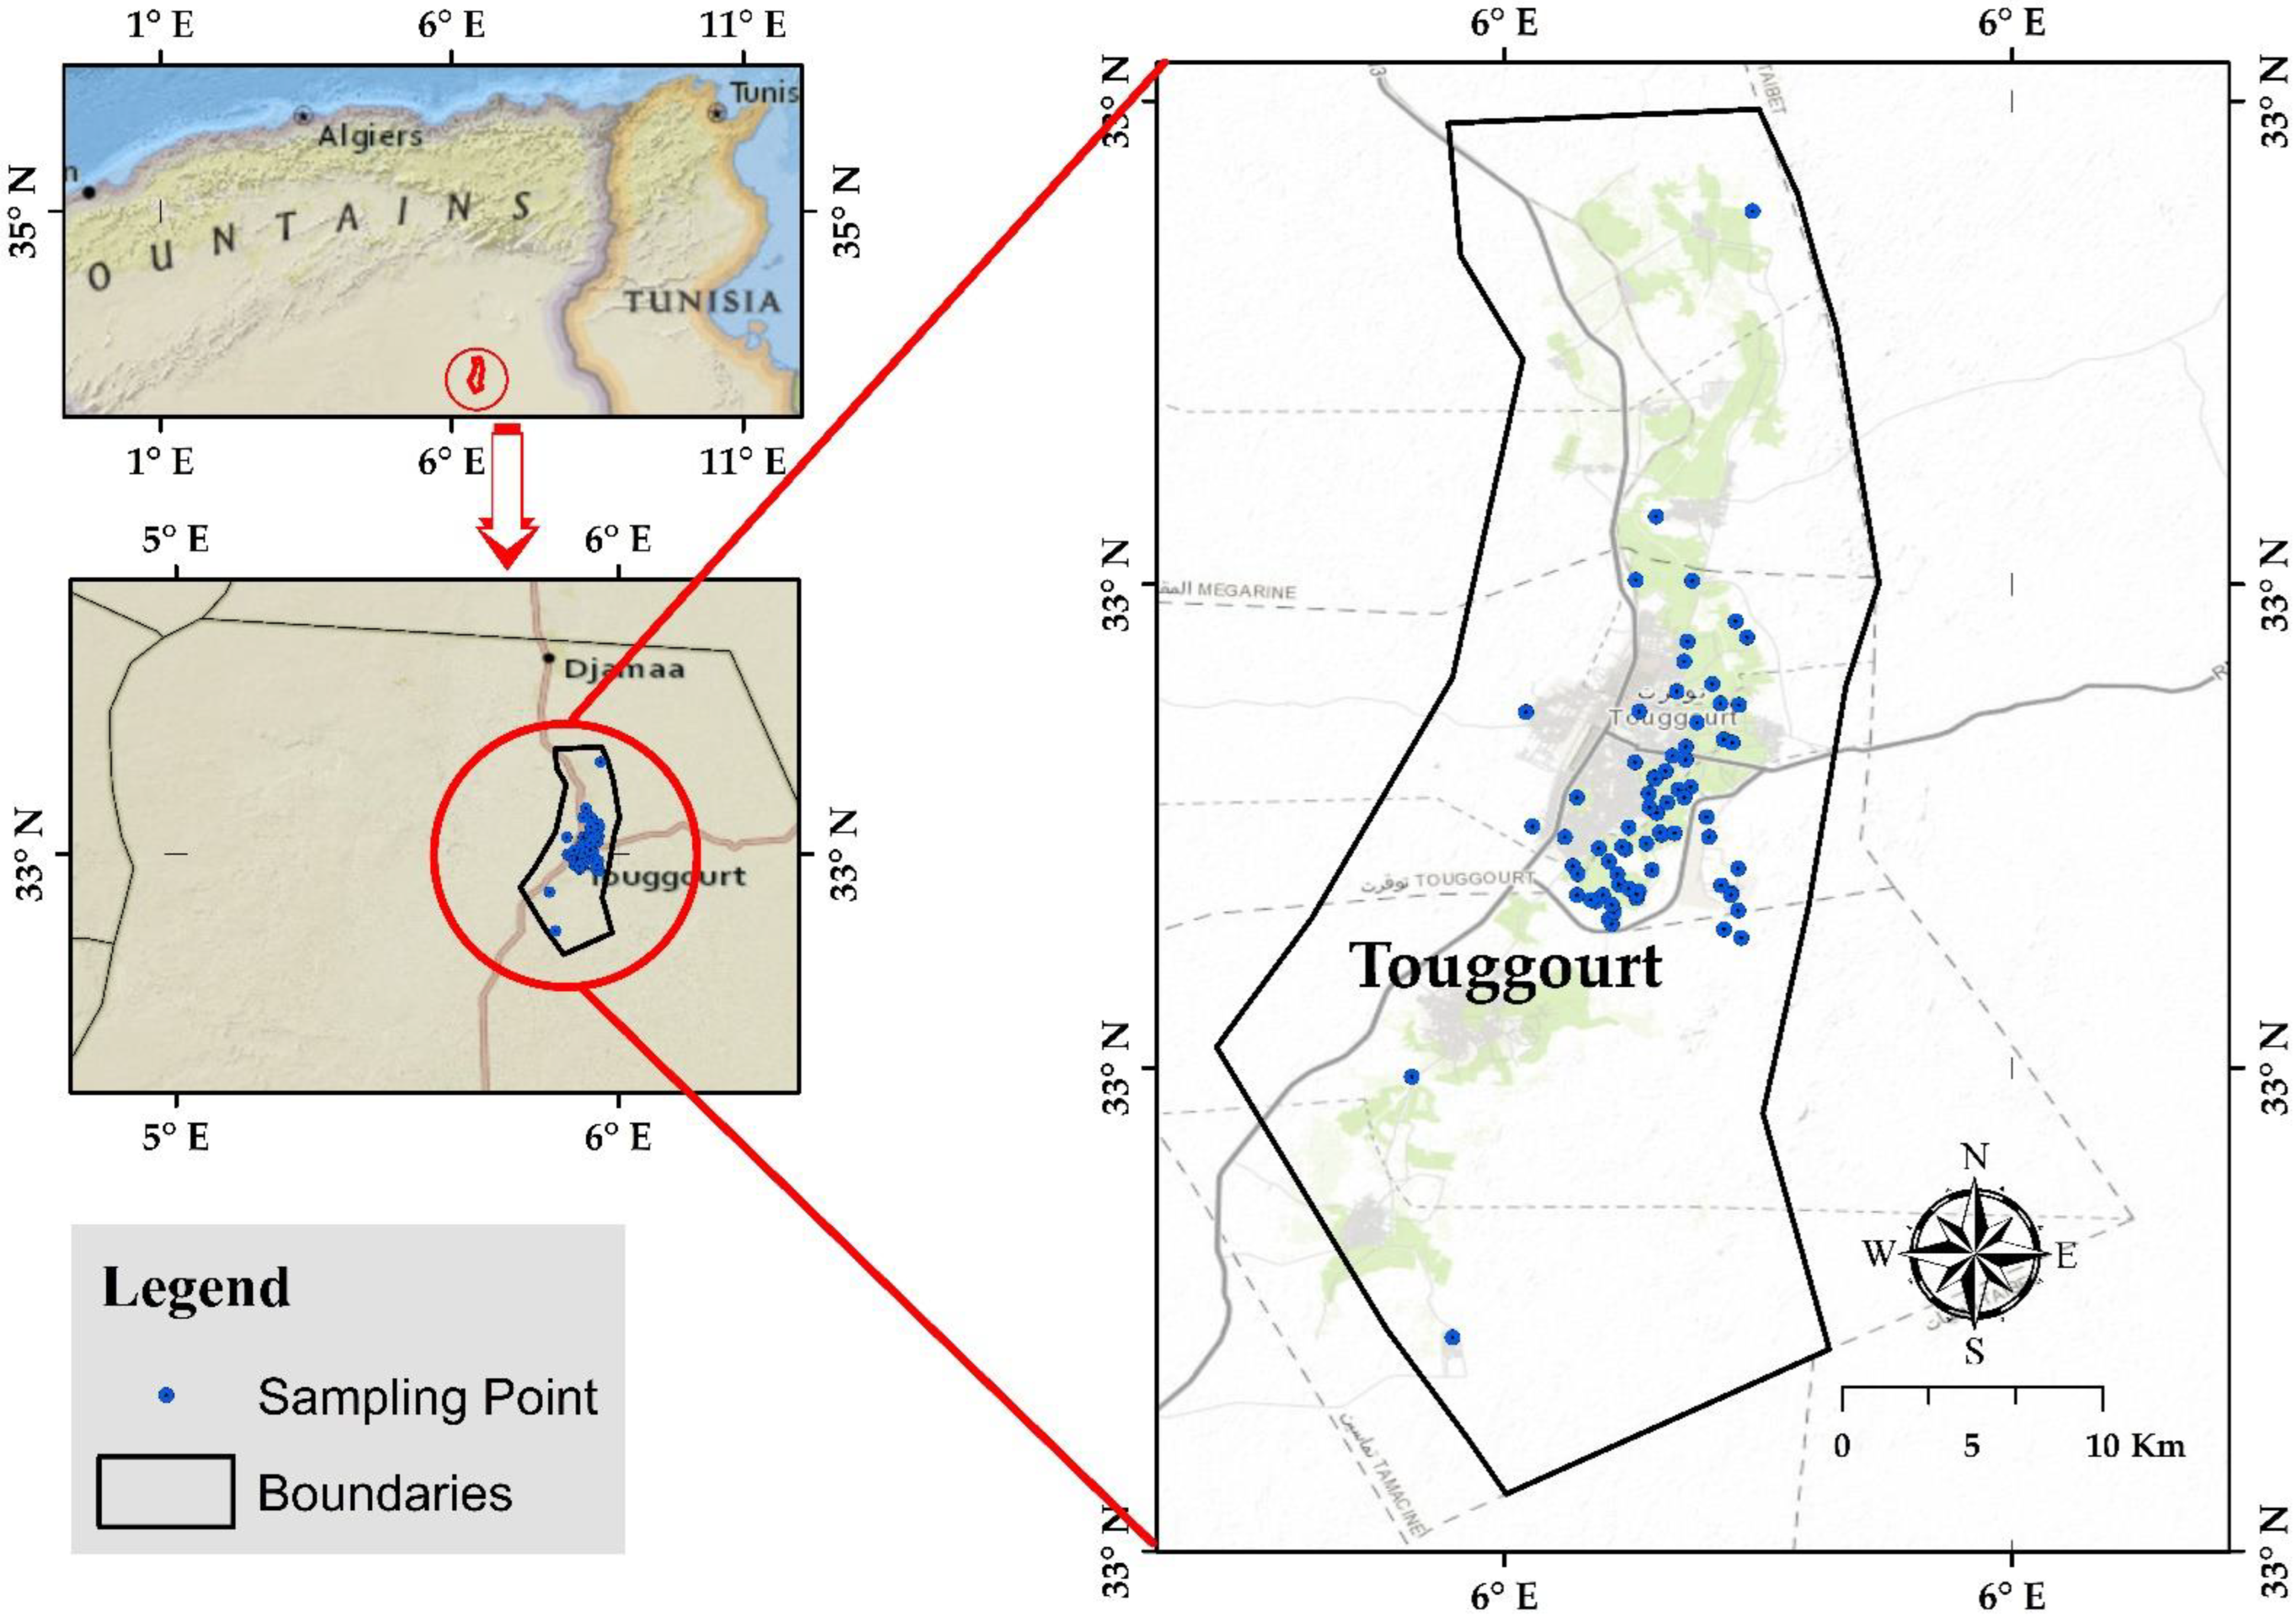
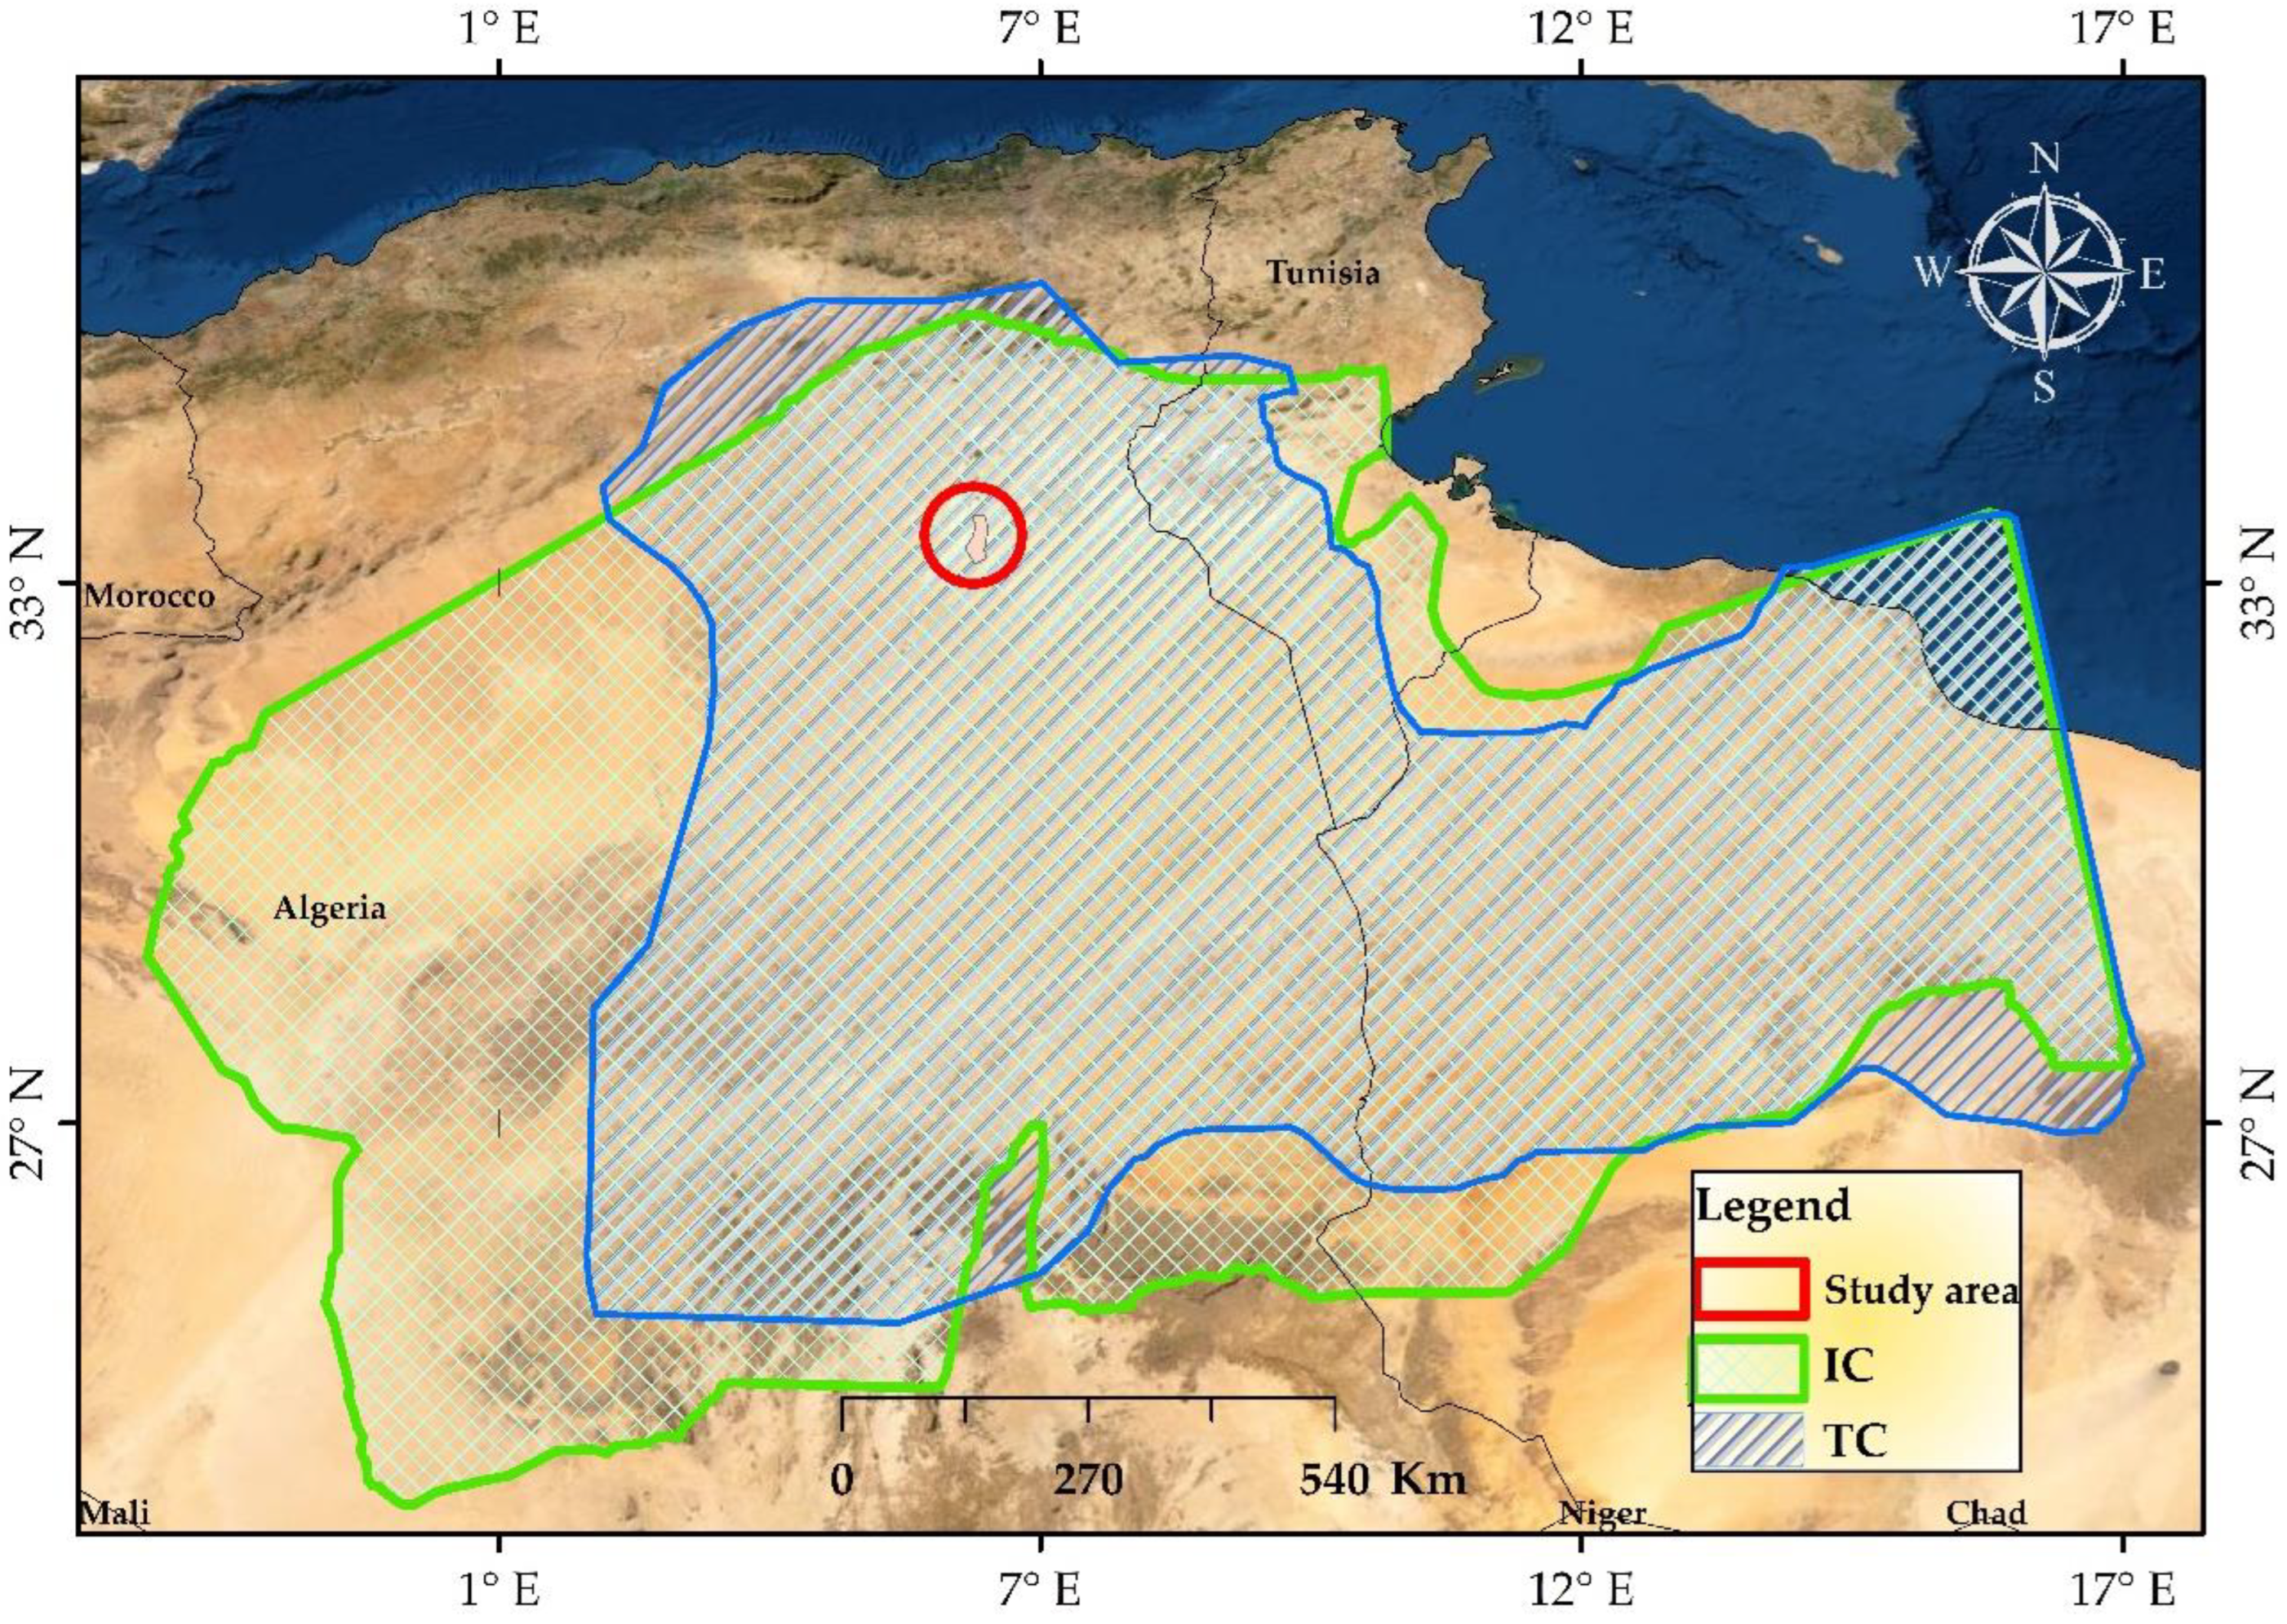
2.1.1. Location
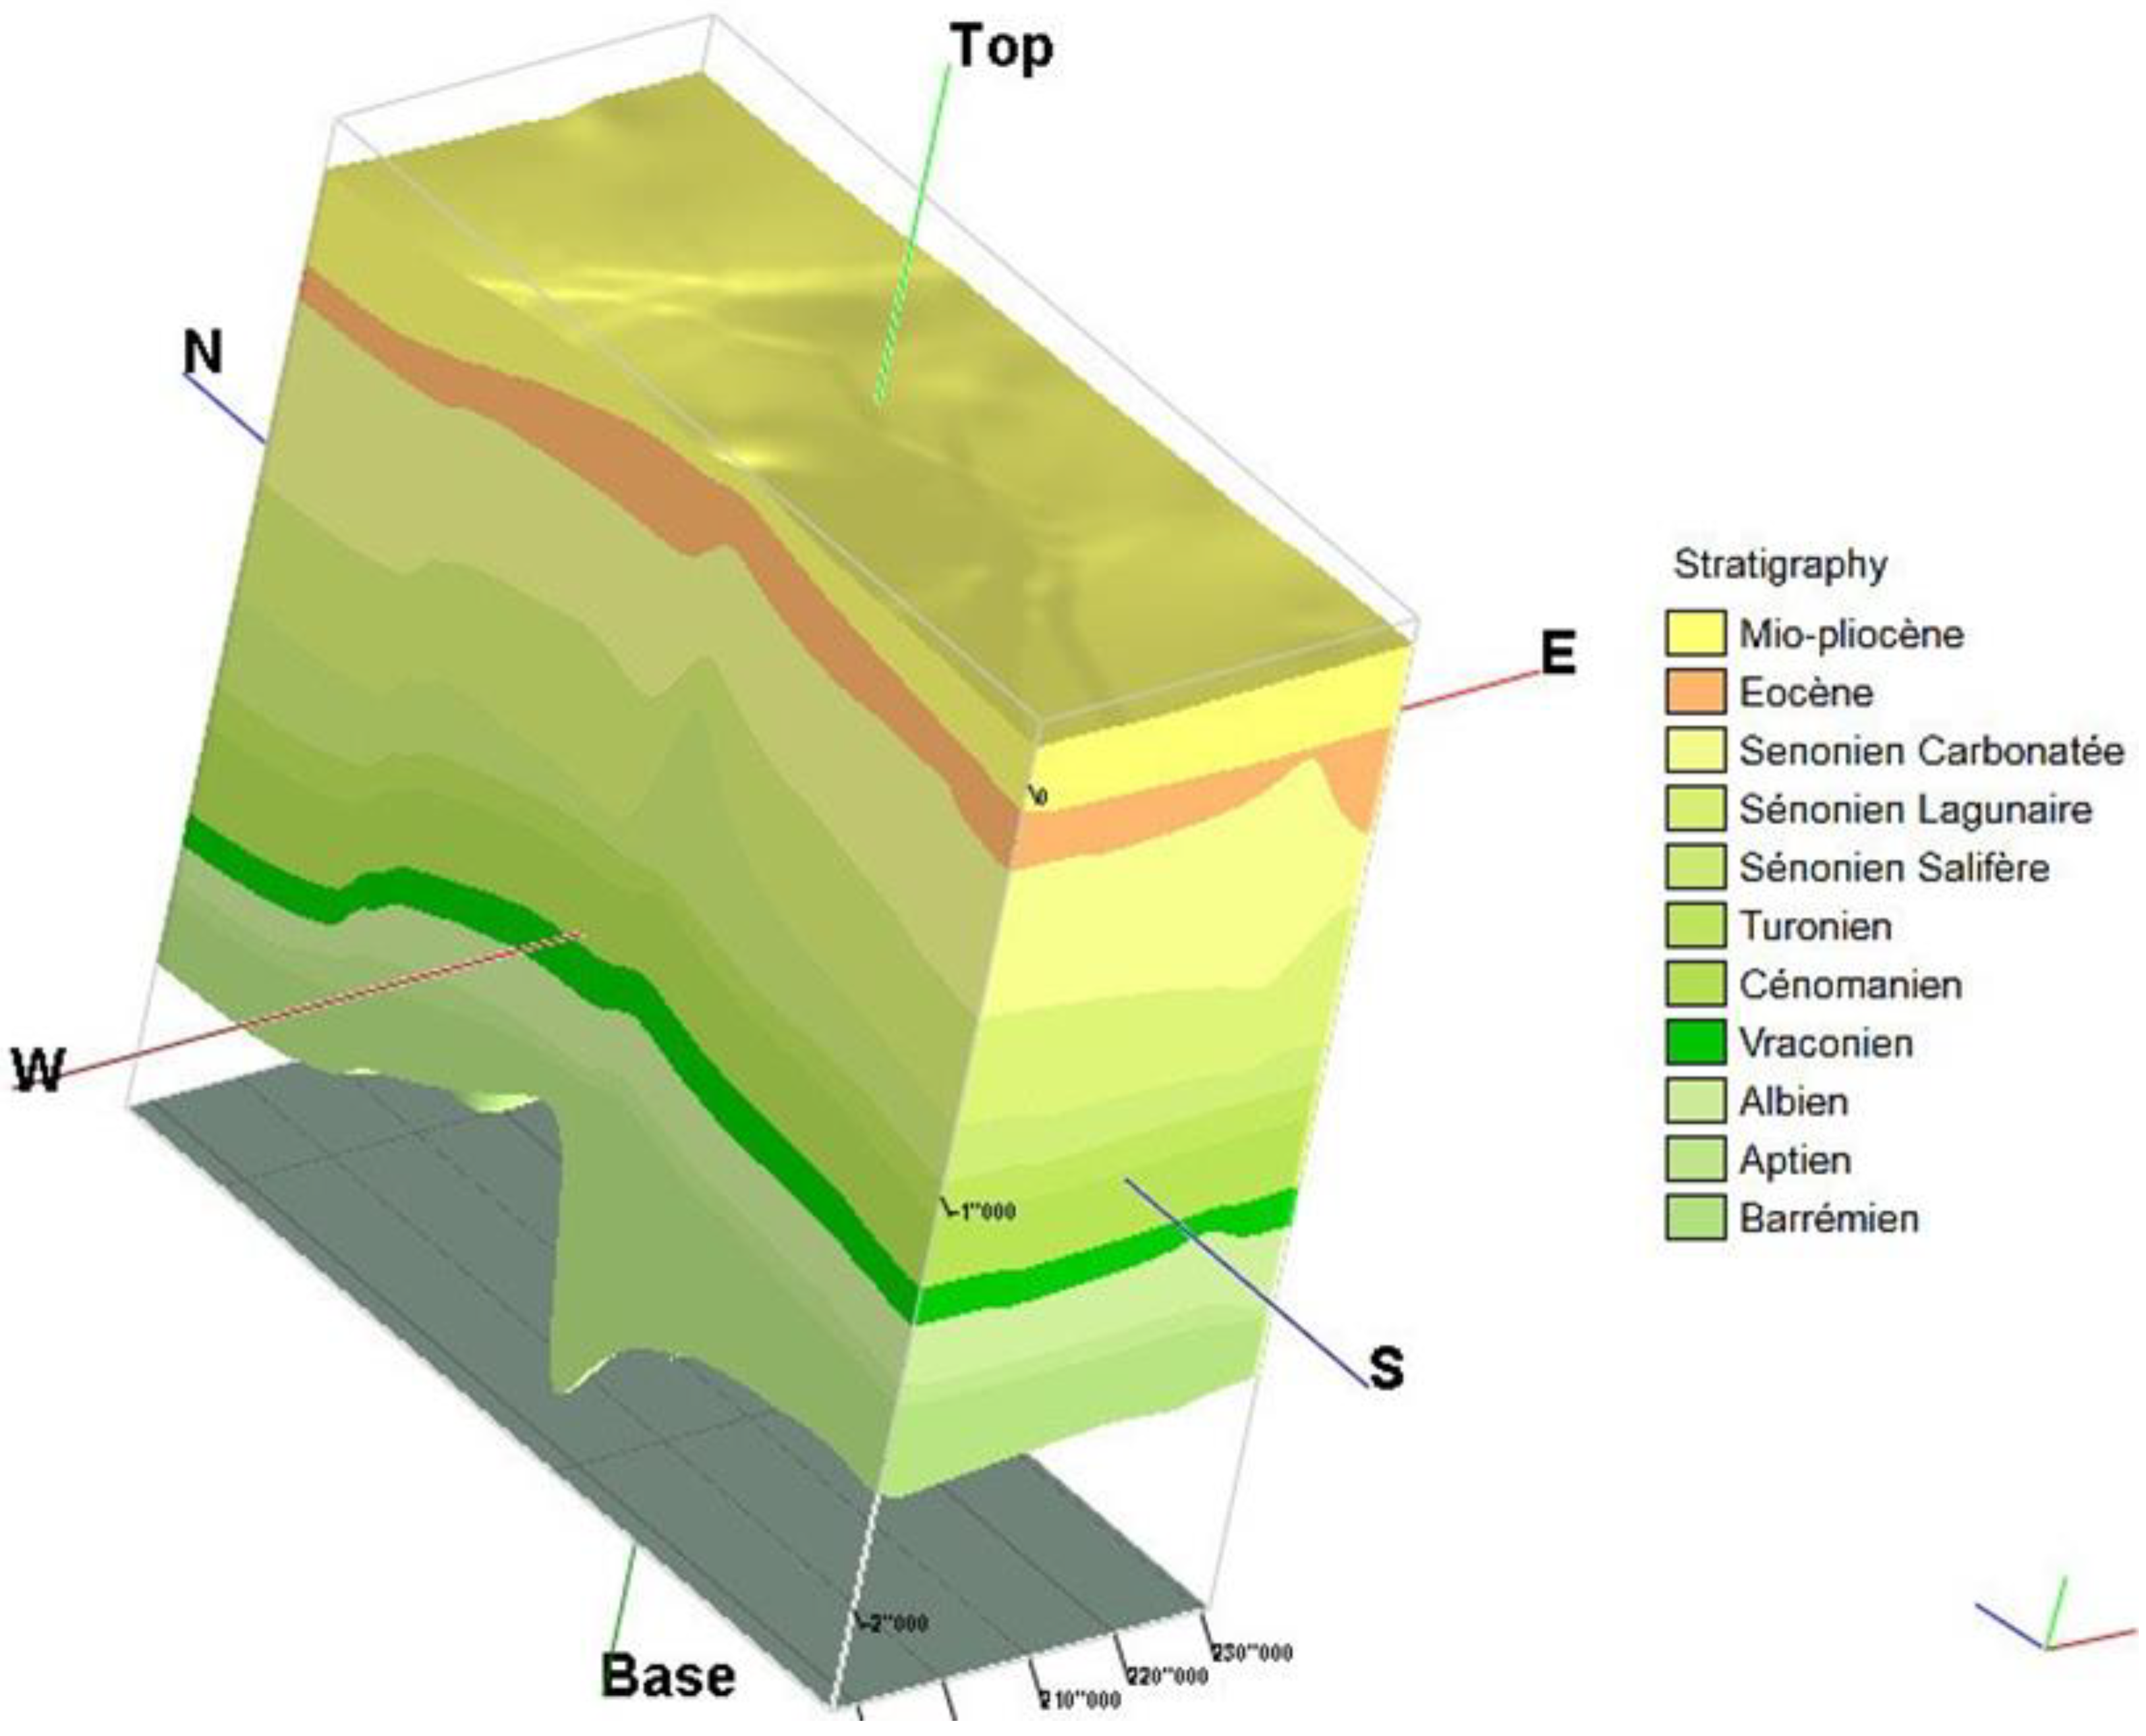
2.1.2. Geology and Hydrogeology Aspect
- The first one is the deep and extensive Intercalary Continental: largely made up of sands and sandstones of Albian and Barremian age.
- The second is multilayered, and less extensive than the first called the Terminal Complex, consisting of two different sets (marine comprising limestone of Senonian-Eocene age and continental consisting of sands, gravels, sandstones with intercalation of gypsum and clay; Mio-Pliocene age, it is the first and second layer of TC) [32,33].
- The last one is a free superficial aquifer that overlies these two sets, called phreatic nappe contained in the fine to medium sands of Quaternary age (Figure 3).
2.2. Sampling and Analysis
2.3. Irrigational Suitability Indices
2.4. Irrigation Water Quality Index (IWQI)
2.5. Geospatial Analysis
3. Results and Discussion
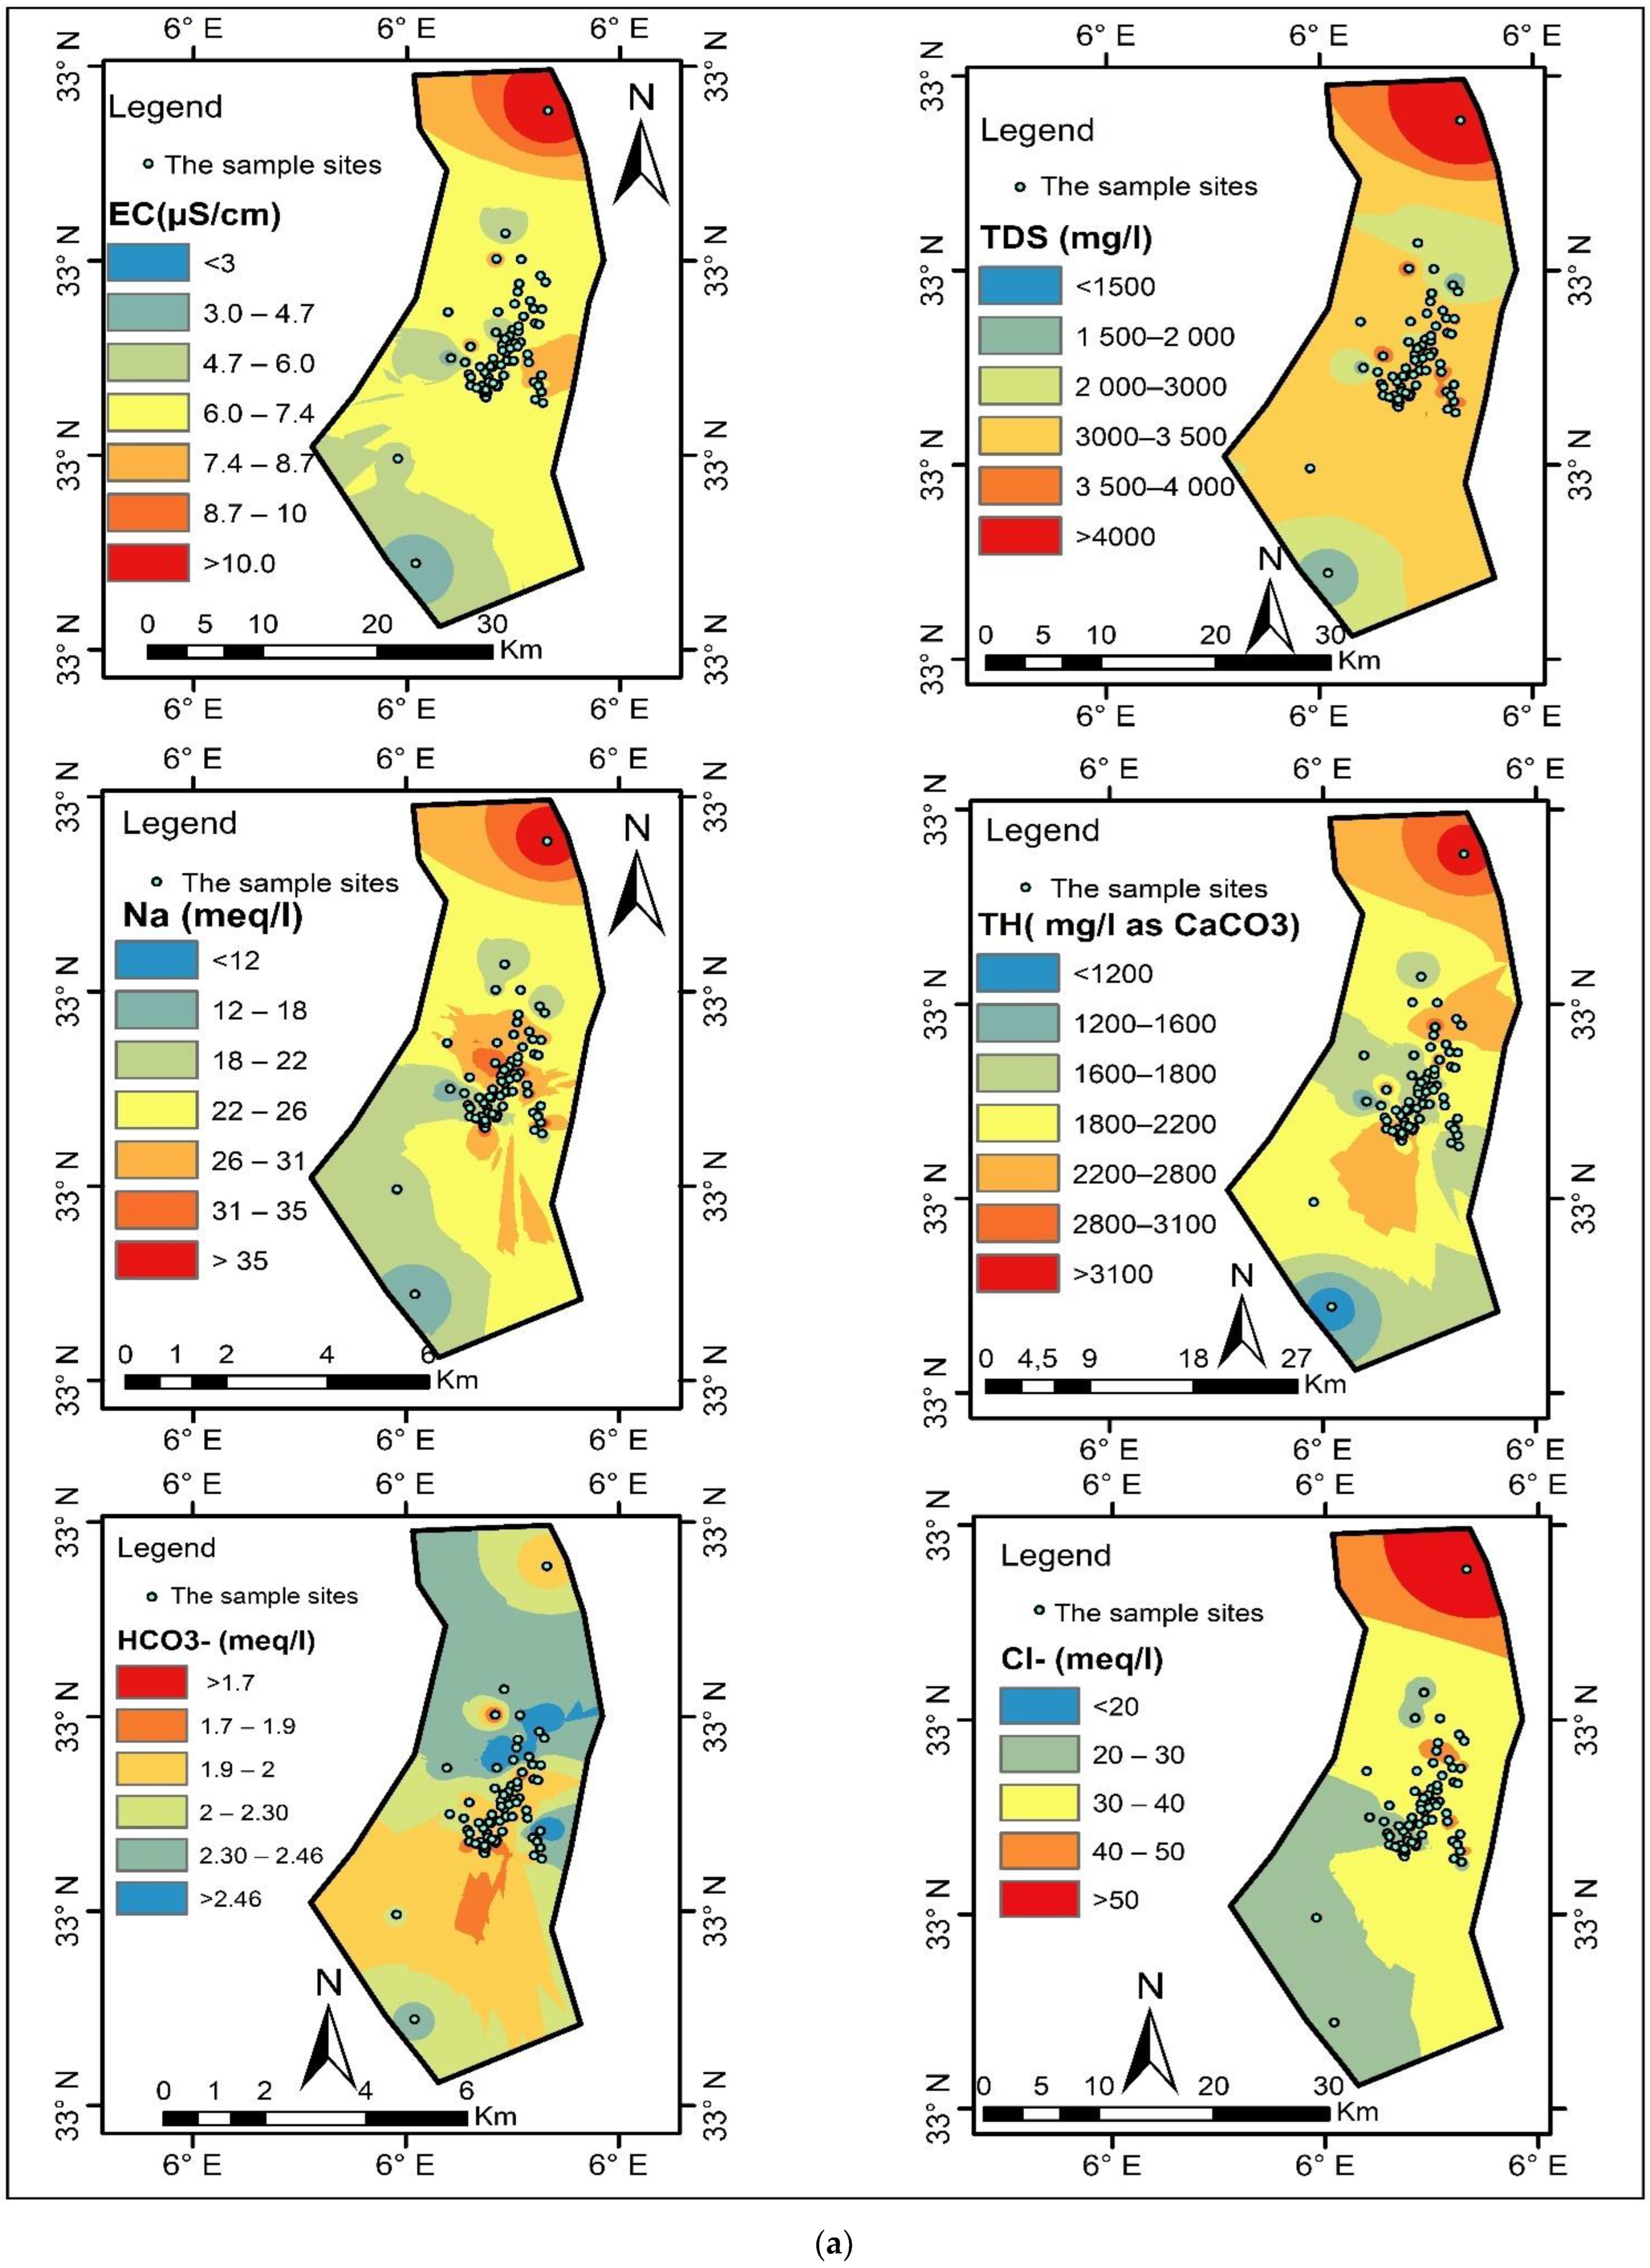
3.1. Hydrochemical Properties of Groundwater Quality
3.1.1. Salinity Hazard
3.1.2. Sodicity Hazard
3.1.3. Alkalinity Hazard
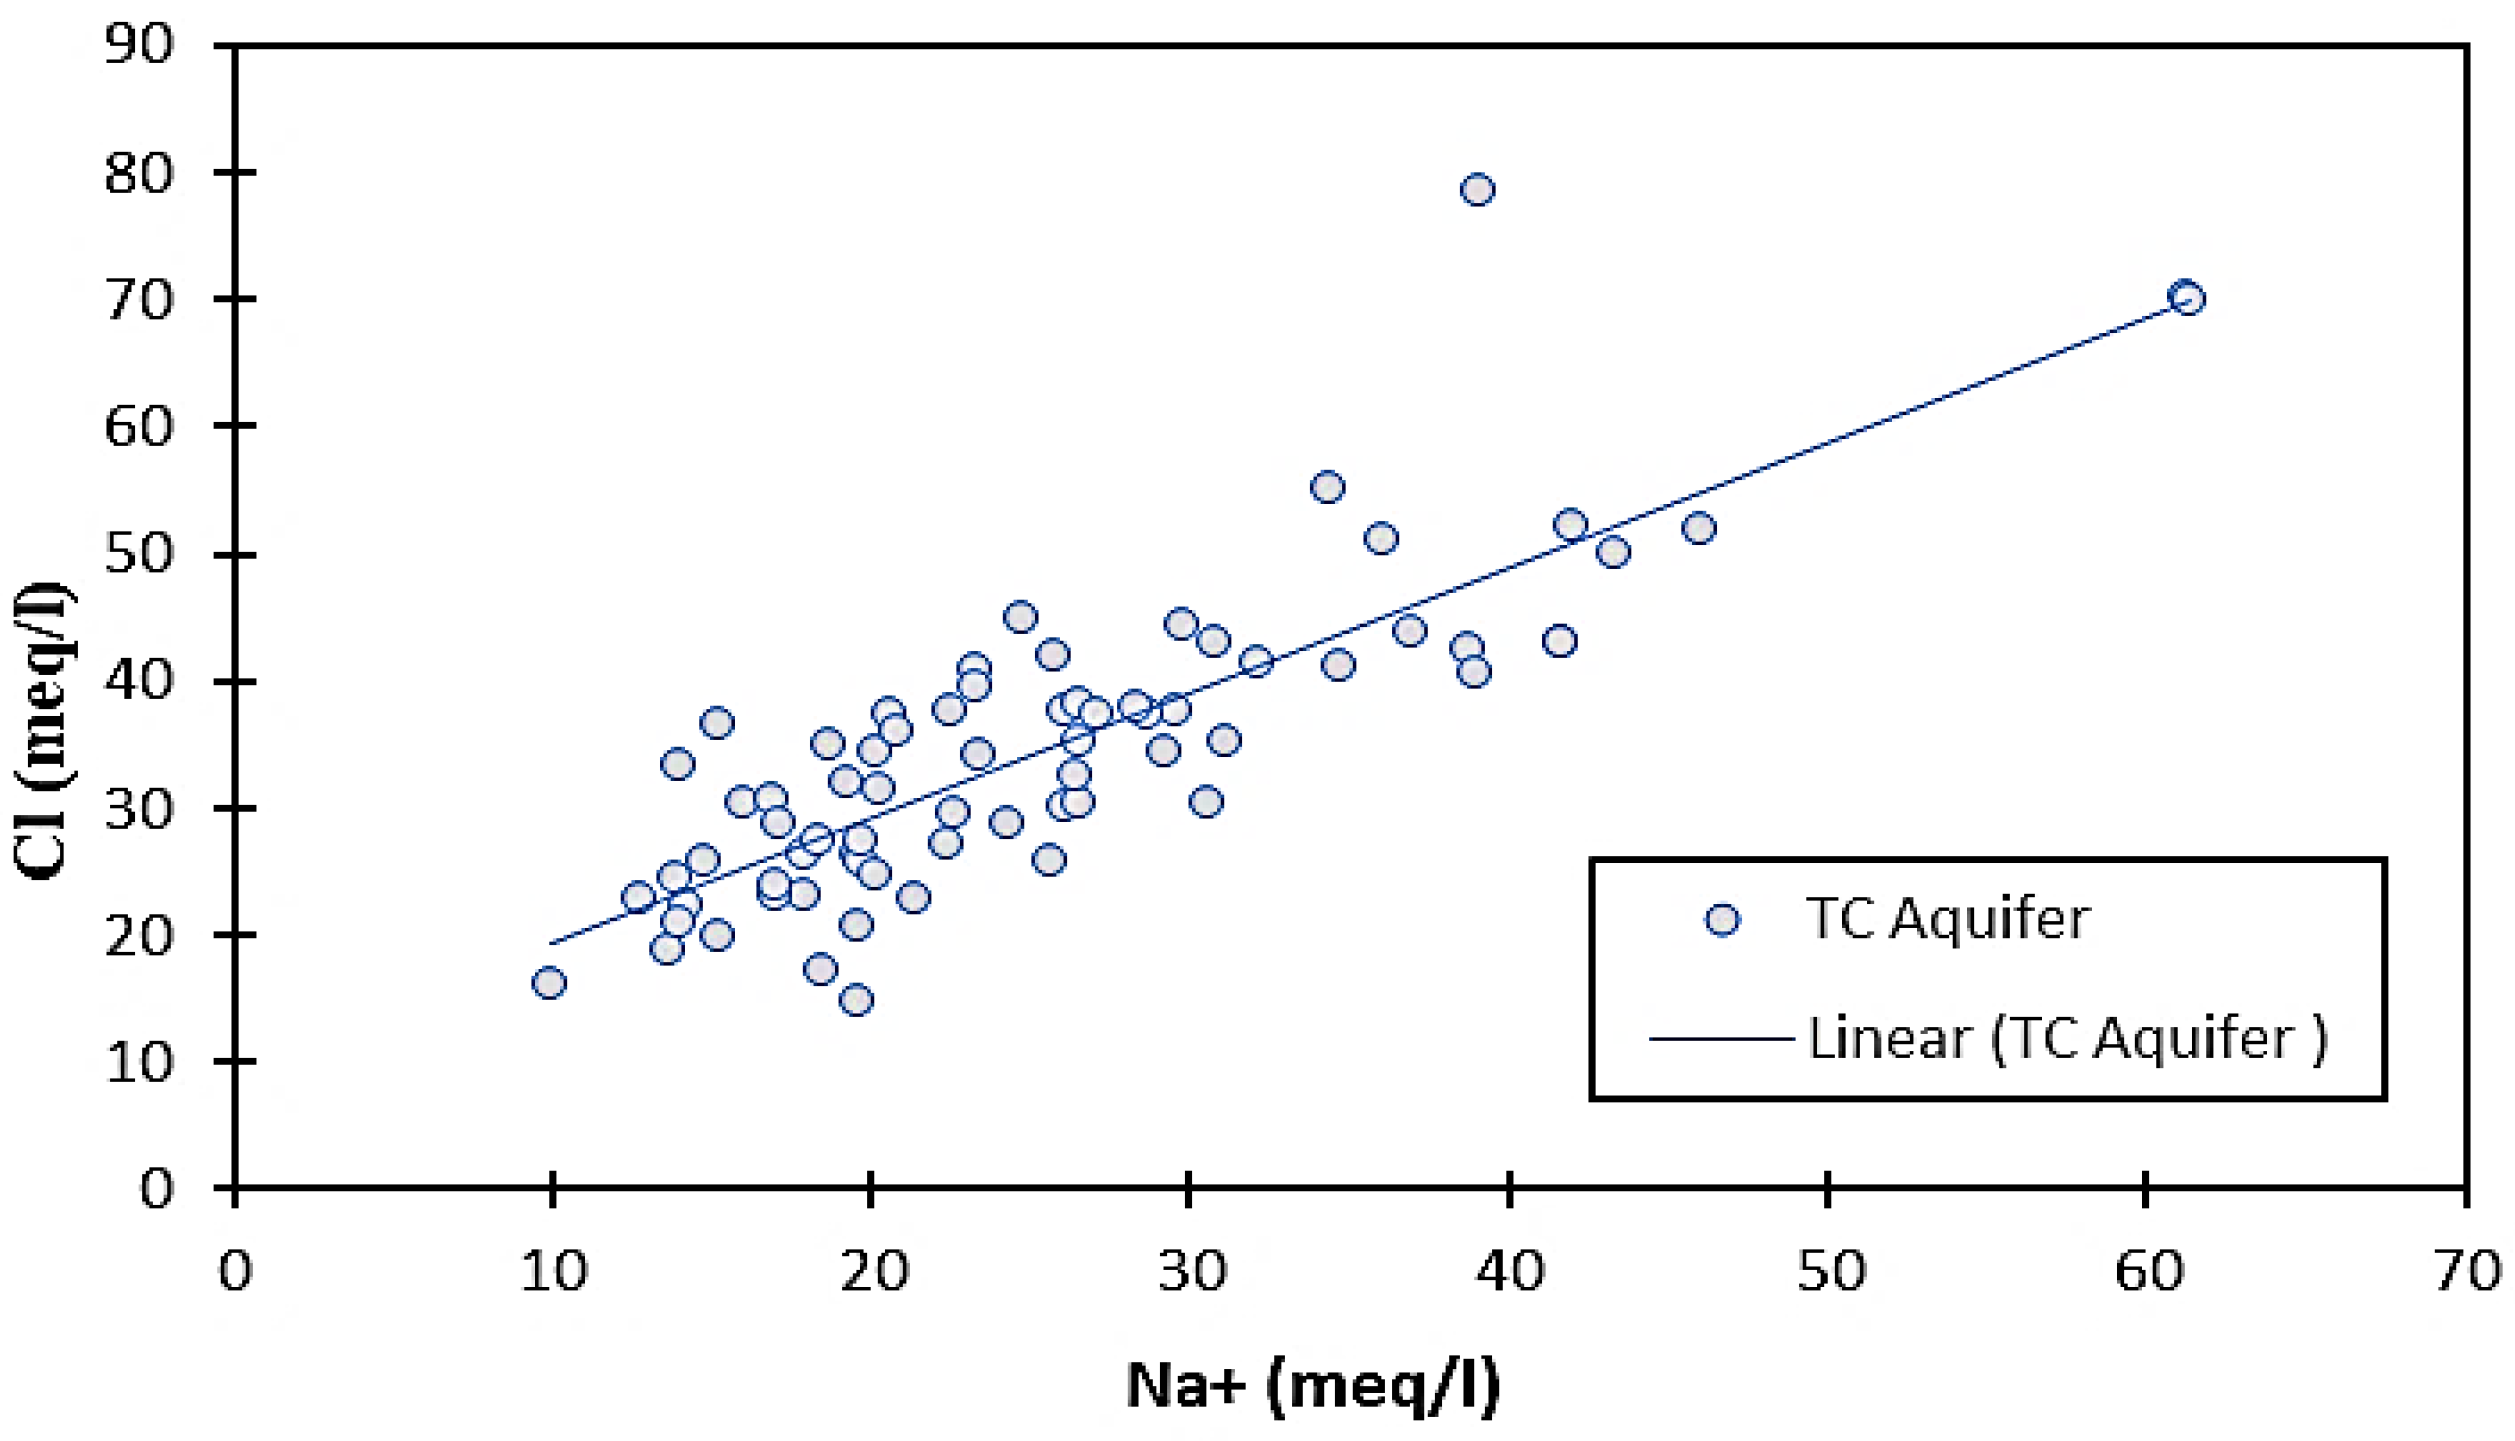
3.1.4. Toxicity and Miscellaneous Effects
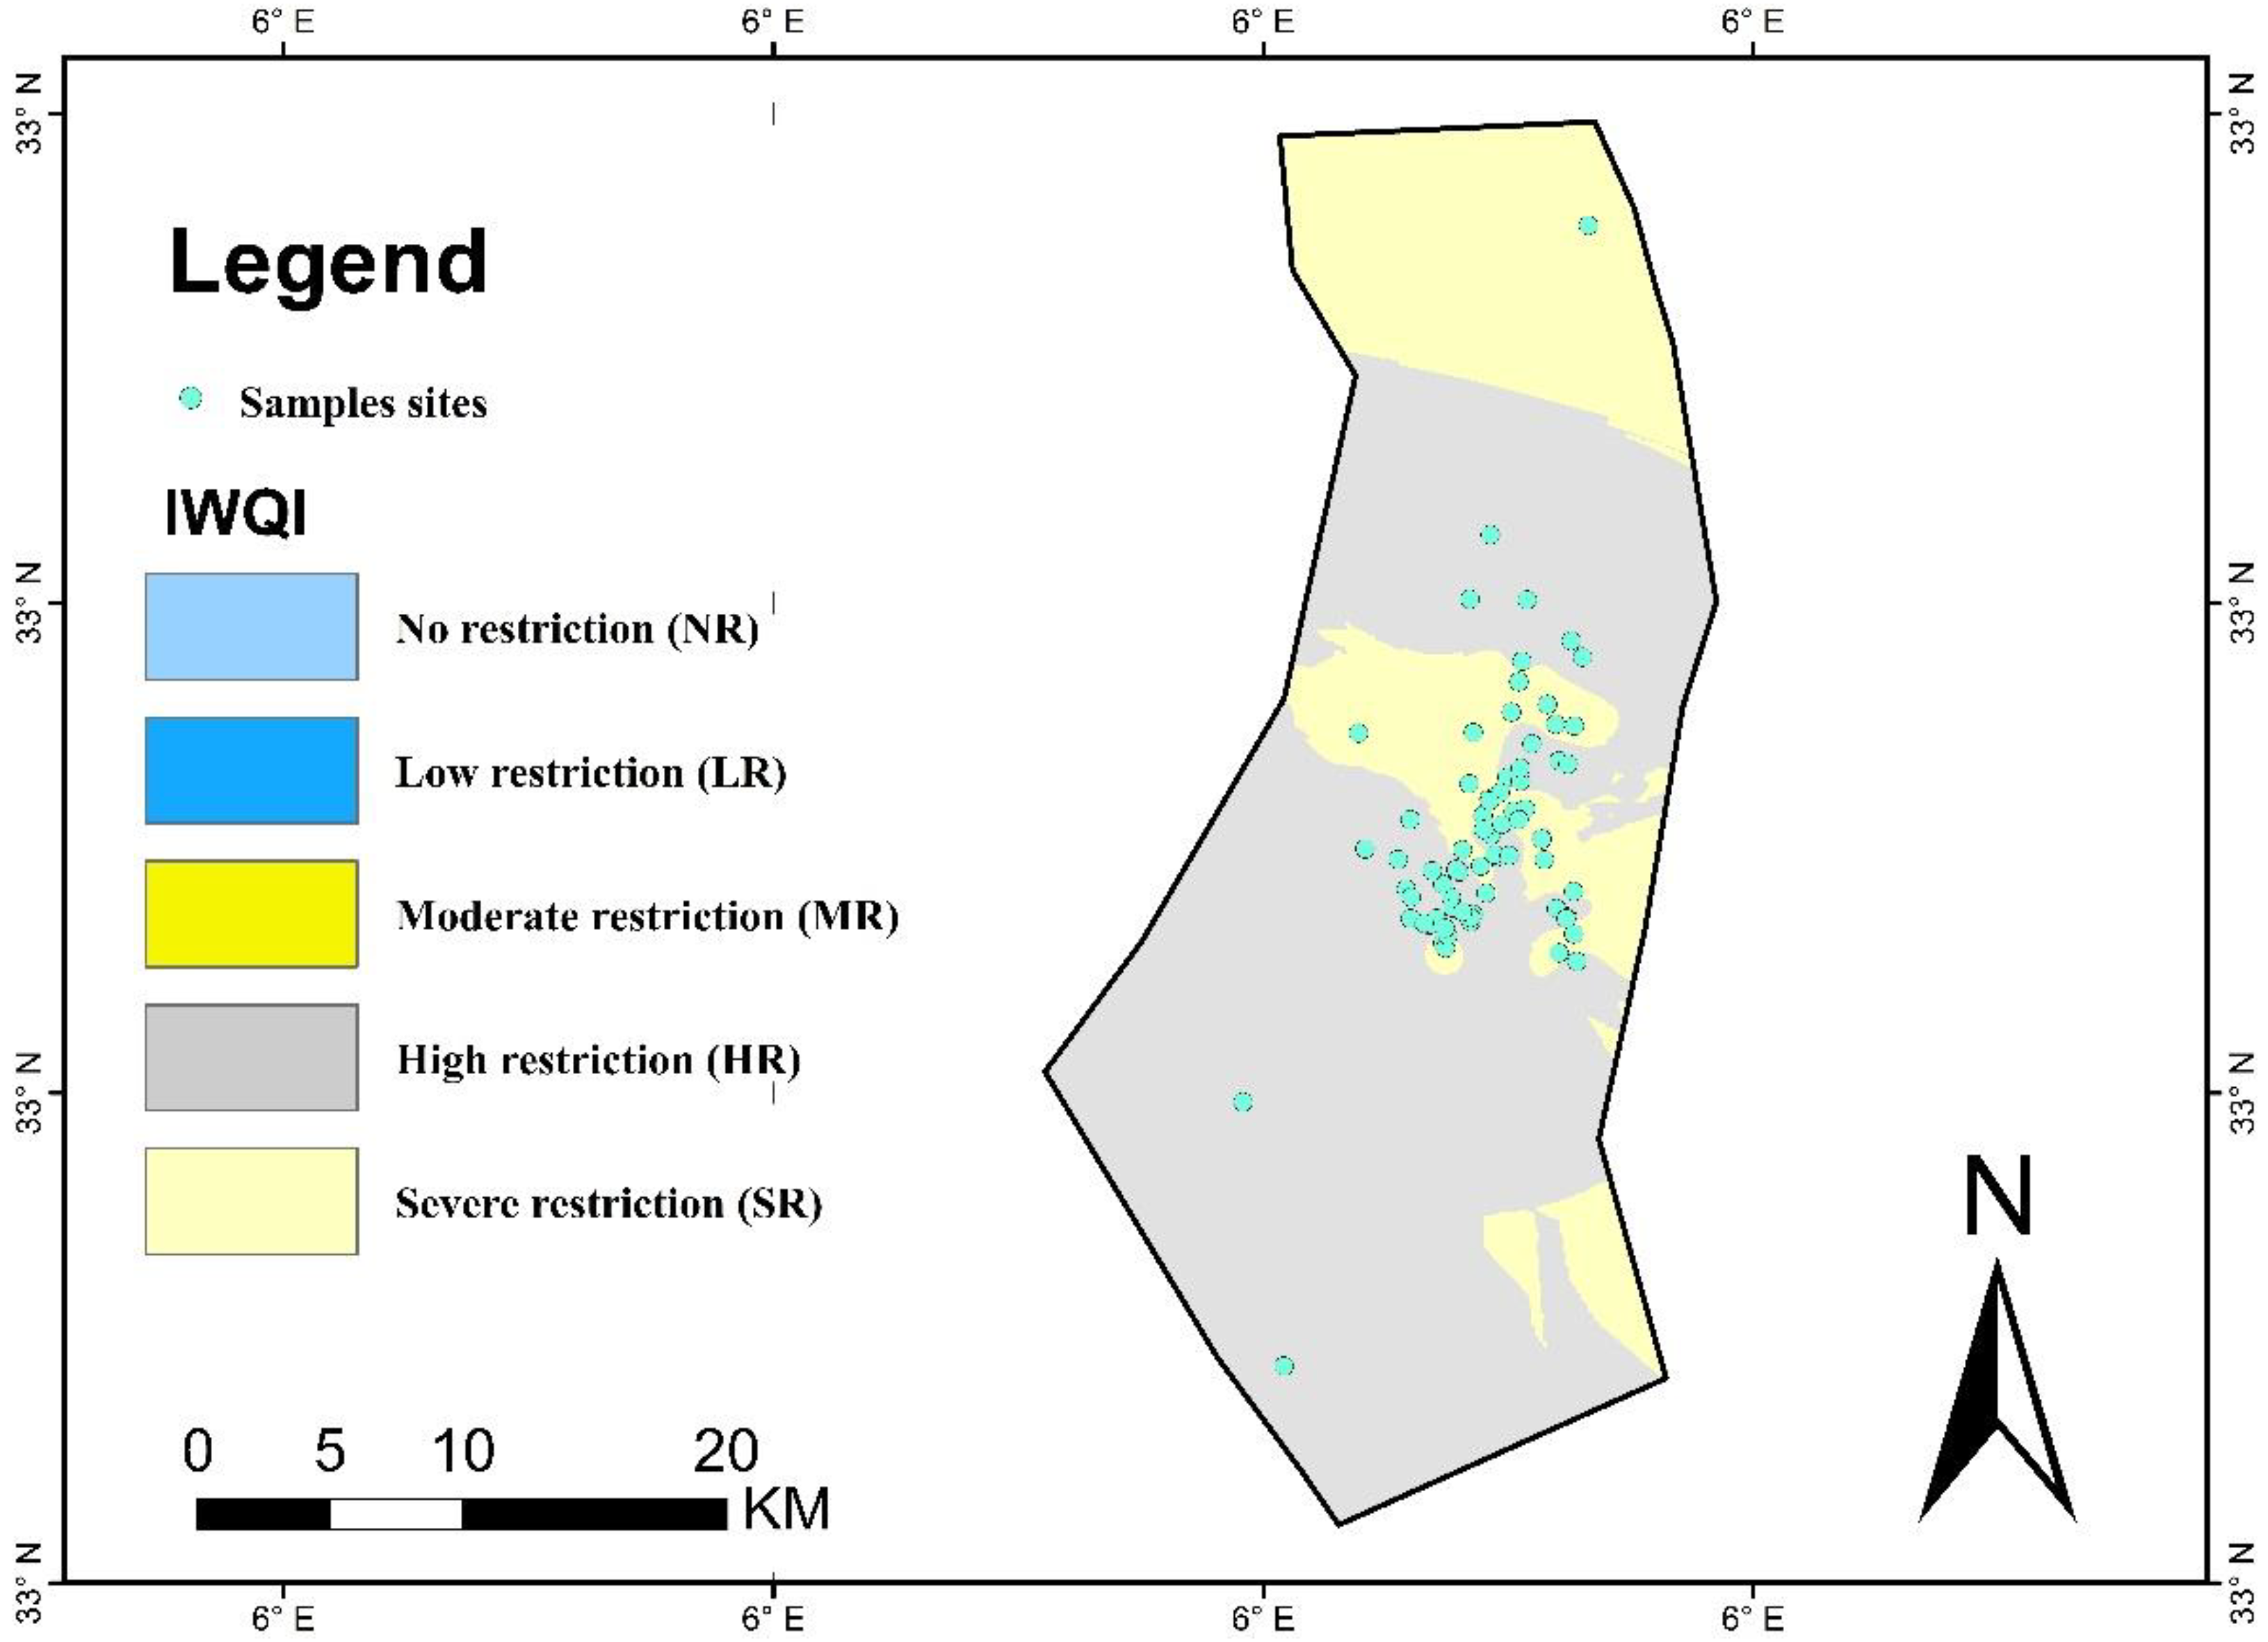
3.2. Irrigation Water Quality Index
4. Conclusions
Author Contributions
Funding
Institutional Review Board Statement
Informed Consent Statement
Data Availability Statement
Acknowledgments
Conflicts of Interest
Appendix A

| Sample Number | EC | SAR | KR | Na% | PI | RSC | MH | Sample Number | EC | SAR | KR | Na % | PI | RSC | MH |
|---|---|---|---|---|---|---|---|---|---|---|---|---|---|---|---|
| W1 | 3.84 | 4.75 | 0.74 | 42.54 | 46.81 | −18.22 | 51.24 | W37 | 5.8 | 3.38 | 0.41 | 29.054 | 32.26 | −31.68 | 83.99 |
| W2 | 4.27 | 5.88 | 0.88 | 46.89 | 50.48 | −19.91 | 52.08 | W38 | 9.6 | 4.96 | 0.5 | 33.213 | 35.23 | −47.55 | 84.84 |
| W3 | 3.05 | 4.68 | 0.8 | 44.57 | 49.33 | −14.81 | 50.27 | W39 | 10 | 9.35 | 1.04 | 50.995 | 52.69 | −38.45 | 83.47 |
| W4 | 2.83 | 3.32 | 0.55 | 35.56 | 40.9 | −15.87 | 44.7 | W40 | 10.2 | 13.53 | 1.49 | 59.865 | 61.48 | −38.38 | 82.07 |
| W5 | 6.26 | 7.82 | 1.03 | 50.81 | 53.63 | −25.93 | 55.89 | W41 | 7.7 | 4.27 | 0.45 | 31.151 | 33.3 | −42.65 | 80.8 |
| W6 | 4.73 | 5.00 | 0.64 | 38.99 | 42.12 | −28.14 | 57.54 | W42 | 7.9 | 2.95 | 0.31 | 23.703 | 26.16 | −43.05 | 81.98 |
| W7 | 7.19 | 5.80 | 0.64 | 39.19 | 41.65 | −37.79 | 48.52 | W43 | 7.8 | 6.67 | 0.72 | 41.903 | 43.82 | −40.75 | 84.3 |
| W8 | 4.53 | 4.09 | 0.56 | 36.09 | 39.75 | −23.93 | 47.19 | W44 | 7 | 5.12 | 0.56 | 35.957 | 38.19 | −39.41 | 81.2 |
| W9 | 6.33 | 6.40 | 0.79 | 43.98 | 46.12 | −31.62 | 21.59 | W45 | 6.4 | 6.81 | 0.68 | 40.348 | 42.67 | −46.84 | 83.62 |
| W10 | 12.48 | 6.79 | 0.59 | 37.04 | 38.38 | −64.51 | 52.99 | W46 | 5.8 | 6.10 | 0.63 | 38.518 | 40.63 | −44.81 | 78.83 |
| W11 | 6.5 | 6.41 | 0.77 | 43.64 | 46.19 | −31.86 | 50.85 | W47 | 6 | 4.16 | 0.42 | 29.597 | 31.71 | −46.78 | 80.18 |
| W12 | 5.89 | 3.91 | 0.43 | 29.95 | 32.38 | −39.79 | 48.82 | W48 | 6.3 | 2.92 | 0.28 | 21.979 | 24.48 | −50.86 | 82.92 |
| W13 | 7.1 | 3.12 | 0.35 | 25.98 | 28.6 | −37.51 | 81.68 | W49 | 7.5 | 4.85 | 0.5 | 33.52 | 35.8 | −43.71 | 77.06 |
| W14 | 6.7 | 8.21 | 0.93 | 48.30 | 50.29 | −36.4 | 81.24 | W50 | 8.4 | 4.68 | 0.49 | 32.722 | 34.71 | −44.36 | 83.99 |
| W15 | 6.9 | 4.62 | 0.54 | 35.16 | 37.73 | −34.19 | 81.88 | W51 | 9.2 | 4.07 | 0.4 | 28.513 | 31.21 | −48.23 | 83.97 |
| W16 | 6.6 | 6.18 | 0.72 | 42.00 | 44.63 | −33.71 | 79.91 | W52 | 5.9 | 6.10 | 0.7 | 41.205 | 43.54 | −35.6 | 84.05 |
| W17 | 7.9 | 3.90 | 0.41 | 28.99 | 31.31 | −43.47 | 82.56 | W53 | 5.78 | 4.13 | 0.44 | 30.322 | 32.64 | −42.74 | 57.42 |
| W18 | 7.3 | 3.69 | 0.42 | 29.80 | 32.39 | −35.82 | 81.92 | W54 | 5.95 | 3.69 | 0.4 | 28.62 | 30.59 | −40.94 | 56.97 |
| W19 | 7.1 | 3.08 | 0.37 | 27 | 30.16 | −32.34 | 83.86 | W55 | 6.12 | 3.22 | 0.31 | 23.535 | 25.28 | −53.25 | 62.42 |
| W20 | 7.4 | 9.34 | 1.13 | 52.96 | 54.91 | −32.41 | 79.83 | W56 | 6.63 | 3.49 | 0.36 | 26.211 | 28.14 | −46.69 | 69.66 |
| W21 | 5.8 | 10.38 | 1.24 | 55.43 | 57.36 | −32.55 | 74.28 | W57 | 6.46 | 3.34 | 0.33 | 24.667 | 26.75 | −49.96 | 63.68 |
| W22 | 6.1 | 3.33 | 0.39 | 27.96 | 30.85 | −34.54 | 82.48 | W58 | 6.29 | 5.40 | 0.5 | 33.28 | 34.85 | −56.76 | 64.63 |
| W23 | 6 | 5.03 | 0.63 | 38.61 | 41.31 | −30.03 | 78.88 | W59 | 6.29 | 3.72 | 0.35 | 25.979 | 27.86 | −54.1 | 58.76 |
| W24 | 5.9 | 7.84 | 0.95 | 48.82 | 51.01 | −31.64 | 80.63 | W60 | 6.46 | 3.24 | 0.29 | 22.284 | 23.98 | −61.87 | 62.63 |
| W25 | 5.6 | 5.33 | 0.63 | 38.62 | 41.01 | −33.98 | 88.73 | W61 | 6.63 | 3.76 | 0.38 | 27.627 | 29.66 | −46.56 | 60.13 |
| W26 | 5.5 | 10.11 | 1.31 | 56.71 | 58.79 | −27.73 | 86.22 | W62 | 6.8 | 4.33 | 0.42 | 29.44 | 31.2 | −51.97 | 63.17 |
| W27 | 6.2 | 11.07 | 1.47 | 59.53 | 61.52 | −26.37 | 85.87 | W63 | 6.97 | 4.41 | 0.4 | 28.652 | 30.31 | −58.43 | 60.85 |
| W28 | 5.4 | 8.56 | 1.06 | 51.36 | 53.56 | −30.65 | 82.77 | W64 | 5.95 | 4.65 | 0.41 | 28.928 | 30.42 | −63.41 | 65.38 |
| W29 | 4.9 | 9.55 | 1.23 | 55.19 | 57.48 | −27.68 | 81.29 | W65 | 7.82 | 5.04 | 0.5 | 33.131 | 34.83 | −49.97 | 69.53 |
| W30 | 5.2 | 8.19 | 1.1 | 52.33 | 54.88 | −25.58 | 84.13 | W66 | 7.99 | 4.61 | 0.5 | 33.112 | 35.07 | −41.68 | 58.88 |
| W31 | 6.4 | 10.70 | 1.24 | 55.44 | 57.06 | −35.14 | 79.38 | W67 | 8.33 | 4.40 | 0.41 | 29.234 | 31.07 | −54.46 | 65.65 |
| W32 | 6.5 | 11.25 | 1.52 | 60.29 | 62.3 | −25.5 | 79.58 | W68 | 8.5 | 4.95 | 0.45 | 31.13 | 32.76 | −58 | 66.18 |
| W33 | 6.9 | 3.95 | 0.44 | 30.42 | 32.94 | −38.68 | 75.83 | W69 | 7.31 | 5.27 | 0.48 | 32.641 | 33.97 | −57.68 | 66.29 |
| W34 | 6.9 | 4.48 | 0.52 | 34.28 | 36.89 | −34.8 | 81.69 | W70 | 8.5 | 4.56 | 0.4 | 28.782 | 30.18 | −62.12 | 69.46 |
| W35 | 6.8 | 4.86 | 0.59 | 36.91 | 39.68 | −32.26 | 71.15 | W71 | 9.18 | 5.71 | 0.52 | 34.379 | 35.96 | −57.37 | 72.65 |
| W36 | 4.9 | 15.17 | 1.88 | 65.25 | 66.93 | −30.15 | 82.5 | W72 | 7.48 | 4.98 | 0.44 | 30.396 | 31.84 | −63.1 | 72.58 |
References
- World Health Organization (WHO). WHO Country Cooperation Strategy 2008–2013: Bangladesh; WHO Country Office for Bangladesh: Dhaka, Bangladesh, 2007. [Google Scholar]
- Nouayti, N.; Khattach, D.; Hilali, M. Evaluation de la qualité physico-chimique des eaux souterraines des nappes du Jurassique du haut bassin de Ziz (Haut Atlas central, Maroc) Assessment of physico-chemical quality of groundwater of the Jurassic aquifers in high basin of Ziz (Central High Atlas, Morocco). J. Mater. Environ. Sci. 2015, 6, 1068–1081. [Google Scholar]
- El-MBellaredj, A.; Hamidi, M. The hydrochemical characterization of the underground waters of the plain of Sidi Bel Abbès (northwestern Algeria). Alger. J. Environ. Sci. Technol. 2018, 4, 671–682. [Google Scholar]
- Abdelbaki, C.; Hacène, F.B. Etude du phénomène de dégradation des eaux souterraines du groupement urbain de Tlemcen. J. Renew. Energ. 2007, 10, 257–263. [Google Scholar]
- Madhav, S.; Ahamad, A.; Kumar, A.; Kushawaha, J.; Singh, P.; Mishra, P.K. Geochemical assessment of groundwater quality for its suitability for drinking and irrigation purpose in rural areas of Sant Ravidas Nagar (Bhadohi), Uttar Pradesh. Geol. Ecol. Landsc. 2018, 2, 127–136. [Google Scholar] [CrossRef] [Green Version]
- Saber, K. Hydro-Chemical Study with Geospatial Analysis of Groundwater Quality Illizi Region, South-East of Algeria. Publ. Iran. J. Chem. Chem. Eng. 2021, 40, 1315–1329. [Google Scholar] [CrossRef]
- Meireles, A.C.M.; De Andrade, E.M.; Chaves, L.C.G.; Frischkorn, H.; Crisostomo, L.A. A new proposal of the classification of irrigation water. Rev. Cienc. A Gronomica 2010, 41, 349–357. [Google Scholar] [CrossRef] [Green Version]
- Stoner, J.D. Water-Quality Indices for Specific Water Uses; Department of the Interior, Geological Survey: Arlington, VA, USA, 1978. [Google Scholar] [CrossRef] [Green Version]
- Ghazaryan, K.; Chen, Y. Hydrochemical assessment of surface water for irrigation purposes and its influence on soil salinity in Tikanlik oasis, China. Environ. Earth Sci. 2016, 75, 383. [Google Scholar] [CrossRef]
- Aravinthasamy, P.; Karunanidhi, D.; Rao, N.S.; Subramani, T.; Srinivasamoorthy, K. Irrigation risk assessment of groundwater in a non-perennial river basin of South India: Implication from irrigation water quality index (IWQI) and geographical information system (GIS) approaches. Arab. J. Geosci. 2020, 13, 1125. [Google Scholar] [CrossRef]
- Gharbi, A.; Ibn Ali, Z.; Zairi, M. Groundwater suitability for drinking and agriculture purposes using irrigation water quality index and multivariate analysis: Case of Sidi Bouzid aquifer, central Tunisia. Environ. Earth Sci. 2019, 78, 692. [Google Scholar] [CrossRef]
- Al-Hadithi, M.; Hasan, K.; Algburi, A.; Al-Paruany, K. Groundwater Quality Assessment Using Irrigation Water Quality Index and GIS in Baghdad, Iraq. Jordan J. Earth Environ. Sci. 2019, 10, 15–20. [Google Scholar]
- Karakuş, C.B.; Yıldız, S. Evaluation for Irrigation Water Purposes of Groundwater Quality in the Vicinity of Sivas City Centre (Turkey) by Using Gis and an Irrigation Water Quality Index. Irrig. Drain. 2019, 69, 121–137. [Google Scholar] [CrossRef]
- Khanoranga; Khalid, S. An assessment of groundwater quality for irrigation and drinking purposes around brick kilns in three districts of Balochistan province, Pakistan, through water quality index and multivariate statistical approaches. J. Geochem. Explor. 2018, 197, 14–26. [Google Scholar] [CrossRef]
- Omran, I.; Marwa, F. Evaluation of Drainage Water Quality for Irrigation by Integration between Irrigation Water Quality Index and GIS. Int. J. Tech. Res. Appl. 2015, 3, 24–32. [Google Scholar]
- Rasul, M.K.; Waqed, H.H. Evaluation of irrigation water quality index (IWQI) for al-dammam confined aquifer in the west and southwest of karbala city, Iraq. Int. J. Civ. Eng. 2015, 2, 21–34. [Google Scholar]
- AL-Musawi, W.H. Assessment of Groundwater Quality in UMM ER Radhuma Aquifer (Iraqi Western Desert) by Integration between Irrigation Water Quality Index and GIS; Report Submitted by Civil Engineering; University of Karbala: Karbala, Iraq, 2014. [Google Scholar]
- Rokbani, M.K.; Gueddari, N.; Bouhlila, R. Use of Geographical Information System and Water Quality Index to Assess Groundwater Quality in El Khairat Deep Aquifer (Enfidha, Tunisian Sahel). Iran. J. Energy Environ. 2011, 2, 133–144. [Google Scholar]
- Jerome, C.; Pius, A. Evaluation of water quality index and its impact on the quality of life in an industrial area in Bangalore, South India. Am. J. Sci. Ind. Res. 2010, 1, 595–603. [Google Scholar] [CrossRef] [Green Version]
- Nasereddine, C. Caractérisation hydrochimique et aptitude à l’irrigation des eaux du (CI) dans la région de Touggourt -Ouargla- Oued Righ au sud algérien. In Proceedings of the 1st National Seminar on Geosciences and Environment SGSE’19, Tamanrasset, Algérie, 23–24 October 2019. [Google Scholar]
- Chaib, W.; Bouchahm, N.; Harrat, N.; Zahi, F.; Bougherira, N.; Djabri, L. Caracterisation Hydrogeochimique des Eaux Geothermales de la nappe du Continental Intercalaire de la region de l’Oued Righ. J. Algérien Régions Arid. 2013, 2013, 55–64. [Google Scholar]
- Bouselsal, B.; Belksier, M.S. Qualité des eaux de l’aquifère de complexe terminal de Sahara Septentrional: Cas de la région de Taibet (SE Algérie). Int. J. Environ. Water 2018, 7, 53–61. [Google Scholar]
- Dubost, D. Aridité, agriculture et développement: Le cas des oasis algériennes. Sécheresse 1992, 3, 85–96. [Google Scholar]
- Busson, G. Le Mésozoïque saharien, tômes 1 et 2; Centre National de Recherche Scientifique: Paris, France, 1970. [Google Scholar]
- Fabre, J. Introduction à la Géologie du Sahara d’Algérie et des Régions Voisines; SNED: Alger, Algeria, 1976; p. 421. [Google Scholar]
- UNESCO. Study of the Water Resources of the Northern Sahara. (7 vols. and Annexes); UNESCO: Paris, France, 1972. [Google Scholar]
- SSO (Sahara and Sahel Observatory). Northern Sahara Aquifer System: Joint Management of a Transboundary Basin; Synthesis Report; SSO: Tunis, Tunisia, 2003; Available online: http://www.oss-online.org/fr/a-propos-oss (accessed on 20 May 2022).
- Belksier, M.S. Hydrogeological Characteristics of the Surface Water Table in the Oued Righ Region and Assessment of the Impact of Pollution and Salinity on the Quality of Its Waters. Ph.D. Thesis, Badji Mokhtar-Annaba-University, Algeria, 2017; pp. 76–77. [Google Scholar]
- Bouterid, C. Apports des Données Lithostratigraphiques à la Modélisation Géologique 3D dans la ville d’Oued Righ. Master’s Thesis, Université L’arbi Ben Mhidi-Oum El Bouaghi, Oum El Bouaghi, Algeria, 2021; pp. 53–56. [Google Scholar]
- Busson, G. Principes, Méthodes et Résultats d’une étude Stratigraphique du Mésozoïque Saharien; Muséum National d’Histoire Naturelle: Paris, France, 1971; p. 464. [Google Scholar]
- Cornet, A. Introduction à l’hydrogéologie Saharienne. Rev. Géographie Phys. Géol. Dyn. 1964, 61, 5–72. [Google Scholar]
- Guendouz, A.; Moulla, A.S.; Edmunds, W.M.; Zouari, K.; Shand, P.; Mamou, A. Hydrogeochemical and isotopic evolution of water in the Complexe Terminal aquifer in the Algerian Sahara. Appl. Hydrogeol. 2003, 11, 483–495. [Google Scholar] [CrossRef]
- Castany, G. Bassin sédimentaire du Sahara septentrional (Algérie-Tunisie). Aquifère du Continental Intercalaire et du Complexe terminal. Bull. BRGM 2 1982, III, 127–147. [Google Scholar]
- Bouchahm, N. Etude de la Répartition Spatiale des Teneurs en Fluorures des eaux du Sahara Septentrional. Ph.D. Thesis, Thèse de Magistère en Hydraulique, Université de Biskra, Biskra, Algeria, 1999. [Google Scholar]
- Rodier, J.; Legube, B.; Merlet, N. L’Analyse de l’eau 9e édition, Entièrement Mise À Jour Dunod Paris. 2009. Available online: https://ulysse.univlorraine.fr/discovery/fulldisplay?docid=alma991006015119705596&context=L&vid=33UDL_INST:UDL&lang=fr&adaptor=Local%20Search%20Engine (accessed on 20 May 2022).
- Holanda, J.S.; Amorim, J.A. Management and Control Salinity and Irrigated Agriculture Water; Congresso Brasileiro de Engenharia Setting: Campina Grande, Brazil, 1997; pp. 137–169. [Google Scholar]
- Azlaoui, M.; Zeddouri, A.; Haied, N.; Nezli, I.E.; Foufou, A. Assessment and Mapping of Groundwater Quality for Irrigation and Drinking in a Semi-Arid Area in Algeria. J. Ecol. Eng. 2021, 22, 19–32. [Google Scholar] [CrossRef]
- Singh, P.; Thakur, J.K.; Singh, U.C. Morphometric analysis of Morar River Basin, Madhya Pradesh, India, using remote sensing and GIS techniques. Environ. Earth Sci. 2013, 68, 1967–1977. [Google Scholar] [CrossRef]
- Ayers, R.S.; Westcot, D.W. Water Quality for Agriculture; Food and Agriculture Organization of the United Nations: Rome, Italy, 1985; Available online: https://www.fao.org/3/t0234e/T0234E06.htm#ch5.2 (accessed on 20 May 2022).
- Wetzel, R.G. Limnology, 2nd ed.; Saunders College Publishing: Philadelphia, PA, USA, 1983; Volume XI, p. 767. [Google Scholar]
- Varol, S.; Davraz, A. Evaluation of the groundwater quality with WQI (Water Quality Index) and multivariate anal410 ysis: A case study of the Tefenni plain (Burdur/Turkey). Environ. Earth Sci. 2015, 73, 1725–1744. [Google Scholar] [CrossRef]
- Richards, L.A. Diagnosis and Improvement of Saline Alkali Soils: Agriculture, Vole 160. Handbook 60; US Department of Agriculture: Washington, DC, USA, 1954. [Google Scholar]
- Bauder, T.A.; Waskom, R.M.; Sutherland, P.L.; Davis, J.G. Irrigation Water Quality Criteria—0.506; Colorado State University: Fort Collins, CO, USA, 2003. [Google Scholar]
- Geilfus, C.-M. Review on the significance of chlorine for crop yield and quality. Plant Sci. 2018, 270, 114–122. [Google Scholar] [CrossRef]
- Gouaidia, L.; Laouar, M.S.; Défaflia, N.; Zenati, N. Origine de la Mineralisation des Eaux Souterraines d’un aquifere dans une zone semi—aride, cas de la nappe de la MERDJA, NORD—EST ALGERIEN. Int. J. Environ. Water 2017, 6, 104–114. [Google Scholar]
- Jassim, S.Z.; Goff, J.C. Geology of Iraq; Dolin Prague and Moravian Museum: Brno, Czech Republic, 2006; p. 341. [Google Scholar]

| qi | EC (μS cm−1) | SAR (mmol L−1)1/2 | Na+ (meq L−1) | Cl− (meq L−1) | HCO3− (meq L−1) |
|---|---|---|---|---|---|
| 85–100 | 200 ≤ EC < 750 | 2 ≤ SAR < 3 | 2 ≤ Na < 3 | 1 ≤ Cl < 4 | 1 ≤ HCO3 < 1.5 |
| 60–85 | 750 ≤ EC < 1500 | 3 ≤ SAR < 6 | 3 ≤ Na < 6 | 4 ≤ Cl < 7 | 1.5 ≤ HCO3 < 4.5 |
| 35–60 | 1500 ≤ EC < 3000 | 6 ≤ SAR < 12 | 6 ≤ Na < 9 | 7 ≤ Cl < 10 | 4.5 ≤ HCO3 < 8.5 |
| 0–35 | EC < 200 or | SAR < 2 or | Na < 2 or | Cl < 1 or | HCO3 < 1 or |
| EC ≥ 3000 | SAR ≥ 12 | Na ≥ 9 | Cl ≥ 10 | HCO3 ≥ 8.5 |
| Parameters | Wi |
|---|---|
| EC | 0.211 |
| Na | 0.204 |
| HCO3 | 0.202 |
| Cl | 0.194 |
| SAR | 0.189 |
| Total | 1 |
| Sample Number | Parameters | |||||||||
|---|---|---|---|---|---|---|---|---|---|---|
| pH | EC | TDS | TH | Ca | Mg | Na | Cl | SO4 | HCO3 | |
| W1 | 7.06 | 3.84 | 1920 | 1020 | 10.02 | 10.53 | 15.22 | 19.78 | 10.75 | 2.33 |
| W2 | 7.15 | 4.27 | 2135 | 1230 | 10.62 | 11.54 | 19.57 | 20.65 | 18.75 | 2.25 |
| W3 | 7.16 | 3.05 | 1525 | 840 | 8.42 | 8.51 | 13.61 | 18.81 | 7.96 | 2.11 |
| W4 | 7.25 | 2.83 | 1415 | 900 | 10.02 | 8.1 | 10 | 16.26 | 10 | 2.25 |
| W5 | 7.08 | 6.26 | 3130 | 1420 | 12.63 | 16 | 29.57 | 37.54 | 23.96 | 2.69 |
| W6 | 6.67 | 4.73 | 2365 | 1520 | 13 | 17.62 | 19.57 | 26.44 | 16.67 | 2.47 |
| W7 | 6.96 | 7.19 | 3595 | 2010 | 20.84 | 19.64 | 26.09 | 37.79 | 32.21 | 2.69 |
| W8 | 7.74 | 4.53 | 2265 | 1300 | 13.83 | 12.36 | 14.78 | 25.93 | 19.4 | 2.25 |
| W9 | 6.8 | 6.33 | 3165 | 1650 | 26.05 | 7.17 | 26.09 | 30.17 | 21.38 | 1.6 |
| W10 | 7.13 | 12.48 | 6240 | 3300 | 31.26 | 35.24 | 39.13 | 78.55 | 60 | 2 |
| W11 | 6.94 | 6.5 | 3250 | 1800 | 16.83 | 17.42 | 26.52 | 30.51 | 29.17 | 2.39 |
| W12 | 6.93 | 5.89 | 2945 | 2080 | 21.44 | 20.45 | 17.91 | 23.26 | 30.1 | 2.11 |
| W13 | 7.2 | 7.1 | 3550 | 1973 | 7.23 | 32.23 | 13.85 | 24.41 | 27.08 | 1.95 |
| W14 | 7.2 | 6.7 | 3350 | 1930 | 7.24 | 31.36 | 36.06 | 51.07 | 21.04 | 2.2 |
| W15 | 7.24 | 6.9 | 3450 | 1813 | 6.57 | 29.68 | 19.66 | 25.72 | 28.13 | 2.06 |
| W16 | 7.3 | 6.6 | 3300 | 1822 | 7.32 | 29.12 | 26,39 | 32.42 | 27.65 | 2.73 |
| W17 | 7.28 | 7.9 | 3950 | 2285 | 7.97 | 37.74 | 18.66 | 35.03 | 27.21 | 2.24 |
| W18 | 7 | 7.3 | 3650 | 1888 | 6.83 | 30.94 | 16.03 | 30.27 | 21.67 | 1.95 |
| W19 | 7.6 | 7.1 | 3550 | 1729 | 5.58 | 29 | 12.79 | 22.75 | 22.5 | 2.24 |
| W20 | 7.2 | 7.4 | 3700 | 1722 | 6.95 | 27.5 | 38.78 | 42.4 | 27.29 | 2.04 |
| W21 | 7.3 | 5.8 | 2900 | 1741 | 8.96 | 25.87 | 43.32 | 50.04 | 25.25 | 2.28 |
| W22 | 7.2 | 6.1 | 3050 | 1835 | 6.43 | 30.28 | 14.25 | 22.4 | 26.5 | 2.17 |
| W23 | 7.3 | 6 | 3000 | 1600 | 6.76 | 25.25 | 20.13 | 24.88 | 25.63 | 1.98 |
| W24 | 7.4 | 5.9 | 2950 | 1686 | 6.53 | 27.19 | 32.17 | 41.46 | 22.71 | 2.08 |
| W25 | 7.4 | 5.6 | 2800 | 1797 | 4.05 | 31.88 | 22.61 | 29.66 | 27.19 | 1.95 |
| W26 | 7.2 | 5.5 | 2750 | 1488 | 4.1 | 25.66 | 38.99 | 40.61 | 26.46 | 2.03 |
| W27 | 7.4 | 6.2 | 3100 | 1415 | 4 | 24.31 | 41.65 | 43.17 | 25.21 | 1.94 |
| W28 | 7.1 | 5.4 | 2700 | 1642 | 5.66 | 27.19 | 34.69 | 41.18 | 24.79 | 2.2 |
| W29 | 7.2 | 4.9 | 2450 | 1502 | 5.62 | 24.42 | 37 | 43.86 | 21.71 | 2.36 |
| W30 | 7.35 | 5.2 | 2600 | 1390 | 4.41 | 23.38 | 30.51 | 30.31 | 25.63 | 2.21 |
| W31 | 7 | 6.4 | 3200 | 1848 | 7.62 | 29.33 | 45.97 | 52.04 | 28.54 | 1.81 |
| W32 | 7.1 | 6.5 | 3250 | 1372 | 5.6 | 21.83 | 41.65 | 43.15 | 25.21 | 1.93 |
| W33 | 7 | 6.9 | 3450 | 2044 | 9.88 | 31 | 17.87 | 26.31 | 27.33 | 2.2 |
| W34 | 7.1 | 6.9 | 3450 | 1849 | 6.77 | 30.2 | 19.28 | 32 | 22.08 | 2.17 |
| W35 | 7.15 | 6.8 | 3400 | 1728 | 9.97 | 24.59 | 20.22 | 31.35 | 21.46 | 2.3 |
| W36 | 7.2 | 4.9 | 2450 | 1631 | 5.71 | 26.92 | 61.28 | 70.31 | 20.17 | 2.48 |
| W37 | 7.2 | 5.8 | 2900 | 1702 | 5.45 | 28.59 | 13.94 | 20.9 | 25.1 | 2.36 |
| W38 | 7.2 | 9.6 | 4800 | 2491 | 7.55 | 42.26 | 24.77 | 44.8 | 27.5 | 2.26 |
| W39 | 7.3 | 10 | 5000 | 2020 | 6.68 | 33.72 | 42.04 | 52.14 | 27.81 | 1.95 |
| W40 | 7.25 | 10.2 | 5100 | 2055 | 7.37 | 33.74 | 61.32 | 70.04 | 28.54 | 2.73 |
| W41 | 7.3 | 7.7 | 3850 | 2229 | 8.56 | 36.02 | 20.17 | 34.32 | 27.69 | 1.93 |
| W42 | 7.1 | 7.9 | 3950 | 2258 | 8.14 | 37.02 | 14.03 | 33.24 | 24.08 | 2.11 |
| W43 | 7.15 | 7.8 | 3900 | 2137 | 6.71 | 36.02 | 30.82 | 43.12 | 28.33 | 1.98 |
| W44 | 7.2 | 7 | 3500 | 2075 | 7.8 | 33.7 | 23.3 | 40.99 | 21.67 | 2.09 |
| W45 | 6.9 | 6.4 | 3200 | 2537 | 8.31 | 42.43 | 34.32 | 55.23 | 25.1 | 3.9 |
| W46 | 7.3 | 5.8 | 2900 | 2373 | 10.05 | 37.42 | 29.74 | 44.51 | 30.83 | 2.66 |
| W47 | 7.3 | 6 | 2280 | 2446 | 9.7 | 39.23 | 20.57 | 37.32 | 28.56 | 2.15 |
| W48 | 7.2 | 6.3 | 1405 | 2693 | 9.2 | 44.65 | 15.17 | 36.48 | 28.65 | 2.99 |
| W49 | 7 | 7.5 | 2380 | 2310 | 10.6 | 35.61 | 23.3 | 39.52 | 25.67 | 2.5 |
| W50 | 7.25 | 8.4 | 2740 | 2311 | 7.4 | 38.82 | 22.48 | 37.75 | 28.13 | 1.86 |
| W51 | 7.4 | 9.2 | 2295 | 2605 | 8.35 | 43.75 | 20.78 | 36 | 30.94 | 3.87 |
| W52 | 7.1 | 5.9 | 2750 | 1893 | 6.04 | 31.83 | 26.54 | 35.23 | 27.73 | 2.27 |
| W53 | 7.78 | 5.78 | 2890 | 2249 | 19.15 | 25.82 | 19.57 | 14.73 | 48.75 | 2.23 |
| W54 | 7.1 | 5.95 | 2975 | 2115 | 18.2 | 24.1 | 16.96 | 23.1 | 31.58 | 1.36 |
| W55 | 7.36 | 6.12 | 3060 | 2741 | 20.6 | 34.21 | 16.87 | 30.65 | 42.38 | 1.56 |
| W56 | 7.14 | 6.63 | 3315 | 2414 | 14.65 | 33.63 | 17.15 | 28.65 | 37.08 | 1.59 |
| W57 | 7.22 | 6.46 | 3230 | 2602 | 18.9 | 33.14 | 17.04 | 24.03 | 40.81 | 2.08 |
| W58 | 7.12 | 6.29 | 3145 | 2933 | 20.75 | 37.91 | 29.26 | 34.34 | 54.96 | 1.9 |
| W59 | 7.91 | 6.29 | 3145 | 2806 | 23.15 | 32.98 | 19.7 | 27.41 | 45.06 | 2.03 |
| W60 | 7.4 | 6.46 | 3230 | 3191 | 23.85 | 39.97 | 18.3 | 27.55 | 54.96 | 1.95 |
| W61 | 7.28 | 6.63 | 3315 | 2421 | 19.3 | 29.11 | 18.48 | 17.1 | 45.75 | 1.85 |
| W62 | 7.16 | 6.8 | 3400 | 2688 | 19.8 | 33.96 | 22.43 | 27.18 | 50.38 | 1.79 |
| W63 | 7.2 | 6.97 | 3485 | 3021 | 23.65 | 36.76 | 24.26 | 28.73 | 57.21 | 1.98 |
| W64 | 7.21 | 5.95 | 2975 | 3264 | 22.6 | 42.68 | 26.57 | 38.31 | 45.15 | 1.87 |
| W65 | 7.07 | 7.82 | 3910 | 2584 | 15.75 | 35.94 | 25.61 | 25.92 | 44.38 | 1.72 |
| W66 | 7.7 | 7.99 | 3995 | 2165 | 17.8 | 25.49 | 21.43 | 22.87 | 41.31 | 1.61 |
| W67 | 7.9 | 8.33 | 4165 | 2831 | 19.45 | 37.17 | 23.39 | 34.11 | 39.52 | 2.16 |
| W68 | 7.52 | 8.5 | 4250 | 3001 | 20.3 | 39.72 | 27.13 | 37.44 | 44.56 | 2.02 |
| W69 | 7.64 | 7.31 | 3655 | 2952 | 19.9 | 39.14 | 28.61 | 37.41 | 44.5 | 1.36 |
| W70 | 7.41 | 8.5 | 4250 | 3185 | 19.45 | 44.24 | 25.74 | 41.86 | 49.71 | 1.57 |
| W71 | 7.18 | 9.18 | 4590 | 2971 | 16.25 | 43.17 | 31.13 | 35.13 | 52.65 | 2.05 |
| W72 | 7.26 | 7.48 | 3740 | 3246 | 17.8 | 47.12 | 28.35 | 37.8 | 53.98 | 1.82 |
| IWQI | Water Use Restrictions | Recommendation | |
|---|---|---|---|
| Soil | Plant | ||
| 85–100 | No restriction (NR) | «May be used for the majority of soils with low probability of causing salinity and sodicity problems, with it being recommended for leaching within irrigation practices, except for in soils with extremely low permeability.» | «No toxicity risk for most plants» |
| 70–85 | Low restriction (LR) | «Recommended for use in irrigated soils with light texture or moderate permeability, being recommended for salt leaching. Soil sodicity in heavy-texture soils may occur, with it being recommended to avoid its use in soils with high clay.» | «No toxicity risk for most Plants.» |
| 55–70 | Moderate restriction (MR) | «May be used in soils with moderate to high permeability values, with it being suggested for moderate leaching of salts.» | “«Plants with moderate tolerance to salts may be grown.» |
| 40–55 | High restriction (HR) | «May be used in soils with high permeability without compact layers. High frequency irrigation schedule should be adopted for water with EC above 2000 μS cm−1 and SAR above 7.0.» | “«Should be used for irrigation of plants with moderate to high tolerance to salts with special salinity control practices, except water with low Na, Cl, and HCO3 values.» |
| 0–40 | Severe restriction (SR) | «Should avoid its use for irrigation under normal conditions. In special cases, may be used occasionally. Water with low salt levels and high SAR require gypsum application. In high saline content, water soils must have high permeability, and excess water should be applied to avoid salt accumulation.» | «Only plants with high salt tolerance, except for waters with extremely low values of Na, Cl, and HCO3.» |
| Sodium Adsorption Ratio (SAR) | Status |
|---|---|
| Below 10 | Excellent |
| 10–18 | Good |
| 18–26 | Doubtful |
| Above 26 | Unsuitable |
| Chloride (mg/L) | Effect on Crops |
|---|---|
| Below 70 | Generally safe for all plants |
| 70–140 | Sensitive plants show injury |
| 141–350 | Moderately tolerant plants show injury |
| Above 350 | Can cause severe problems |
| Sample Number | IWQI Values | IWQI Class | Sample Number | IWQI Values | IWQI Class |
|---|---|---|---|---|---|
| W1 | 46.39 | HR | W37 | 45.7 | HR |
| W2 | 45.3 | HR | W38 | 39.66 | SR |
| W3 | 53.96 | HR | W39 | 31.05 | SR |
| W4 | 54.9 | MR | W40 | 19.17 | SR |
| W5 | 35.07 | SR | W41 | 43.21 | HR |
| W6 | 44.36 | HR | W42 | 46.99 | HR |
| W7 | 40.36 | HR | W43 | 35.41 | SR |
| W8 | 45.9 | HR | W44 | 42.03 | HR |
| W9 | 38.89 | SR | W45 | 30.68 | SR |
| W10 | 28.41 | SR | W46 | 35.39 | SR |
| W11 | 37.05 | SR | W47 | 43.5 | HR |
| W12 | 45.29 | HR | W48 | 45.69 | HR |
| W13 | 45.58 | HR | W49 | 41.1 | HR |
| W14 | 33.73 | SR | W50 | 42.22 | HR |
| W15 | 44.11 | HR | W51 | 38.08 | SR |
| W16 | 36.2 | SR | W52 | 37.35 | SR |
| W17 | 42.69 | HR | W53 | 45.58 | HR |
| W18 | 44.47 | HR | W54 | 49.4 | HR |
| W19 | 48.24 | HR | W55 | 46.04 | HR |
| W20 | 33.67 | SR | W56 | 45.71 | HR |
| W21 | 32.54 | SR | W57 | 45.26 | HR |
| W22 | 45.77 | HR | W58 | 42.62 | HR |
| W23 | 44.69 | HR | W59 | 44.71 | HR |
| W24 | 35.91 | SR | W60 | 45.11 | HR |
| W25 | 44.17 | HR | W61 | 45.92 | HR |
| W26 | 34.69 | SR | W62 | 44.38 | HR |
| W27 | 33.57 | SR | W63 | 43.49 | HR |
| W28 | 35.42 | SR | W64 | 43.14 | HR |
| W29 | 34.51 | SR | W65 | 43.39 | HR |
| W30 | 37.11 | SR | W66 | 44.44 | HR |
| W31 | 32.56 | SR | W67 | 41.94 | HR |
| W32 | 33.35 | SR | W68 | 41.19 | HR |
| W33 | 44.22 | HR | W69 | 45.36 | HR |
| W34 | 43.42 | HR | W70 | 42.06 | HR |
| W35 | 43.02 | HR | W71 | 40.16 | HR |
| W36 | 22.28 | SR | W72 | 42.04 | HR |
Publisher’s Note: MDPI stays neutral with regard to jurisdictional claims in published maps and institutional affiliations. |
© 2022 by the authors. Licensee MDPI, Basel, Switzerland. This article is an open access article distributed under the terms and conditions of the Creative Commons Attribution (CC BY) license (https://creativecommons.org/licenses/by/4.0/).
Share and Cite
Kadri, A.; Baouia, K.; Kateb, S.; Al-Ansari, N.; Kouadri, S.; Najm, H.M.; Mashaan, N.S.; Eldirderi, M.M.A.; Khedher, K.M. Assessment of Groundwater Suitability for Agricultural Purposes: A Case Study of South Oued Righ Region, Algeria. Sustainability 2022, 14, 8858. https://doi.org/10.3390/su14148858
Kadri A, Baouia K, Kateb S, Al-Ansari N, Kouadri S, Najm HM, Mashaan NS, Eldirderi MMA, Khedher KM. Assessment of Groundwater Suitability for Agricultural Purposes: A Case Study of South Oued Righ Region, Algeria. Sustainability. 2022; 14(14):8858. https://doi.org/10.3390/su14148858
Chicago/Turabian StyleKadri, Abdelaziz, Kais Baouia, Samir Kateb, Nadhir Al-Ansari, Saber Kouadri, Hadee Mohammed Najm, Nuha S. Mashaan, Moutaz Mustafa A. Eldirderi, and Khaled Mohamed Khedher. 2022. "Assessment of Groundwater Suitability for Agricultural Purposes: A Case Study of South Oued Righ Region, Algeria" Sustainability 14, no. 14: 8858. https://doi.org/10.3390/su14148858
APA StyleKadri, A., Baouia, K., Kateb, S., Al-Ansari, N., Kouadri, S., Najm, H. M., Mashaan, N. S., Eldirderi, M. M. A., & Khedher, K. M. (2022). Assessment of Groundwater Suitability for Agricultural Purposes: A Case Study of South Oued Righ Region, Algeria. Sustainability, 14(14), 8858. https://doi.org/10.3390/su14148858