Article

Analysis of Shear Resistance and Mechanism of Construction and Demolition Waste Improved by Polyurethane

Innovation Demonstration Base of Ecological Environment Geotechnical and Ecological Restoration of Rivers and Lakes, School of Civil Engineering, Architecture and Environment, Hubei University of Technology, Wuhan 430068, China
*
Author to whom correspondence should be addressed.
Sustainability 2022, 14(13), 8180; https://doi.org/10.3390/su14138180
Submission received: 29 May 2022 / Revised: 21 June 2022 / Accepted: 23 June 2022 / Published: 5 July 2022

Abstract

:
A large amount of construction and demolition waste (CDW) is generated during the construction of projects. In this paper, polyurethane foam adhesive (PFA) was used to improve the mechanical properties of CDW. The large-scale direct shear tests, California bearing ratio (CBR) tests and Scanning electron microscope (SEM) tests were carried out to study the variation regularities of mechanical properties of treated CDW during the laboratory tests. The test results show that the shear strength of CDW increases with the increase of PFA content, vertical pressure and the shear rate. However, the increase of vertical pressure on the shear strength of CDW is smaller than that of PFA, and the improvement of the shear rate is relatively small. The California bearing ratio (CBR) test also proves that PFA can effectively improve the bearing capacity of CDW and reduce the loss of CBR caused by the 4-day soaking. Scanning Electron Microscope (SEM) finds that polyurethane wraps multiple particles and enhances the internal connection, which results in the cohesion between the particles being greatly increased. The study presented in this paper will better assess the shear resistance of improved CDW with PFA as a substitute for pavement base materials in practical engineering applications.

Graphical Abstract

1. Introduction

The renewal, transformation, and new construction of urban buildings and municipal facilities generate much construction and demolition waste (CDW) [1,2]. According to statistics, CDW generated annually increases year by year [3,4,5,6,7]. In fact, the current disposal methods of CDW are mainly directly discarded or simply landfilled in the suburbs without any treatment, the disposal methods are out of date [2]. With the increase in the amount of CDW, this disposal method not only causes waste of a lot of resources, but also leads to pollution of soil, atmosphere and groundwater, making the environmental problem more serious [8,9]. Therefore, it is urgent to adopt effective methods to dispose and utilize CDW. Hence, how to deal with these CDW is an issue that has drawn much attention in the engineering community.
For a long time, CDW has been regarded as a valuable resource misplaced, and many scholars have performed researches on CDW [10,11]. In recent years, CDW has been widely used in civil engineering (e.g., subgrade filling, pipe backfilling, and so on) [12,13,14,15,16,17]. However, the strength is commonly low due to the impact of CDW on the integrity of its aggregates during the recycling and crushing process [18]. To improve its mechanical properties, such as strength and bearing capacity as a pavement base material, some scholars have actively developed materials to cooperate with CDW to ensure these materials are available in sufficient mechanical properties to meet engineering requirements [19]. Cement has long been proven to be the main binder that can effectively improve the mechanical properties of CDW [18,20,21], but the cementing agent may also increase carbon emission [18]. Accordingly, it is essential to find a suitable adhesive substitute. At present, many industrial by-products are used to improve the engineering properties of CDW, such as ground-granulated blast-furnace slag [18] and fly ash [22,23,24]. In recent years, using biological technology to strengthen CDW has also proven the feasibility of microbial-induced calcium carbonate precipitation technology to improve the mechanical properties and durability of CDW [25,26].
Compared with the above materials, the PFA has a fast curing time, high strength and good adhesion. At the same time, the generation of cohesion is mainly contributed to the polar groups in the molecule. According to statistics, the demand for polyurethane has reached USD 43.2 billion in 2012 alone, and it is increasing every year, of which the construction industry accounts for 36% of polyurethane consumption [27]. When PFA is injected into the soil pores, the volume is expanded rapidly, and the internal bond between the particles is strengthened. Therefore, PFA has excellent value in improving the overall strength of the soil structure and strengthening the bulk materials. Some current studies have reported innovative solutions to utilize PFA as an “additive” in rockfill materials, sandstone aggregates, municipal waste incineration bottom ash and Calcareous sands [28,29,30,31,32,33] to improve their mechanical properties (e.g., load-bearing capacity, ductility and durability) [28,34]. Therefore, PFA-improved CDW is applied as roadbed filler, which can save a large area of CDW disposal, a lot of earth materials and provide a new way for the rational reuse of these solid wastes.
This paper focuses on studying the shear performance of CDW after PFA solidification. Due to the small size of the traditional direct shear and triaxial apparatus, the test condition of the samples are quite different from that in the actual project. Considering the size effect, this study employed the large-scale direct shear test. The shear force generated on the shear surface during the test was more uniform, and the test results were consistent with practical engineering. To explore the change law of CDW shear properties, a series of laboratory large-scale direct shear tests were carried out on CDW with different PFA contents, which were tested at various vertical loads and different shear rates. And California bearing ratio (CBR) tests were carried out on the PFA-improved CDW under unsoaked and 4-day soaked conditions to study the bearing capacity of the PFA-improved CDW as roadbed filler. In addition, the interaction mechanism between CDW particles and PFA was studied by Scanning Electron Microscope (SEM). These results will not only find a new way to reuse CDW, which significantly solves the environmental problems caused by CDW, but also provide an important reference for PFA-improved CDW application as roadbed filler.

2. Materials and Experimental Program
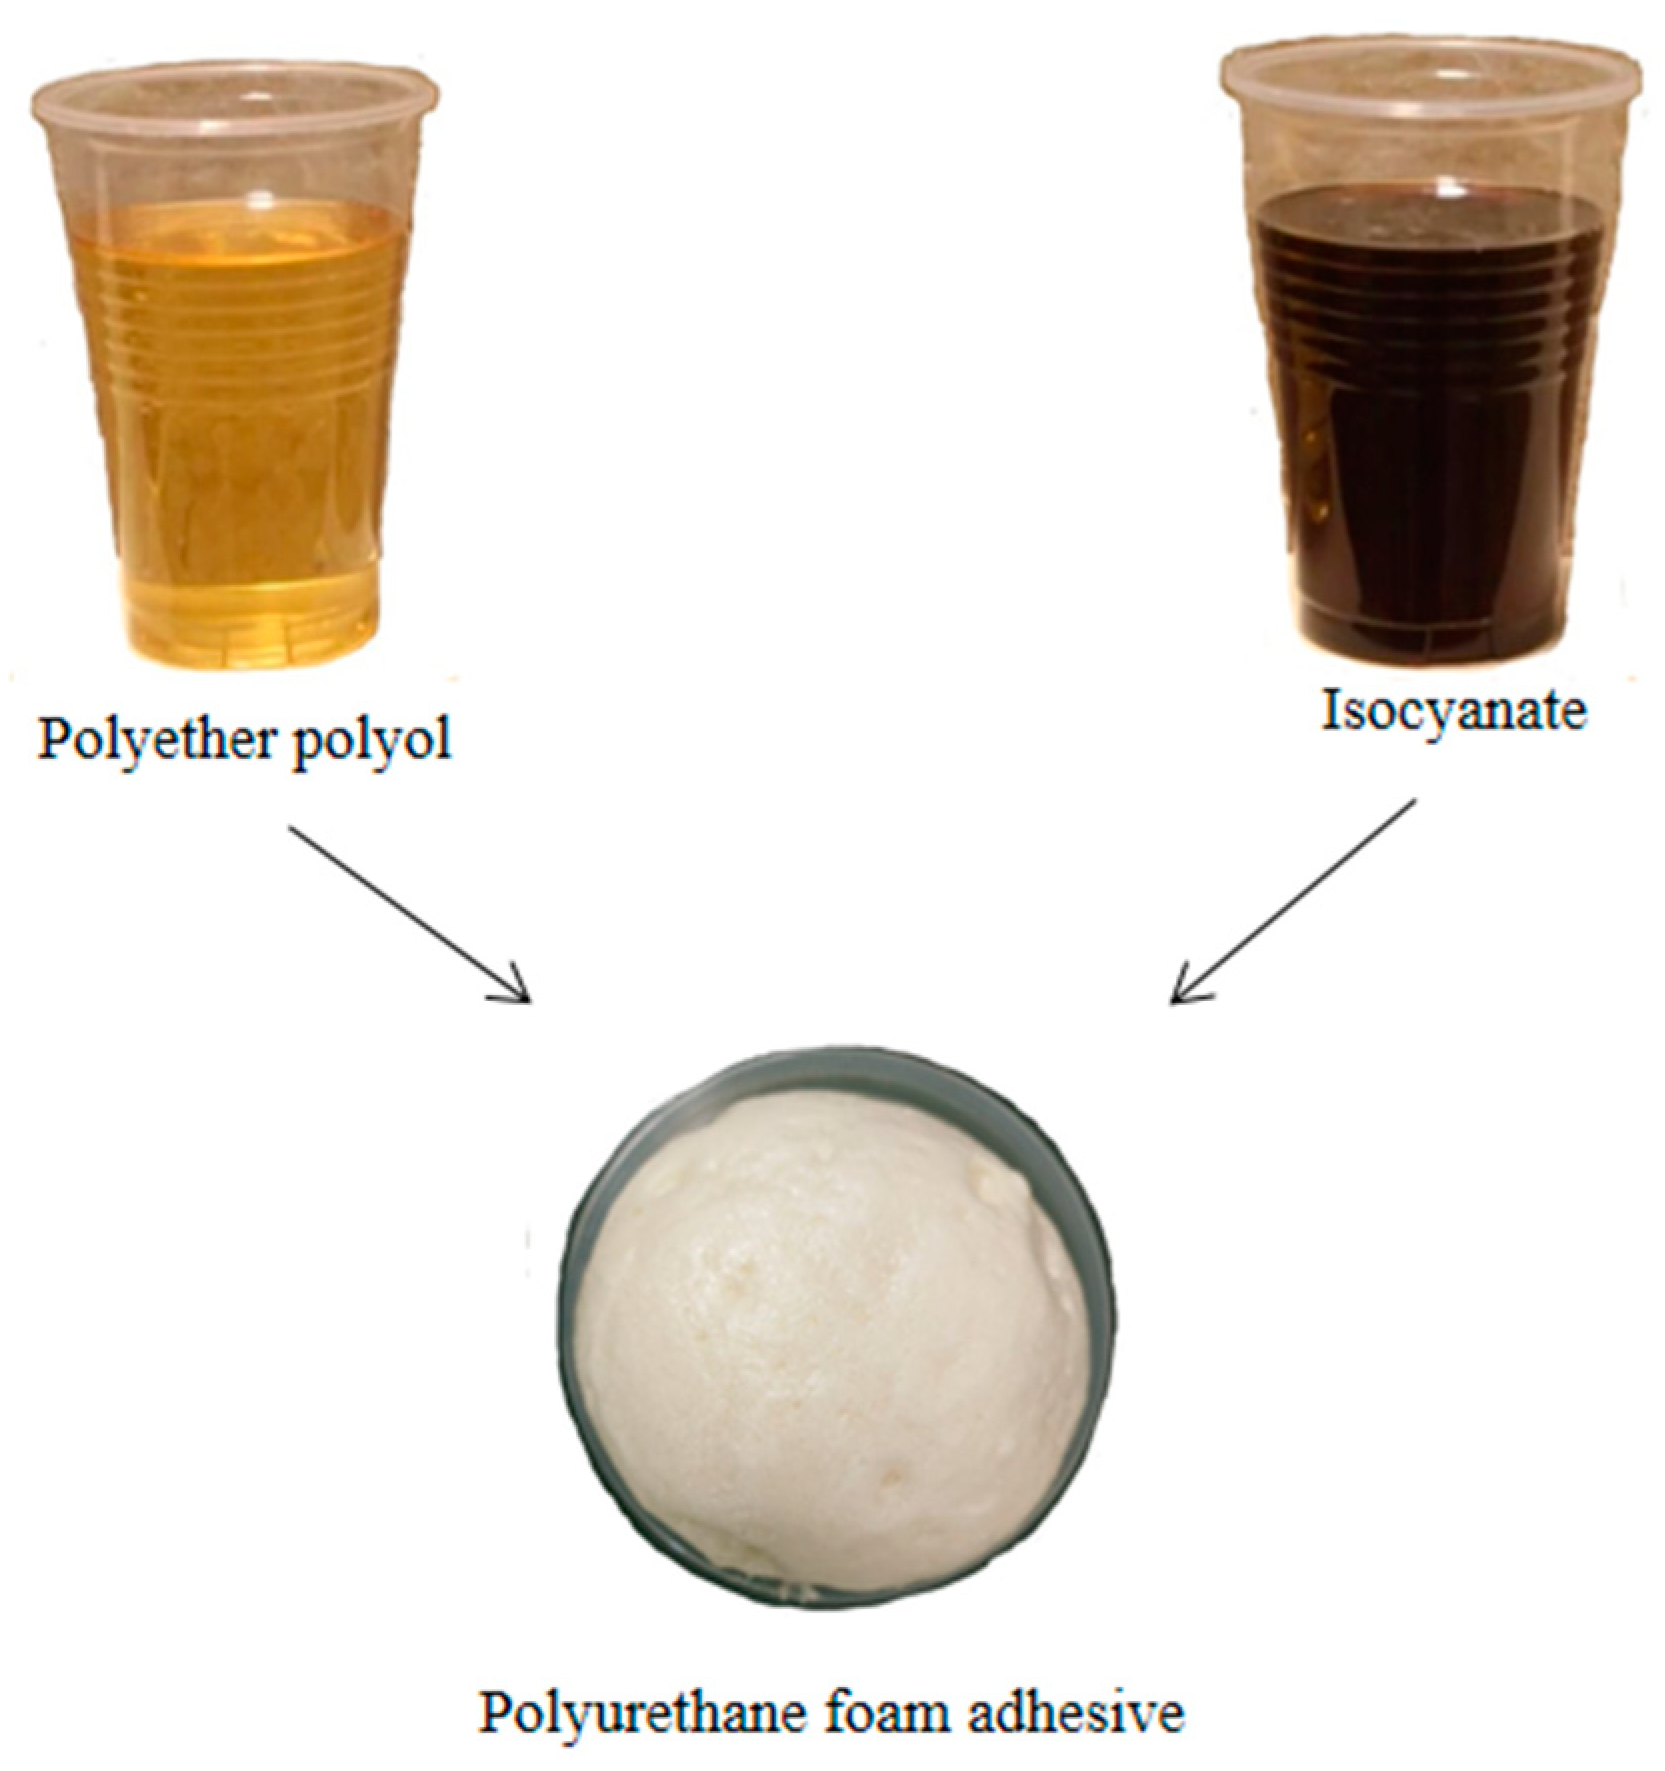
2.1. Materials

The CDW used in this study was collected in the demolition area of the Hubei University of Technology in Wuhan. The concrete blocks were manually selected and then crushed with a crushing machine after removing the steel bars. Thereafter the recycled concrete aggregate with particle sizes ranging from 0.1 mm to 60 mm was obtained. The maximum particle sizes of the large-scale direct shear test and CBR test were 60 mm and 20 mm, respectively. The particle grading curves of the large-scale direct shear test and the CBR test samples are shown in Figure 1. The basic parameters of samples are listed in Table 1. According to the American Society of Testing Materials (ASTM) [35], the aggregate used in the large-scale direct shear test and the CBR test samples is a well-graded gravel-like soil.
Polyurethane can be divided into the hydrophilic type and hydrophobic type according to the contact reaction with water. The polymer used in this study is a two-component hydrophobic polyurethane foam adhesive composed of polyether polyol and isocyanate, which should be fully mixed according to the mass ratio of 1:1, and the reaction occurs rapidly in a short time, as shown in Figure 2. The volume of the foam expands several times and a large amount of heat is released during the reaction. A large number of polymerization reactions are completed within 30 min. The strength of the foam gradually increases, and the samples are formed. The polyurethane adhesive fills the gaps between the recycled concrete aggregate particles, and at the same time, bonds the particles together, which relies on the properties of the solution flow in the early stage of the reaction.

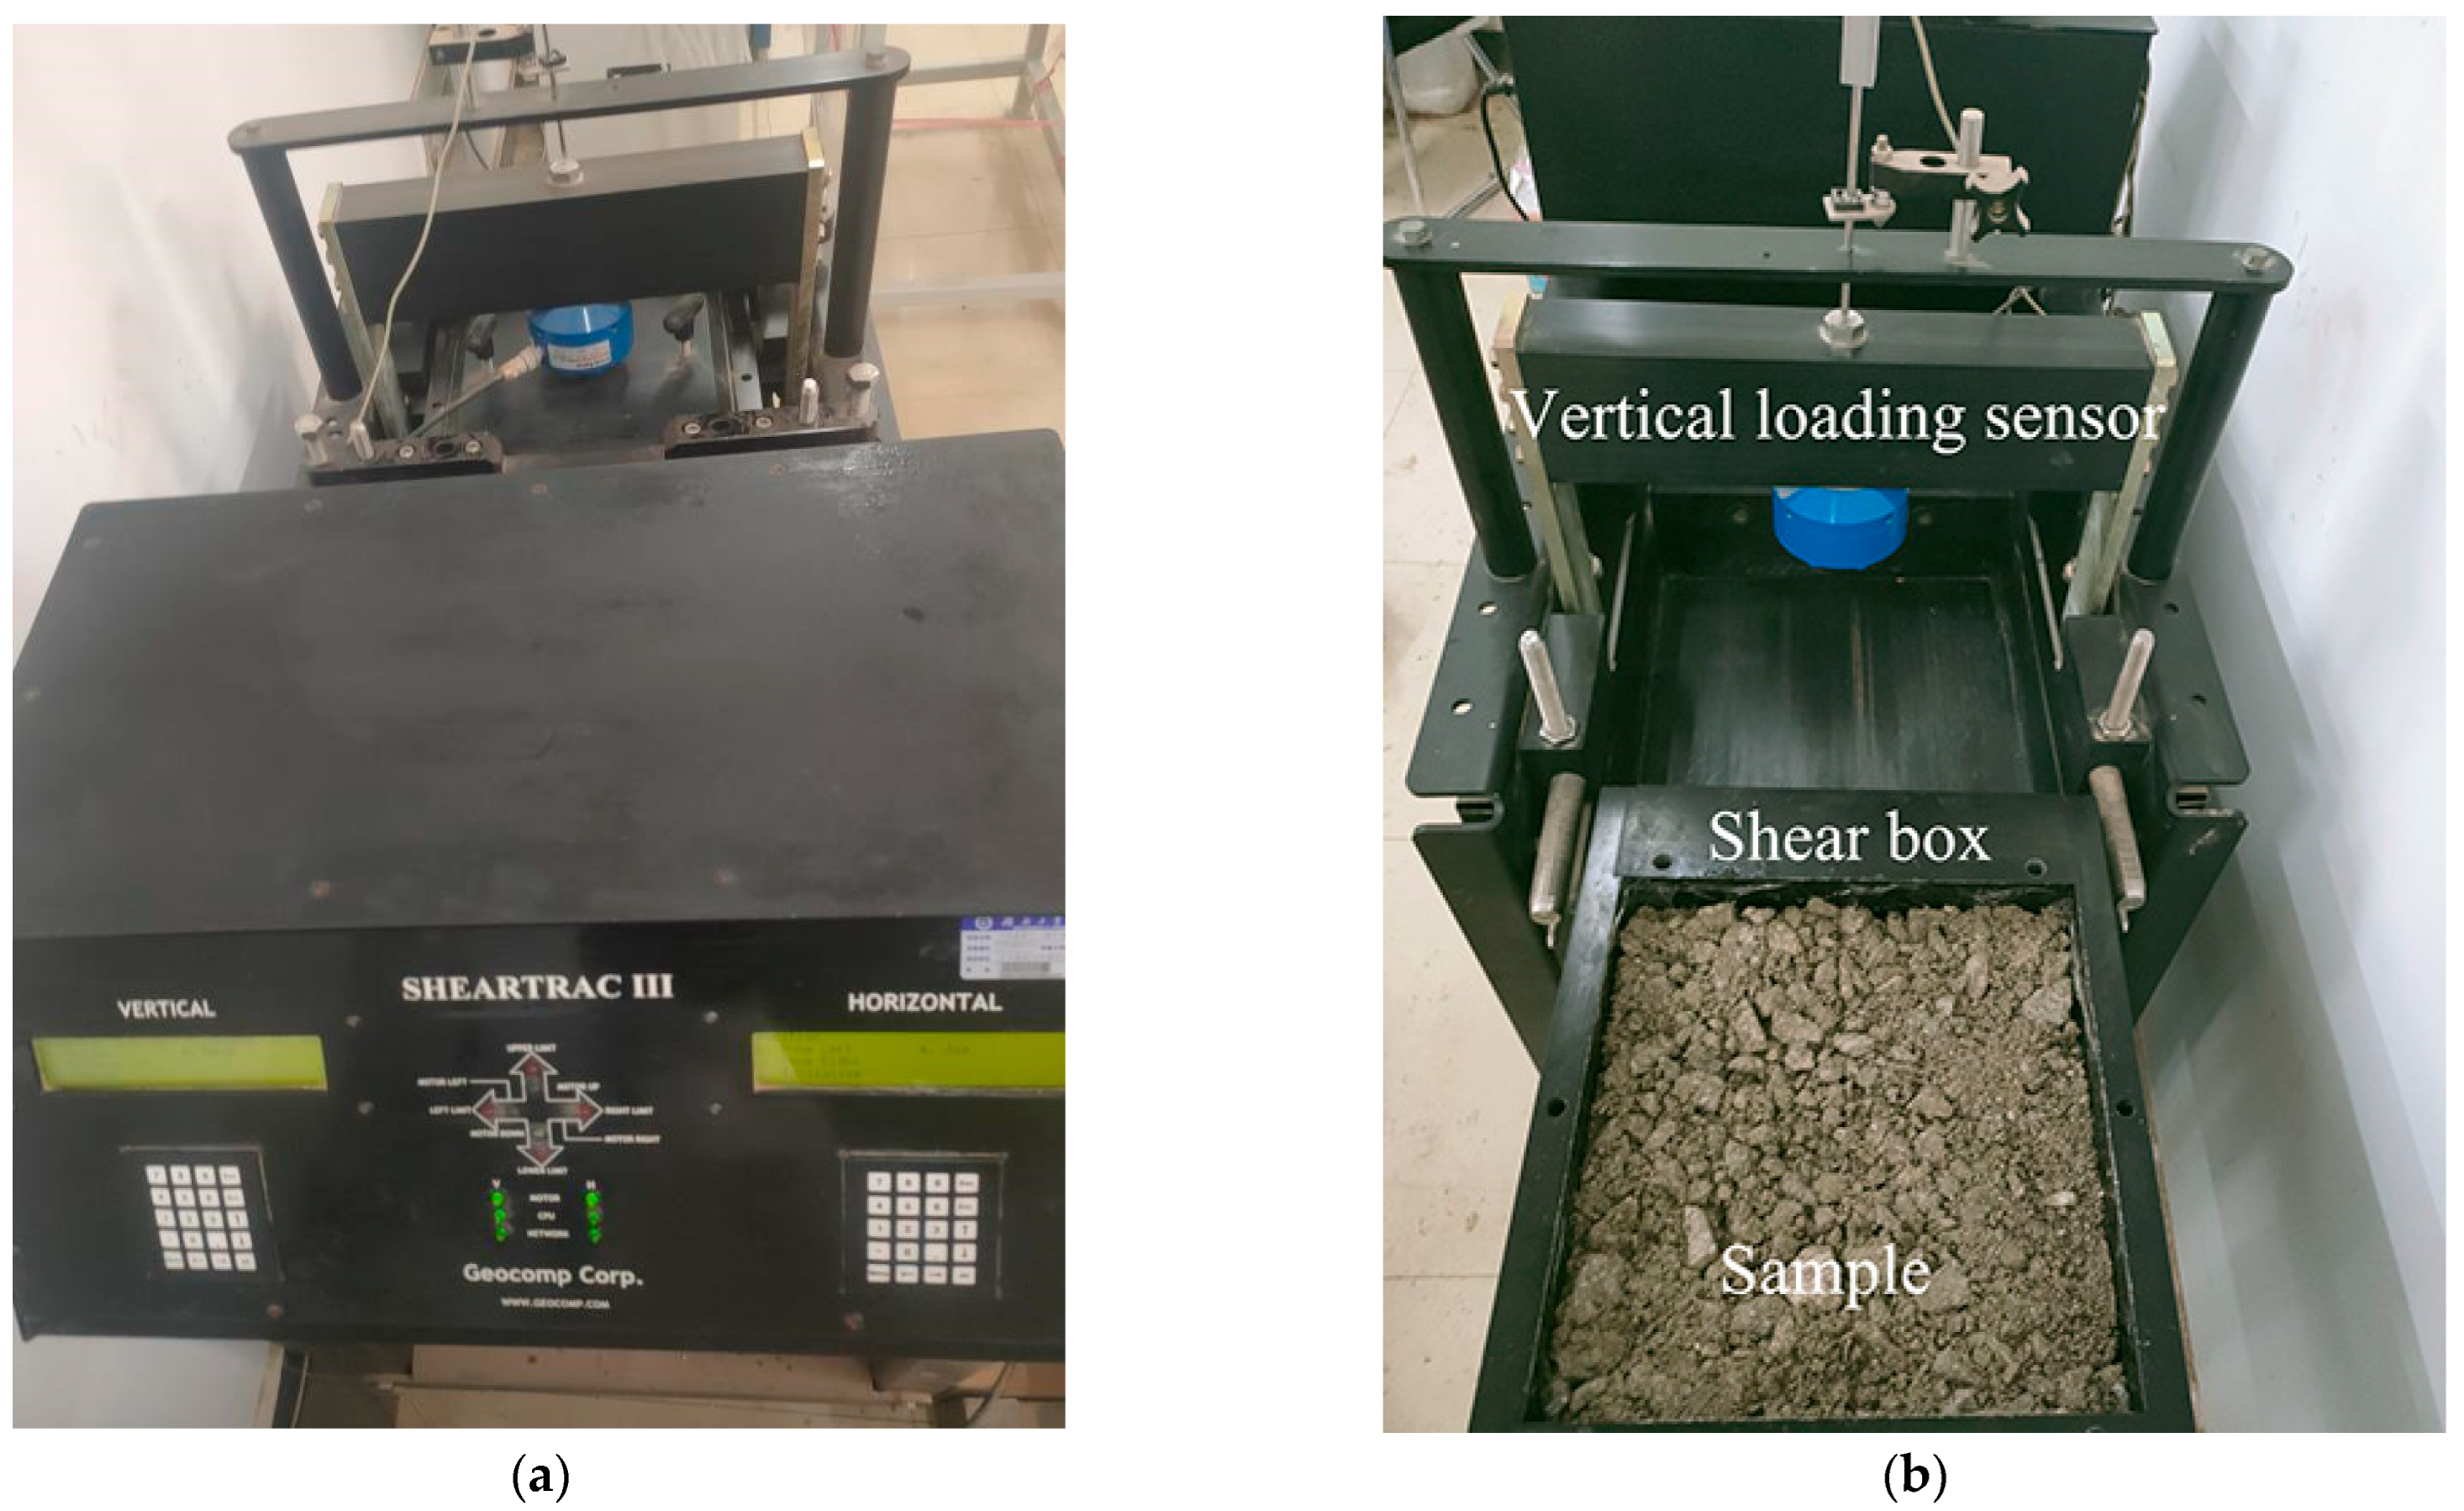
2.2. Test Equipments

The direct shear test instrument used in this study is a laboratory large-scale direct shear instrument produced by Geocomp in the United States. The model of the instrument is ShearTrac III, as shown in Figure 3. The instrument has a normal loading capacity of 45 kN, and the displacement rate can be accurately controlled to 0.00003~15 mm/min. The shear boxes are composed of an upper shear box and a lower shear box. The upper shear box is 100 mm shorter than the lower shear box in length, which ensures sufficient shear displacement dislocation length. At the beginning of the test, the sample will be first completed the consolidation phase under a given vertical stress. After the consolidation is completed, the direct shear instrument performs horizontal shear under the conditions of the vertical loads and shear rates are set by the computer. Until the sample is sheared and broken, the test data is transmitted to the computer for collection and storage, eventually.
The SEM used a high-resolution field emission scanning electron microscope produced by Hitachi, Japan, with the model SU8010, as shown in Figure 4. The secondary electron resolution of this test instrument is 1.0 nm at an acceleration voltage of 15 kV and 1.3 nm at an acceleration voltage of 1 kV, which can observe the surface morphology properties of the sample, completely meeting the specific needs of this experimental study.

2.3. Test Process

2.3.1. Samples Preparation for Large-Scale Direct Shear Test

From an economic point of view, the polyurethane content used in this study was low. To explore the influence of vertical load, polyurethane content and shear rate on the shear behavior of PFA-improved CDW, and the design was based on the mass percentage: 15 sets of shear tests were implemented with polyurethane content of 0%, 1.5%, 3%, 4.5%, and 6% under the conditions of vertical loads of 30 kPa, 60 kPa, and 90 kPa, and the group with the best reinforcement effect (vertical load of 30 kPa, polyurethane content of 6%) was tested at four shear rates. The details of the test scheme are shown in Table 2.
In the process of sample preparation, each sample was divided into five layers and each layer was 4 kg (excluding the weight of polyurethane) and loaded 25 times for compaction by a compaction hammer 20 cm above the surface of each layer of the sample to ensure the uniformity of the sample. Then the surface layer of each layer was roughened to prevent the sample from delamination. At the same time, the CDW and polyurethane required for the next layer were weighed in advance, and then stirred the polyurethane polymer polyol with the CDW. After stirring evenly, the isocyanate was added to the mixture quickly, then repeated the operation steps of the previous layer of samples. To prevent a large amount of solidification of the upper layer of the sample polymer from causing the sample to delamination, which would affect the experimental results, the compaction of the next layer should be completed within 5 min. After all the five-layer samples were loaded, the whole sample was placed for 24 h to make the polyurethane fully react inside the sample to complete the curing. After 24 h, the relevant test parameters on the computer were initially set and the shear test was started. When the shear displacement reached 30 mm, the termination of the test was reached.

2.3.2. Samples Preparation for CBR Test

CBR is a strength test used to evaluate the bearing capacity of subgrade materials, an index reflecting soil resistance to local load compression deformation. The tests were carried out by the Chinese Test Methods of Soils for Highway Engineering (JTG 3430—2020). 10 sets of tests with 0%, 1.5%, 3%, 4.5% and 6% polyurethane content were designed under unsoaked and soaked conditions. The sizes of the CBR samples were 152 mm in diameter and 120 mm in height. During the preparation of the CBR samples, the mixing mode of polyurethane and CDW was the same as that of the large-scale direct shear samples. The difference was that the samples were divided into three layers, each layer was 4 cm and loaded 98 times for compaction. Unsoaked and soaked samples were tested by CBR on the fourth day after sample preparation. During the test, a metal column of 50 mm in diameter and 100 mm in length penetrated the samples at a 1 mm/min penetration rate. After the test, the ratios of the unit pressure when the CDW penetration was 2.5 mm to the load strength when the standard gravel reached the same penetration were calculated.

2.3.3. Samples Preparation for Microscopic Test

The samples used in the SEM investigation were collected from the particle agglomerates on the shear failure surface in the large-scale direct shear test. Before the test, the samples were dried and vacuumed, and then the gold powder was sprayed on the surface of the samples to enable the samples to be clearly imaged. In this study, SEM was employed to test samples with a 1000 magnification, which revealed the mechanism of the significant improvement of the shear performance of the modified PFA samples from the microscopic level.

3. Laboratory Results and Discussions

3.1. Large-Scale Direct Shear Test Results and Analysis

3.1.1. The Influence of Vertical Load on the Shear Strength of CDW

The relationship between shear stress and shear displacement of CDW with different content of polyurethane under vertical loads of 30 kPa, 60 kPa and 90 kPa is shown in Figure 5. As can be seen from Figure 5: All the stress-strain curves present a similar trend, that the shear stress firstly increases to the peak shear stress and then decreases with the increase of shear displacement, and finally tends to be stable. This obvious strain-softening behavior is similar to the research results of Infante et al. [36]. With the increase of the vertical load, the peak shear stress also increases greatly. Generally speaking, under greater restraining pressure, the strength of the granular bulk material is greater. This trend is clearly shown in Figure 5a. When the polyurethane content is 0%, the peak shear stress corresponding to the vertical load of 30 kPa is 49.1 kPa, and the peak shear stresses are 91.3 kPa and 136.2 kPa, corresponding to the vertical load of 60 kPa and 90 kPa, which are increased by 85.95% and 177.39%, respectively. This is attributed to the fact that in the shear process, with the increase of the vertical load, the irregular particles are embedded in each other in continuous extrusion, and the particles are arranged more closely. As a result, the friction force of the contact interface increases and the shear stress also increases.
In addition, at the initial stage of shear displacement, the slope of stress-strain curves under the vertical loads varies greatly. The slope of the stress-strain curve under 90 kPa is the highest, followed by that under 60 kPa, and that under 30 kPa is the lowest. When the stress is close to the peak shear stress, the slope of stress-strain curves under the vertical loads gradually approaches. Therefore, the increase of vertical load can be considered as an active contribution to the increase of the initial stiffness of the sample. With the increase of the vertical load, the shear displacement also gradually increases when the peak shear stress is reached. The result is mainly caused by the fact that a good interlocking effect is better achieved among the particles when the vertical load is greater. During the shearing process, some aggregates gradually fill the gaps between coarse aggregates with the movement of the shear box and are compacted under vertical load. The relative movement between the particles is also relatively difficult.

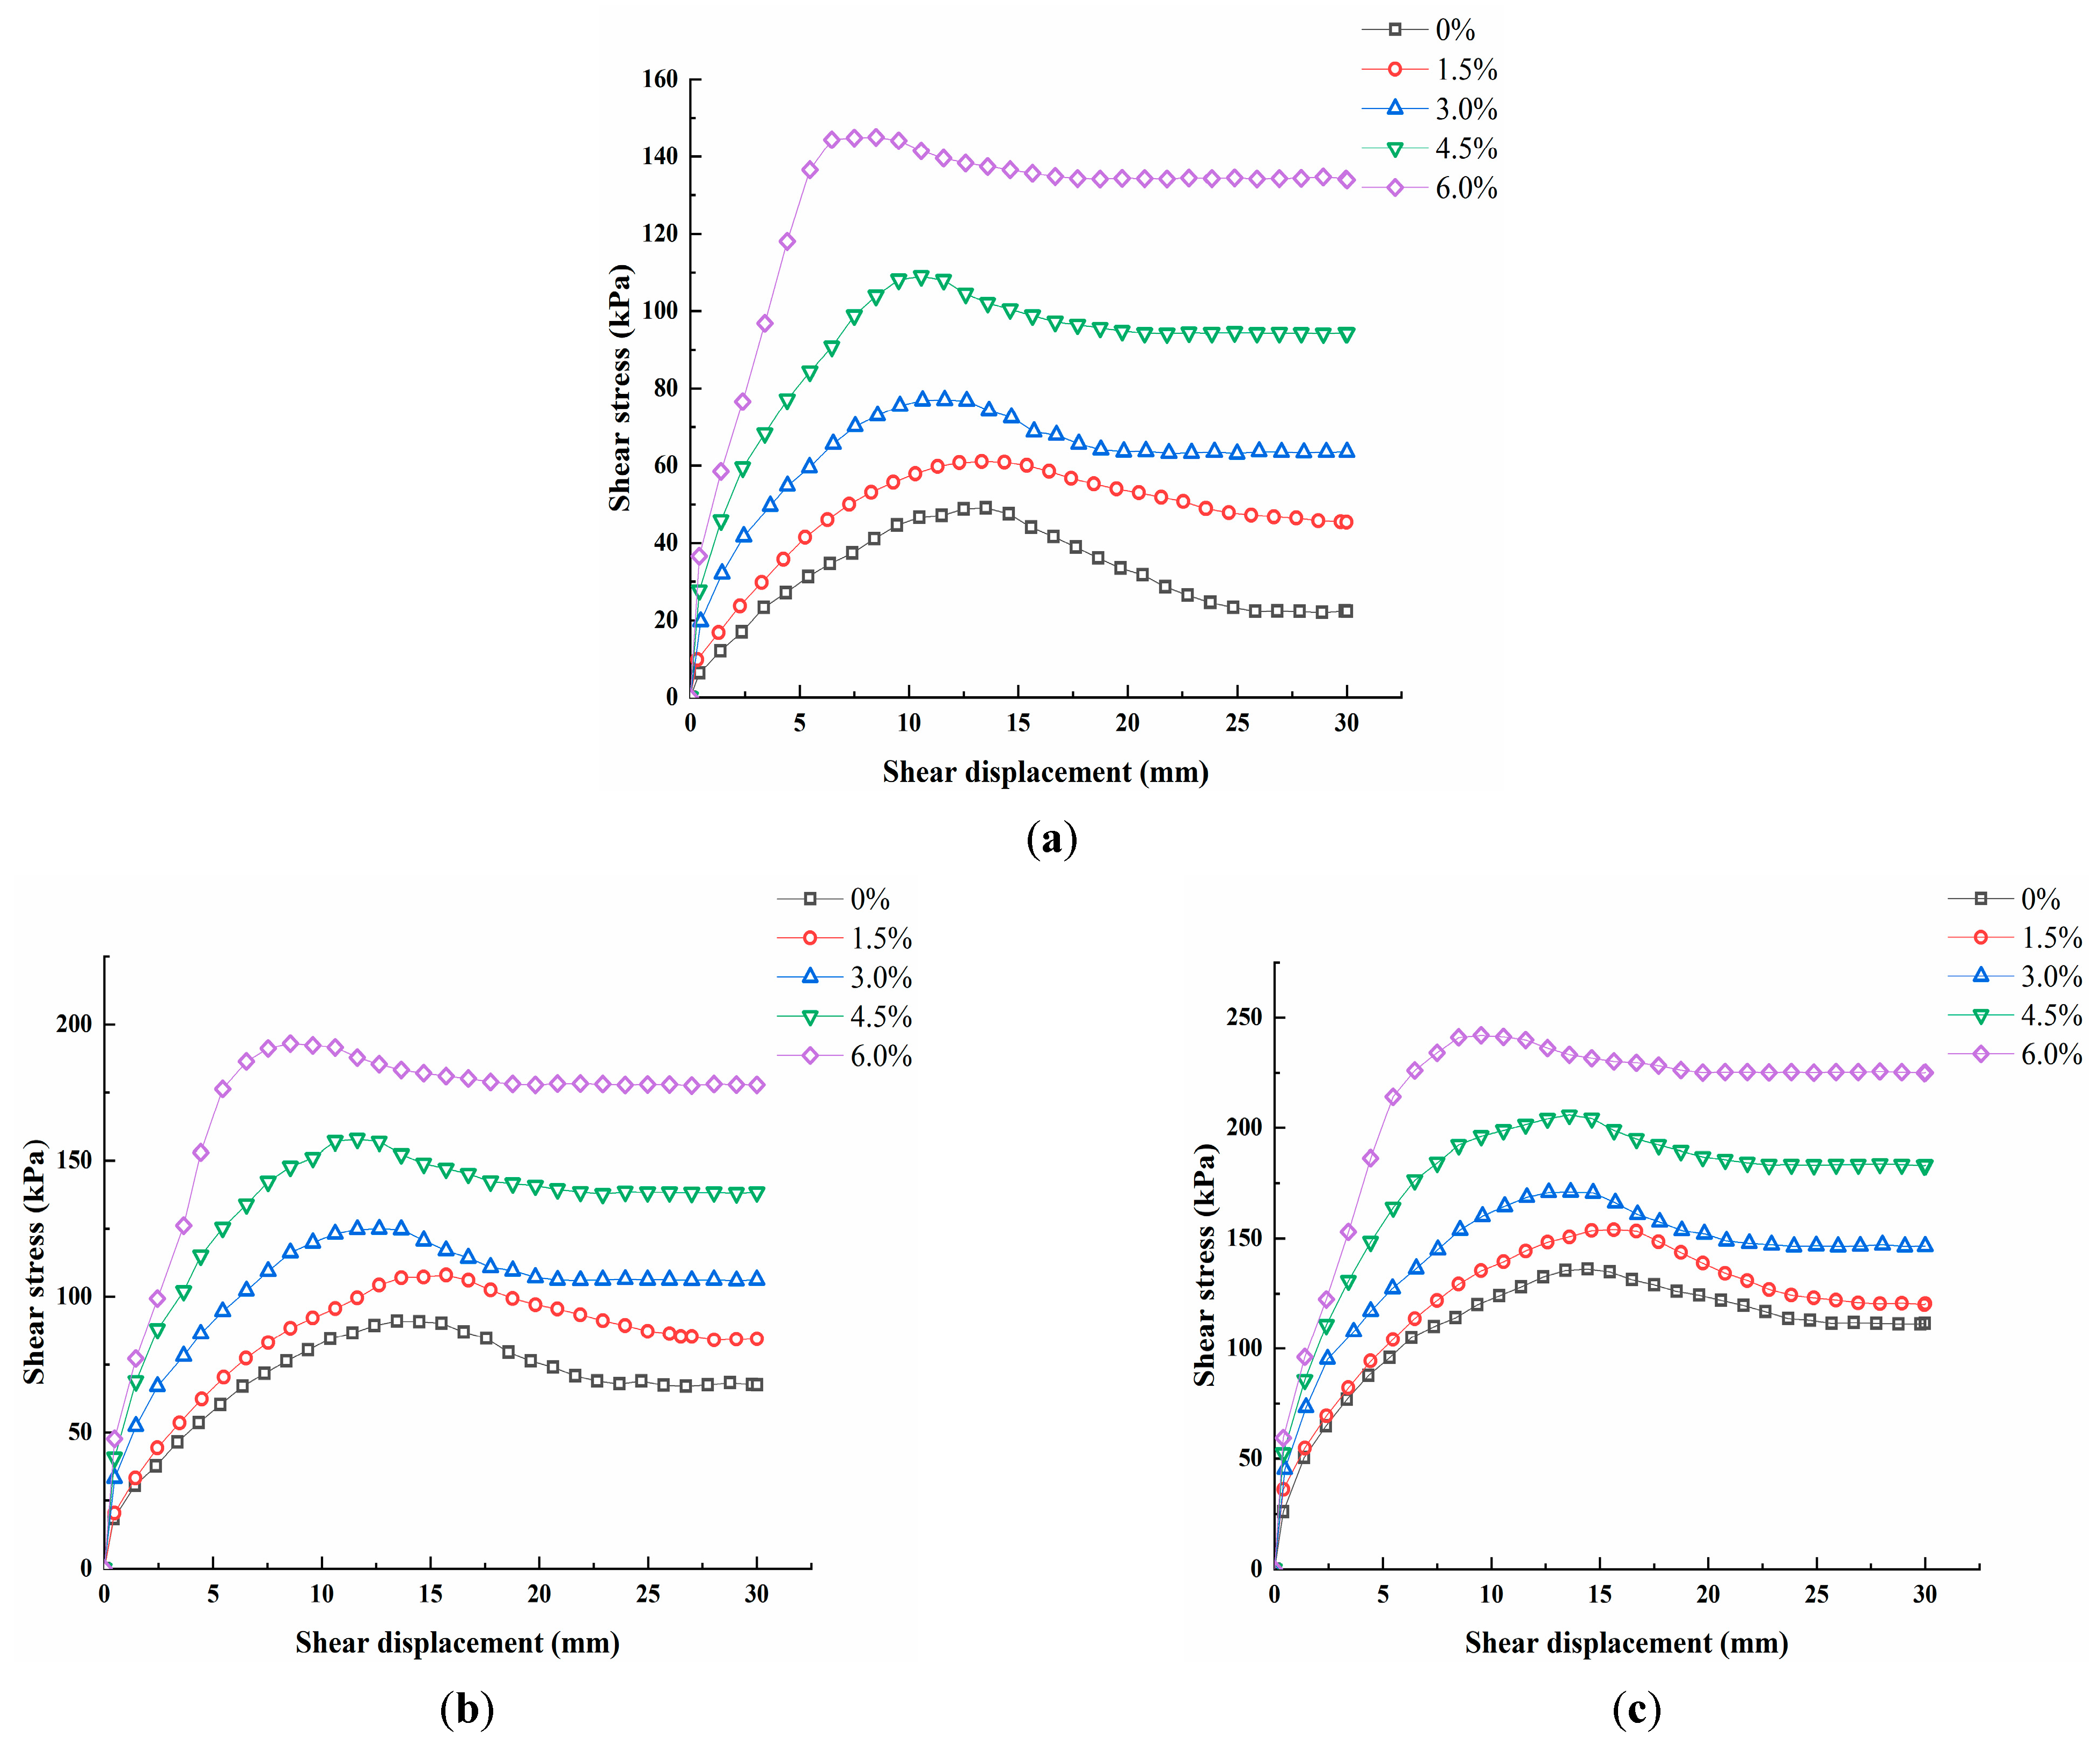
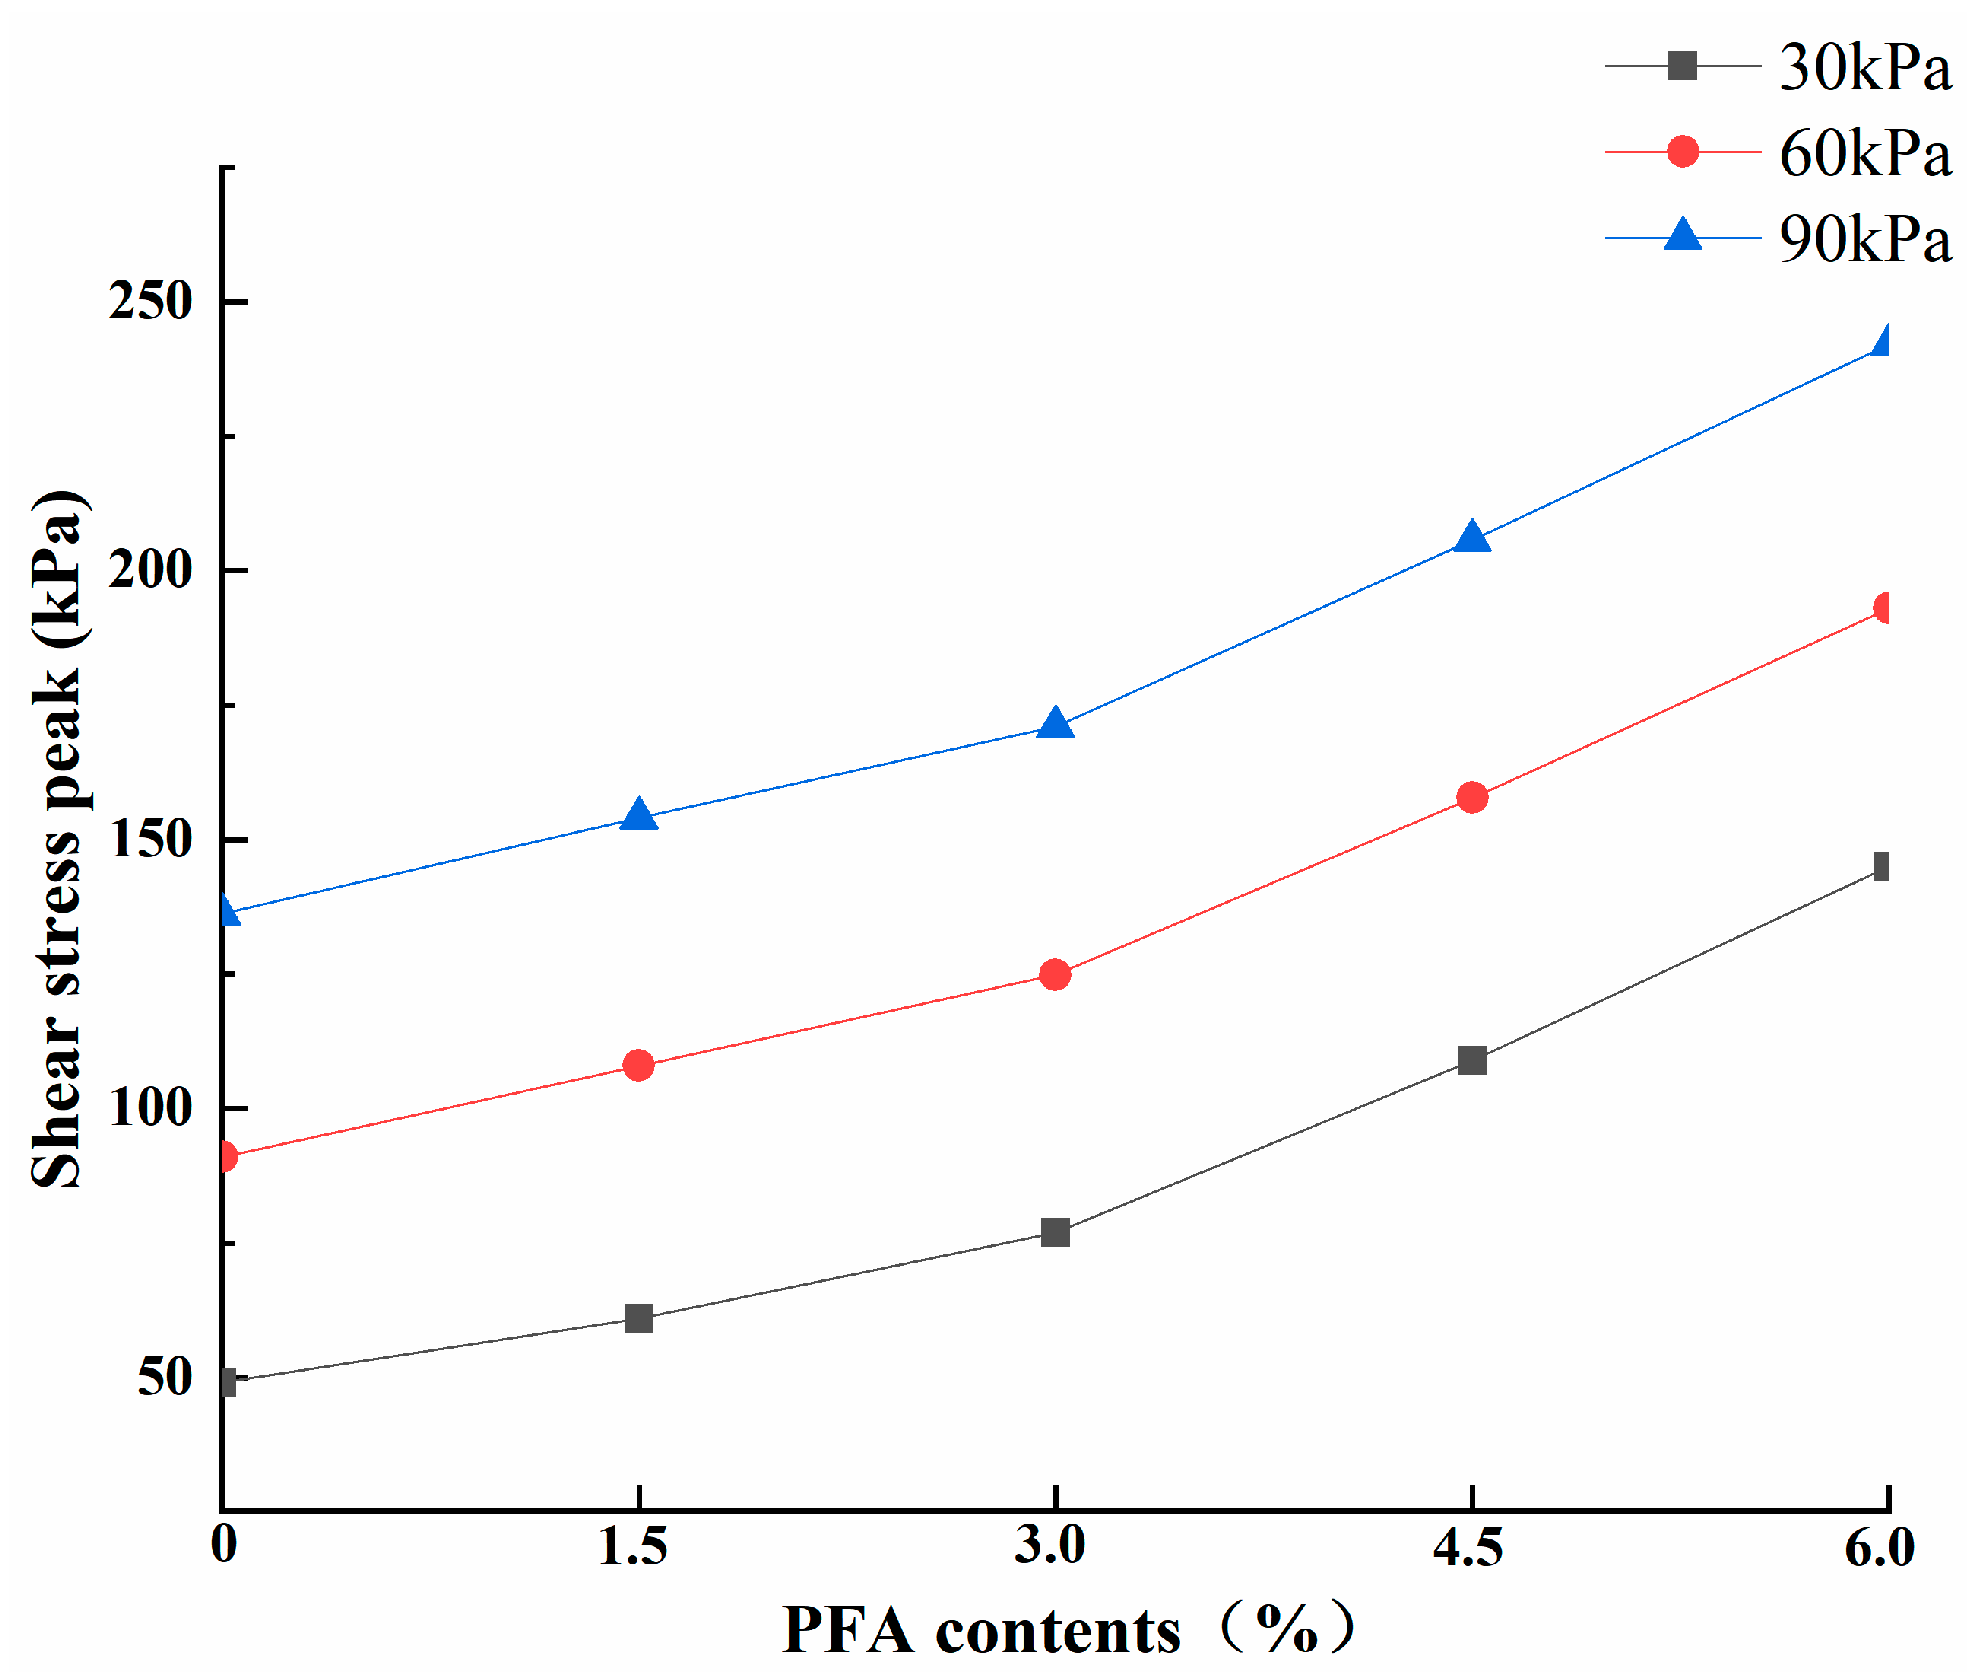
3.1.2. The Influence of Polyurethane Content on the Shear Strength of CDW

The relationship curves between shear stress and shear strain of CDW under different vertical loads and polyurethane content of 0%, 1.5%, 3.0%, 4.5%, and 6.0% are shown in Figure 6. It is clear to show that: Under the same vertical load, the peak shear stress increases with the increase of polyurethane content. The specific values of peak shear stress under different vertical loads and polyurethane contents are shown in Table 2. First, after the mixing of polyurethane and CDW particles, the filling of polyurethane foam in the structural gaps of the CDW sample can be realized, which makes the sample denser and the internal connection stronger. Hence the overall mechanical strength of the sample is improved. Secondly, polyurethane forms a huge skeleton network through connected gaps, which cures the loose CDW particles into a complete structure, thus improving its shear performance. With the increase of the polyurethane content, the stress and strain relationship curves under the three different vertical stresses are gradually approaching. The situation largely results from the fact that the resistance of the CDW to the horizontal load under the curing of the polyurethane has significant improvement. In contrast, the vertical load has a limited increase in shear stress, and the impact is gradually reduced.
The residual stress of the samples increases with the increase of the polyurethane content, and the strain-softening characteristic of the curve converges. When the sample is damaged, the particles are wrapped by polyurethane foam, it is difficult for the particles to have rolling displacement and rearrangement under horizontal load, and the residual stress of the sample is improved. With the increase of the polyurethane content, the shear displacement corresponding to the peak shear stress also gradually decreases, and the slope of the curve gradually increases. It shows that the polyurethane content is positively correlated with the initial stiffness of the sample, and has a similar effect to the vertical load. This is because the polyurethane foam bonds the particles together with the increase of polyurethane content, and the integrity of the sample is improved. The improvement of integrity will lead to larger shear stress when the sample is destroyed, which enhances the shear strength of CDW and greatly increases the residual stress of the sample at the same time.
The relationship between the peak shear stress of CDW and the polyurethane content is plotted in Figure 7. From Figure 7, it can be observed that the peak shear stress of CDW is consistent with the change in the polyurethane content. At the same time, the slope of the curve increases significantly with the content of polyurethane reaching 4.5% and 6.0%. This trend can also be seen in the spacing between the shear stress-shear displacement curves at each polyurethane content in Figure 6. This also shows that when the polyurethane content is low (below 4.5%), the improvement effect of polyurethane on the shear strength of CDW is limited. When the polyurethane content continues to increase (above 4.5%), the improvement effect of polyurethane on the shear strength of CDW is relatively obvious. The mechanism is revealed in the following microscopic analysis. The increased ratio of the peak shear stress of the CDW after curing relative to the peak shear stress of the uncured CDW under the same vertical load is plotted in Figure 8. The specific values of the improvement ratios of peak shear stress are listed in Table 3. It can be clearly seen that under the same vertical load, the improvement ratio increases with the increase of polyurethane content. Still, when the polyurethane content is constant, the improvement ratio decreases with the increase of vertical load. Therefore, it can be obtained that the curing effect of CDW at a vertical load of 30 kPa and a polyurethane content of 6% is significantly better than that of the other test groups.

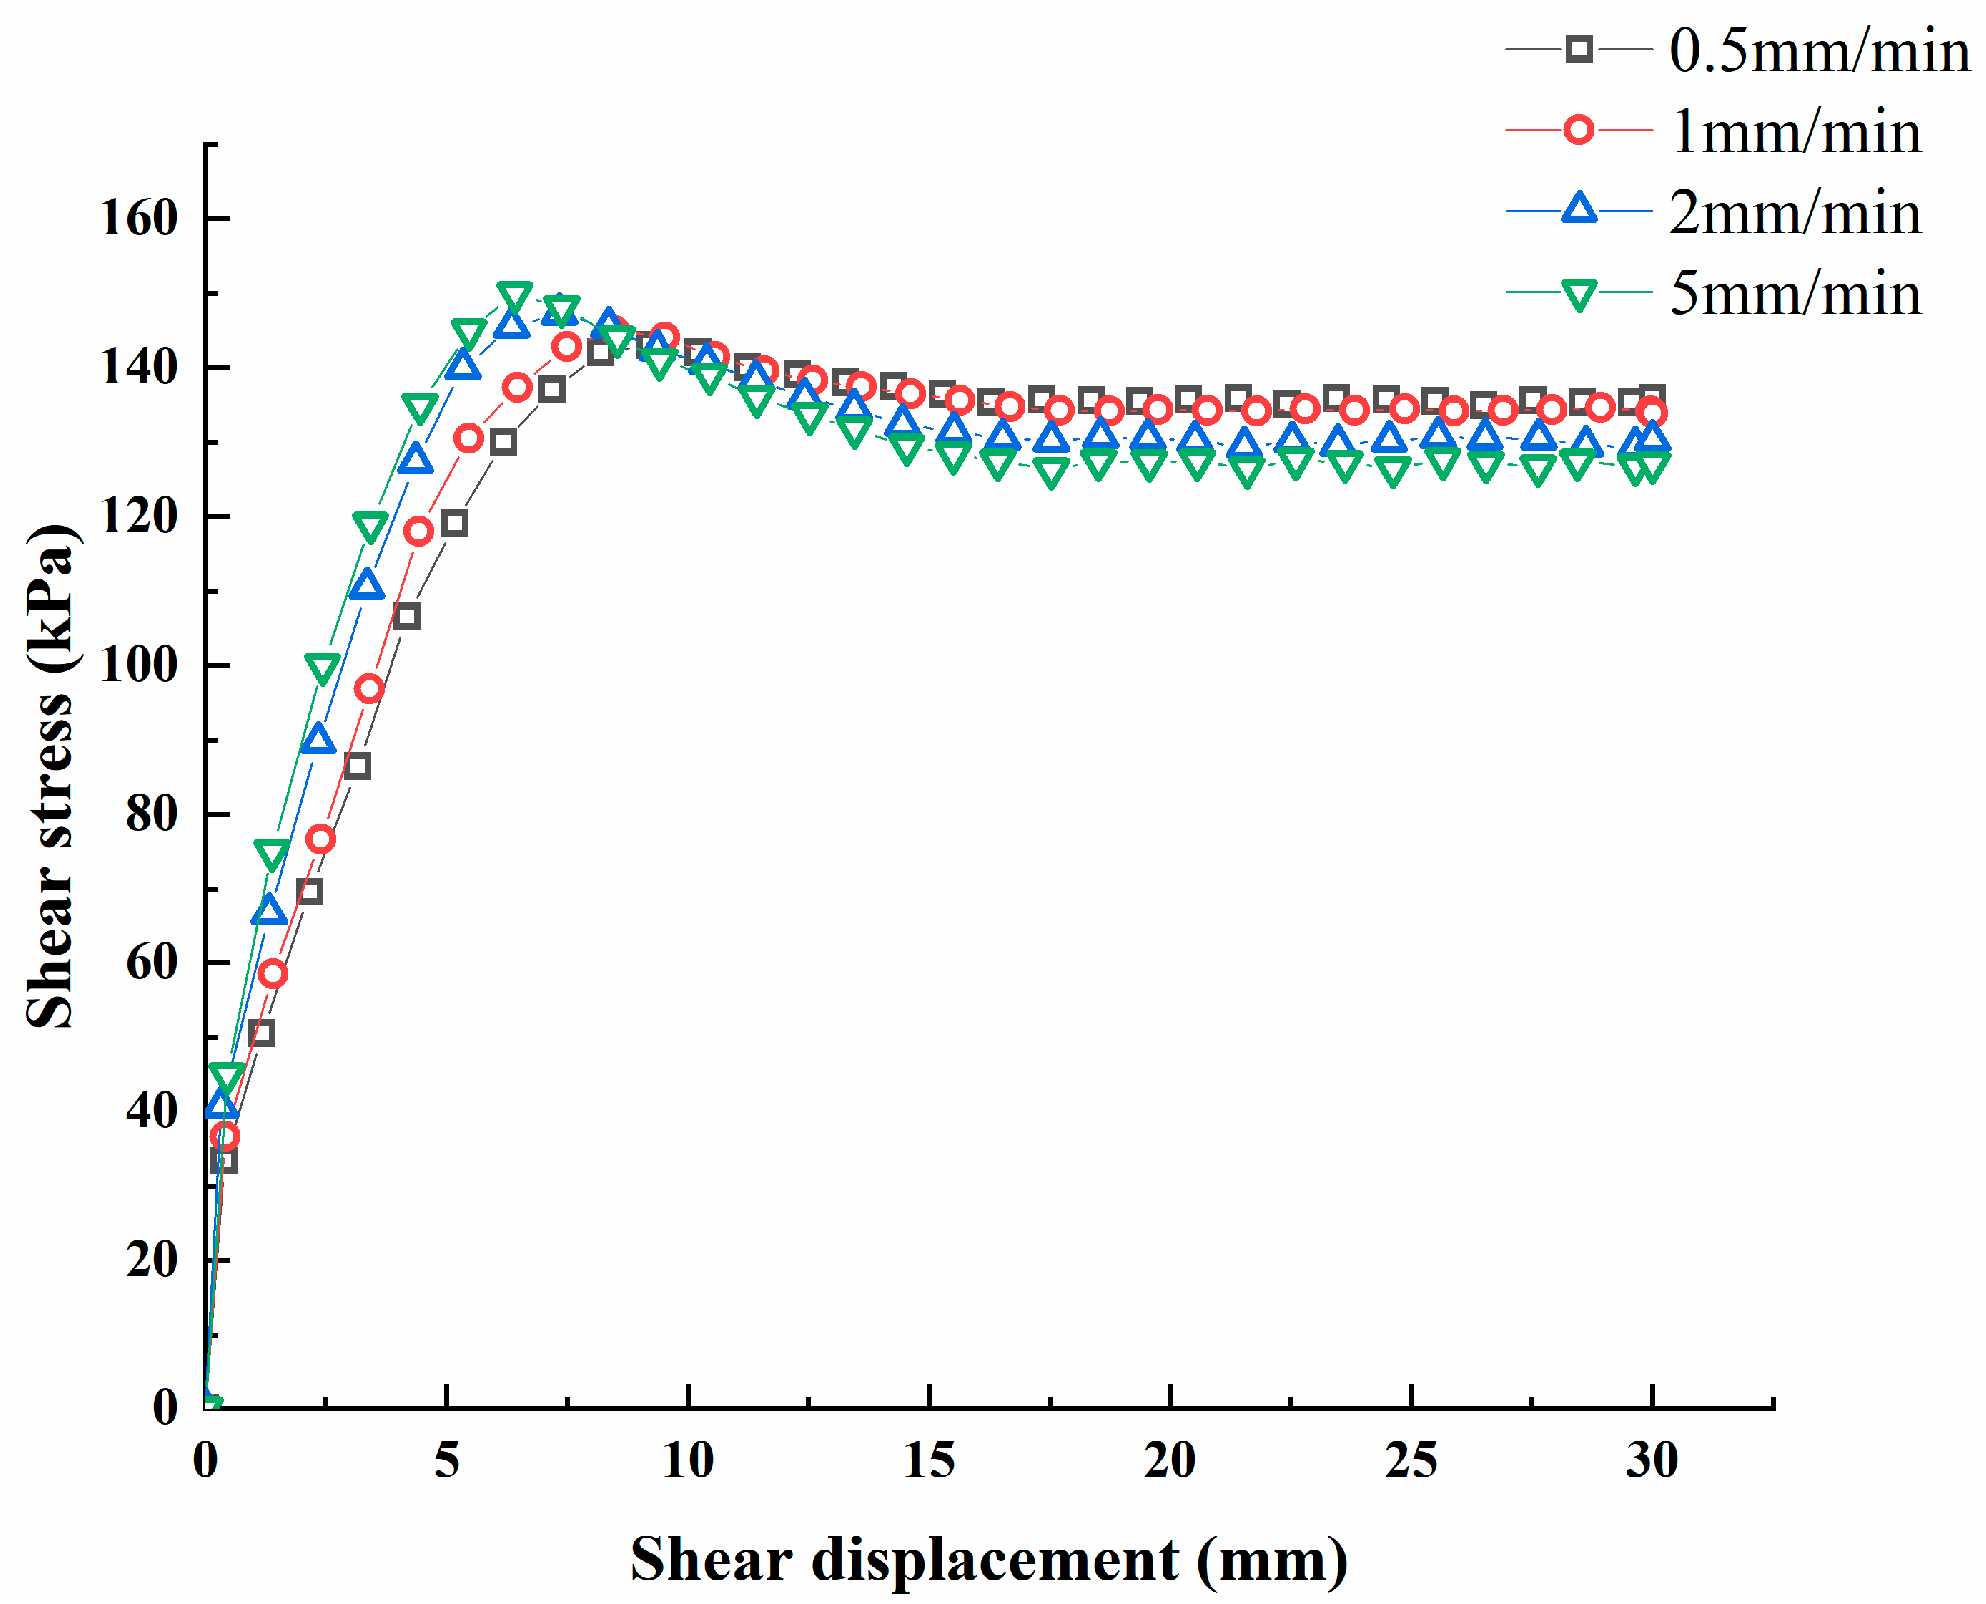
3.1.3. The Influence of Shear Rate on the Shear Strength of CDW

To study the effect of shear rate on the shear stress of CDW, this paper selected typical samples (vertical load of 30 kPa, polyurethane content of 6%) to conduct direct shear tests at shear rates of 0.5 mm/min, 1 mm/min, 2 mm/min and 5 mm/min respectively. The relationship between shear stress and shear strain is shown in Figure 9. The shear stress-shear strain curves presented in Figure 9 show that for any shear rates, all of the shear stress curves of the solidified CDW present similar trends, indicating that the shear rate has little effect on the shear properties of the solidified CDW. As the shear rate increases, the peak shear stress also increases slightly. When the shear rate is small, the shear resistance mainly comes from the fragmentation of the particles. When the shear rate is large, not only the fragmentation of the particles but also the slippage and rolling of the particles must be overcome during the shearing process. This results in the peak shear stress slightly increasing. The faster the shear rate, the smaller the shear displacement when the peak shear stress is reached, and the slower the shear rate, the greater the shear displacement when the peak shear stress is reached. In addition, the slope of the stress-strain curve increases with an increase shear rate before the curve tends to be stable.

3.1.4. The Influence of Polyurethane Content on the Cohesion and Internal Friction Angle of CDW

Figure 10 and Figure 11 reflect the changes in the cohesion and internal friction angle of CDW with the increase of polyurethane content. It can be seen from Figure 10 that the cohesion of CDW with 0% polyurethane is only 4.9 kPa. With the increase of the polyurethane content, the cohesion of CDW after curing also increases. When the polyurethane content is 6%, the cohesion increase to 96.3 kPa, an increase of 1865.3%. The explanation of the significant increase in cohesion mainly involves two aspects. One is that the polyurethane foam reacts between the CDW particles and expands in volume. The gaps between the particles are filled by the polyurethane foam, resulting in the sample being denser. Meanwhile, the polyurethane foam binds the dispersed particles to each other. Another is that the surface of the particles is uneven and irregular, the polyurethane foam is forced to adapt to the shape of the gaps between the particles during the formation process, which also makes the connection between the polyurethane and the particles more reliable, therefore the integrity is enhanced. In addition, when the polyurethane content is 4.5%, the cohesion of CDW increases rapidly. When the polyurethane content is 4.5%, enough polyurethane foam is generated. While filling the gaps between the particles, it also begins to wrap multiple particles, making the particles more closely connected. It can be seen from Figure 11 that the increase of the polyurethane content has no obvious effect on the internal friction angle of CDW. The internal friction angle changes from 55.44° to 58.26°, and the change range is small. Although polyurethane has a slight increase in the internal friction angle of CDW, there is no obvious law in the trend of improvement.

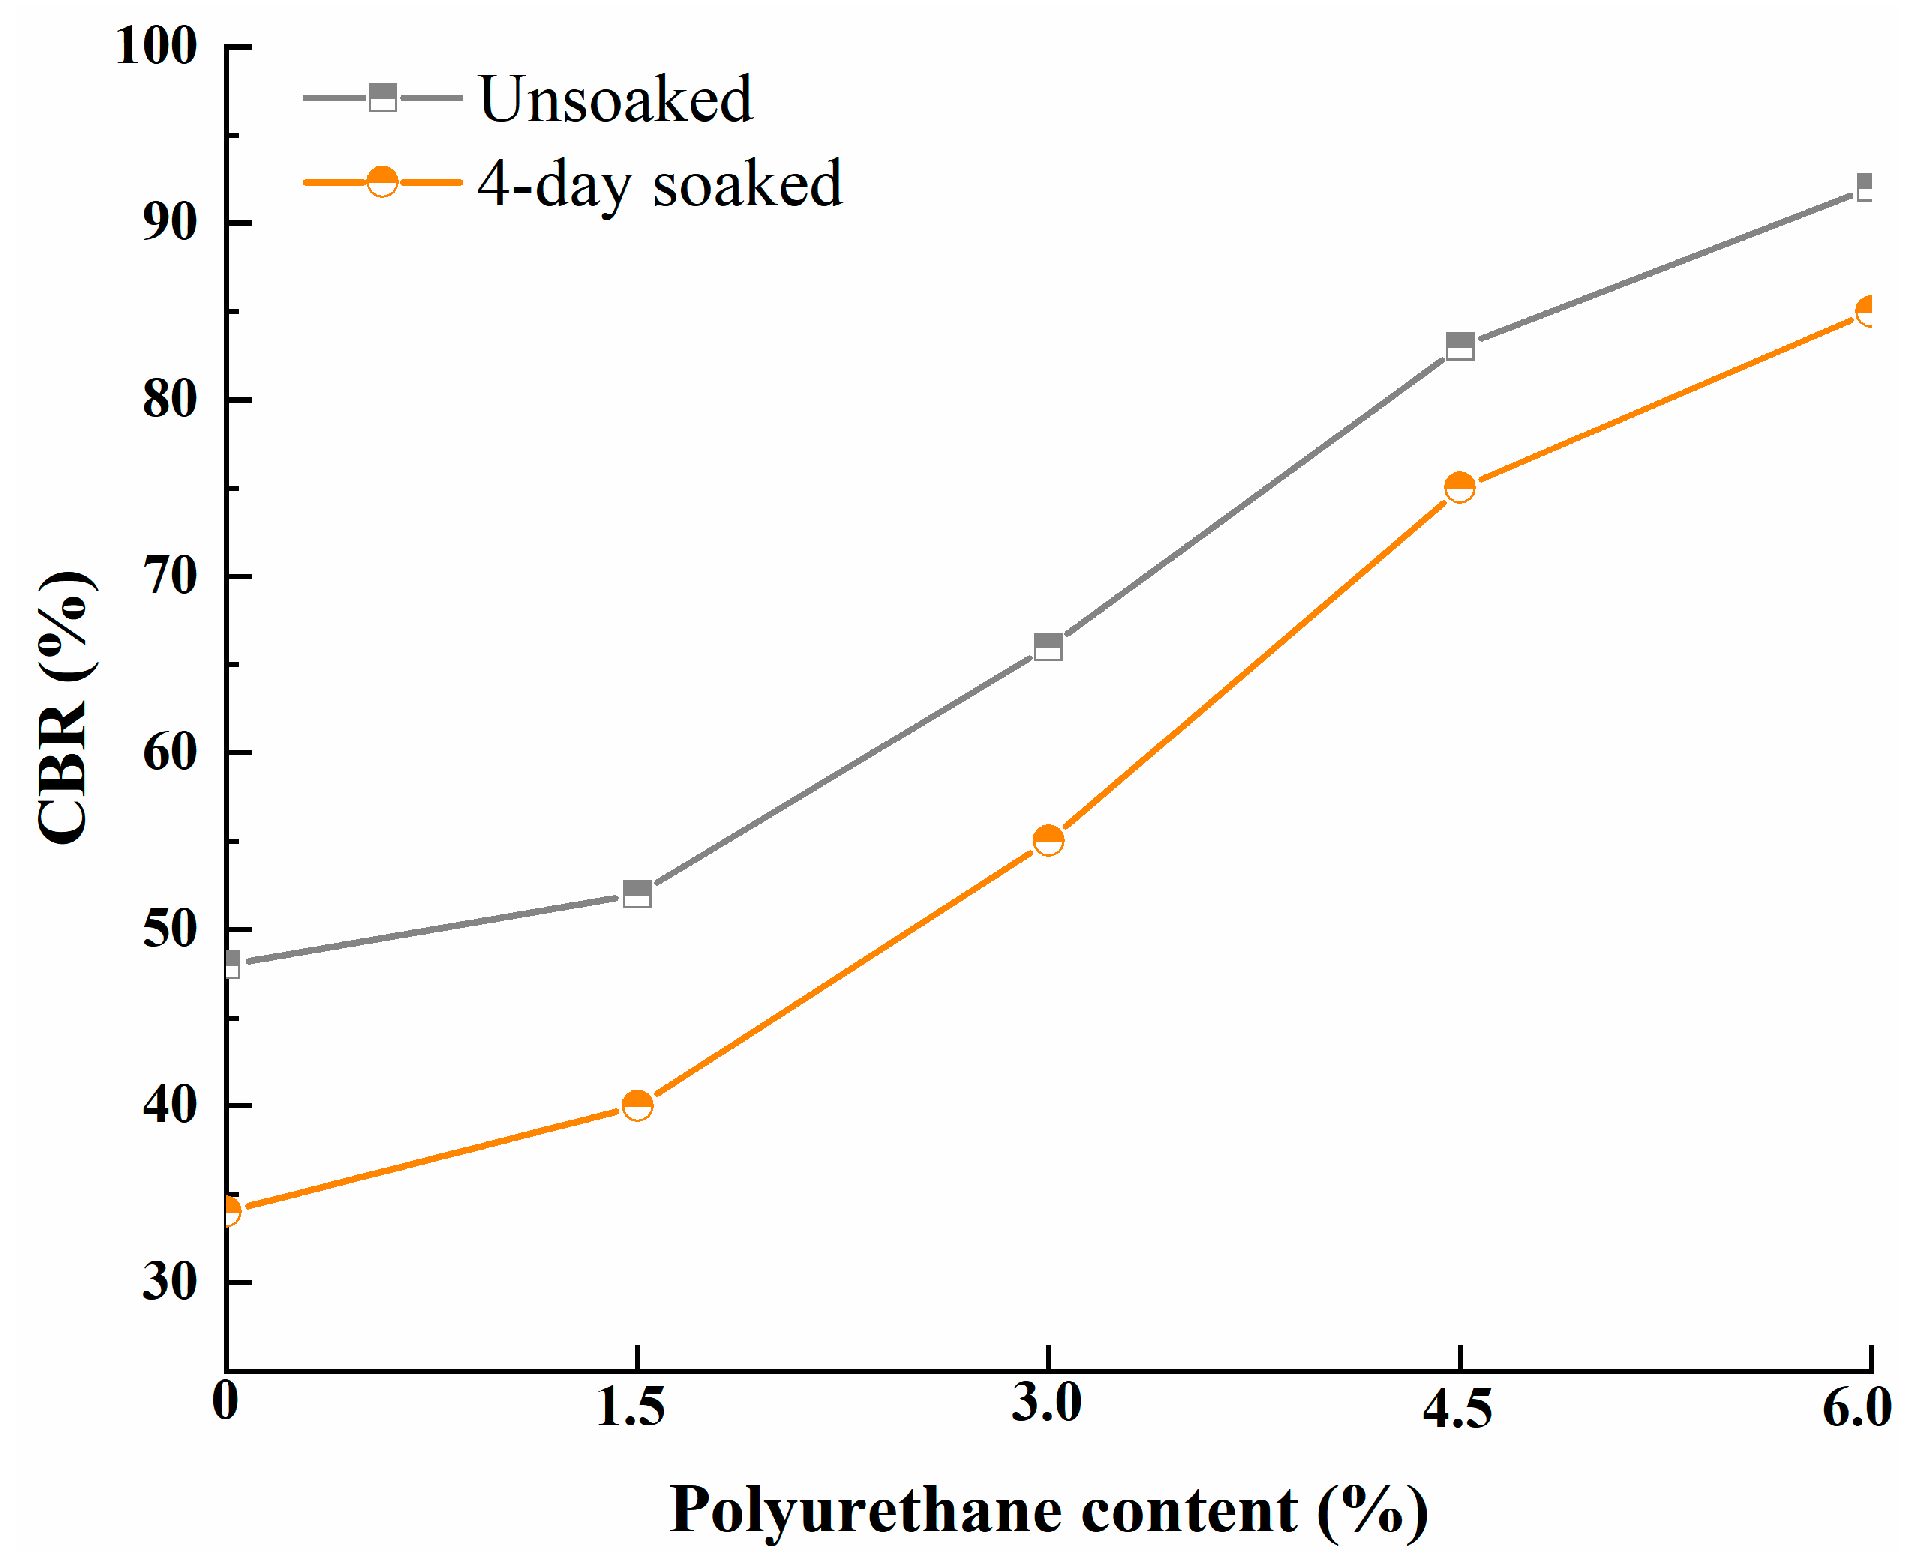
3.2. California Bearing Ratio (CBR) Test Results and Analysis

Figure 12 presents the relation between the CBR values and the polyurethane contents. As can be seen that the CBR value of the PFA-improved CDW increased with the increase of the polyurethane content, regardless of the unsoaked and 4-day soaked conditions. When the polyurethane content is zero, the particles are relatively loose, and the particles are easy to move when the metal column enters. Polyurethane foam reacts in the gaps to produce volume expansion. The volume of polyurethane foam is several times the volume of the original polyurethane solution. These polyurethane foams continuously squeeze and bond with the surrounding particles in the production process, which greatly increases the resistance of particle rearrangement. In fact, CBR values greatly influence the design of pavement base and subbase. Usually, the larger the CBR values, the smaller the thickness of the pavement base and subbase. The 4-day soaked period has an effect on the CBR value of CDW. Compared with the unsoaked CDW, the CBR value of CDW is reduced after the 4-day soaked period, and this phenomenon is more significant when the polyurethane content is zero. The main reason is that CDW particles are soaked in water for a long time, the strength of the material itself decreases significantly, and the brittleness of the material increases. Compared with CDW improved by polyurethane, the traditional CDW has more gaps between particles, which also increases the contact area between particles and water, and accelerates the destruction of water molecules on particles. With the increase of polyurethane content, the loss of CBR after the 4-day soaked period gradually decreased. Most of the gaps after water molecules enter are occupied in advance by the polyurethane foam with volume expansion, which well resists the destruction of CDW particles after water molecules enter. Moreover, when the polyurethane content is high, the CDW particles are wrapped by the polyurethane foam generated by the reaction. The contact area between the particles wrapped by polyurethane foam and water molecules is greatly reduced, and the CDW particles are well protected, which greatly reduces the loss caused by the increase of material brittleness.

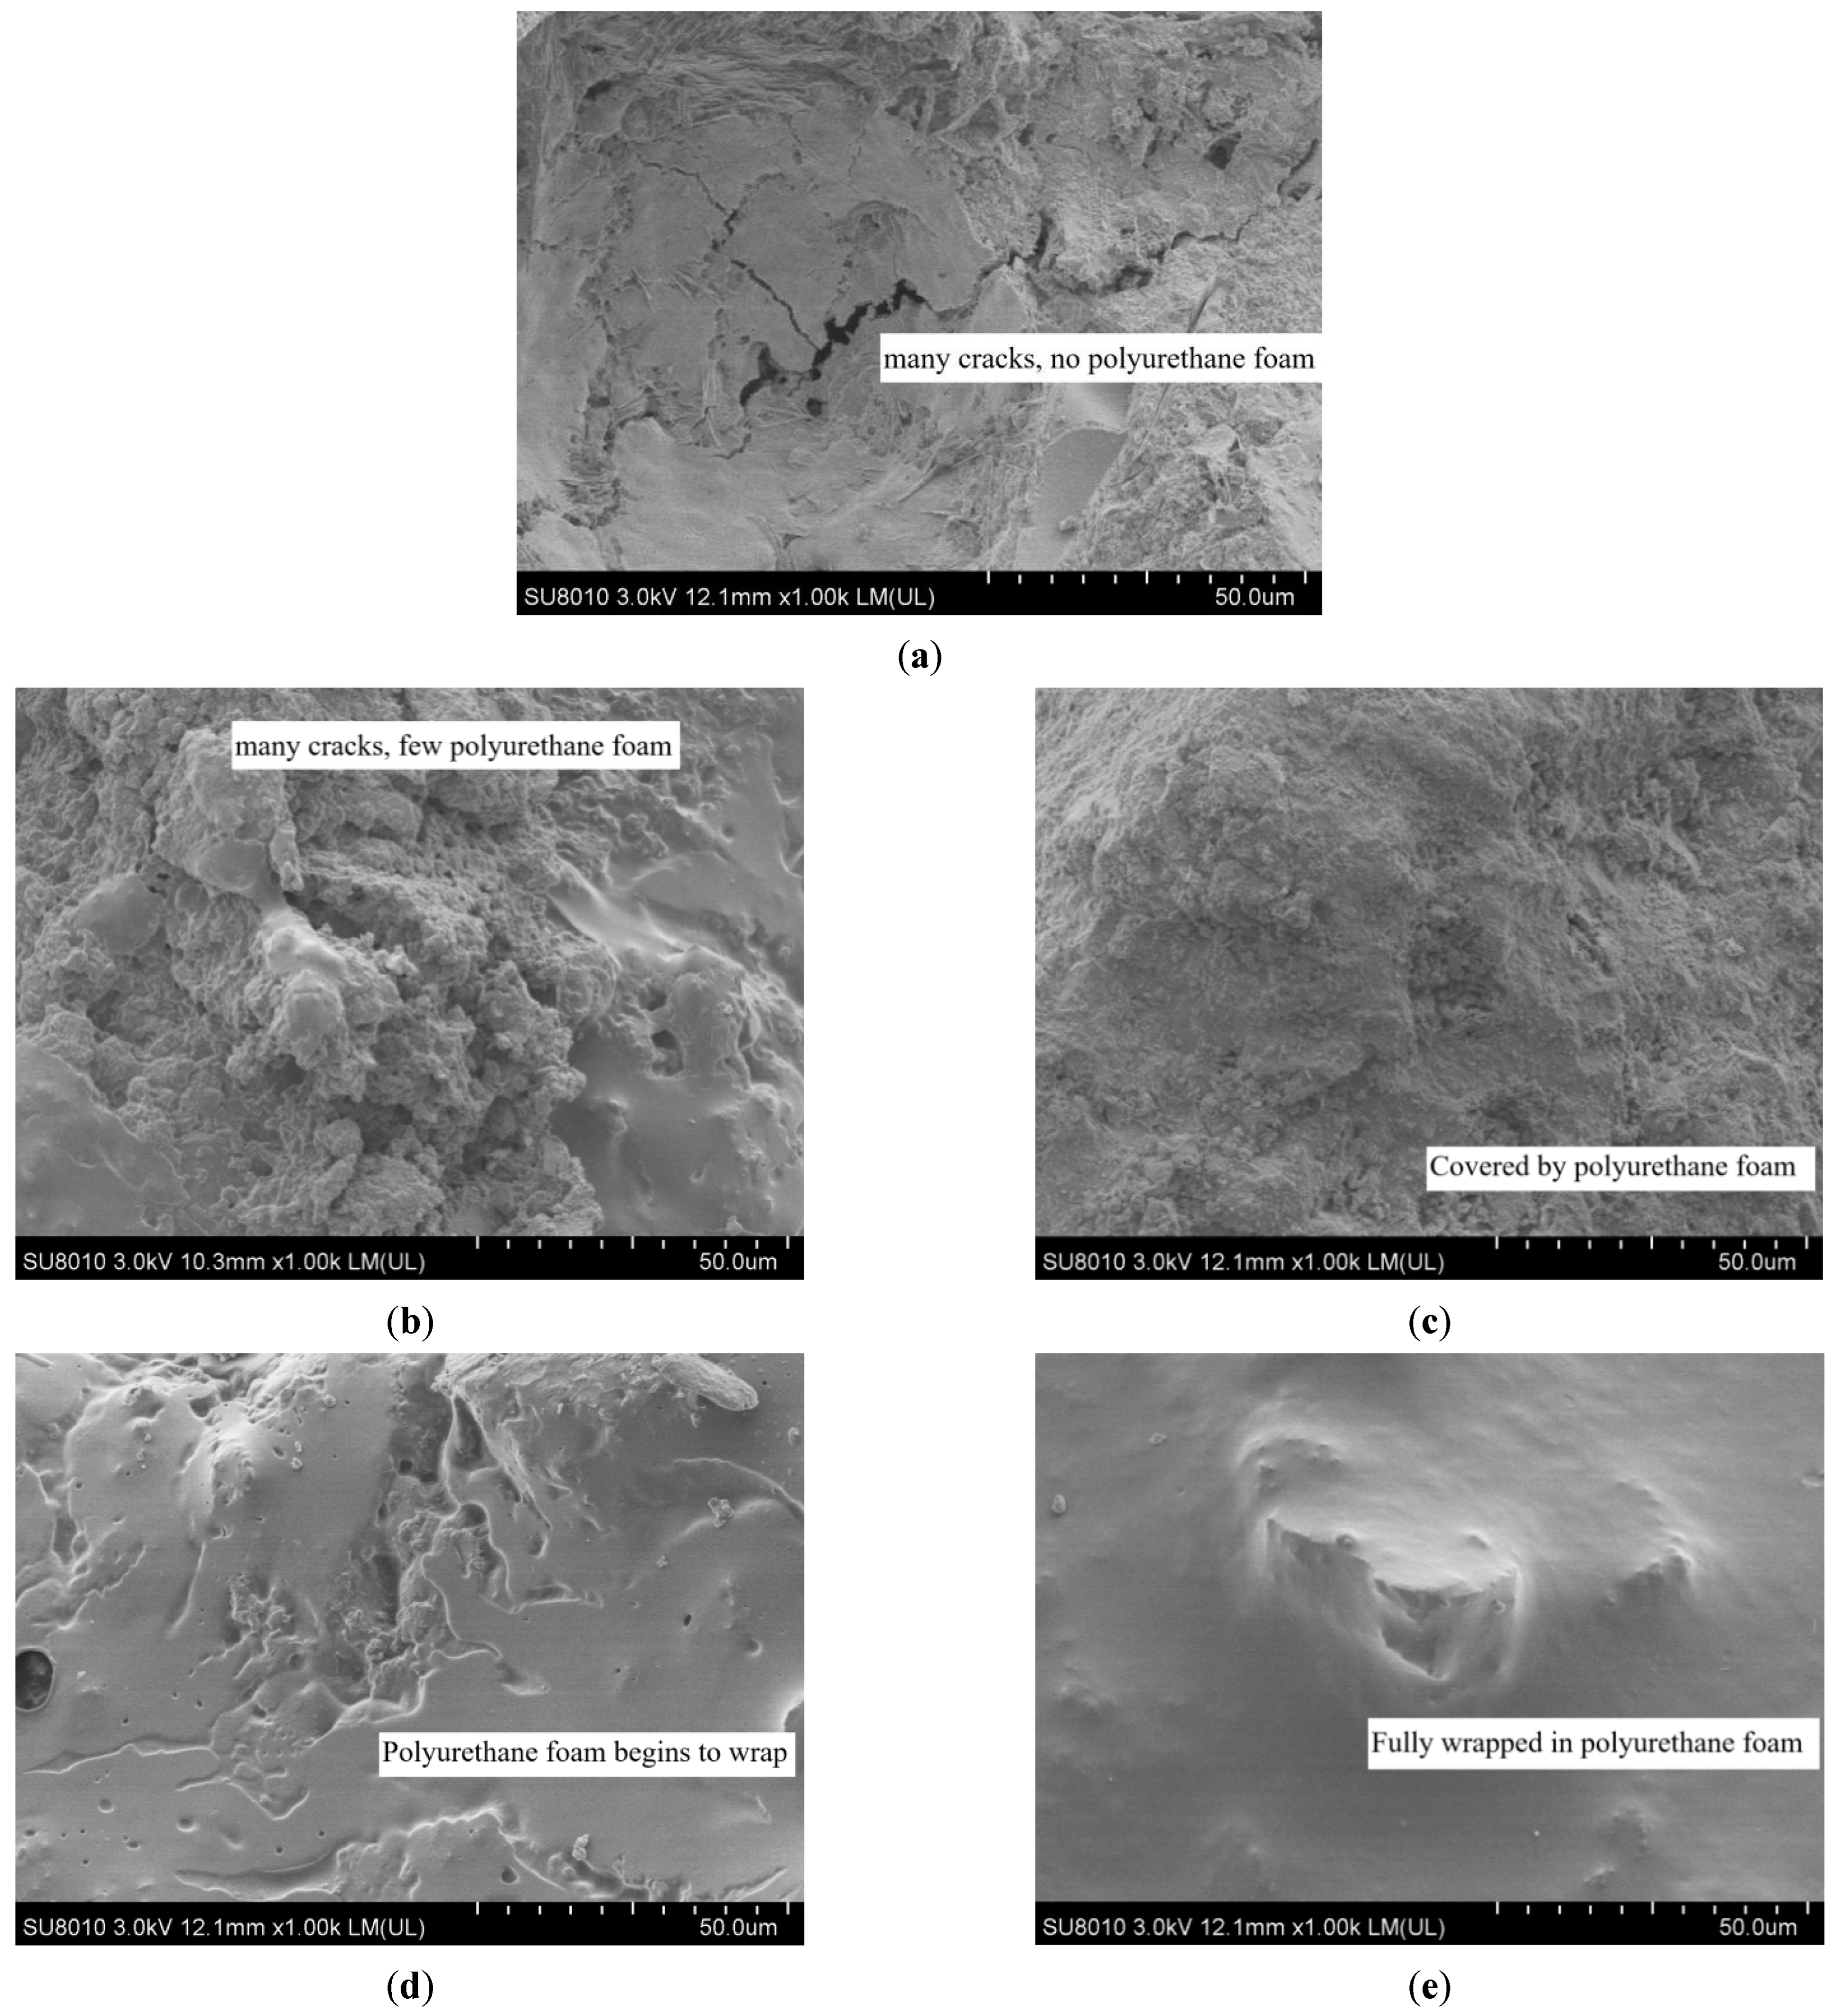
3.3. Microscopic Analysis

SEM was used in this study to reveal further the mechanism of the significant improvement of the shear resistance of CDW after polyurethane is added. From Figure 13, it can be observed clearly that the surface morphology of CDW particles with different polyurethane content after 1000 times magnification is different. It can be seen from Figure 13a that the surface of a single CDW particle is rough, uneven, and accompanied by multiple cracks with different widths. The complex surface morphology and angular properties increase the interlocking effect between particles, thereby improving the resistance of the sample to horizontal load. However, these factors also lead to large gaps between particles, no cohesion and poor integrity. Even if there is contact bite force between particles, in the shearing process, with the increase of the horizontal load, large dislocations and slippages still occur. Even the stress is concentrated in the edges and corners of the particles under the load, which eventually causes the destruction of the edges and corners of the particles, and the occlusion effect between the particles is significantly reduced. When the polyurethane content is zero, once the edges and corners of the particles are destroyed, the interlocking effect disappears, and the crushing strength of a single particle has become the main factor affecting the shear strength of CDW.
It can be seen from Figure 13b–e that the area covered by polyurethane foam on the particle surface increases with the increase of polyurethane content. In the early stage of the reaction, polyether polyol and isocyanate are both liquids. Depending on the excellent fluidity of the liquid, they pass through the gaps between particles evenly. At this time, the gaps of the particles that cause the poor integrity of the sample left a certain space for the reaction of isocyanates and polymer polyols. When the polyurethane content is 1.5%, a small area of the particle surface is attached with a small amount of polyurethane foam. The polyurethane foam gradually fills the cracks between the particles. However, the content is low, causing less polyurethane foam to be produced, and there are still large gaps inside the particles. When the polyurethane content is 3%, the surface of the particles has been covered by polyurethane. Although there are still many gaps, the cracks and particle edges and corners are significantly reduced. With the continuous increase of the polyurethane content, when it reaches 4.5%, the polyurethane foam gradually increases, and the volume after the expansion is also significantly increased. The polyurethane foam fills the gaps between the particles, and some particles are gradually wrapped to form the tendency of particle agglomerates. This is also why compared with the polyurethane content of 0%, 1.5% and 3.0%, the peak shear stress increased significantly when the polyurethane content was 4.5% and 6.0%. When the polyurethane content reaches 6%, the polyurethane foam has the highest coverage on the surface of particles and has completely wrapped multiple particles to form a complete agglomerate. The connection between the particles is tighter under the action of polyurethane cementing, and the integrity of the CDW has significantly improved. The ability to resist horizontal load has also reached a higher level in the shearing process.

4. Conclusions

Based on the large-scale laboratory direct shear test, this study focused on the evolution law of the shear properties of CDW with different polyurethane dosages under different vertical pressures and shear rates. Compared with traditional CDW, the shear strength and local bearing capacity of CDW improved by polyurethane have been greatly improved. Therefore, CDW improved by polyurethane can be better used in the actual engineering construction of geotechnical engineering.
The main conclusions are as follows:
The addition of polyurethane has little effect on the internal friction angle, the polyurethane foam adhesive plays a significant role in improving the shear resistance of CDW mainly by greatly improving the cohesion of CDW. The peak shear stress and residual shear strength increase with the increase of polyurethane content. When the CDW with 6% polyurethane content under 30 kPa, the improvement effect was most obvious, which increased 196.1% compared with the peak shear stress of CDW with 0% polyurethane content under the same vertical load.
The stress-strain curves of CDW with 0% polyurethane content present an obvious nonlinear relationship and have strain-softening behavior. With the increase of polyurethane content, the initial stiffness of CDW is improved, and the strain-softening behavior is suppressed.
The vertical load also have a significant influence on the shear properties of CDW. With the increase of polyurethane content, this effect gradually decreases compared with the increase of polyurethane foam on the shear stress of CDW. The shear rate has little effect on the peak shear stress of CDW, with the increase in shear rate, the peak shear stress increases slightly, but the residual shear strength is smaller. At the same time, the corresponding shear displacement is smaller when the shear stress reaches the peak value.
CBR test shows that polyurethane can significantly improve the bearing capacity of CDW. The decrease in CDW strength after the 4-day soaked period results in a decrease in the CBR value. However, the loss of CBR caused by the 4-day soaked period is reduced by the polyurethane by occupying the gaps between the particles and wrapping the particles.
SEM observation reveals that with the increase of polyurethane content, the polyurethane foam gradually covers the surface of the particles from partial to full coverage and finally wraps multiple particles to form clusters. The internal connection between the particles is strengthened, and the structure is more solid, which can resist large horizontal loads.

Author Contributions

Funding acquisition, H.X.; Supervision, Q.M.; Validation, H.X.; Visualization, Q.M. and J.L.; Writing—original draft, J.L.; Writing—review & editing, S.H. All authors have read and agreed to the published version of the manuscript.

Funding

This research was funded by the National Natural Science Foundation of China (No. 52078194), the Innovation Demonstration Base of Ecological Environment Geotechnical and Ecological Restoration of Rivers and Lakes (No. 2020EJB004), National Young Top-notch Talent of “Ten Thousand Talents Program” and The Young Top-notch Talent Cultivation Program of Hubei Province.

Data Availability Statement

The corresponding author, confirm that all of the content, figures (drawings, charts, photographs, etc.), and tables in the submitted work are either original work created by the authors listed on the manuscript or work for which permission to re-use has been obtained from the creator. The data used to support the findings of this study are available from the corresponding author upon request, and the readers can access the data supporting the conclusions of the study.

Conflicts of Interest

The authors declare no conflict of interest.

References

  1. Arulrajah, A.; Disfani, M.M.; Horpibulsuk, S.; Suksiripattanapong, C.; Prongmanee, N. Physical properties and shear strength responses of recycled construction and demolition materials in unbound pavement base/subbase applications. Constr. Build. Mater. 2014, 58, 245–257. [Google Scholar] [CrossRef]
  2. Li, Z.; Yang, J.; Liu, L.; Yan, S. Evaluating the creep characteristics of recycled construction waste materials under saturated and dry condition. Arab. J. Geosci. 2021, 14, 153. [Google Scholar] [CrossRef]
  3. Hu, Z.; Kong, Z.; Cai, G.; Li, Q.; Guo, Y.; Su, D.; Liu, J.; Zheng, S. Study of the Properties of Full Component Recycled Dry-Mixed Masonry Mortar and Concrete Prepared from Construction Solid Waste. Sustainability 2021, 13, 8385. [Google Scholar] [CrossRef]
  4. Tang, Q.; Ma, Z.; Wu, H.; Wang, W. The utilization of eco-friendly recycled powder from concrete and brick waste in new concrete: A critical review. Cem. Concr. Compos. 2020, 114, 103807. [Google Scholar] [CrossRef]
  5. Lu, W. Big data analytics to identify illegal construction waste dumping: A Hong Kong study. Resour. Conserv. Recycl. 2018, 141, 264–272. [Google Scholar] [CrossRef]
  6. Guerra, B.C.; Bakchan, A.; Leite, F.; Faust, K.M. BIM-based automated construction waste estimation algorithms: The case of concrete and drywall waste streams. Waste Manag. 2019, 87, 825–832. [Google Scholar] [CrossRef]
  7. Wu, H.; Zuo, J.; Zillante, G.; Wang, J.; Yuan, H. Status quo and future directions of construction and demolition waste research: A critical review. J. Clean. Prod. 2019, 240, 118163. [Google Scholar] [CrossRef]
  8. Seror, N.; Portnov, B.A. Estimating the effectiveness of different environmental law enforcement policies on illegal C&D waste dumping in Israel. Waste Manag. 2019, 102, 241–248. [Google Scholar] [CrossRef]
  9. Xiao, J.; Ma, Z.; Ding, T. Reclamation chain of waste concrete: A case study of Shanghai. Waste Manag. 2016, 48, 334–343. [Google Scholar] [CrossRef]
  10. Barbudo, A.; Agrela, F.; Ayuso, J.; Jiménez, J.R.; Poon, C.S. Statistical analysis of recycled aggregates derived from different sources for sub-base applications. Constr. Build. Mater. 2012, 28, 129–138. [Google Scholar] [CrossRef]
  11. Dolan, P.J.; Lampo, R.G.; Dearborn, J.C. Concepts For Reuse And Recycling Of Construction And Demolition Waste; Construction Engineering Research Lab (Army): Champaign, IL, USA, 1999. [Google Scholar]
  12. Arulrajah, A.; Piratheepan, J.; Bo, M.W.; Sivakugan, N. Geotechnical characteristics of recycled crushed brick blends for pavement sub-base applications. Can. Geotech. J. 2012, 49, 796–811. [Google Scholar] [CrossRef]
  13. Tavira, J.; Jiménez, J.R.; Ayuso, J.; Sierra, M.J.; Ledesma, E.F. Functional and structural parameters of a paved road section constructed with mixed recycled aggregates from non-selected construction and demolition waste with excavation soil. Constr. Build. Mater. 2018, 164, 57–69. [Google Scholar] [CrossRef]
  14. Cabalar, A.; Zardikawi, O.; Abdulnafaa, M. Utilisation of construction and demolition materials with clay for road pavement subgrade. Road Mater. Pavement Des. 2017, 20, 702–714. [Google Scholar] [CrossRef]
  15. Leite, F.D.C.; Motta, R.; Vasconcelos, K.L.; Bernucci, L. Laboratory evaluation of recycled construction and demolition waste for pavements. Constr. Build. Mater. 2011, 25, 2972–2979. [Google Scholar] [CrossRef]
  16. Rahman, M.A.; Arulrajah, A.; Piratheepan, J.; Bo, M.W.; Imteaz, M.A. Resilient Modulus and Permanent Deformation Responses of Geogrid-Reinforced Construction and Demolition Materials. J. Mater. Civ. Eng. 2014, 26, 512–519. [Google Scholar] [CrossRef]
  17. Rahman, A.; Imteaz, M.; Arulrajah, A.; Disfani, M.M. Suitability of recycled construction and demolition aggregates as alternative pipe backfilling materials. J. Clean. Prod. 2014, 66, 75–84. [Google Scholar] [CrossRef]
  18. Mohammadinia, A.; Arulrajah, A.; Horpibulsuk, S.; Shourijeh, P.T. Impact of potassium cations on the light chemical stabilization of construction and demolition wastes. Constr. Build. Mater. 2019, 203, 69–74. [Google Scholar] [CrossRef]
  19. Kianimehr, M.; Shourijeh, P.T.; Binesh, S.M.; Mohammadinia, A.; Arulrajah, A. Utilization of recycled concrete aggregates for light-stabilization of clay soils. Constr. Build. Mater. 2019, 227, 116792. [Google Scholar] [CrossRef]
  20. Agrela, F.; Barbudo, A.; Ramírez, A.; Ayuso, J.; Carvajal, M.D.; Jiménez, J.R. Construction of road sections using mixed recycled aggregates treated with cement in Malaga, Spain. Resour. Conserv. Recycl. 2012, 58, 98–106. [Google Scholar] [CrossRef]
  21. Mohammadinia, A.; Arulrajah, A.; Sanjayan, J.; Disfani, M.M.; Bo, M.W.; Darmawan, S. Laboratory Evaluation of the Use of Cement-Treated Construction and Demolition Materials in Pavement Base and Subbase Applications. J. Mater. Civ. Eng. 2015, 27, 04014186. [Google Scholar] [CrossRef]
  22. Cristelo, N.; Jimenez, A.M.F.; Vieira, C.; Miranda, T.; Palomo, Á. Stabilisation of construction and demolition waste with a high fines content using alkali activated fly ash. Constr. Build. Mater. 2018, 170, 26–39. [Google Scholar] [CrossRef]
  23. Sharma, R.K.; Hymavathi, J. Effect of fly ash, construction demolition waste and lime on geotechnical characteristics of a clayey soil: A comparative study. Environ. Earth Sci. 2016, 75, 377. [Google Scholar] [CrossRef]
  24. Arulrajah, A.; Mohammadinia, A.; Horpibulsuk, S.; Samingthong, W. Influence of class F fly ash and curing temperature on strength development of fly ash-recycled concrete aggregate blends. Constr. Build. Mater. 2016, 127, 743–750. [Google Scholar] [CrossRef]
  25. Javadi, A.S.; Badiee, H.; Sabermahani, M. Mechanical properties and durability of bio-blocks with recycled concrete aggregates. Constr. Build. Mater. 2018, 165, 859–865. [Google Scholar] [CrossRef]
  26. Qiu, J.; Xiang, J.; Zhang, W.; Zhao, Y.; Sun, X.; Gu, X. Effect of microbial-cemented on mechanical properties of iron tailings backfill and its mechanism analysis. Constr. Build. Mater. 2021, 318, 126001. [Google Scholar] [CrossRef]
  27. Somarathna, H.; Raman, S.; Mohotti, D.; Mutalib, A.; Badri, K. The use of polyurethane for structural and infrastructural engineering applications: A state-of-the-art review. Constr. Build. Mater. 2018, 190, 995–1014. [Google Scholar] [CrossRef]
  28. Xiao, Y.; Liu, H.; Desai, C.S. New Method for Improvement of Rockfill Material with Polyurethane Foam Adhesive. J. Geotech. Geoenviron. Eng. 2015, 141, 02814003. [Google Scholar] [CrossRef]
  29. Ma, W.; Zhao, Z.; Guo, S.; Zhao, Y.; Wu, Z.; Yang, C. Performance Evaluation of the Polyurethane-Based Composites Prepared with Recycled Polymer Concrete Aggregate. Materials 2020, 13, 616. [Google Scholar] [CrossRef] [Green Version]
  30. Buzzi, O.; Fityus, S.; Sloan, S. Use of expanding polyurethane resin to remediate expansive soil foundations. Can. Geotech. J. 2010, 47, 623–634. [Google Scholar] [CrossRef] [Green Version]
  31. Buzzi, O.; Fityus, S.; Sasaki, Y.; Sloan, S. Structure and properties of expanding polyurethane foam in the context of foundation remediation in expansive soil. Mech. Mater. 2008, 40, 1012–1021. [Google Scholar] [CrossRef]
  32. Ma, Q.; Chen, J.-F.; Xiao, H.-L.; Pan, Y.-T.; Song, Z.-N. Effect of polyurethane foam adhesive on the static mechanical properties of municipal solid waste incineration bottom ash (IBA). Constr. Build. Mater. 2022, 325, 126460. [Google Scholar] [CrossRef]
  33. Chen, Q.; Yu, R.; Li, Y.; Tao, G.; Nimbalkar, S. Cyclic stress-strain characteristics of calcareous sand improved by polyurethane foam adhesive. Transp. Geotech. 2021, 31, 100640. [Google Scholar] [CrossRef]
  34. Lee, S.H.; Lee, S.J.; Park, J.G.; Choi, Y.-T. An experimental study on the characteristics of polyurethane-mixed coarse aggregates by large-scale triaxial test. Constr. Build. Mater. 2017, 145, 117–125. [Google Scholar] [CrossRef]
  35. ASTM D2487-06; Standard Practice for Classification of Soils for Engineering Purposes (Unified Soil Classification System). ASTM: West Conshohocken, PA, USA, 2006.
  36. Infante, D.J.U.; Martinez, G.M.A.; Arrua, P.A.; Eberhardt, M. Shear Strength Behavior of Different Geosynthetic Reinforced Soil Structure from Direct Shear Test. Int. J. Geosynth. Ground Eng. 2016, 2, 17. [Google Scholar] [CrossRef] [Green Version]
Figure 1. Grain size distribution of CDW.
Sustainability 14 08180 g001
Figure 2. The composition of polyurethane foam adhesive.
Sustainability 14 08180 g002
Figure 3. ShearTrac III large-scale direct shear instrument. (a) Control panel, (b) Soil sample room.
Sustainability 14 08180 g003
Figure 4. SU8010 high resolution field emission scanning electron microscope.
Sustainability 14 08180 g004
Figure 5. Shear stress-shear displacement curves of CDW with different polyurethane content. (a) Polyurethane content is 0%, (b) Polyurethane content is 1.5%, (c) Polyurethane content is 3.0%, (d) Polyurethane content is 4.5%, (e) Polyurethane content is 6.0%.
Sustainability 14 08180 g005
Figure 6. Shear stress-shear displacement curves of CDW under different normal forces. (a) The vertical load is 30 kPa, (b) The vertical load is 60 kPa, (c) The vertical load is 90 kPa.
Sustainability 14 08180 g006
Figure 7. Effect of polyurethane content on the peak shear stress of CDW.
Sustainability 14 08180 g007
Figure 8. The increase ratio of the peak shear stress.
Sustainability 14 08180 g008
Figure 9. Stress-strain curves under different shear rates.
Sustainability 14 08180 g009
Figure 10. Effect of polyurethane content on the development of the cohesion of CDW.
Sustainability 14 08180 g010
Figure 11. Effect of polyurethane content on the development of the internal friction angle of CDW.
Sustainability 14 08180 g011
Figure 12. CBR values (unsoaked and 4-day soaked) for each polyurethane content.
Sustainability 14 08180 g012
Figure 13. Particle morphology of CDW with different polyurethane contents. (a) Polyurethane content is 0%, (b) Polyurethane content is 1.5%, (c) Polyurethane content is 3%, (d) Polyurethane content is 4.5%, (e) Polyurethane content is 6%.
Sustainability 14 08180 g013
Table 1. Grading coefficients of samples.
Test TypeCharacteristic Particle Size (mm)Grading Parameters
D10D30D60CuCc
Large-scale direct shear test1.165.2113.1211.311.78
CBR test0.551.94.58.181.46
Table 2. Test scheme.
Scheme TypesPolyurethane Content (%)Vertical Load (kPa)Shear Rate (mm/min)
A030/60/901
1.5
3
4.5
6
B6300.5
1
2
5
Table 3. The improvement ratios of peak shear stresses at different vertical loads.
Polyurethane Content (%)Peak Shear Stress (kPa)/Increase Ratio (%)
30 kPa60 kPa90 kPa
049.1/091.3/0136.2/0
1.561.0/24.2107.3/17.5154.6/13.5
376.9/56.6 124.8/36.7171.5/25.9
4.5109.3/122.6157.8/72.8203.9/67.7
6145.4/196.1 193.1/111.5242.6/78.1
Publisher’s Note: MDPI stays neutral with regard to jurisdictional claims in published maps and institutional affiliations.

