Article

Behavior Investigation of Necking Pile with Caps Assisted with Transparent Soil Technology

1
College of Architectural Engineering, Sanming University, Sanming 365004, China
2
Key Laboratory for Engineering Material & Structure Reinforcement of Fujian Province, Sanming 365004, China
3
School of Civil Engineering, Henan University of Technology, Zhengzhou 450001, China
4
China Construction Seventh Engineering Division. Co., Ltd., Zhengzhou 450004, China
*
Author to whom correspondence should be addressed.
Sustainability 2022, 14(14), 8681; https://doi.org/10.3390/su14148681
Submission received: 4 June 2022 / Revised: 12 July 2022 / Accepted: 13 July 2022 / Published: 15 July 2022

Abstract

:
Pile easily develops necking defects during construction, which can limit the exertion of shaft resistance, resulting in reducing ultimate bearing capacity and creating potential safety hazards to projects. Based on transparent soil technology, this paper took the necking located in the middle part of pile shafts as an example and carried out vertical loading experiments on one intact pile and nine necking piles with caps. Then, the influences of necking length and diameter on the vertical bearing capacity were studied. The speckle field of the soil around piles was processed using the MatPIV program to investigate soil displacement. Through comparison and analysis with the intact pile, the reasons for the reduction in bearing capacity were obtained. The results show that the bearing capacity of the piles is seriously damaged by the necking. When the necking diameter is 4 mm and the necking length is 20 mm, the loss of vertical bearing capacity was 26.6%. The vertical bearing capacity decreases with the increase in necking length or the decrease in necking diameter. Pile necking makes a significant contribution to the displacement of soil around the cap. Inclined downward displacement of soil occurs near necking, which reduces the relative displacement between pile and soil and leads to the loss of pile resistance. For the necking with a large size, the soil displacement at the necking and around the pile cap is connected, which causes the displacement range of the soil under the pile cap to increase, resulting in a weakening of the exertion of shaft resistance. Subsequently, the vertical bearing capacity of piles is reduced.

1. Introduction

Pile foundation is widely used in high-rise buildings, granaries and wharfs due to its good integrity, ability to effectively improve foundation strength and convenient construction. However, due to various uncertainties, such as construction technology, building materials, complex hydrogeological conditions, and so on, defects, such as necking, mud inclusion, pile breaking, and so on, may be detected during construction. Defective piles can seriously affect the bearing performance of pile foundation [1]. Necking is one of the most harmful defects to affect the bearing performance of piles. Improper treatment will create significant potential safety hazards and economic losses to the project [2,3]. Therefore, it is of great significance to clarify the bearing performance of defective pile for the reasonable design and treatment of pile foundation. The pile–soil interaction is the key to studying the bearing performance of necking pile.
To ensure the quality of foundation piles, it is necessary to test the pile integrity [4]. Many investigators have studied the detection and identification of defective piles. Samman et al. [5], Iskander et al. [6] and Li et al. [7] studied various nondestructive testing methods, and found that: (1) when the defect area is less than 15% of the pile cross section, it cannot be accurately detected; (2) if the defect is in the shallow pile shaft and the size is large, the upstream wave reflected at the defect is superimposed with the downward wave generated by the impact load, resulting in inaccurate detection results. To solve the above problems, Chai et al. [8] studied the propagation law of waves in piles and proposed that the reflected wave at the pile end can be regarded as a plane wave; when the reflected signal at the pile end was reflected from the pile top and propagated downward again, it could be used to detect the defects in shallow pile shaft. Lee et al. [9] proposed a method for nondestructive detection of diameter shrinkage defects of bored pile by electromagnetic wave, which proved that electromagnetic waves can effectively detect diameter-shrinkage defects at different positions of bored pile. Ni et al. [10] used continuous wavelet transform technology to determine the position of pile length and pile defects. Farenyuk et al. [11] obtained information about the stress–strain state of pile using low-frequency pulse waves, which not only determined the length and location of pile defects, but also determined the type and geometric structure of the pile defects. Based on the winkle model of pile side soil, Gao et al. [12] studied the influence of defect modulus on pile top velocity response. Schilder et al. [13] invented a device that arranges a Fabry–Perot interferometer sensor and fiber-Bragg-grating sensor outside a pile shaft to detect pile integrity. Based on the above research, Xu et al. [14] proposed a novel device to detect the thickness of toe debris: it was proven that the proposed device is not affected by the properties of toe debris, and can accurately detect the thickness of toe debris, using one-dimensional wave theory and case study.
Regarding the bearing performance of defective piles, Wang et al. [15,16] studied the vertical-bearing characteristics of intact piles and defective piles through model tests and found that the defect position had a significant influence on the vertical-bearing-capacity loss of piles. Neto et al. [17] studied the settlement and bearing capacity of necking pile, broken pile and expansion pile in composite foundation. It was pointed out that, when a pile shaft is defective, the bearing capacity of the composite foundation should be tested, the settlement and stability should be checked, and the pile should be added according to the principle of composite pile foundation, if necessary. Poulos et al. [18] systematically analyzed the influences of geological defects and pile defects on the bearing performance of pile foundation according to accidents caused by pile defects in engineering. Yan et al. [19] used a centrifugal model to study the lateral bearing performance of a wharf supported by defective pile on a slope and used numerical simulation to analyze the failure mode, horizontal behavior, bending displacement and bending moment of defective pile. Nadeem et al. [20] regarded the bending of pile as a quality defect. Finite element analysis showed that the greater the bending degree of pile, the more serious the bearing capacity loss and the more obvious the deformation of pile. Necking is one of the common defects in pile foundation. Through PLAXIS software, Petek et al. [21] found that the closer the defect position is to the pile top, the more serious the bearing capacity loss is, and the maximum bearing capacity is reduced by 33% and 53%, respectively. Albuquerque et al. [22] studied the behavior of necking pile using field tests and numerical simulation. It was found that the pile failure time was earlier than expected, and the bearing capacity was reduced by nearly 50%. Due to the existence of necking, the microscopic motion mechanism, internal-deformation characteristics and load-transfer mechanism of soil particles around piles subjected to vertical load are complex. Therefore, it is necessary to clarify the interaction between necking pile and soil under vertical load and the bearing performance of necking pile.
However, the traditional geotechnical test embeds the sensor into the soil, which can cause the test results to be influenced by the stiffness, size and sensor implantation of the sensor. Therefore, it is impossible to observe visually the movement of soil particles around defective pile [23,24]. Transparent soil technology can solve the above problems, and has enabled the comprehensive observation of the motion characteristics of internal soil particles [25]. Ding et al. [26] used a transparent soil–rock mixture model test to compare the properties of artificial, transparent soil and sand. Li et al. [27] proposed a 3D printing technology of transparent soil particles based on the contour rotation interpolation method, 3D printing technology and transparent soil technology. Kong et al. [28] studied the influence of pile displacement on soil under inclined uplift force by using a transparent soil test. Xiang et al. [29] studied the influence of geotechnical strength and buried depth on deformation and failure mechanisms through a transparent soil test. Accordingly, transparent soil technology can be used to clearly observe the displacement of the soil around a pile shaft and overcome the interference of the traditional geotechnical tests on results.
Based on the above research results, our team has also made preliminary progress in reducing pile. Yang et al. [30] studied the influence of necking at different positions on the bearing capacity of single pile. Xu et al. [31] studied the influence of shallow necking on the vertical bearing capacity of single pile with a cap. The results show that: The soils at the top, side, and near the end of a pile were mainly influenced by shallow necking, middle necking, and deep necking, respectively. Therefore, in order to study the influence of necking on side friction, in this paper, the middle necking pile is studied. Through transparent soil technology, an intact capped pile and nine capped necking piles were tested. The load-settlement curves are used to study the characteristic of bearing capacity. MatPIV software is employed to process the speckle field of soil displacement, then the characteristic of soil displacement is analyzed systematically. Subsequently, in this paper, the reason for the change in the bearing capacity of reduced-diameter pile is explained through the change law of side friction.

2. Experimental Work

2.1. Materials and Model Pile

The transparent soil used in the experiment was prepared by fused silica sand and pore fluid. At 20 °C, the refractive index of fused silica sand and pore fluid is 1.4582. Fused quartz sand was used as the soil particle skeleton, its main component is SiO2, and its purity is 99%. Particles with the sizes of 0.5 mm–1.0 mm and 1.0 mm–2.0 mm were mixed according to the ratio of 2:3. The size distributions of fused quartz sand and standard sand [32] are shown in Figure 1. Pore fluid was prepared by mixing n-dodecane and 90# white oil based on the volume ratio of 1:8.8. The parameters of transparent soil are shown in Table 1, and the transparent soil sample is shown in Figure 2 [31]. The mechanical properties of transparent soil are similar to that of natural sand, and it can be used as a substitute for simulating natural sand [33,34,35].
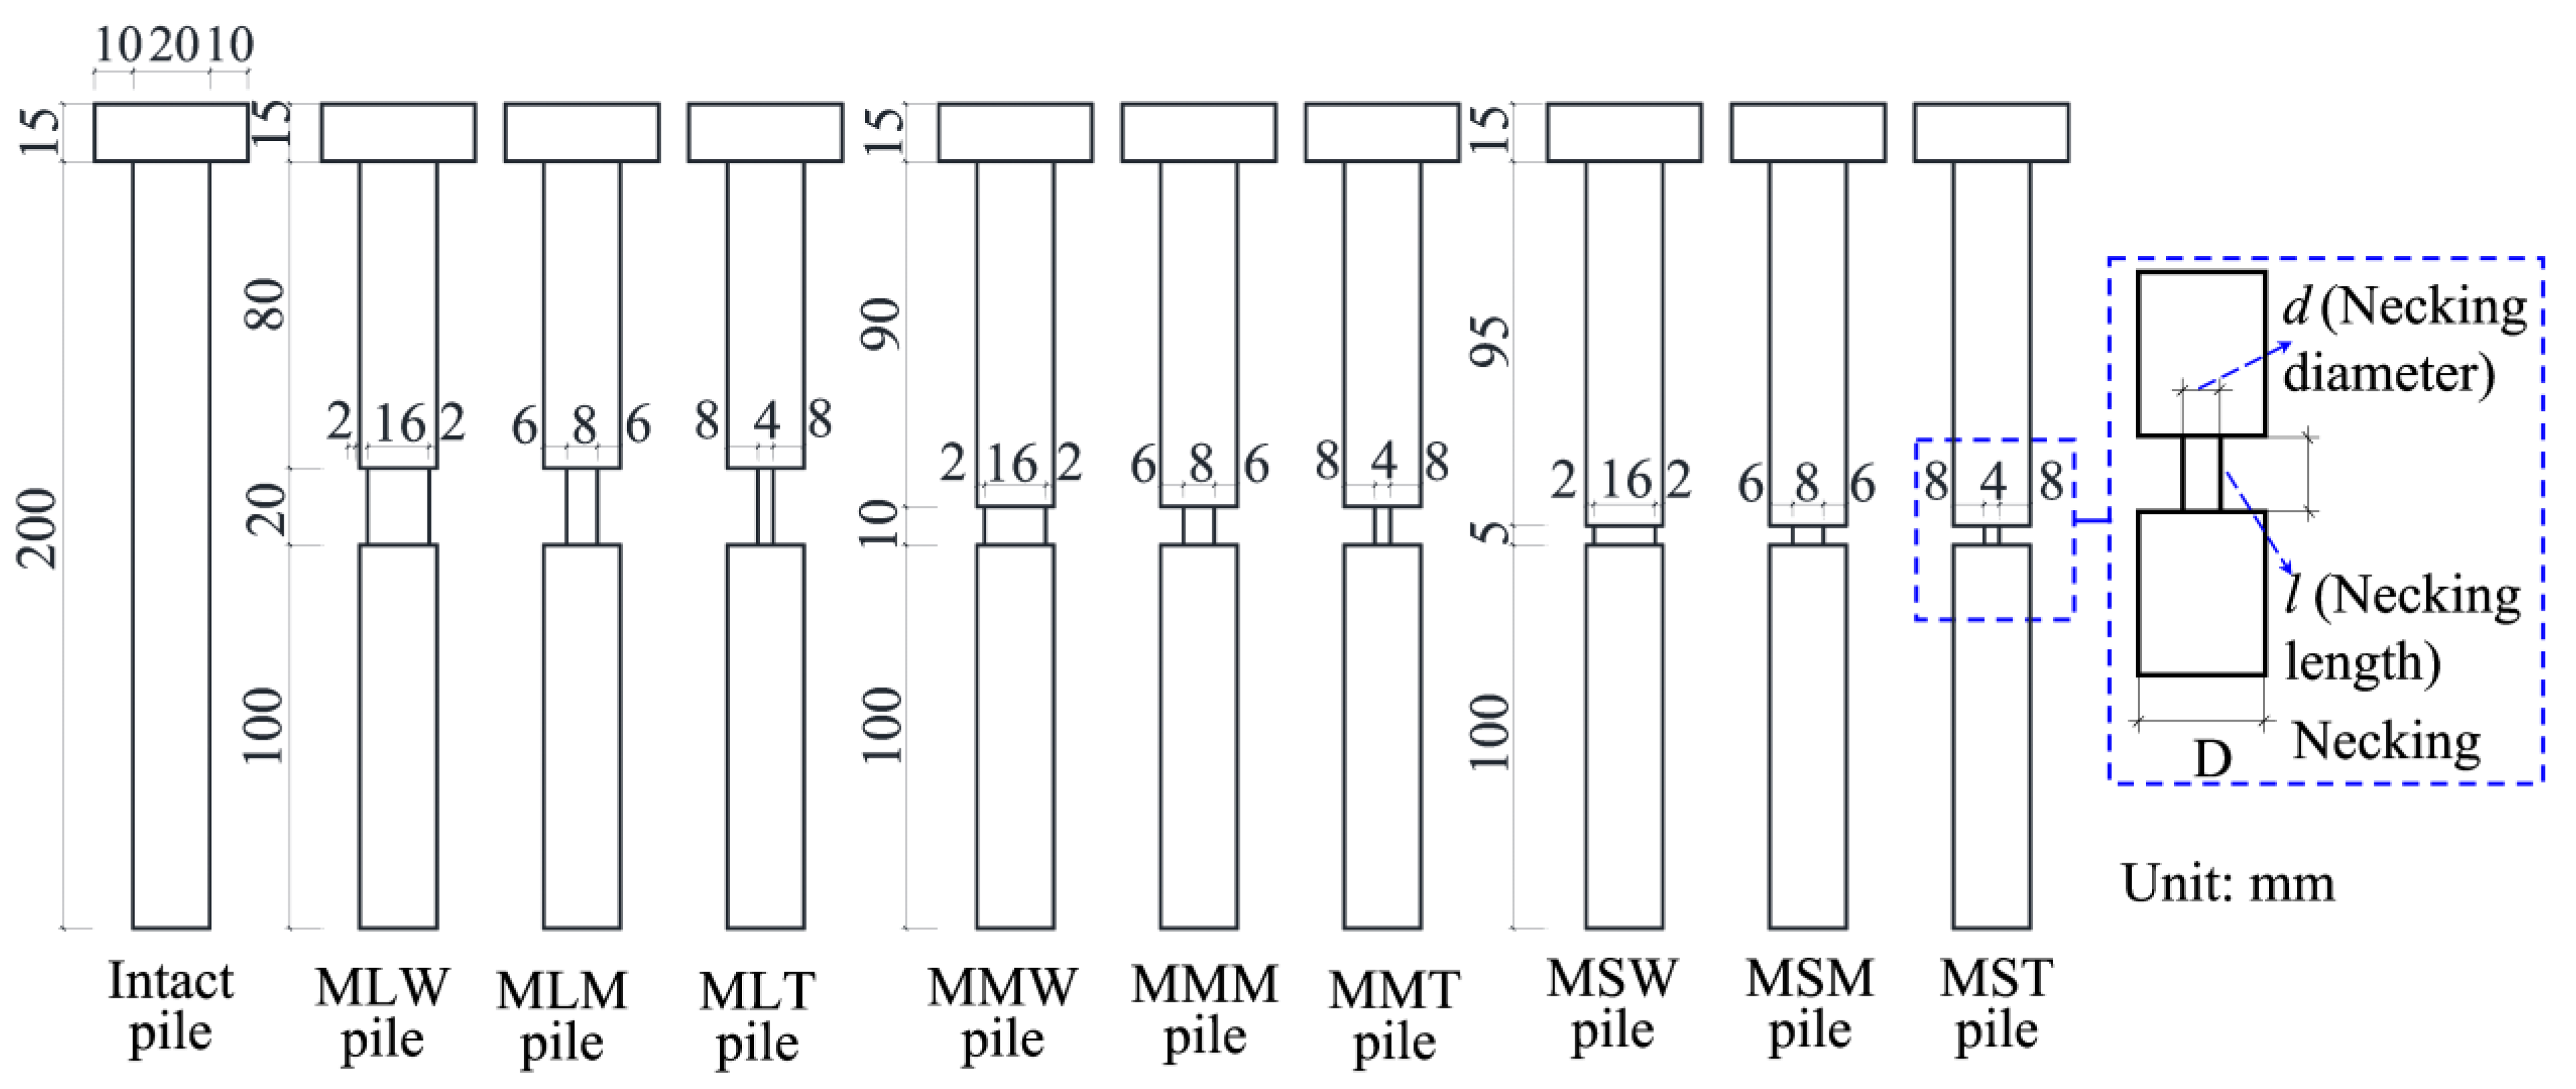
The model piles were made of plexiglass. According to similarity theory [36], the pile parameters studied in reference [37] were reduced to the ratio of 1:50, and, finally, the parameters of the pile studied in this test were obtained. To weaken the reflection of light and consider the influence of friction, sandpaper was used to polish the model pile shaft, and the friction coefficient of the model pile was measured by the friction angle method [38]. The polish was completed when the friction coefficient was between 0.4–0.5 [38]. The necking and model pile are shown in Figure 3.

2.2. Experimental Set-Up

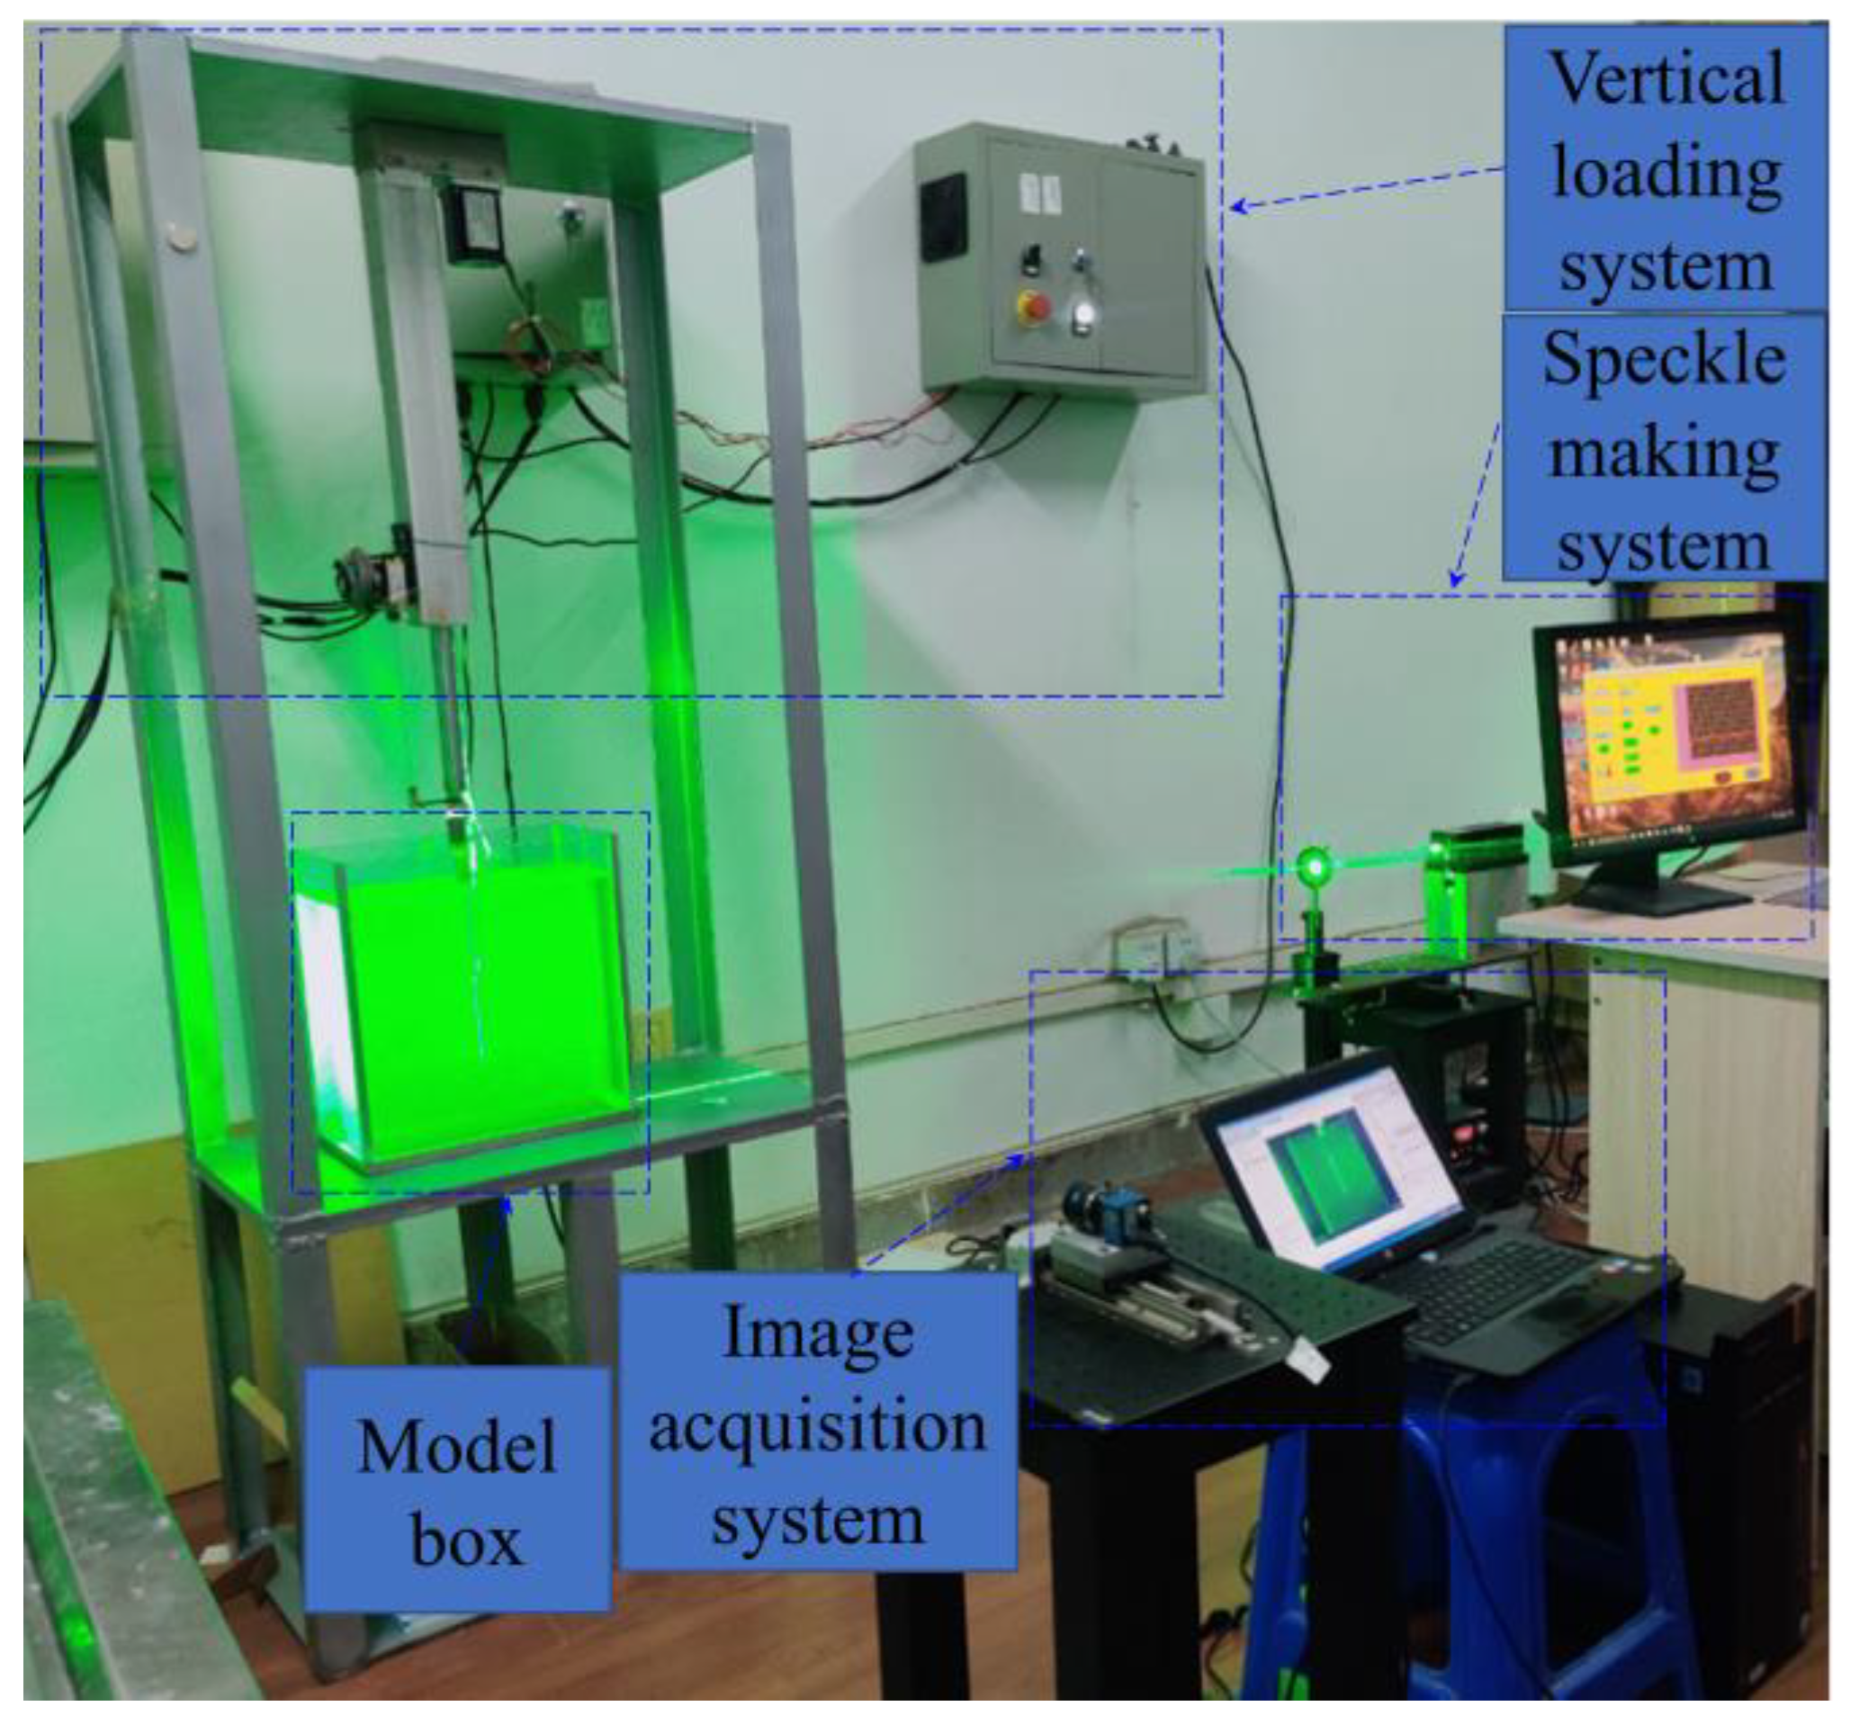
The experiment system was composed of vertical loading system, speckle making system, model tank and image-acquisition system, as shown in Figure 4 [39]. The vertical loading system was composed of stepping motor with load range of 0–500 n, pressure sensor with accuracy of 0.3 N, displacement sensor with range of 0–600 mm and accuracy of 0.001 mm. The speckle-making system included an intensity-adjustable laser transmitter (MW-GX-532/2000 mW) and an optical prism. The image-acquisition subsystem included industrial CCD camera and camera-acquisition-control computer. The model tank was made of toughened glass. To avoid the influence of boundary effect, Massarsch et al. [40] considered the influence range of pile penetration on the surrounding soil. Accordingly, a model box with a size of 320 mm × 180 mm × 350 mm (length × width × height) was selected considering the maximum size of transparent soil, and the ratios of model tank to pile diameter (L/D = 16) and the diameter of model pile to average size of soil particles (D/d50 = 47) meet the requirements of boundary effect and particle size effect [39].

2.3. Experimental Process

In order to ensure the consistency of test results, for each working condition, the quality and height of transparent soil in the model box should be controlled to ensure the same compactness of transparent soil during the test. According to the specification (jgj106-2014): this test adopted the slow load maintenance method. A total of 20 N was loaded at each step, step by step. When the settlement rate of pile top is less than 0.1 mm/h for two consecutive times, it is considered that the load of this level is stable. The settlement of pile top was recorded, photos of soil spot field were taken, and then the next step of loading was carried out. When the settlement of the pile reaches 30 mm, the load is finished [4].

2.4. Accuracy Analysis of PIV

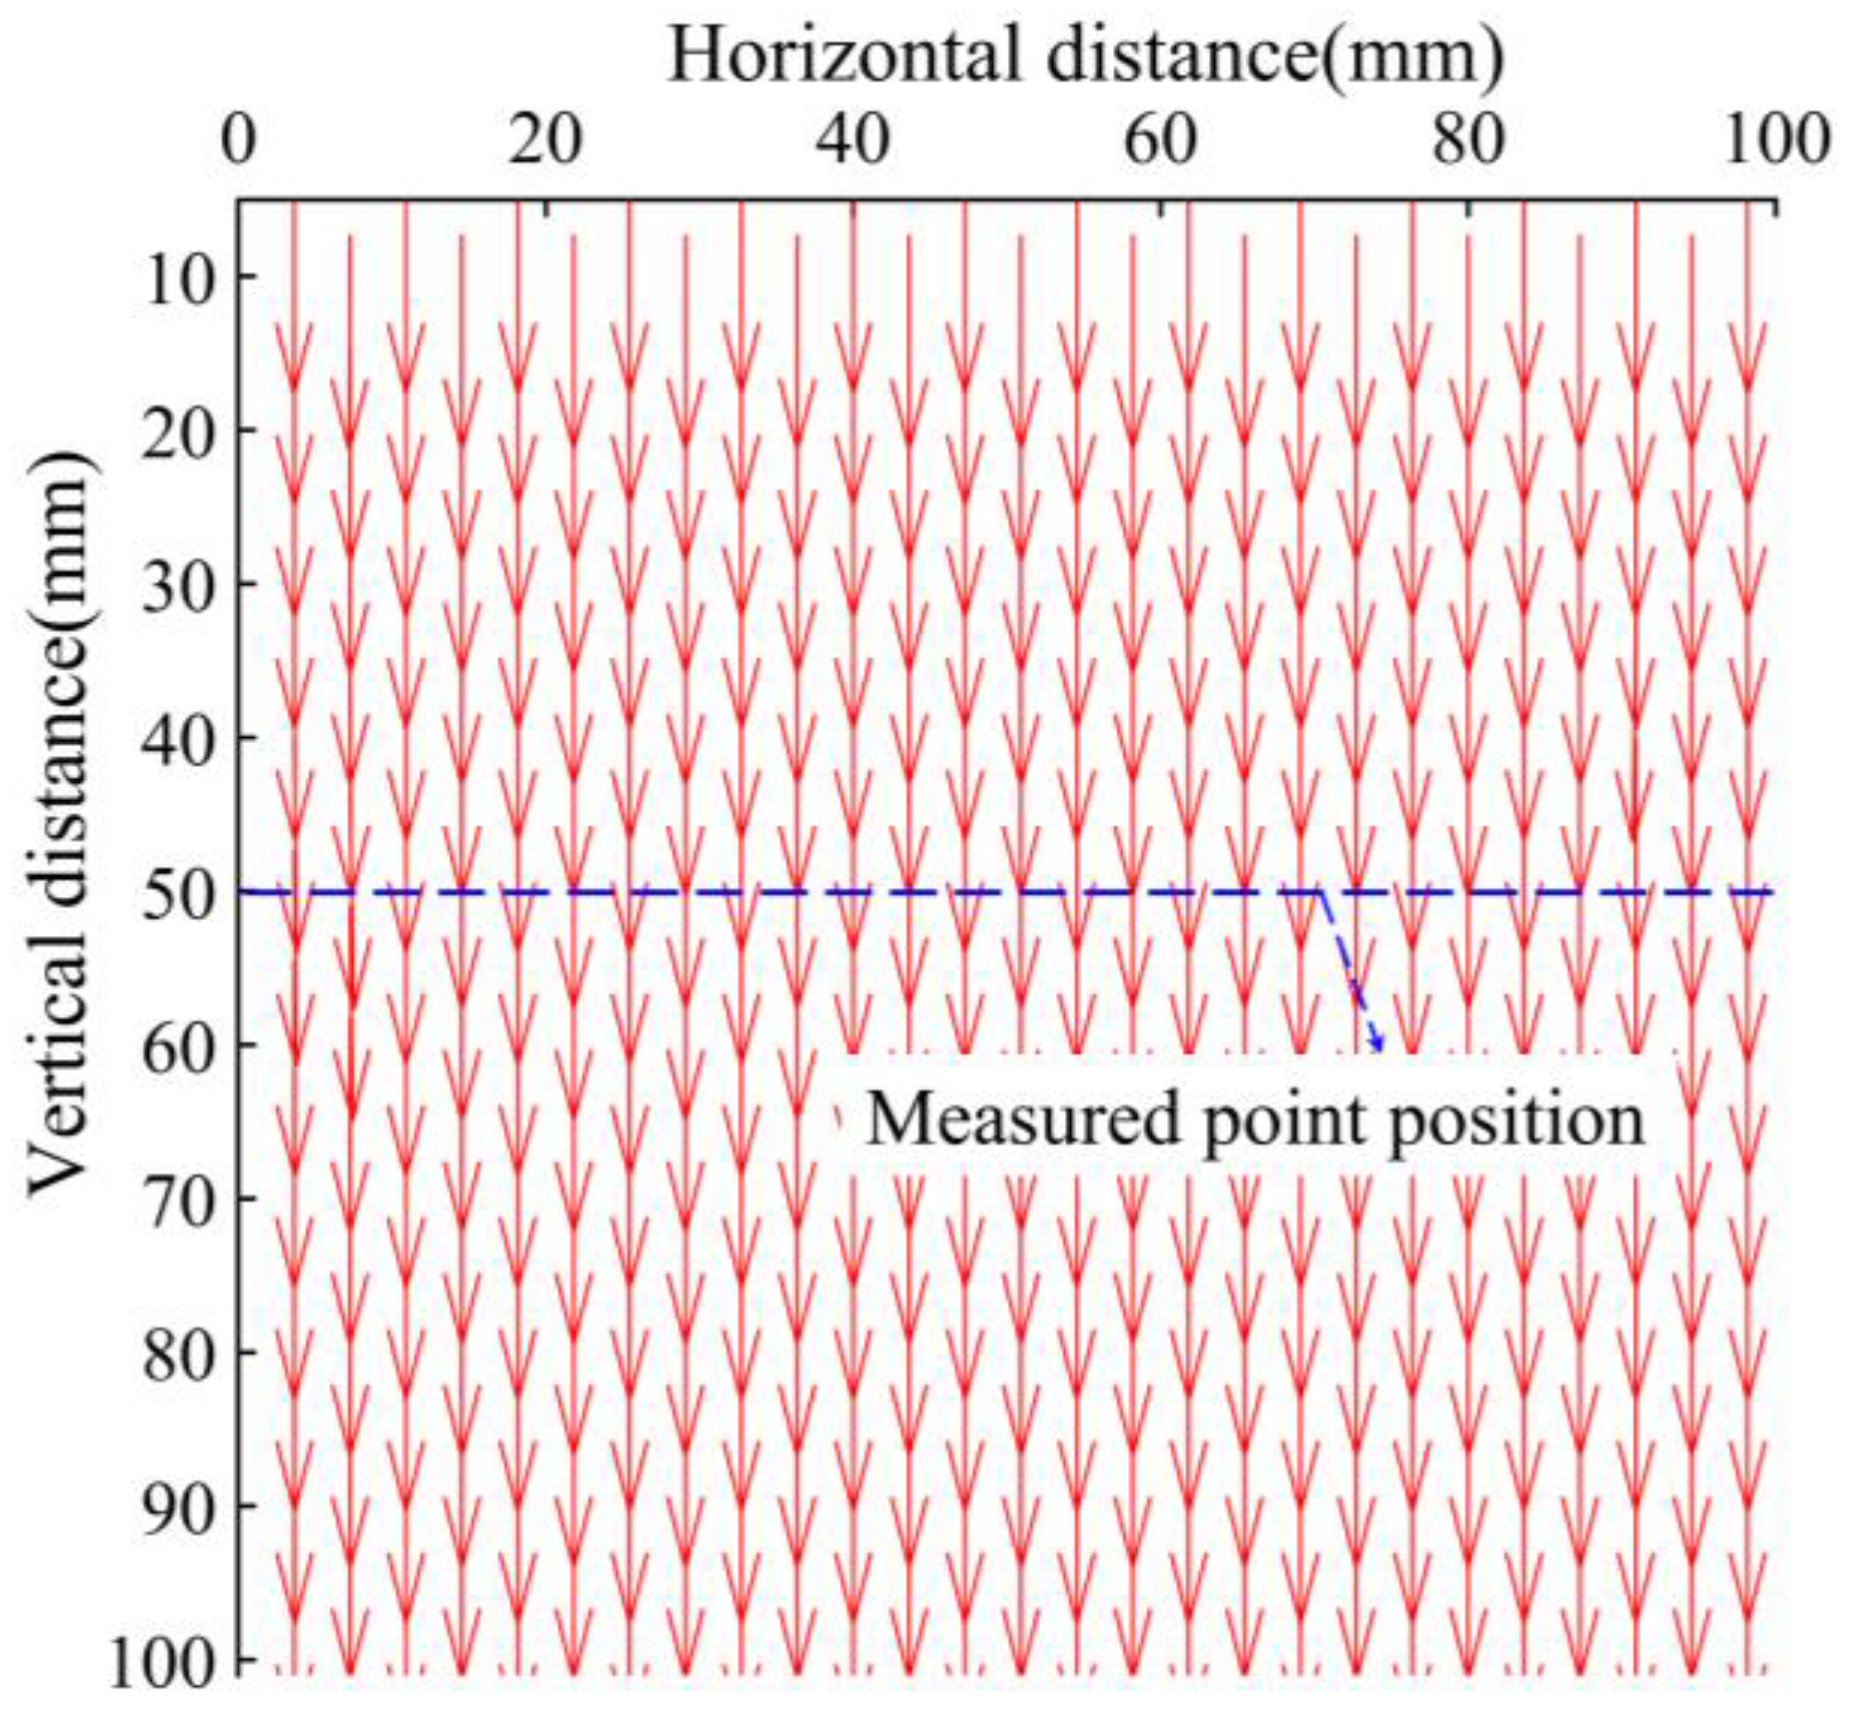
It is necessary to calibrate the accuracy of PIV image analysis. MatPIV software is an effective tool for processing the speckle field of granular particles [39]. In order to verify the accuracy of particle image velocimetry (PIV) image-analysis technology in deformation measurement, the speckle image was tested by translation. The translation test is to fix the speckle image on the loading rod of the stepping motor, control the stepping motor to move the target speckle image vertically downward at a constant rate, and use the CCD camera to record the speckle image before and after movement. The PIV program was used to analyze and calculate the two speckle images before and after movement, and the actual translation-displacement values were compared to evaluate the accuracy of the PIV program [32]. Figure 5 shows the speckle image of 100 mm × 100 mm collected in the experiment. Figure 6 is the displacement vector diagram processed by PIV after the speckle image is translated by 1.88 mm. Through the displacement vector diagram, it can be clearly seen that the speckle image was translated downward as a whole. Figure 7 shows the displacement values of 10 measuring points on the same horizontal line. It can be seen that the displacement values of the measuring points fluctuate up and down at 1.88 mm, and the error value is ±0.003 mm. The results show that the calculation accuracy of PIV algorithm based on MATLAB meets the requirements of image measurement.
The basic principle is to calculate the correlation of image gray value through computer program, and then the speed and displacement of the required special point can be obtained. According to the experiment: (1) two pictures (I1) and (I2) were taken successively according to a certain loading time sequence, (2) the pixel query window size was set as M × N, and (3) the pictures of I1 and I2 query windows were compared and calculated according to Equation (1).
R e ( s , t ) = m = 0 M 1 n = 0 N 1 [ I 1 i , j ( m , n ) I 2 i , j ( m s , n t ) ] 2 = m = 0 M 1 n = 0 N 1 I 1 i , j ( m , n ) 2 2 m = 0 M 1 n = 0 N 1 I 1 i , j ( m , n ) I 2 i , j ( m s , n t ) + m = 0 M 1 n = 0 N 1 I 2 i , j ( m s , n t ) 2
where R e ( s , t ) is the square sum of the gray difference in each store in the corresponding window of the two pictures; s is the pixel value of point lateral movement; t is the pixel value of vertical movement of point; I 1 i , j ( m , n ) is the gray value of the corresponding point (m, n) of the window at row i and column j; and I 2 i , j ( m s , n t ) is the gray value of the corresponding point (ms, nt) of the window at row i and column j.
It can be seen from Equation (1) that, after decomposition, only the intermediate term of the decomposition result is related to two pictures (I1 and I2) and becomes a mutual function R ( s , t ) .
R ( s , t ) = m = 0 M 1 n = 0 N 1 I 1 i , j ( m , n ) I 2 i , j ( m s , n t )
When the maximum value is taken in Equation (2), the corresponding values of s and t are the average displacement vectors of m and n corresponding to the windows at row I and column J in the speckle image I1. The program used in this experiment considers the correlation between images to make the image processing results more accurate.
Figure 5 shows the speckle image with 100 mm (width) × 100 mm (length) collected from model experiment. Figure 6 is the displacement vector processed by MatPIV program after the speckle image was translated by 1.88 mm. It can be clearly seen that the speckle image is translated vertically as a whole. Figure 7 shows the displacement of measured points on the same horizontal line, and it can be found that the displacement fluctuates up and down at 1.88 mm and the error is about ±0.003 mm. Accordingly, the accuracy of PIV program based on Matlab (version number: R2018a, creator: MathWorks, Natick, MA, USA) software satisfies the requirements of image measurement.

3. Results and Discussion

3.1. Vertical Bearing Capacity Analysis

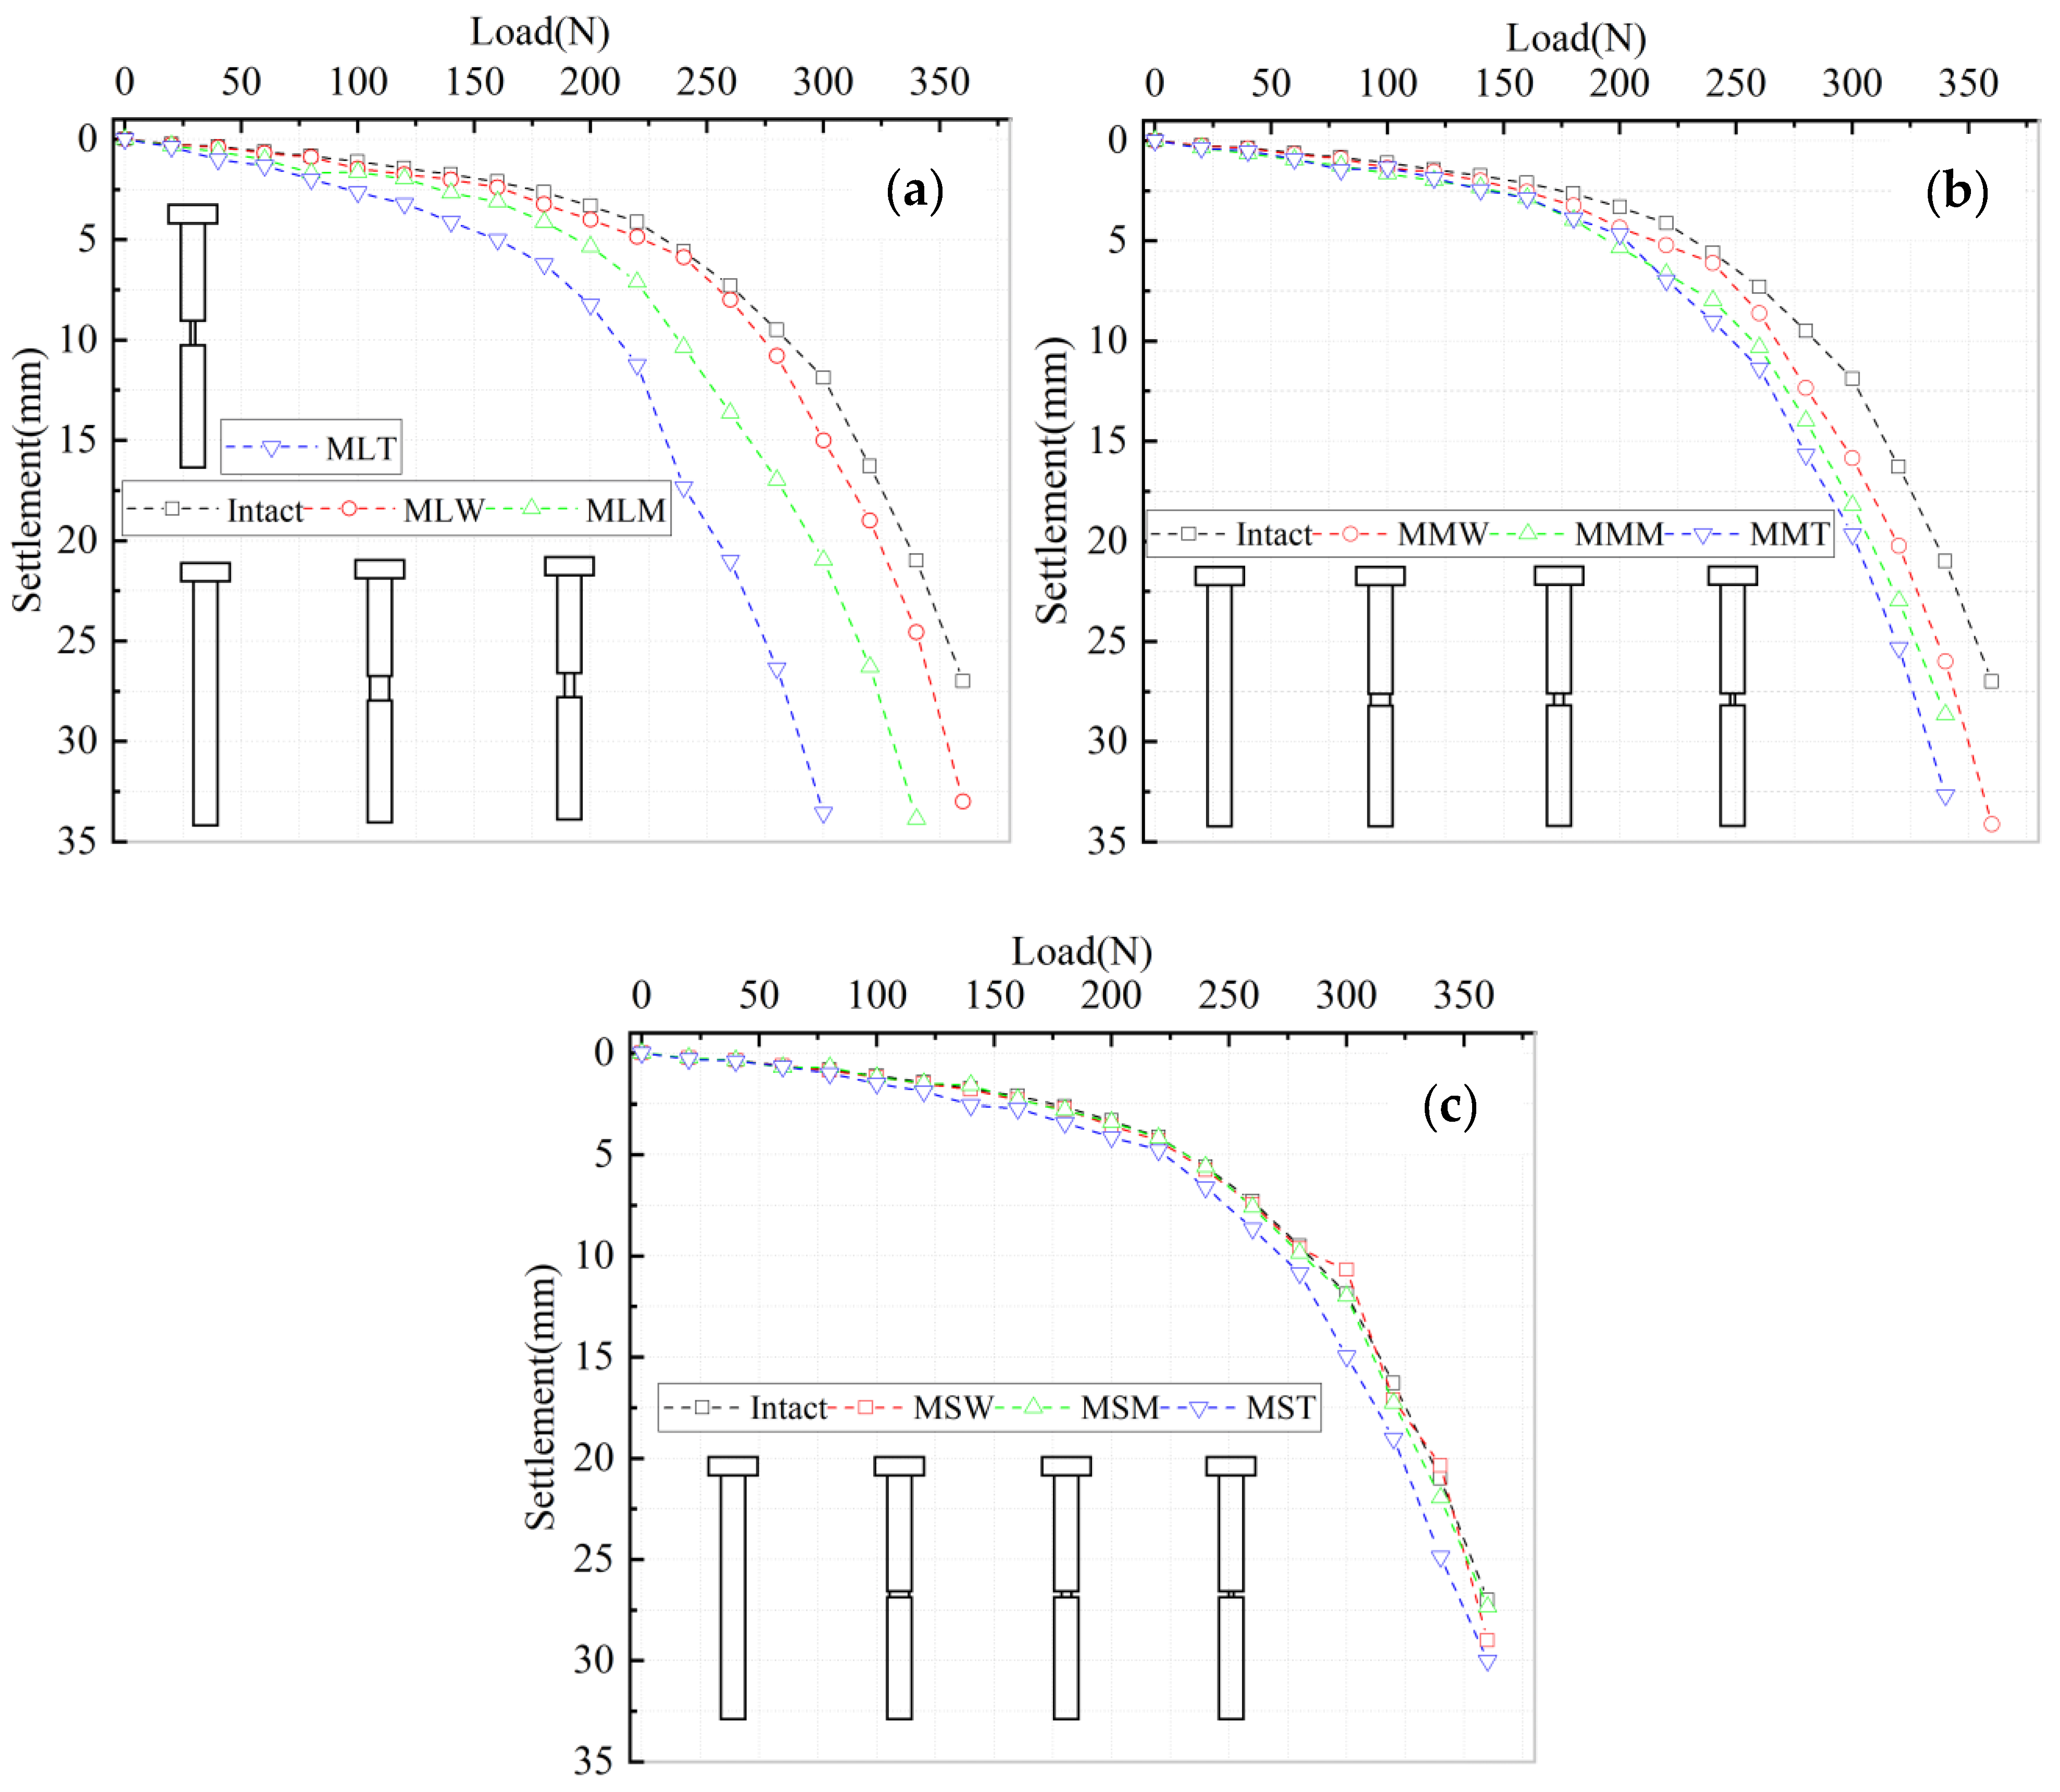
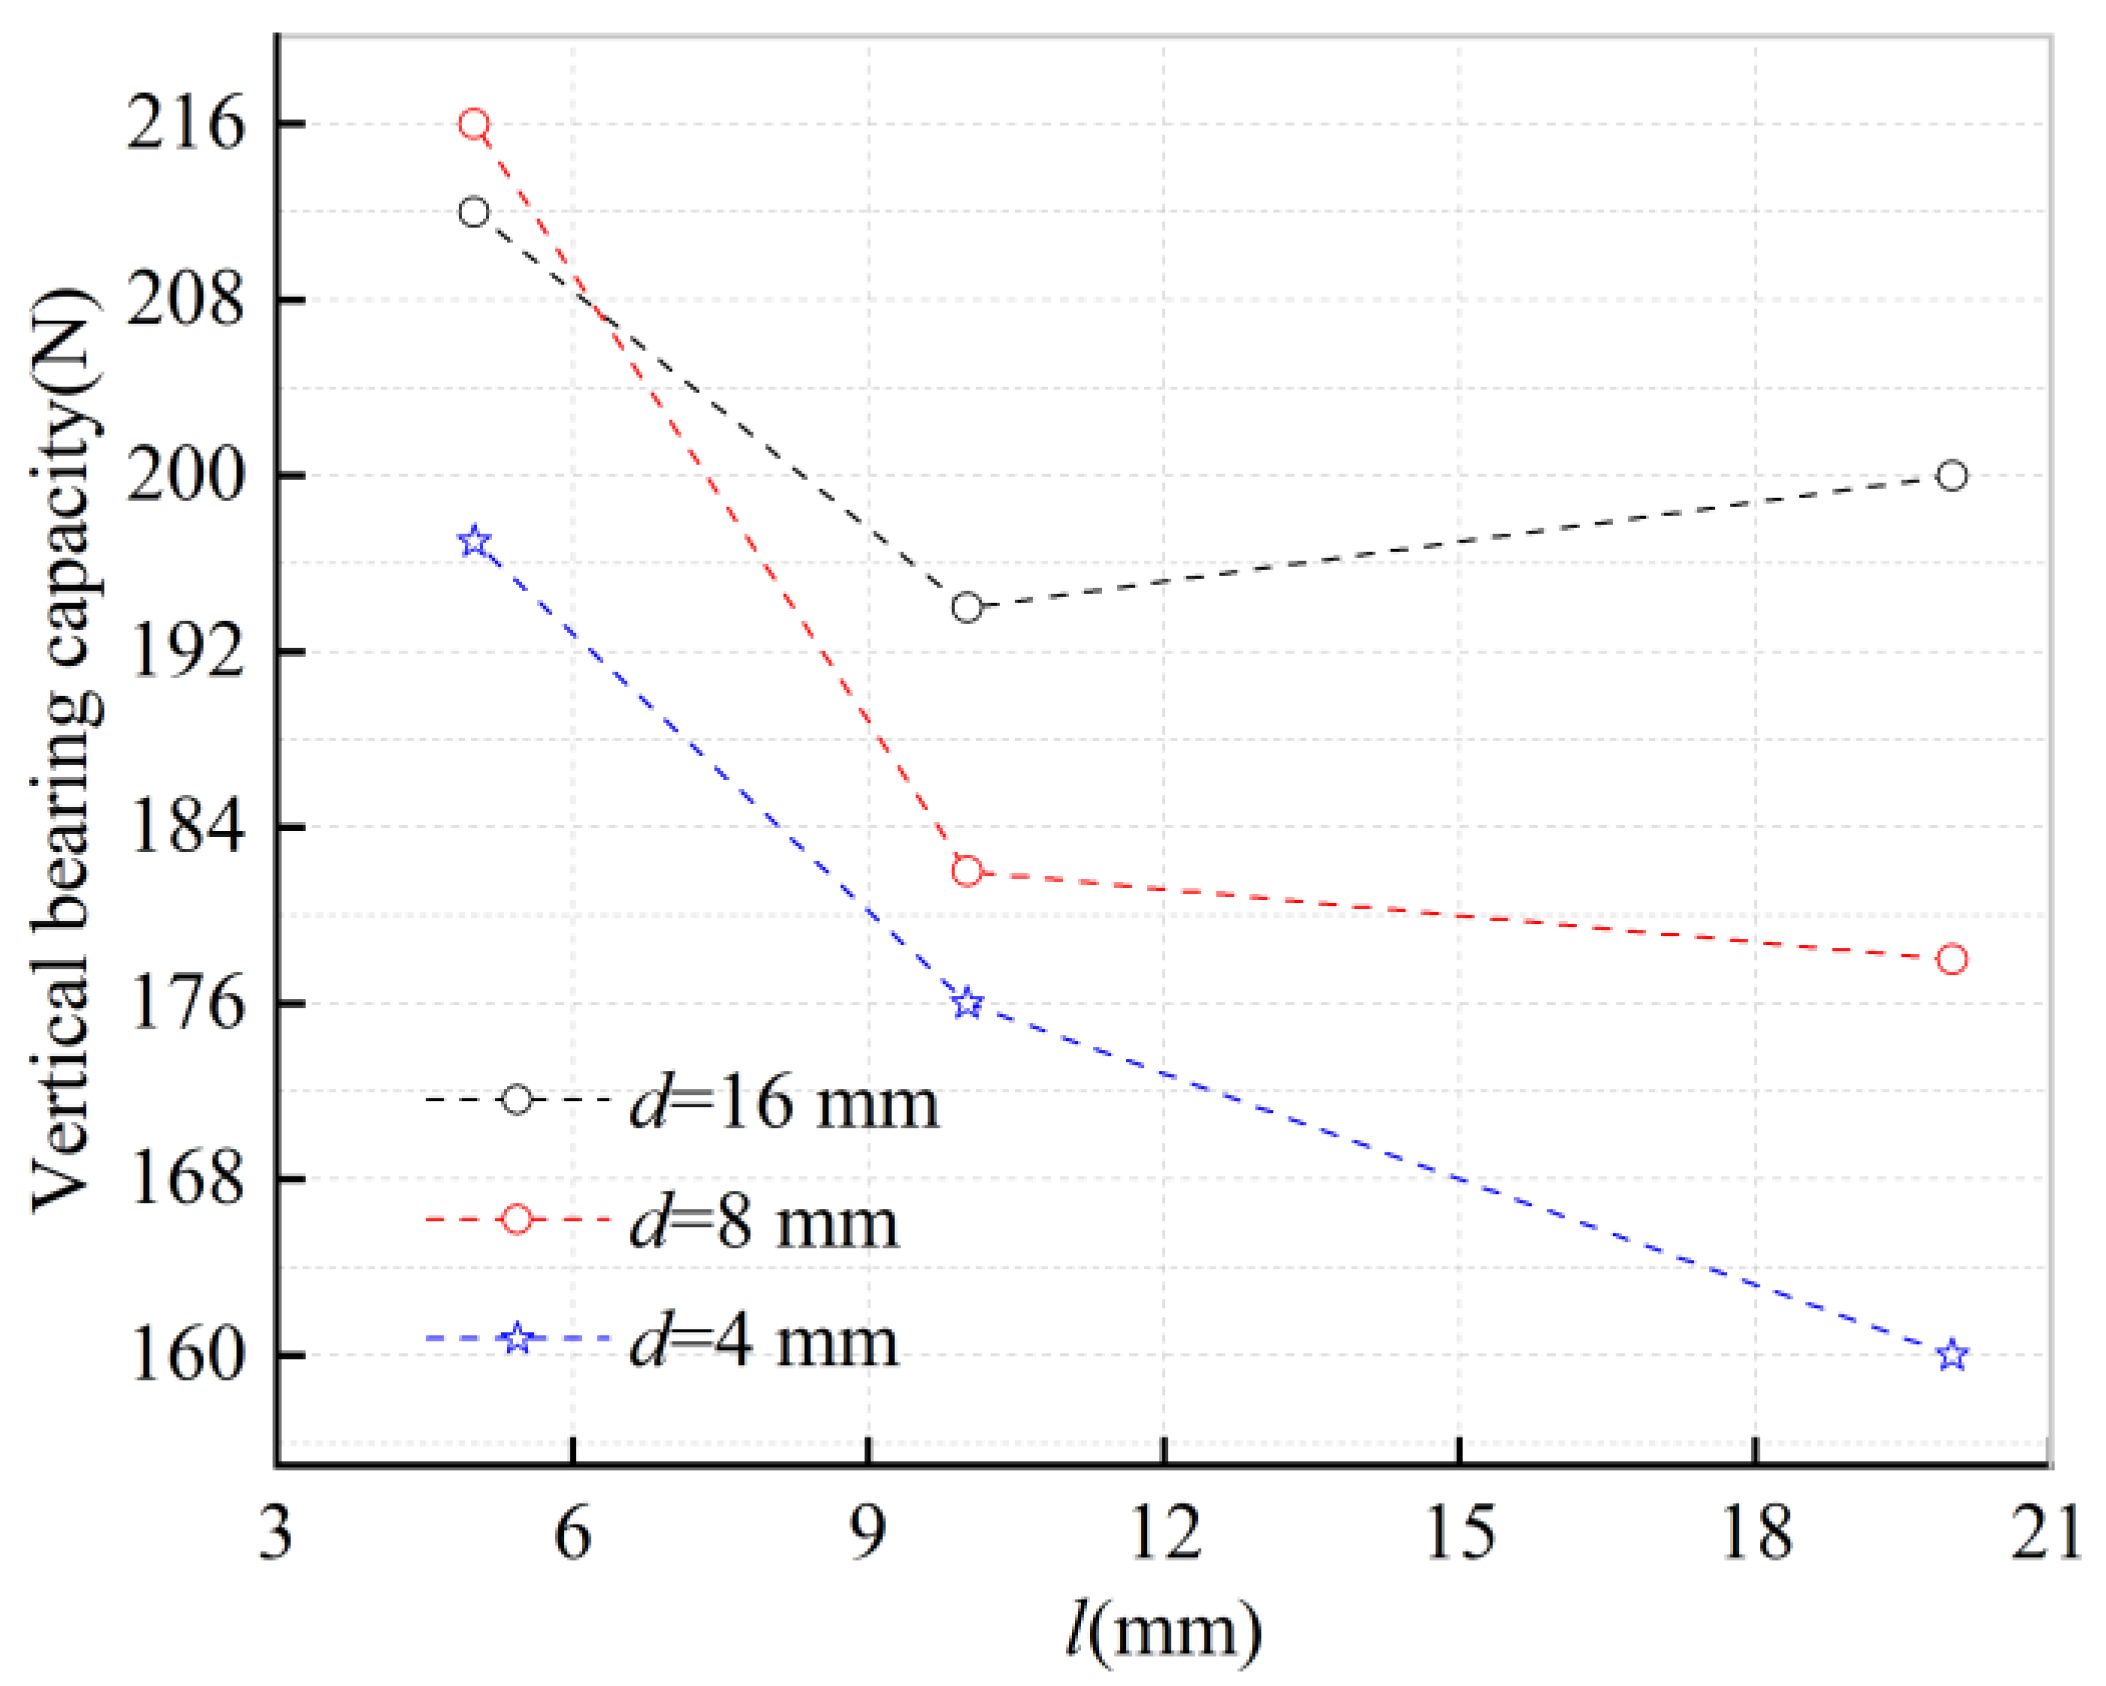
The load settlement curve was drawn according to the test results, as shown in Figure 8. According to the provisions of the code on the gentle falling curve, the load at the settlement of 4 mm was taken as the VUBC (vertical ultimate bearing capacity) [4]. According to the figure, the vertical ultimate bearing capacities of the 10 piles are 218 N, 200 N, 178 N, 160 N, 194 N, 182 N, 176 N, 212 N, 216 N and 197 N for intact pile, MLW pile, MLM pile, MLT pile, MMW pile, MMM pile, MMT pile, MSW pile, MSM pile and MST pile, respectively. Necking can weaken the bearing capacity of piles greatly. Compared with the intact pile, when the necking diameter is 4 mm and the necking length is 20 mm, the bearing capacity loss is the largest, which is 26.6%. The relationship between the VUBC and necking length is shown in Figure 9. It can be seen from that, that when the necking diameter is 16 mm, VUBC gradually decreases with the increase in necking length. When the necking diameter is 8 mm, although VUBC decreases with the increase in necking length, the loss becomes more and more insignificant. The relationship between the VUBC and necking diameter is shown in Figure 10. When the necking length is 20 mm, VUBC increases linearly with the increase in necking diameter. When the necking length is 10 mm, the rising rate decreases compared with that of when the necking length is 20 mm. As we know, pile shaft resistance is important to the VUBC of piles [41]. From the above analysis, necking can limit the exertion of pile shaft resistance; soil displacement around piles is necessary to explain why the vertical bearing capacity of necking pile changes.

3.2. Analysis of Soil Displacement around Piles

It can be seen from the above analysis that, under the action of vertical load, it is key to analyze the reasons for the change in bearing capacity to clarify the change law of soil around piles under different necking conditions. Speckle images were processed with the MatPIV program. As the vertical compression of a pile is axisymmetric, half of the displacement field data and the deformation of the soil around the pile [40] when the settlement value reached 4 mm were selected for analysis [4].
For intact pile with a cap, Massarsch et al. [40] divided the soil displacement into three zones, which are shown in Figure 11 in this study. The three areas are: zone of disturbance adjacent to the pile cap (Zone ①), zone of disturbance adjacent to the pile shaft (Zone ②), and zone of disturbance below the pile end (Zone ③). Zone ③ is divided into the compression zone (Zone ③ ⓐ) and transition zone (Zone ③ ⓑ). In the following, based on the deformation of soil around the intact pile, the soil displacement around the necking pile will be analyzed, as well as the reason why the bearing capacity changed.
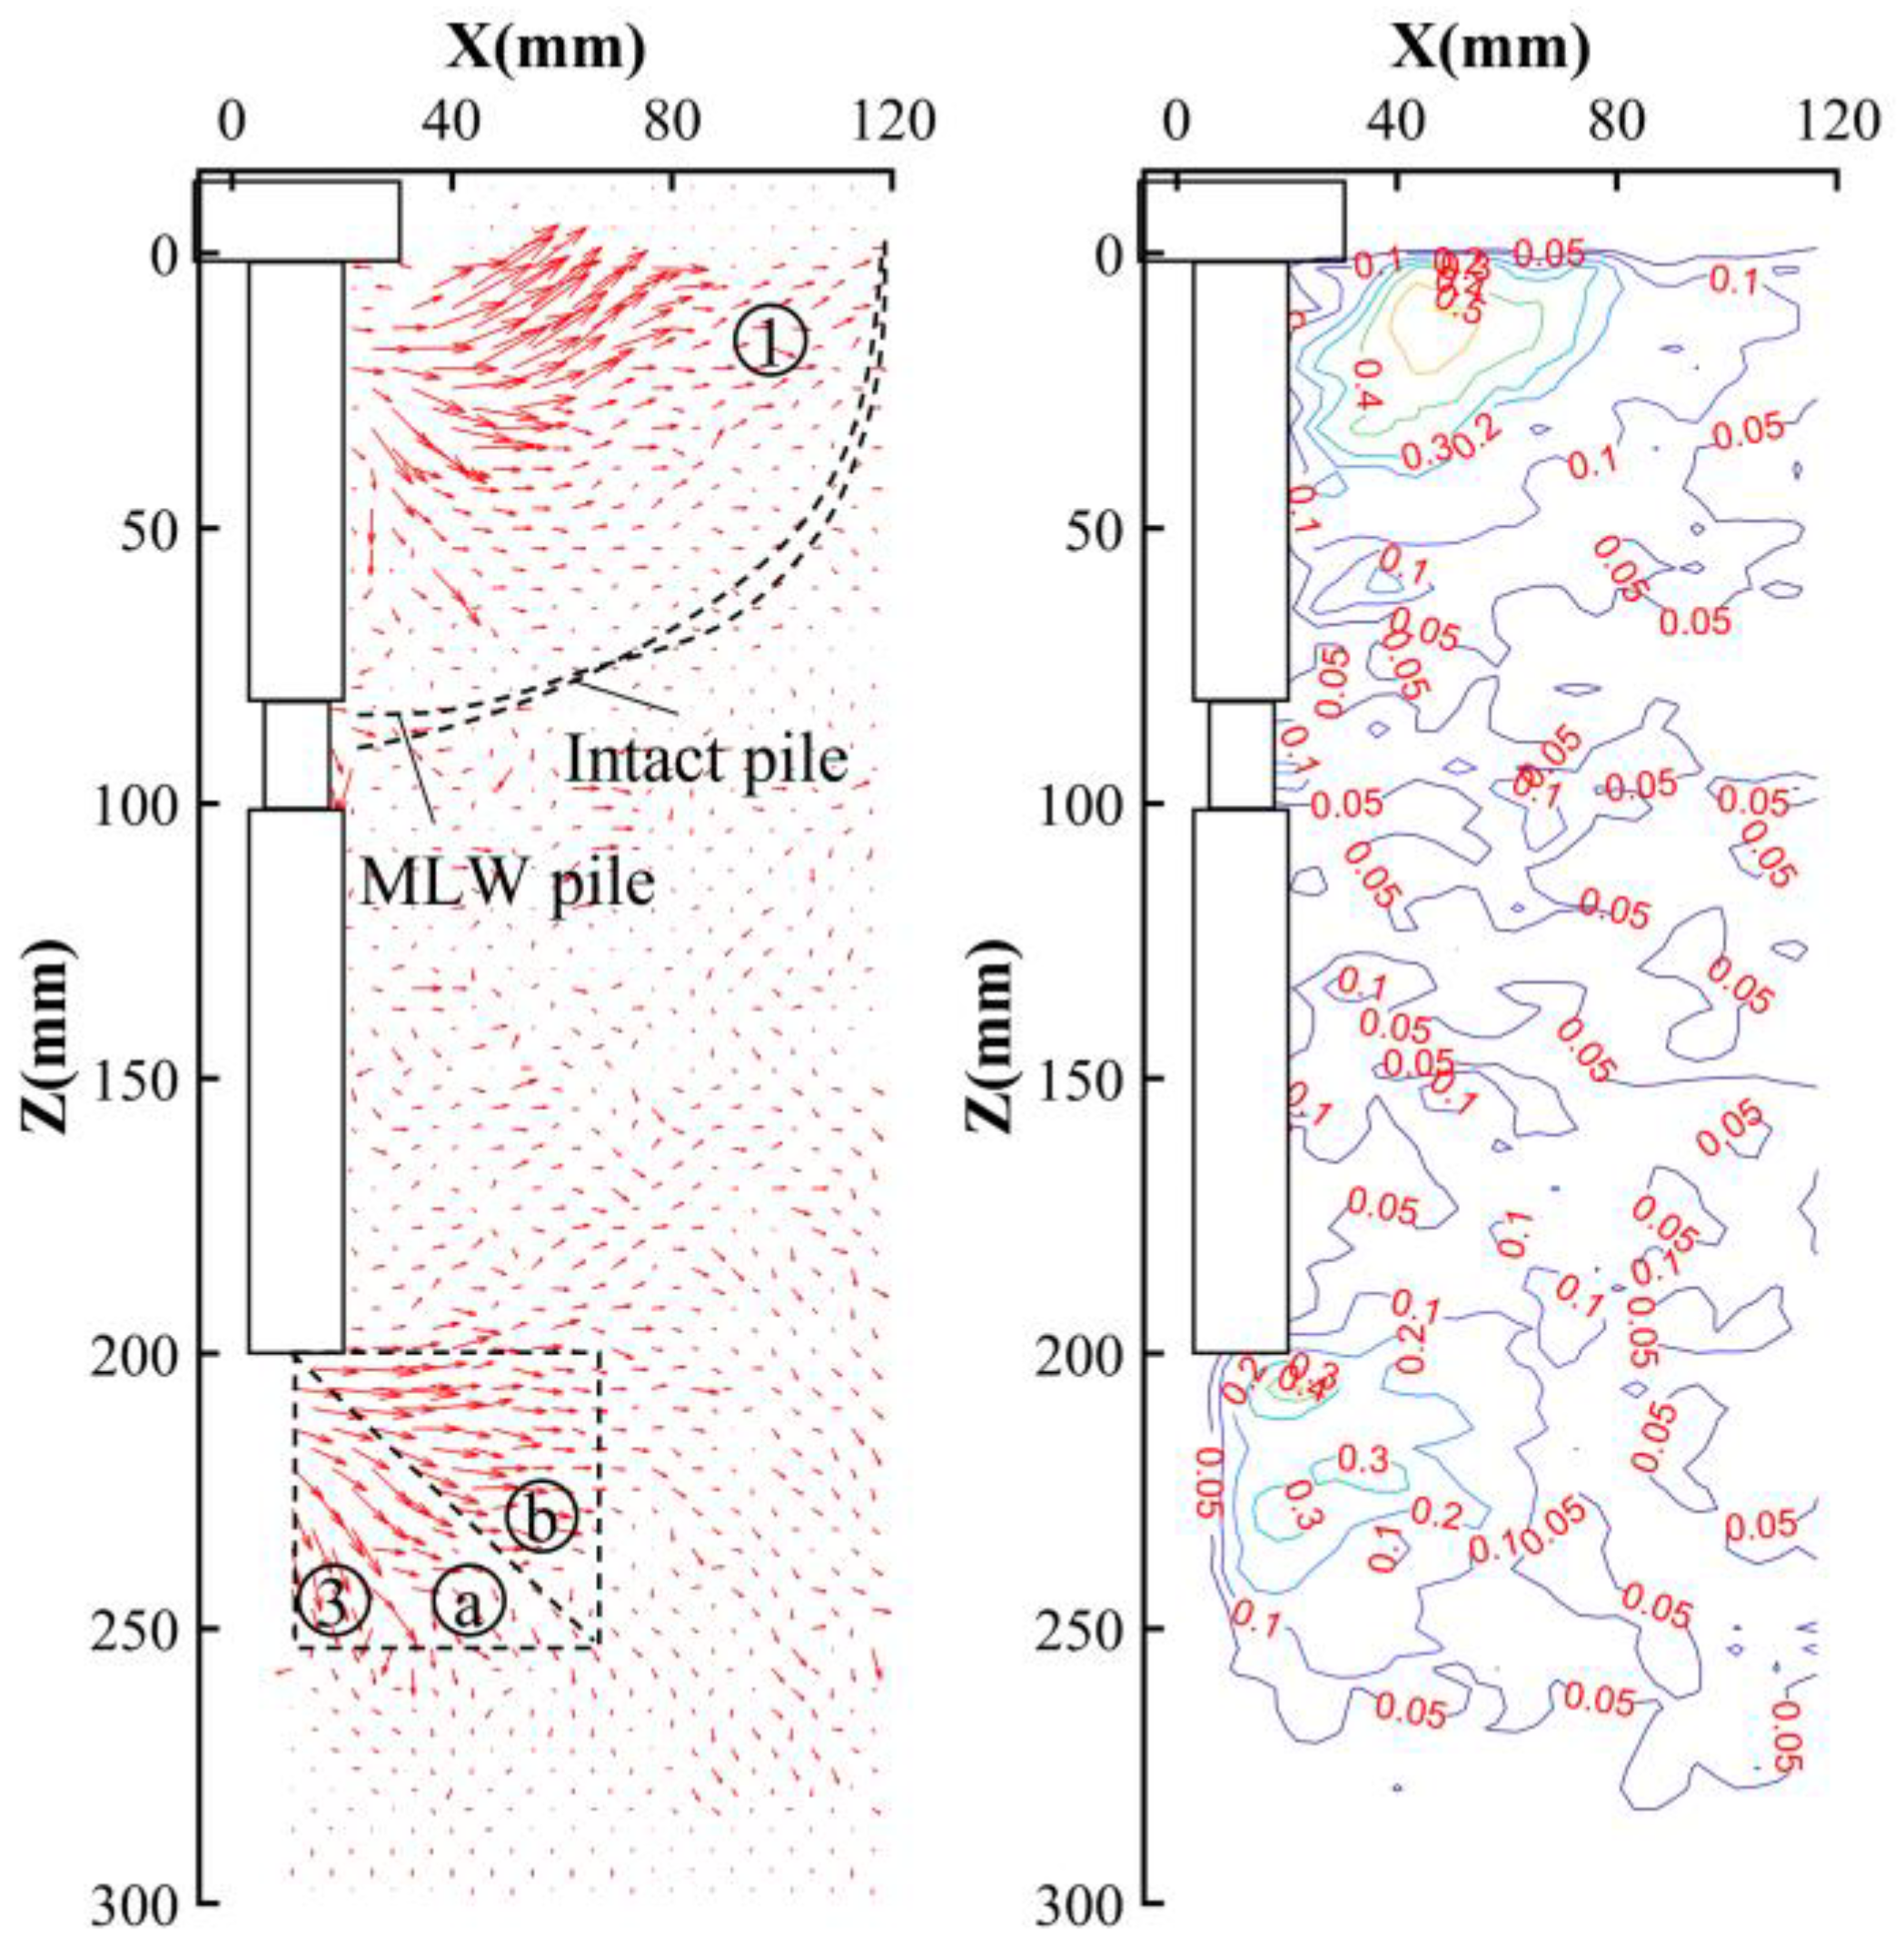
Figure 12, Figure 13 and Figure 14 show the soil displacement vector diagram and contour diagram of MLW pile, MLM pile and MLT pile, respectively. For MLW pile (see Figure 12), Zone ① and Zone ③ are similar to that of the intact pile. However, the direction of soil at the necking position (Z = 80 mm to Z = 100 mm) developed downward and concentrated displacement. The relative displacement between pile shaft and soil decreases, which cause the pile shaft resistance to decrease, resulting in weakening the bearing capacity of MLW pile. For MLM pile (see Figure 13), the soil at the necking position of MLM pile also develops concentrated displacement, which is connected with the soil around the pile cap, resulting in increasing significantly the range of Zone ① in a vertical direction. The increased range is 5.7 times pile diameter, which is 33% larger than that of the intact pile. However, the soil displacement between Z = 60 mm and Z = 120 mm is small; only the soil around the necking develops large and concentrated displacement. The range of soil displacement of Zone ① is five times the pile diameter in the horizontal direction, which is consistent with that of the intact pile. For MLT pile (see Figure 14), it is obvious that the soil near the pile shaft under the pile cap develops a distinct displacement, of which the range is 6.3 times the pile diameter. The soil between the necking and pile cap presents a connection, and the soil near the pile shaft in Zone ① develops a vertically downward significant displacement, which weakens the pile-shaft resistance greatly, resulting in a large loss of the vertical bearing capacity of MLT pile. According to the soil displacement around MLT (see Figure 14), the load from the pile cap is transmitted downward, and the corresponding horizontal stress is reduced. The soil displacement range around the pile cap is reduced by 15% less than that of intact pile.
To sum up, when the necking length is 20 mm, the soil at the necking produces an oblique downward and concentrated displacement, which limits the exertion of pile-shaft resistance [42]. When the necking diameter is large, the soil at the necking and the soil around the pile cap are connected, which can increase the soil-displacement range under the pile cap. In addition, the soil under the pile cap develops more vertically downward displacement, resulting in more loss of pile-shaft resistance.
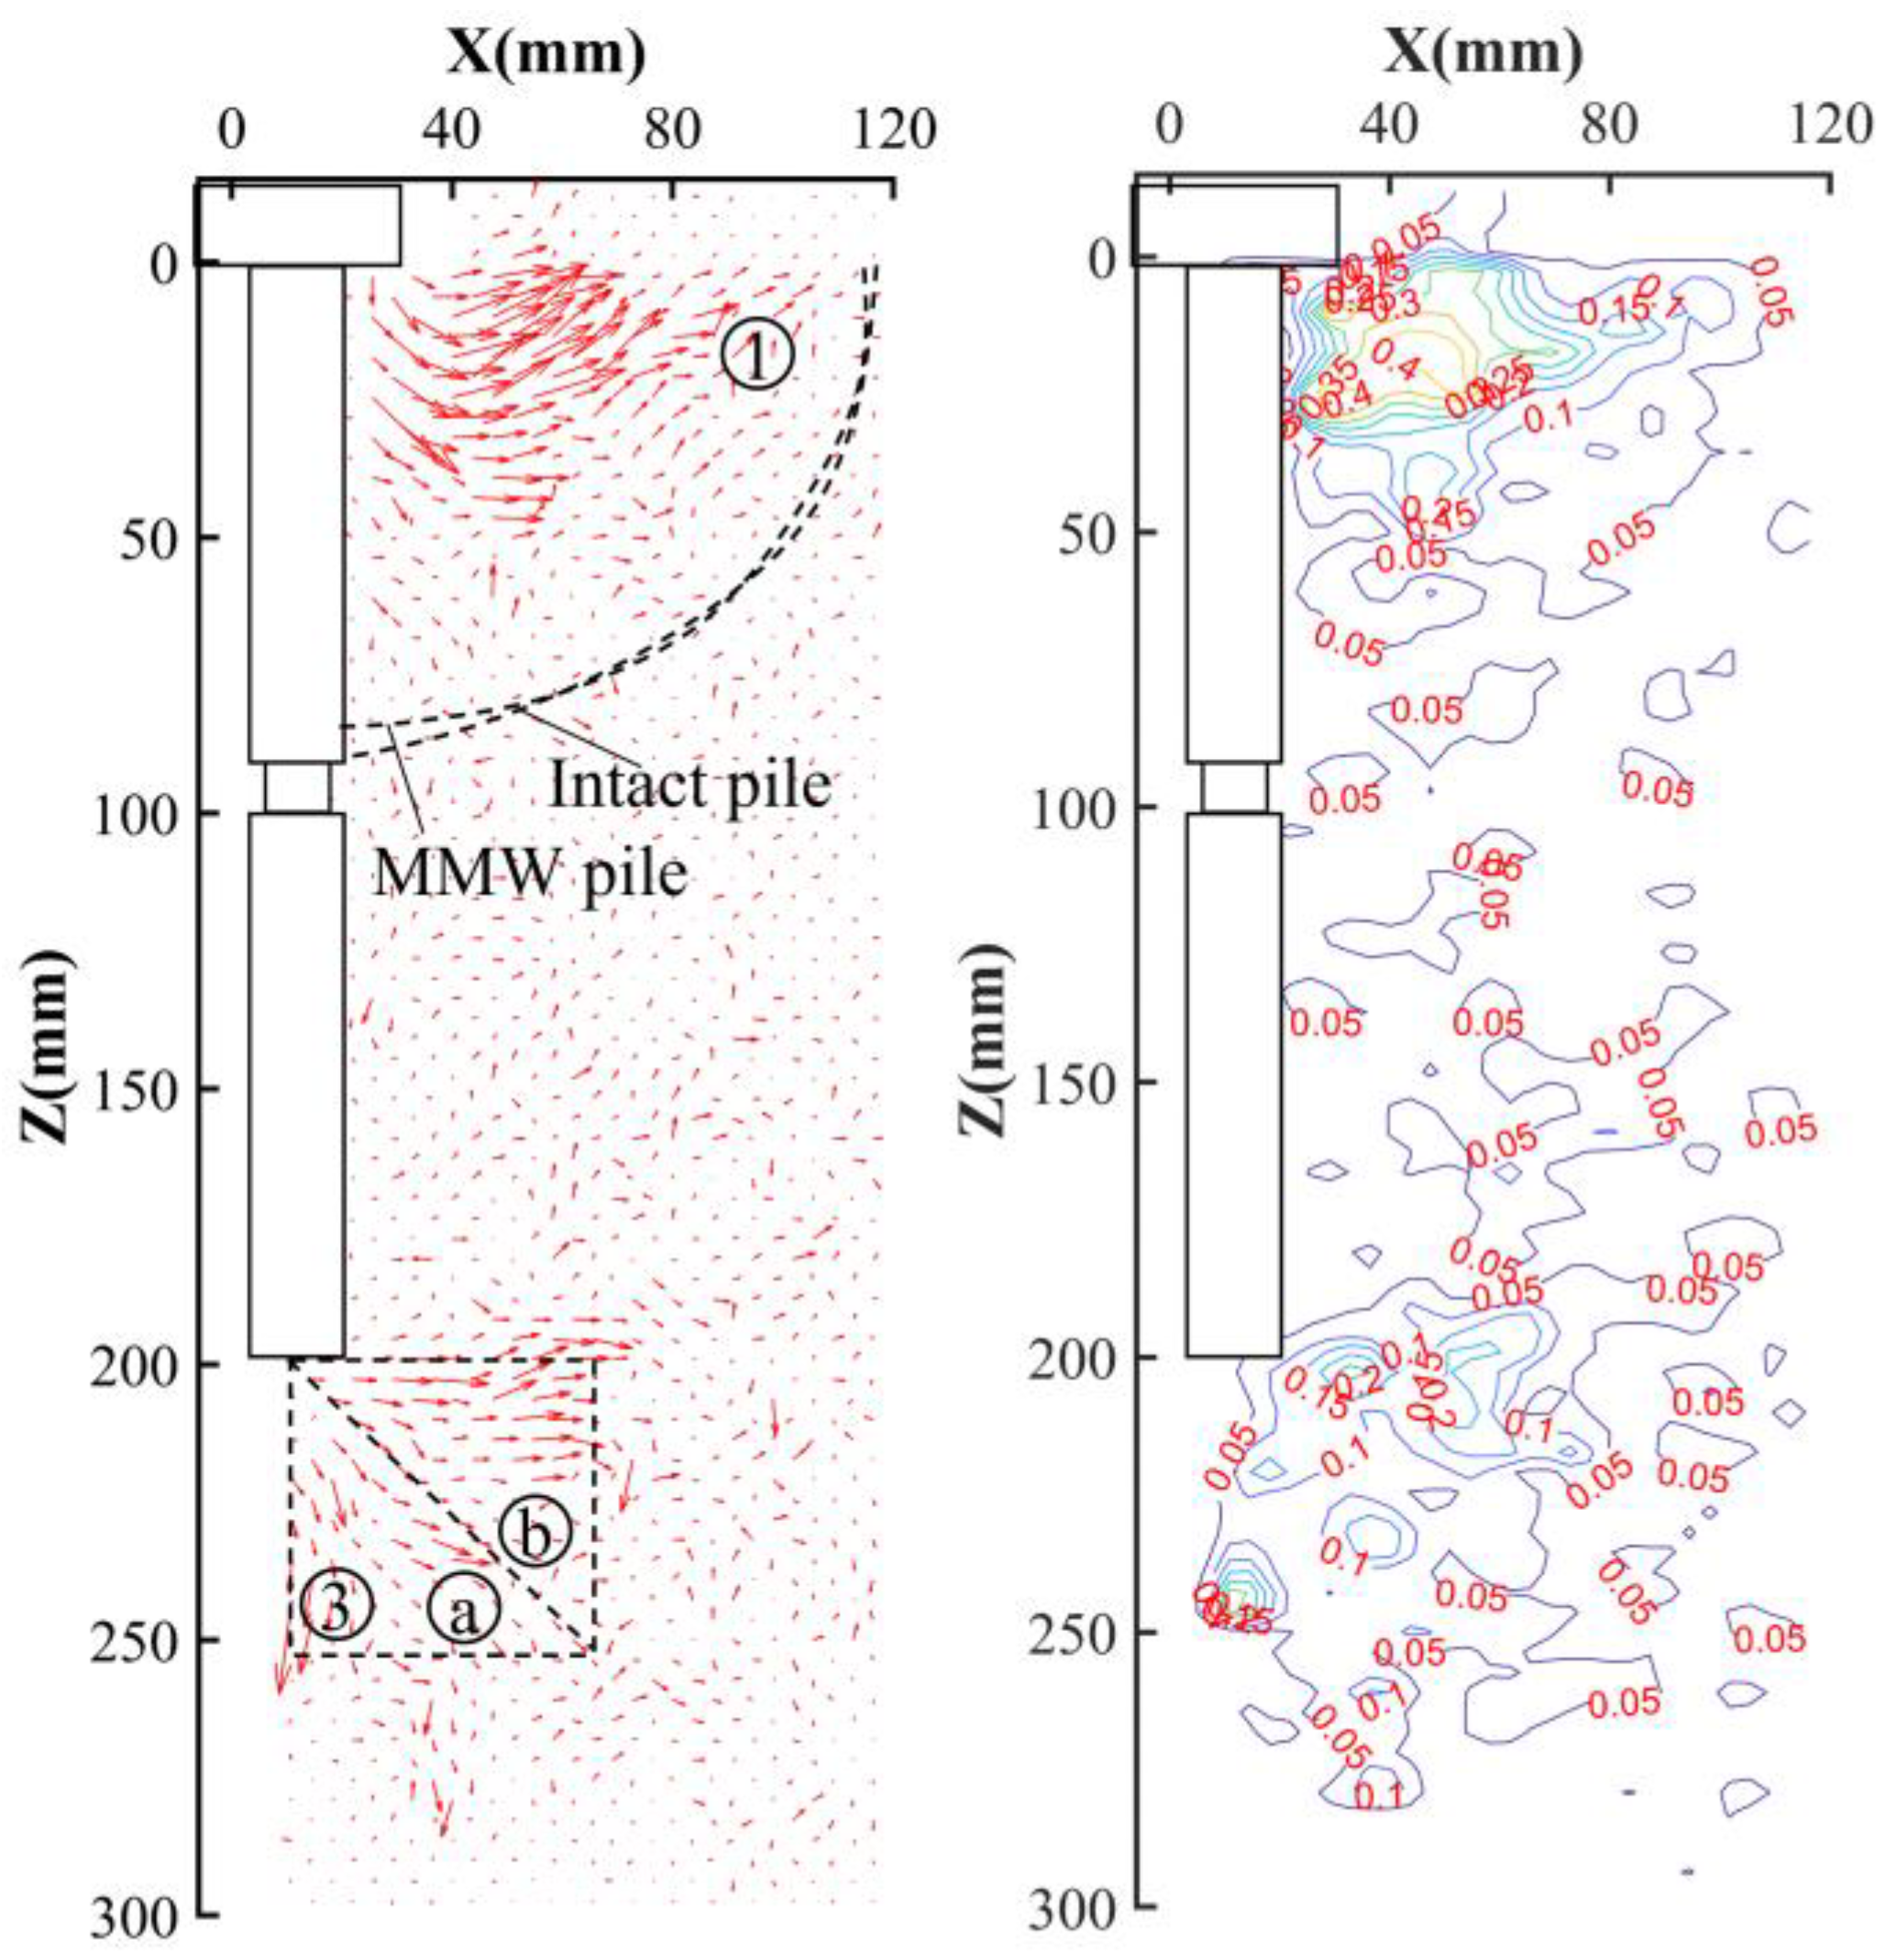
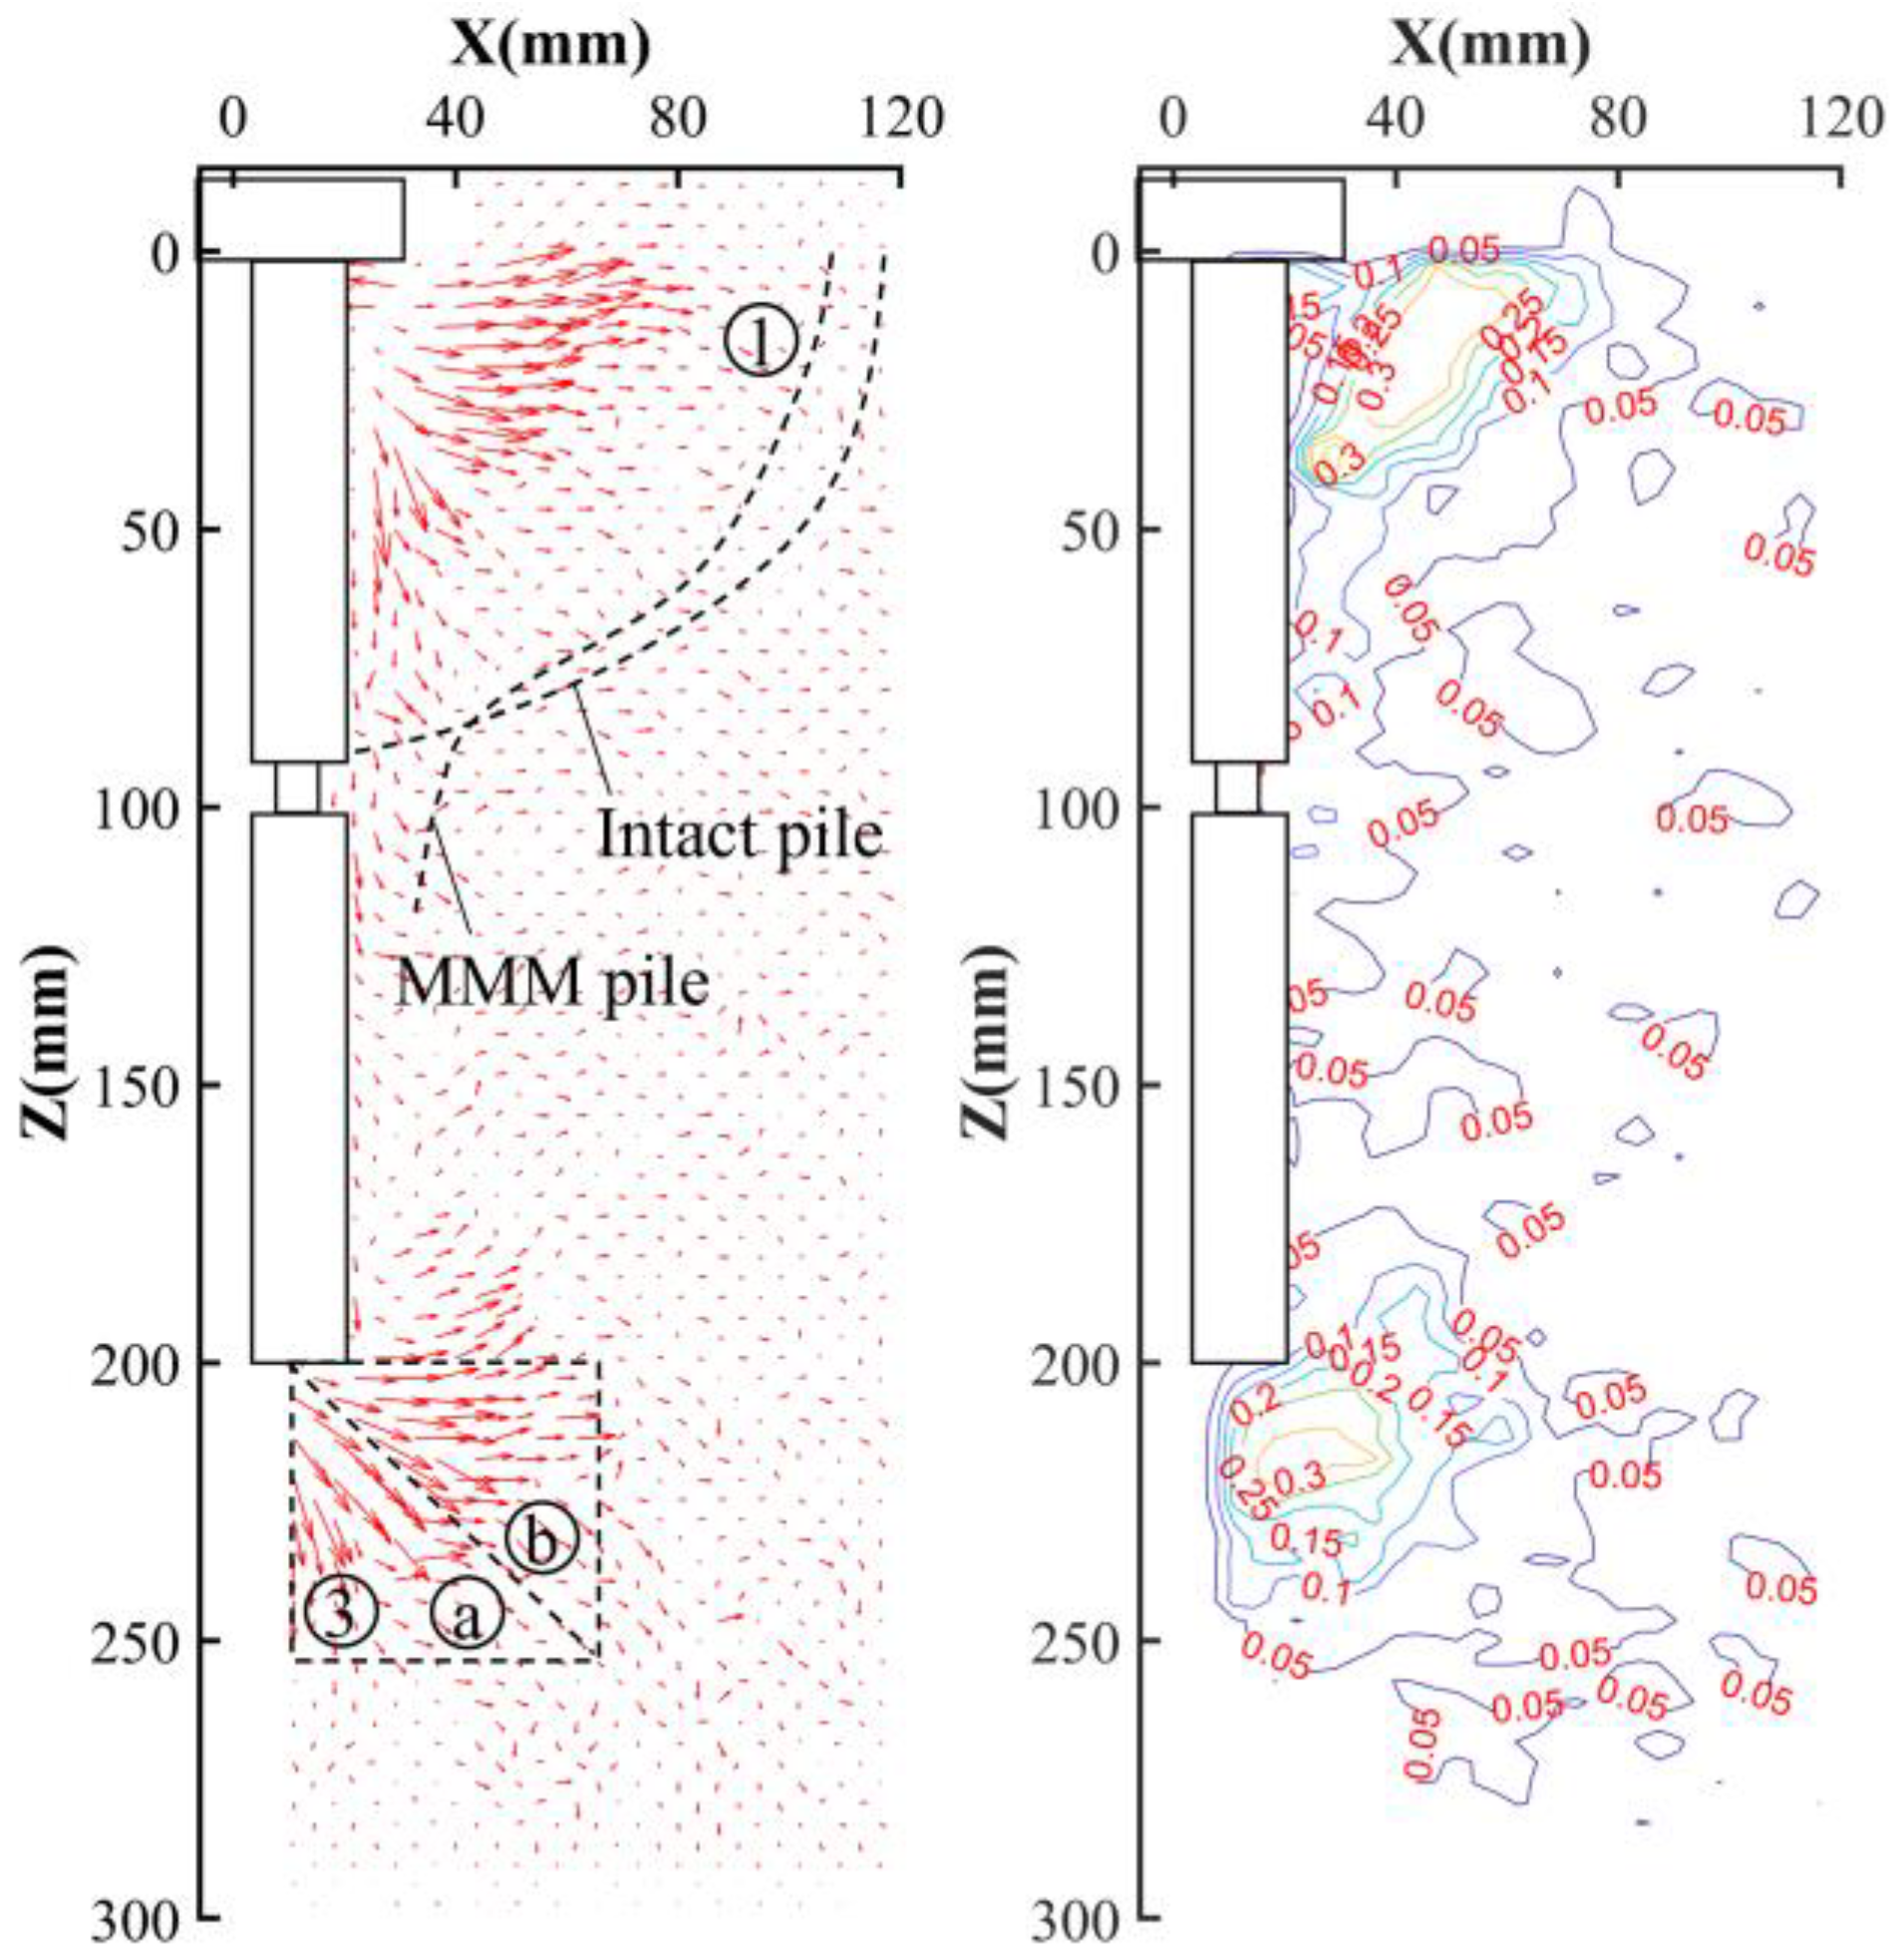
When the necking length is 10 mm, Figure 15, Figure 16 and Figure 17 show the soil displacements of MMW pile, MMM pile and MMT pile, respectively. The characteristics of soil displacements around the three piles are similar to that of the three piles when the necking length is 20 mm. For MMW pile (see Figure 15), the soil displacement around the pile shaft is consistent with that of the intact pile. Little soil displacement develops at the necking, and it does not contribute to soil displacement around the pile cap. For MMM pile (see Figure 16), the soil at the necking and the soil around the pile cap are connected. The soil-displacement range under the pile cap is larger than that of the intact pile and develops vertically downward displacement in a large range. The soil displacement in Zone ③ is similar to that of intact pile. For MMT pile (see Figure 17), the soil displacement of Zone ① is similar to that of MLT pile. However, the soil in Zone ③ develops obliquely upward displacement. The reason is that the necking causes the bearing capacity of the upper part of pile shaft to decrease, and more loads are borne by the pile end. Subsequently, the bearing capacity provided by soil compression reaches the limit, and the excess load is transmitted horizontally. Due to the large confining pressure of the soil around the pile end, the load transfer direction gradually shifts from horizontal to obliquely upward, as shown in Figure 17.
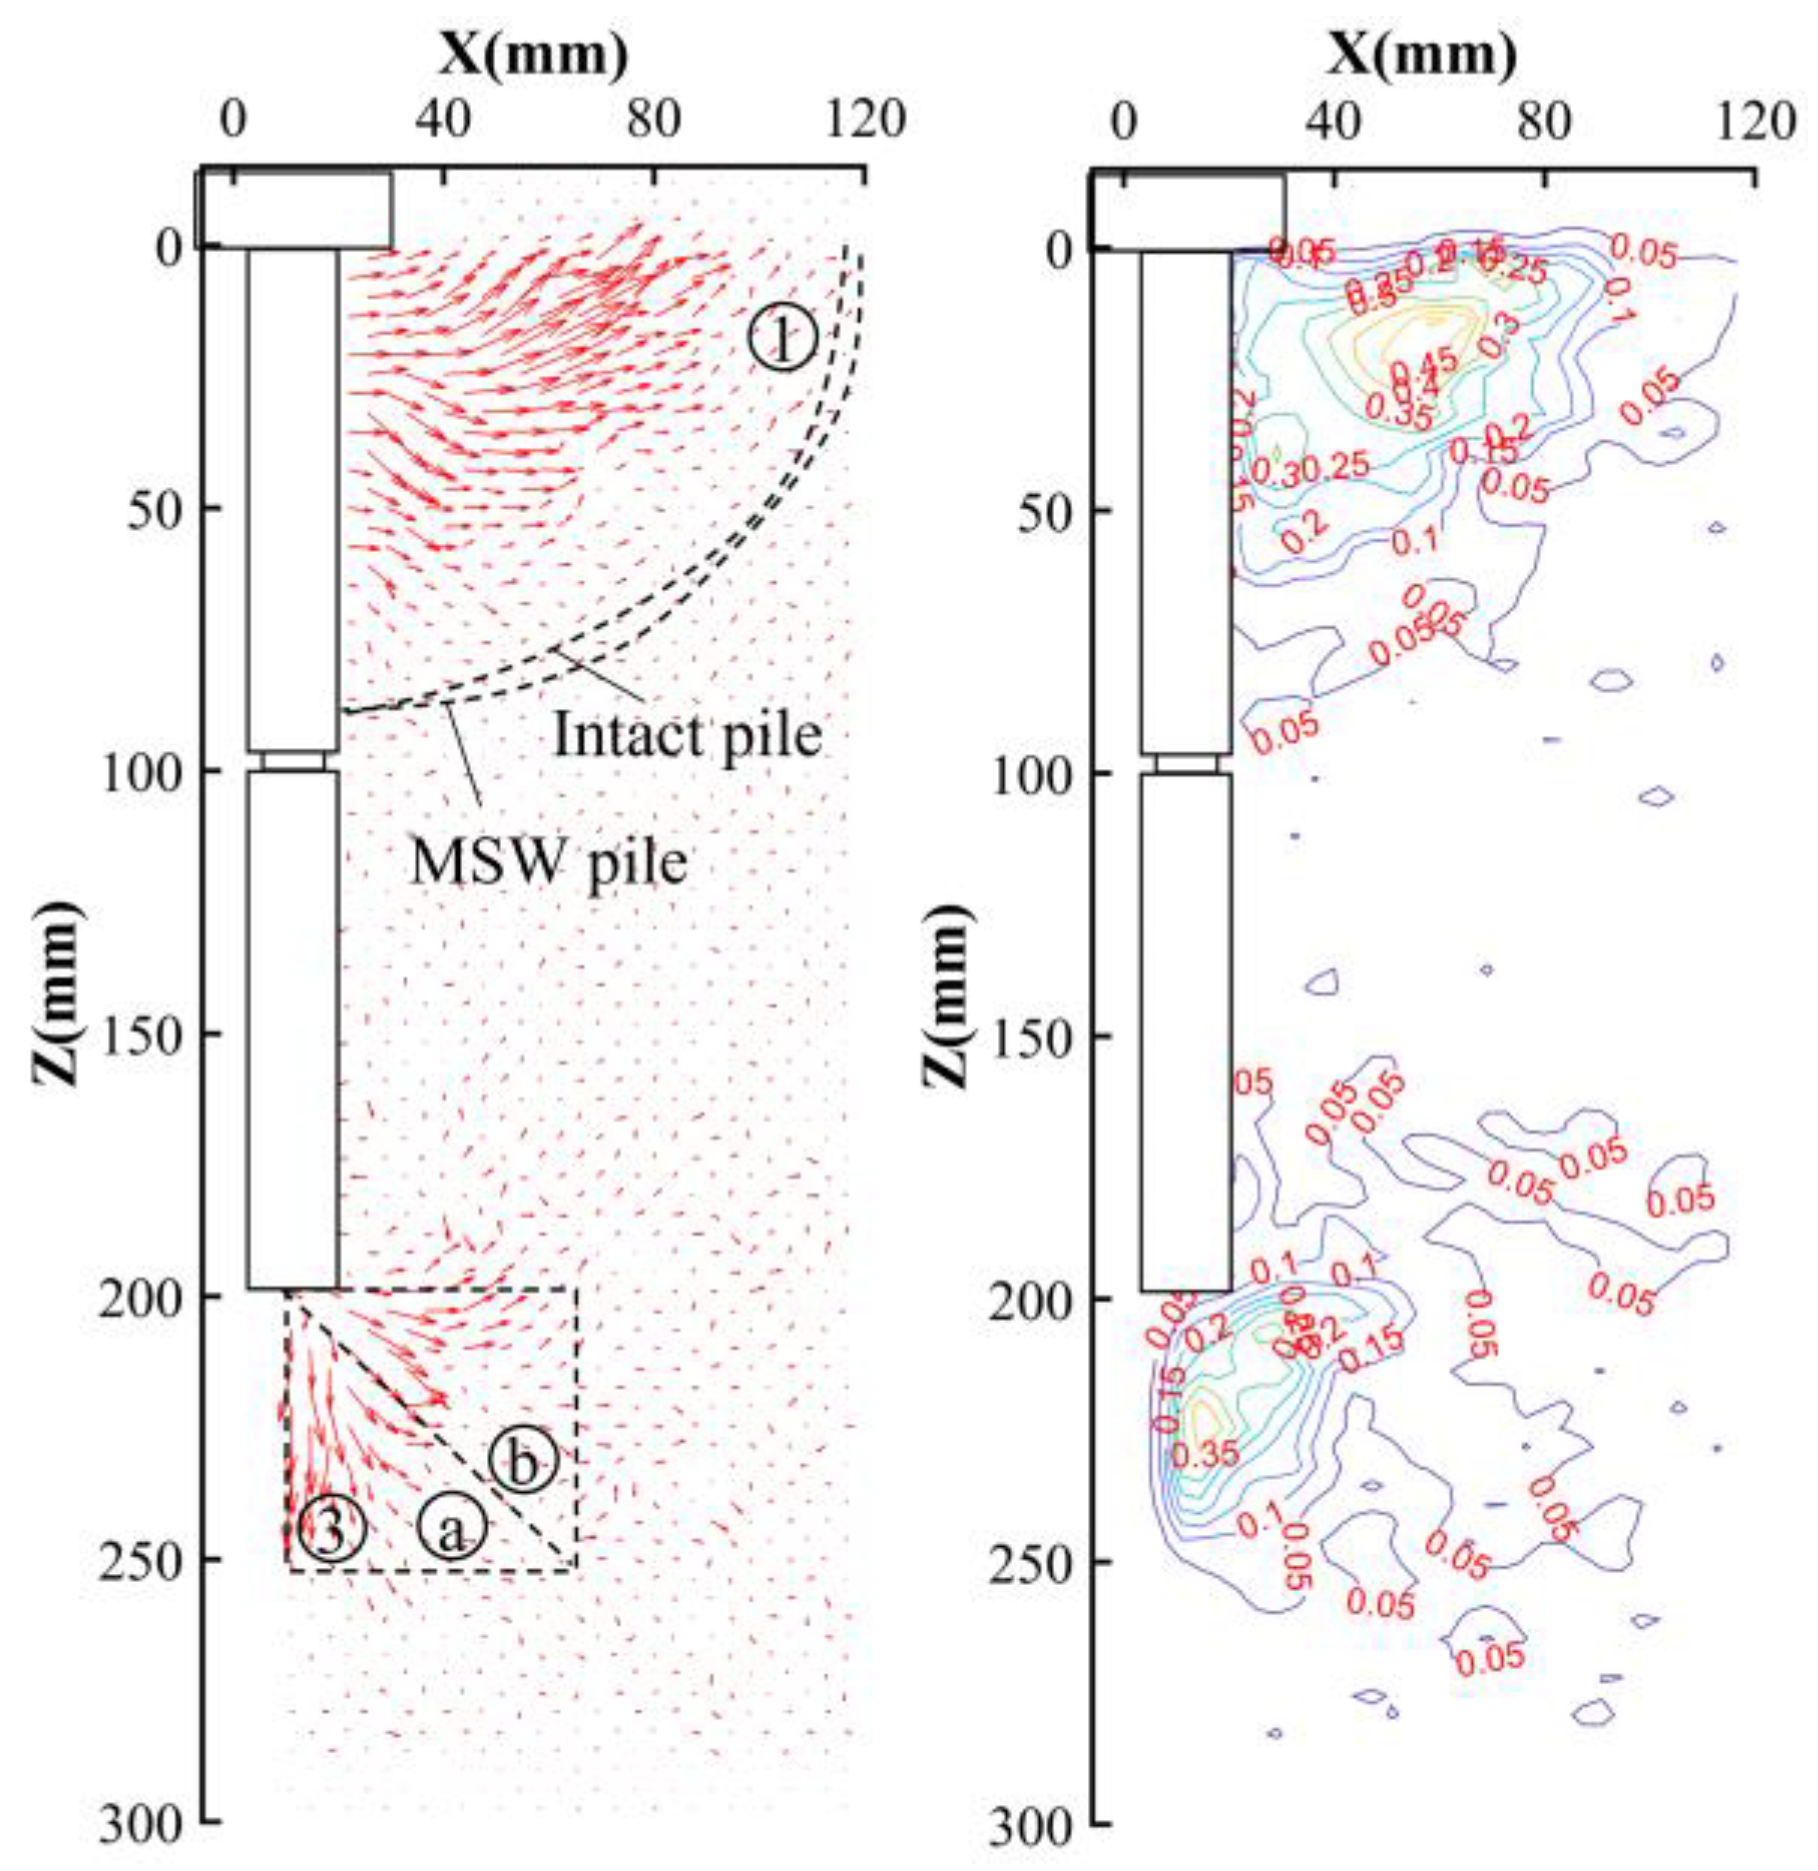
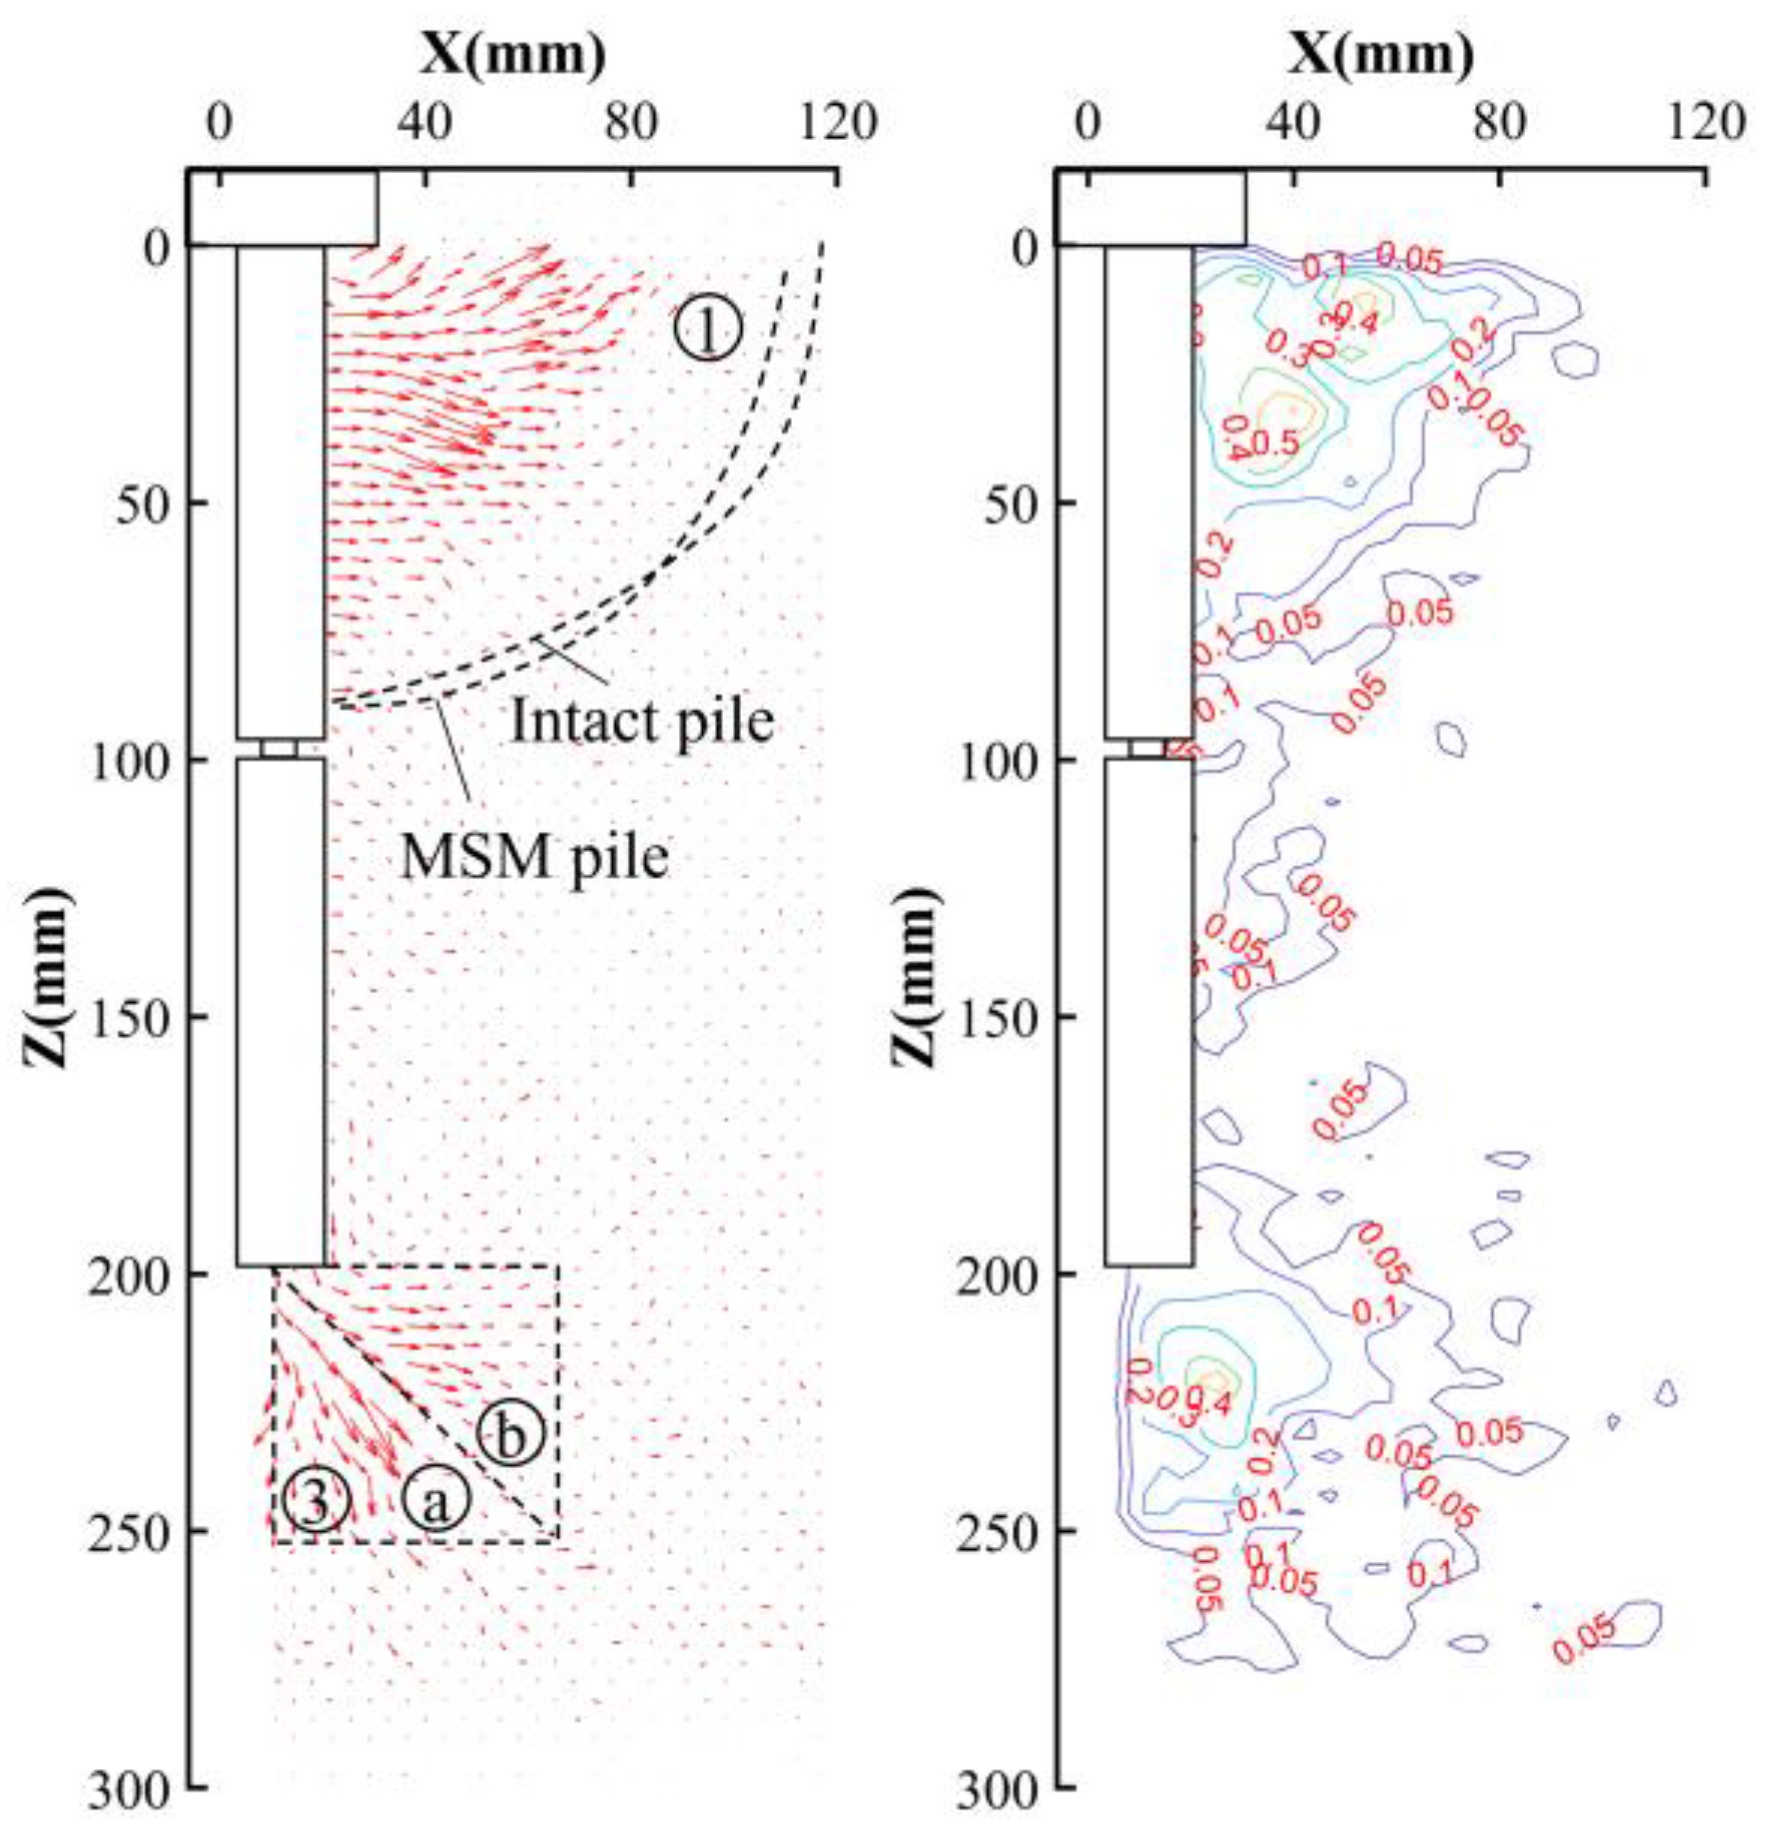
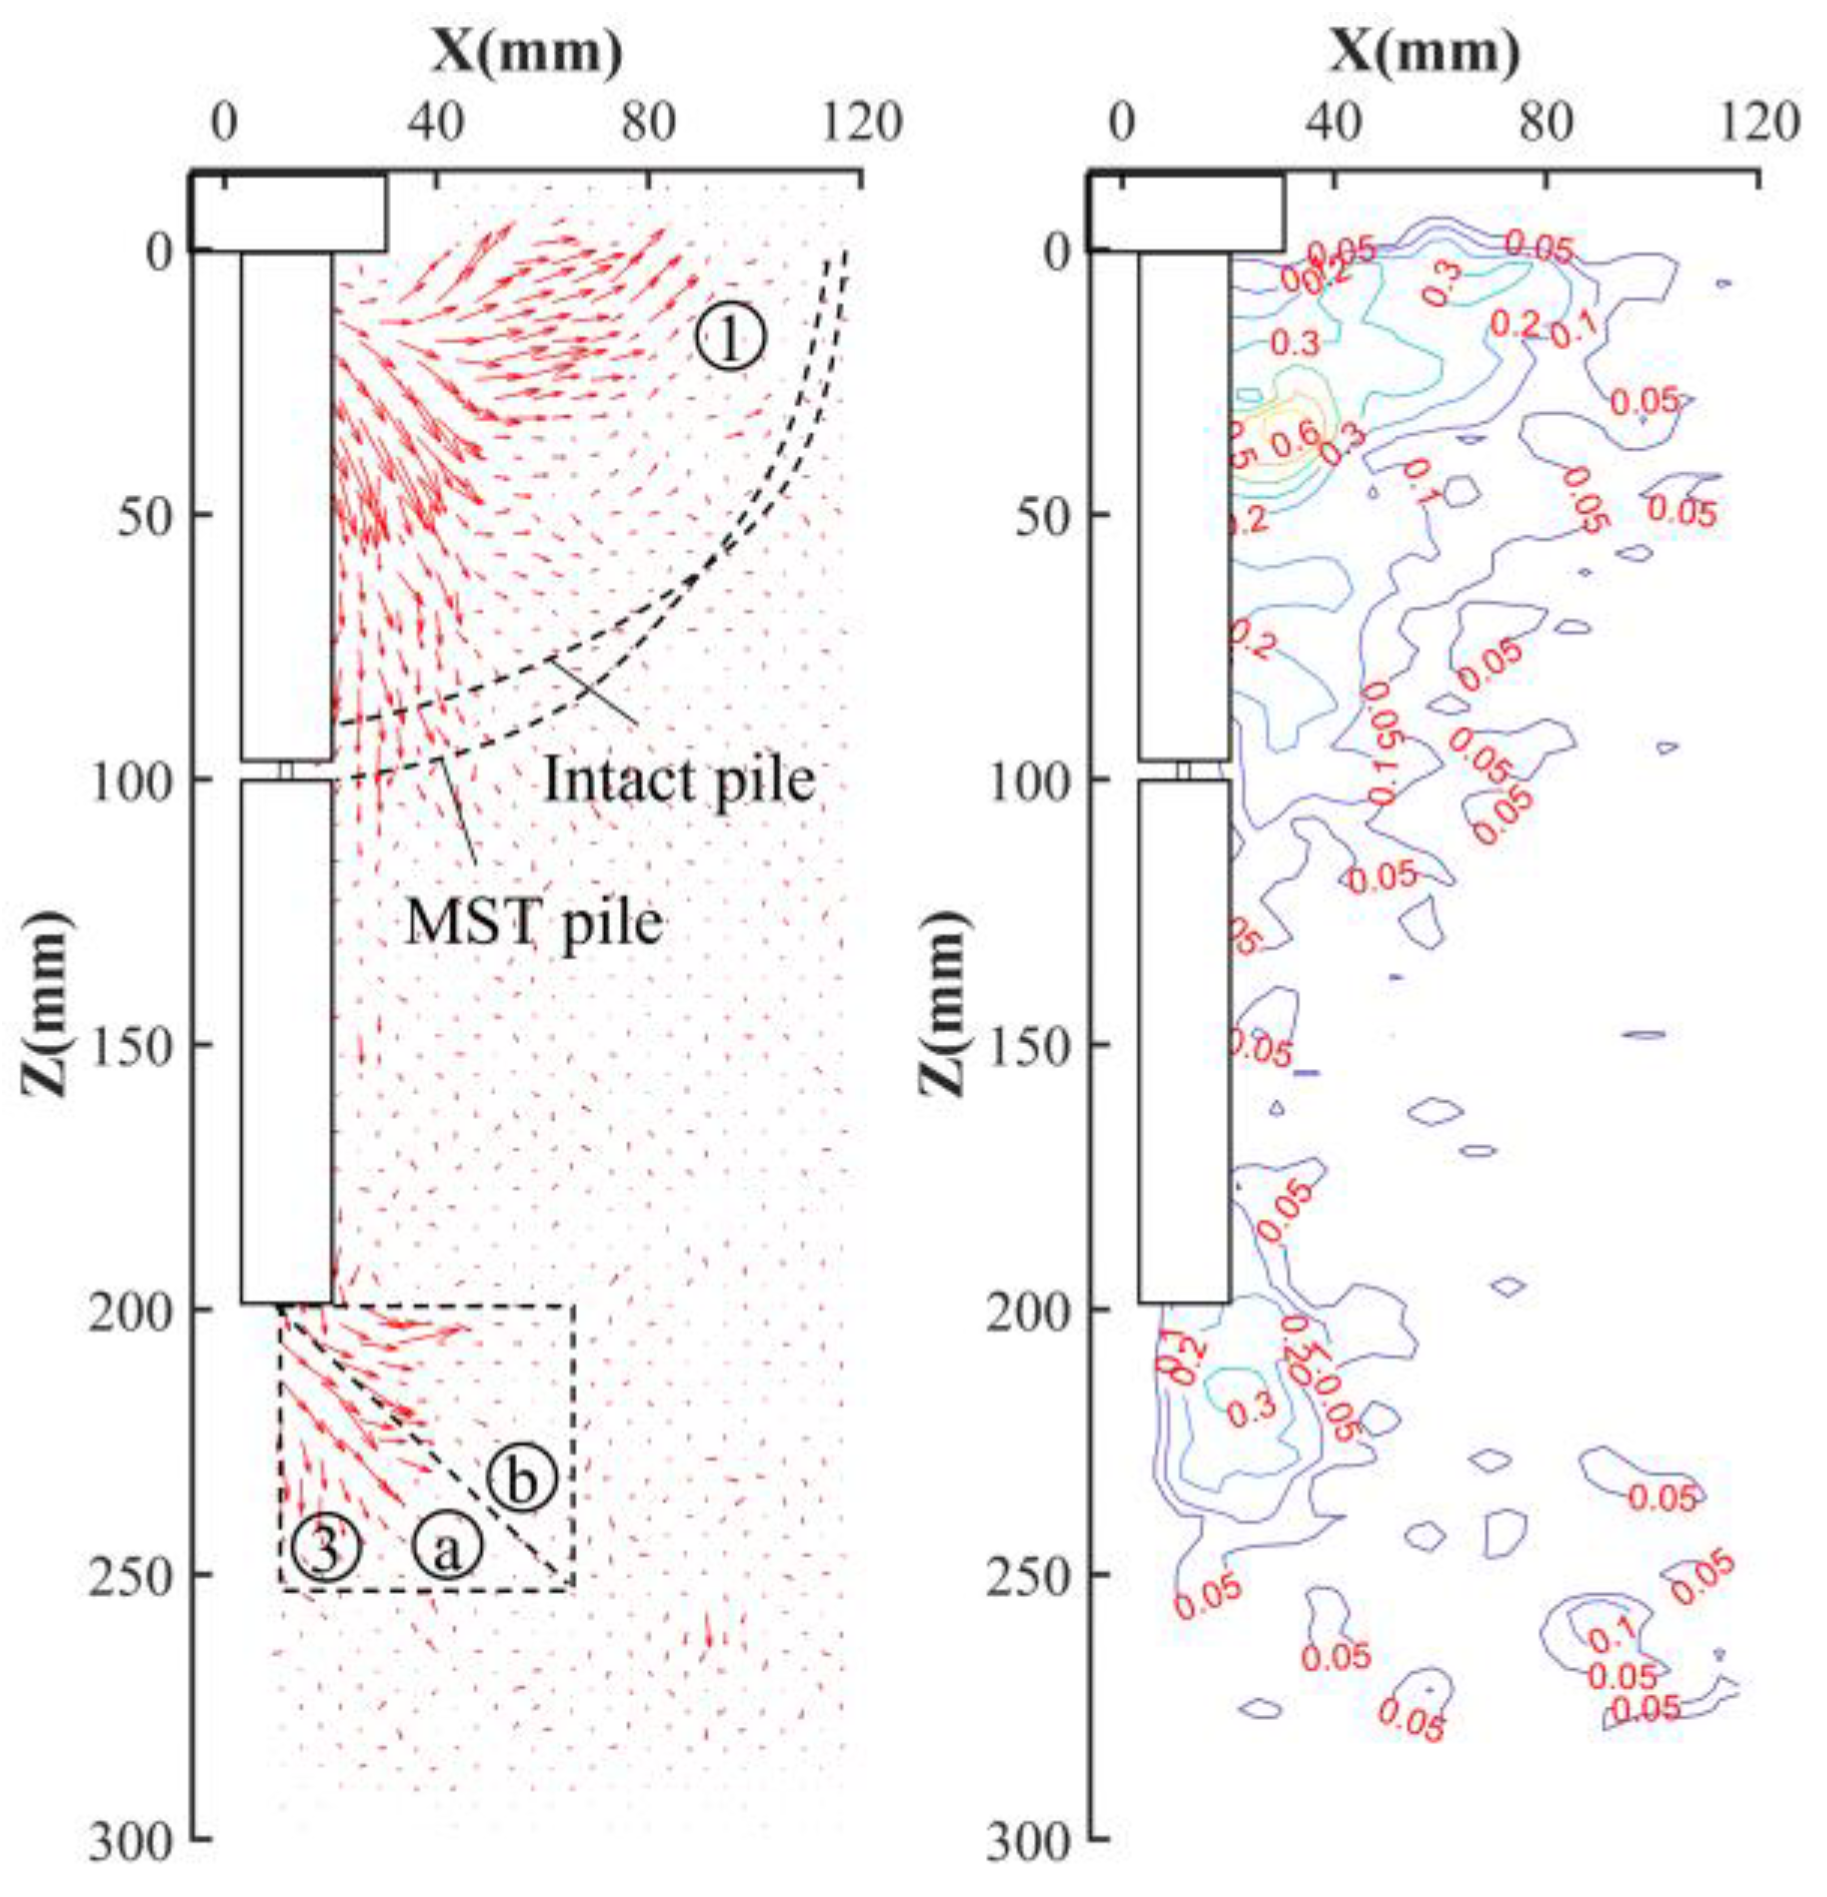
When the necking length is 5 mm, the influences of necking diameter on the soil displacements of MSW pile, MSM pile and MST pile are shown in Figure 18, Figure 19 and Figure 20, respectively. It can be clearly found that the characteristics of soil displacements for MSW pile and MSM pile are similar to that of intact pile, which indicates that the necking has little contribution to soil displacement when the necking length is 5 mm. For MST pile (see Figure 20), the soil near the pile shaft in Zone ① develops a large vertically downward displacement. The reason for this is that the pile shaft above the necking tilts to the right, resulting in a large amount of load transfer to the soil on the right of the pile shaft, which causes the soil on the right of pile shaft to develop a large displacement. This phenomenon also shows that, when the pile shaft tilts, the stress of the soil around the pile shaft becomes uneven, which can cause the soil around the pile shaft to fail, resulting in a weakening of the bearing performance of piles.

4. Discussion of Bearing Capacity Loss

Necking limits the exertion of pile-shaft resistance. The more the necking length is, or the smaller the necking diameter is, the greater the ability of the necking to limit the shaft resistance is, obviously resulting in a loss of pile capacity.
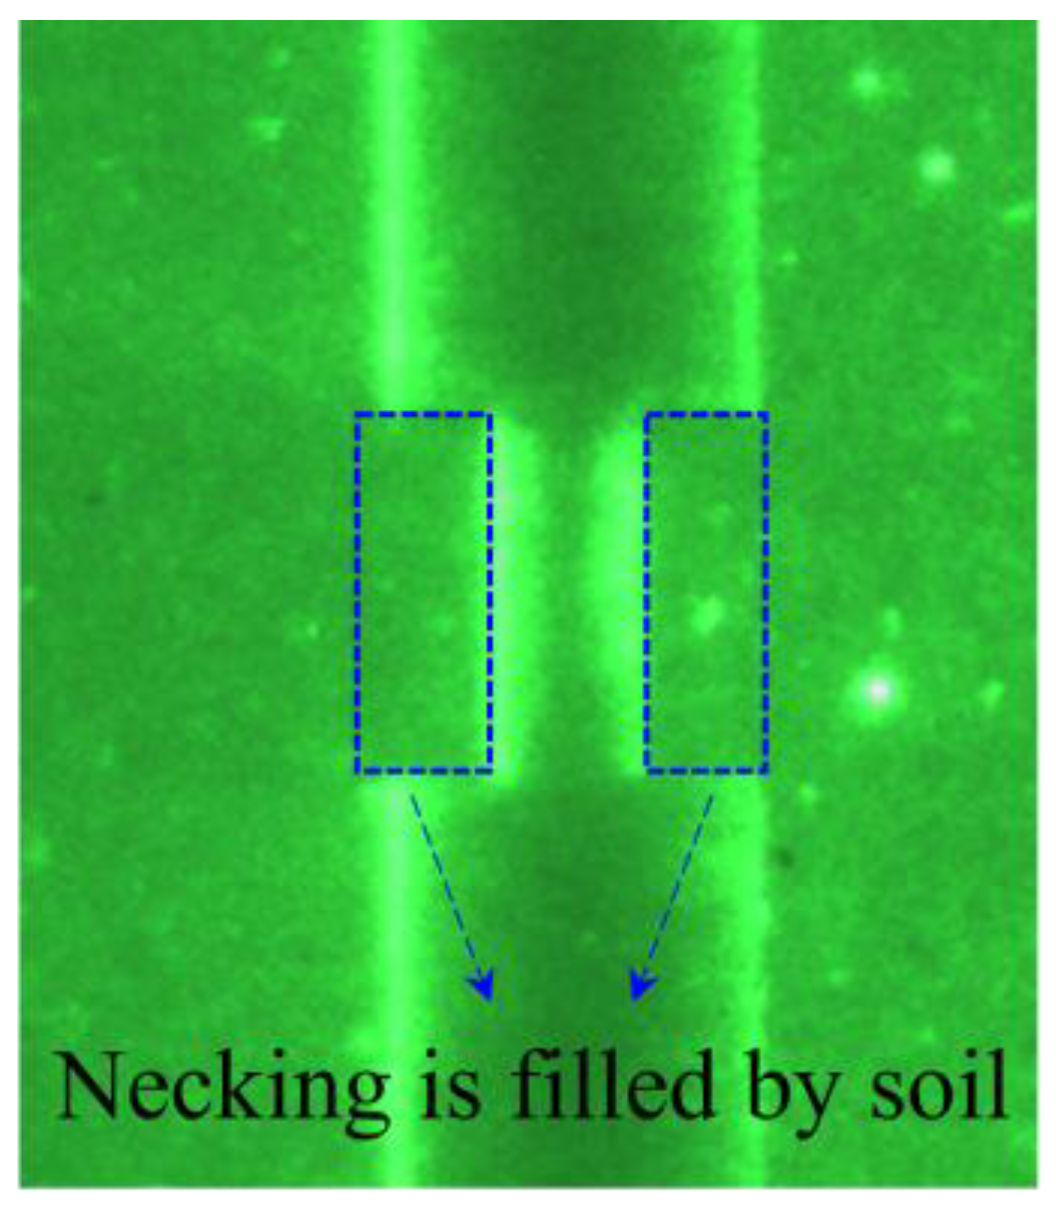
Considering the necking length, the reason why the pile capacity reduce is that the missing part (necking) of the pile is filled with surrounding soil, as shown in Figure 21, where the pile-shaft resistance is replaced by the soil-interface resistance, as shown in Figure 22. The larger the necking length is, the larger the missing part of the pile shaft is, and the more the filled part of the soil is, which transforms more pile-soil resistance into soil-interface resistance, resulting in the decrease in the pile-shaft resistance and pile bearing capacity [42].
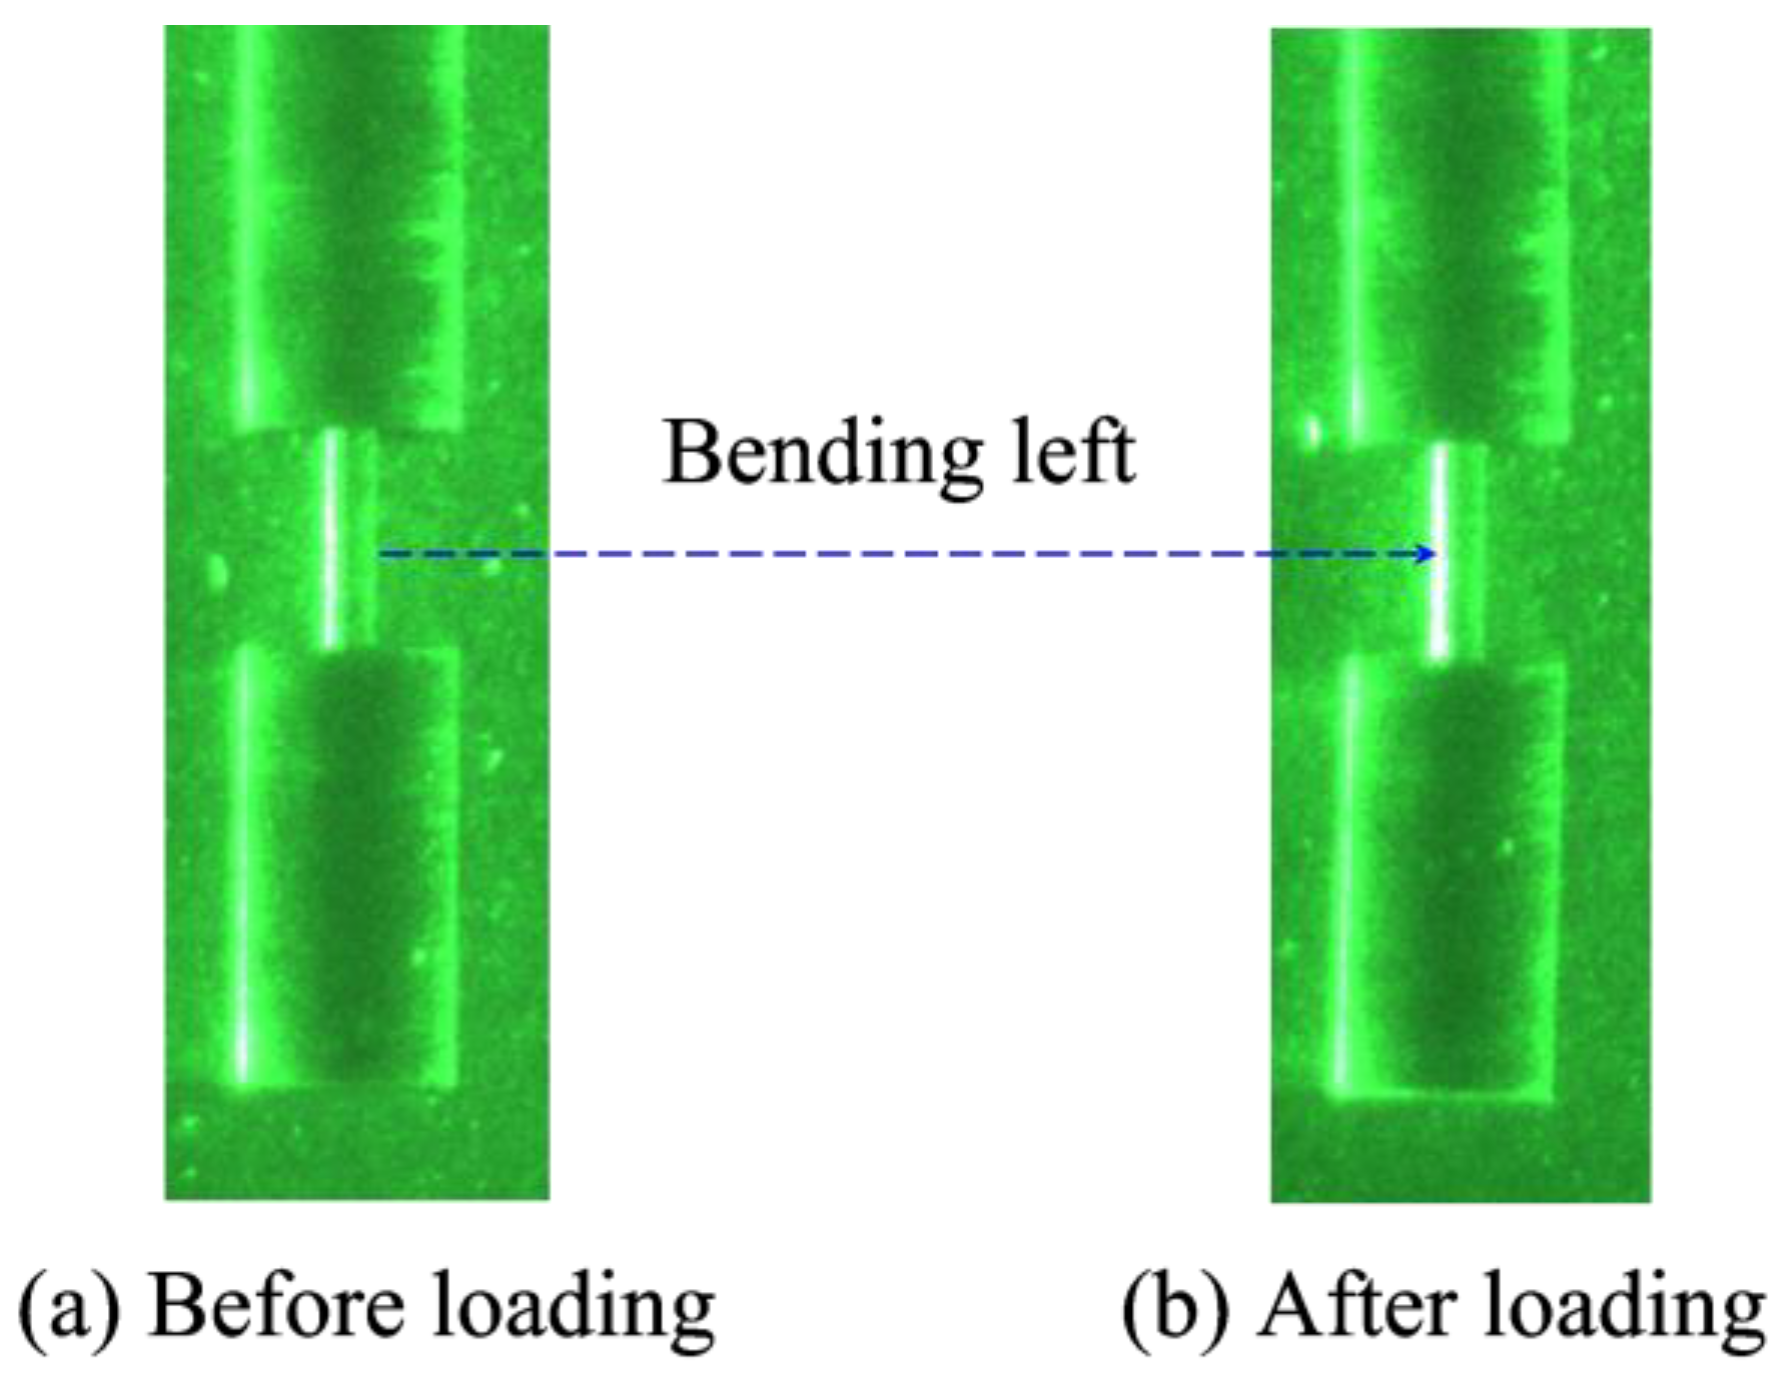
Considering the necking diameter, with the decrease in necking diameter, the area of connection increases, and the relative displacement between pile and soil decreases, resulting in the decrease in pile-shaft resistance. When the necking diameter is 10 mm and 5 mm, the displacement direction of the soil in Zone ③ is obliquely downward, which provides vertical resistance and partial horizontal resistance, and undertakes the partial loss of shaft resistance. With the decrease in the radial dimension, the pile bending performance is weakened. When the necking diameter is 5 mm, the soil at the pile end develops shear failure, which increases the couple between the pile end and the necking, which causes the pile to bend, resulting in an instability failure in a horizontal direction (see Figure 23). The instability of pile weakens the exertion of pile-shaft resistance, resulting in a decrease in the bearing capacity of necking pile. Subsequently, when the necking diameter is 5 mm, it is suggested that the pile does not bear the load.

5. Conclusions

In this study, a model experiment was carried out on one intact pile with a cap and nine necking piles with caps assisted with transparent soil technology. The load-settlement curves were used to study the characteristic of bearing capacity. Dealing with the displacement speckle field of soil mass using the MatPIV program, the characteristic of soil displacement was then analyzed systematically. Subsequently, this paper explained the reason why the bearing capacity of necking pile reduces. The following conclusions are drawn:
(1)
The bearing capacity of capped pile is greatly damaged by the existence of necking. When the necking diameter is 4 mm and the necking length is 20 mm, the loss of VUBC is as high as 26.6%. For the pile with the same necking diameter, the vertical bearing capacity will decrease with the increase in necking length. However, when the necking diameter is 16 mm, the VUBC of MLW pile only is increased by 3% compared with that of MMW pile. For the pile with the same necking length, the vertical bearing capacity will increase with the increase in necking diameter.
(2)
The necking mainly affects the soil displacement around the pile cap and necking. The soil around the necking develops downward and concentrated displacement, and the pile-shaft resistance at the necking is lost. When the necking size is large, the soils at the necking and around the pile cap are connected. This increases the displacement range of the soil under the pile cap and has a significant impact on the soil displacement direction around the pile cap. In addition, the soil under the pile cap develops more vertically downward displacement, resulting in more loss of pile-shaft resistance.
(3)
In this study, the necked pile was placed in the middle of the pile for the first time. At present, there is no relevant study on middle necking pile. This study is compared with the existing studies on necking piles. For example, Xu et al. [31] shows that the necking seriously affects the bearing capacity of piles, the influence of the necking length and different necking diameters on the bearing capacity, which is consistent with the results of this study. The research results in the literature show that shallow shrinkage limits the performance of the pile cap. This study found that the intermediate shrinkage affects the performance of the pile side friction. The research results analyzed the causes of the bearing-capacity loss of necking piles and provided a certain theoretical and technical reference for the rational design and reinforcement of piles.

Author Contributions

Conceptualization, X.L. and X.C.; methodology, X.C.; software, M.Z. and L.D.; validation, X.L., M.Z. and Z.X.; formal analysis, X.L.; investigation, M.Z. and Z.X.; resources, X.L.; data curation, Z.X.; writing—original draft preparation, X.C., M.Z. and Z.X.; writing—review and editing, X.C., M.Z. and Z.X.; visualization, X.L.; supervision, X.L.; project administration, L.D.; funding acquisition, X.L. and Z.X. All authors have read and agreed to the published version of the manuscript.

Funding

This research was funded by the National Natural Science Foundation of China (No. 51978247) and Open Fund of Key Laboratory for Engineering Material & Structure Reinforcement of Fujian Province (No. B170001-7).

Institutional Review Board Statement

Not applicable.

Informed Consent Statement

Not applicable.

Data Availability Statement

The data used to support the findings of this study are available from the corresponding author upon request.

Conflicts of Interest

The authors declare no conflict of interest.

References

  1. O’Neill, M.; Tabsh, S.W.; Sarhan, H. Response of drilled shafts with minor flaws to axial and lateral loads. Eng. Struct. 2003, 25, 47–56. [Google Scholar] [CrossRef]
  2. Li, D.Q.; Tang, W.H.; Zhang, L.M. Updating occurrence probability and size of defect for bored piles. Struct. Saf. 2008, 30, 130–143. [Google Scholar] [CrossRef]
  3. Sarhan, H.A.; O’Neill, M.W.; Hassan, K.M. Flexural Performance of Drilled Shafts with Minor Flaws in Stiff Clay. J. Geotech. Geoenviron. Eng. 2002, 128, 974–985. [Google Scholar] [CrossRef]
  4. JGJ106-2014; Technical Code of Building Foundation Piles. China Academy of Building Research: Beijing, China, 2014.
  5. Samman, M.; O’Neill, M.W. The reliability of sonic testing of drilled shafts. Concr. Int. 1997, 19, 49–54. [Google Scholar]
  6. Magued, I.; Douglas, R.; Kelley, S.; Carl, E. Drilled shaft defects: Detection, and effects on capacity in varved clay. J. Geotech. Geoenviron. Eng. 2003, 129, 1128–1137. [Google Scholar]
  7. LI, D.Q.; Zhang, L.M.; Tang, W.H. Reliability evaluation of cross-hole sonic logging for bored pile integrity. J. Geotech. Geoenviron. Eng. 2005, 131, 1130–1138. [Google Scholar] [CrossRef] [Green Version]
  8. Chai, H.Y.; Phoon, K.K. Detection of shallow anomalies in pile integrity testing. Int. J. Geomech. 2013, 13, 672–677. [Google Scholar] [CrossRef]
  9. Lee, J.S.; Song, J.U.; Hong, W.T.; Wu, J.D. Application of time domain reflectometer for detecting necking defects in bored piles. NDT E Int. 2018, 100, 132–142. [Google Scholar] [CrossRef]
  10. Ni, S.H.; Yang, Y.Z.; Tsai, P.H.; Chou, W.H. Evaluation of pile defects using complex continuous wavelet transform analysis. NDT E Int. 2017, 87, 50–59. [Google Scholar] [CrossRef]
  11. Farenyuk, G.; Kaliukh, I.; Farenyuk, E.; Taras, K.; Yaroslav, B.; Viktoriia, B. Experimental and theoretical diagnostics of defects in ferroconcrete piles based on reflection of longitudinal and transverse waves. In High Tech Concrete: Where Technology and Engineering Meet; Spring: New York, NY, USA, 2018; pp. 1307–1317. [Google Scholar]
  12. Gao, L.; Wang, K.H.; Si, X.; Li, Z.Y.; Wu, J.T. An analytical solution for excited pile vibrations with variable section impedance in the time domain and its engineering application. Comput. Geotech. 2016, 73, 170–178. [Google Scholar] [CrossRef]
  13. Schilder, C.; Kohlhoff, H.; Hofmann, D.; Basedau, F.; Habel, W.R.; Baeßler, M.; Niederleithinger, E.; Georgi, S.; Herten, M. Static and dynamic pile testing of reinforced concrete piles with structure integrated fibre optic strain sensors. Proc. Spie 2013, 8794, 47–62. [Google Scholar]
  14. Xu, Z.J.; Liu, J.; Yuan, F. A Novel measurement method of toe debris thickness for bored piles based on one-dimensional wave theory. J. Vibroeng. 2019, 21, 1079–1091. [Google Scholar] [CrossRef]
  15. Wang, C.H.; Su, J.; Wang, G. Model Test Studies of the Vertical Bearing Behavior of Bored Piles with Breakage Defects. Appl. Mech. Mater. 2013, 256–259, 65–70. [Google Scholar] [CrossRef]
  16. Wang, C.H.; An, J.G. A Nonlinear Numerical Analysis of Vertical Bearing Behavior of Bored Pile Foundations Including Defective Piles with Stem Shrinkage. Adv. Mater. Res. 2011, 374–377, 2071–2077. [Google Scholar] [CrossRef]
  17. Neto, O.D.F.; Cunha, R.P.D.; Albuquerque, P.J.R.; Garcia, J.R.; Júnior, O.F.S. Experimental and numerical analyses of a deep foundation containing a single defective pile. Lat. Am. J. Solids Struct. 2020, 17, e270. [Google Scholar] [CrossRef]
  18. Poulos, H.G. Pile Behavior Consequences of Geological and Construction Imperfections. J. Geotech. Geoenviron. Eng. 2005, 131, 538–563. [Google Scholar] [CrossRef]
  19. Yan, Z.; Sun, X.P.; Yang, Z.X.; Fu, D.F. Lateral Bearing Performance of a Defective Pile-Supported Wharf with Batter Piles. J. Waterw. Port Coast. Ocean Eng. 2020, 146, 04020035.1–04020035.13. [Google Scholar] [CrossRef]
  20. Nadeem, M.; Chakraborty, T.; Matsagar, V. Nonlinear buckling analysis of slender piles with geometric imperfections. J. Geotech. Geoenviron. Eng. 2014, 141, 06014014. [Google Scholar] [CrossRef]
  21. Petek, K.; Felice, C.W.; Holtz, R. Capacity analysis of drilled shafts with defects. J. Deep Found. 2002, 256, 1120–1135. [Google Scholar]
  22. Albuquerque, P.J.R.; Garcia, J.R.; Neto, O.D.F.; Cunha, R.P.; Santos, O.F. Behavioral evaluation of small-diameter defective and intact bored piles subjected to axial compression. Soils Rocks 2017, 40, 109–121. [Google Scholar] [CrossRef]
  23. Sang, Y.; Zhao, J.; Duan, F.; Sun, W.; Zhao, H. A novel automatic device to measure deformation inside transparent soil based on DIC technology. Meas. Sci. Technol. 2018, 47, 451–460. [Google Scholar]
  24. Kong, G.; Lu, L. Performances of one new transparent glass soil. Mater. Res. Innov. 2014, 18, S2.537–S2.540. [Google Scholar] [CrossRef]
  25. Xiao, Y.; Yin, F.; Liu, H.; Chu, J.; Zheng, W. Model tests on Soil movement during the installation of piles in transparent granular soil. Int. J. Geomech. 2017, 17, 06016027. [Google Scholar] [CrossRef]
  26. Ding, X.H.; Zhou, W.; Lu, X.; Gao, Y. Physical simulation test of soil-rock mixture from synthetic transparent soil. J. Cent. South Univ. 2018, 25, 3085–3097. [Google Scholar] [CrossRef]
  27. Li, Y.; Zhou, H.; Liu, H.; Ding, X.M.; Zhang, W.G. Geotechnical properties of 3D-printed transparent granular soil. Acta Geotech. 2021, 16, 1789–1800. [Google Scholar] [CrossRef]
  28. Kong, G.Q.; Cao, Z.H.; Zhou, H.; Sun, X.J. Analysis of Piles Under Oblique Pullout Load Using Transparent-Soil Models. Geotech. Test. J. 2015, 38, 725–738. [Google Scholar] [CrossRef]
  29. Xiang, Y.Z.; Liu, H.L.; Zhang, W.G.; Chu, J.; Zhou, D.; Xiao, Y. Application of transparent soil model test and DEM simulation in study of tunnel failure mechanism. Tunn. Undergr. Space Technol. Inc. Trenchless Technol. Res. 2018, 74, 178–184. [Google Scholar] [CrossRef]
  30. Yang, Q.N.; Shao, J.J.; Xu, Z.J.; Yu, M. Experimental investigation of the impact of necking position on pile capacity assisted with transparent Soil Technology. Adv. Civ. Eng. 2022, 2022, 9965974. [Google Scholar] [CrossRef]
  31. Xu, Z.J.; Guo, Z.X. Experimental Study on Bearing Characteristics and Soil Deformation of Necking Pile with Cap Using Transparent Soils Technology. Adv. Civ. Eng. 2021, 2021, 6625556. [Google Scholar] [CrossRef]
  32. GB178-77; Standard for Cement Strength Test. National Bureau of Standards and Metrology: Beijing, China, 1977.
  33. Ezzein, F.M.; Bathurst, R.J. A transparent sand for geotechnical laboratory modeling. Geotech. Test. J. 2011, 34, 590–601. [Google Scholar]
  34. Liu, J.; Iskander, M.G. Modelling capacity of transparent soil. Can. Geotech. J. 2010, 47, 451–460. [Google Scholar] [CrossRef]
  35. Iskander, M.; Liu, J. Spatial Deformation Measurement Using Transparent Soil. Geotech. Test. J. 2010, 33, 314–321. [Google Scholar]
  36. Iai, S. Similitude for shaking table tests on soil-structure-fluid model in 1g gravitational field. Soils Found. 1989, 29, 105–118. [Google Scholar] [CrossRef] [Green Version]
  37. Li, Z.Y. Key Problems Investigation on Non-Destructive Integrity Detection of Piles with Elevated-Cap (Beam); Zhejiang University: Hangzhou, China, 2017; pp. 9–15. (In Chinese) [Google Scholar]
  38. GB50007-2011; Code for Design Building Foundation. China Academy of Building Research: Beijing, China, 2011.
  39. Liu, C.; Tang, X.W.; Wei, H.W.; Wang, P.P.; Zhao, H.H. Model tests of jacked-pile penetration into sand using transparent soil and incremental particle image velocimetry. KSCE J. Civ. Eng. 2020, 24, 1128–1145. [Google Scholar] [CrossRef]
  40. Massarsch, K.R.; Weraell, C. Cumulative lateral soil displacement due to pile driving in soft clay. In Geo-Congress, Sound Geotechnical Research to Practice; Geotechnical Special Publication (GSP230): San Diego, CA, USA, 2013; pp. 463–480. [Google Scholar]
  41. Tian, Y.Q.; Zhou, Z.J.; Dong, Y.Q.; Wang, K.C.; Feng, H.M. Study on the value of side friction of bored pile in loess area considering the influence of length diameter ratio. Arab. J. Geosci. 2021, 14, 2067. [Google Scholar] [CrossRef]
  42. Zhang, Q.Y.; Zhang, Y.; Lin, H.D.; Feng, L. Numerical investigation on bearing capacity of OWT foundation with large diameter monopile under Seismic load. Appl. Ocean Res. 2021, 108, 102518. [Google Scholar] [CrossRef]
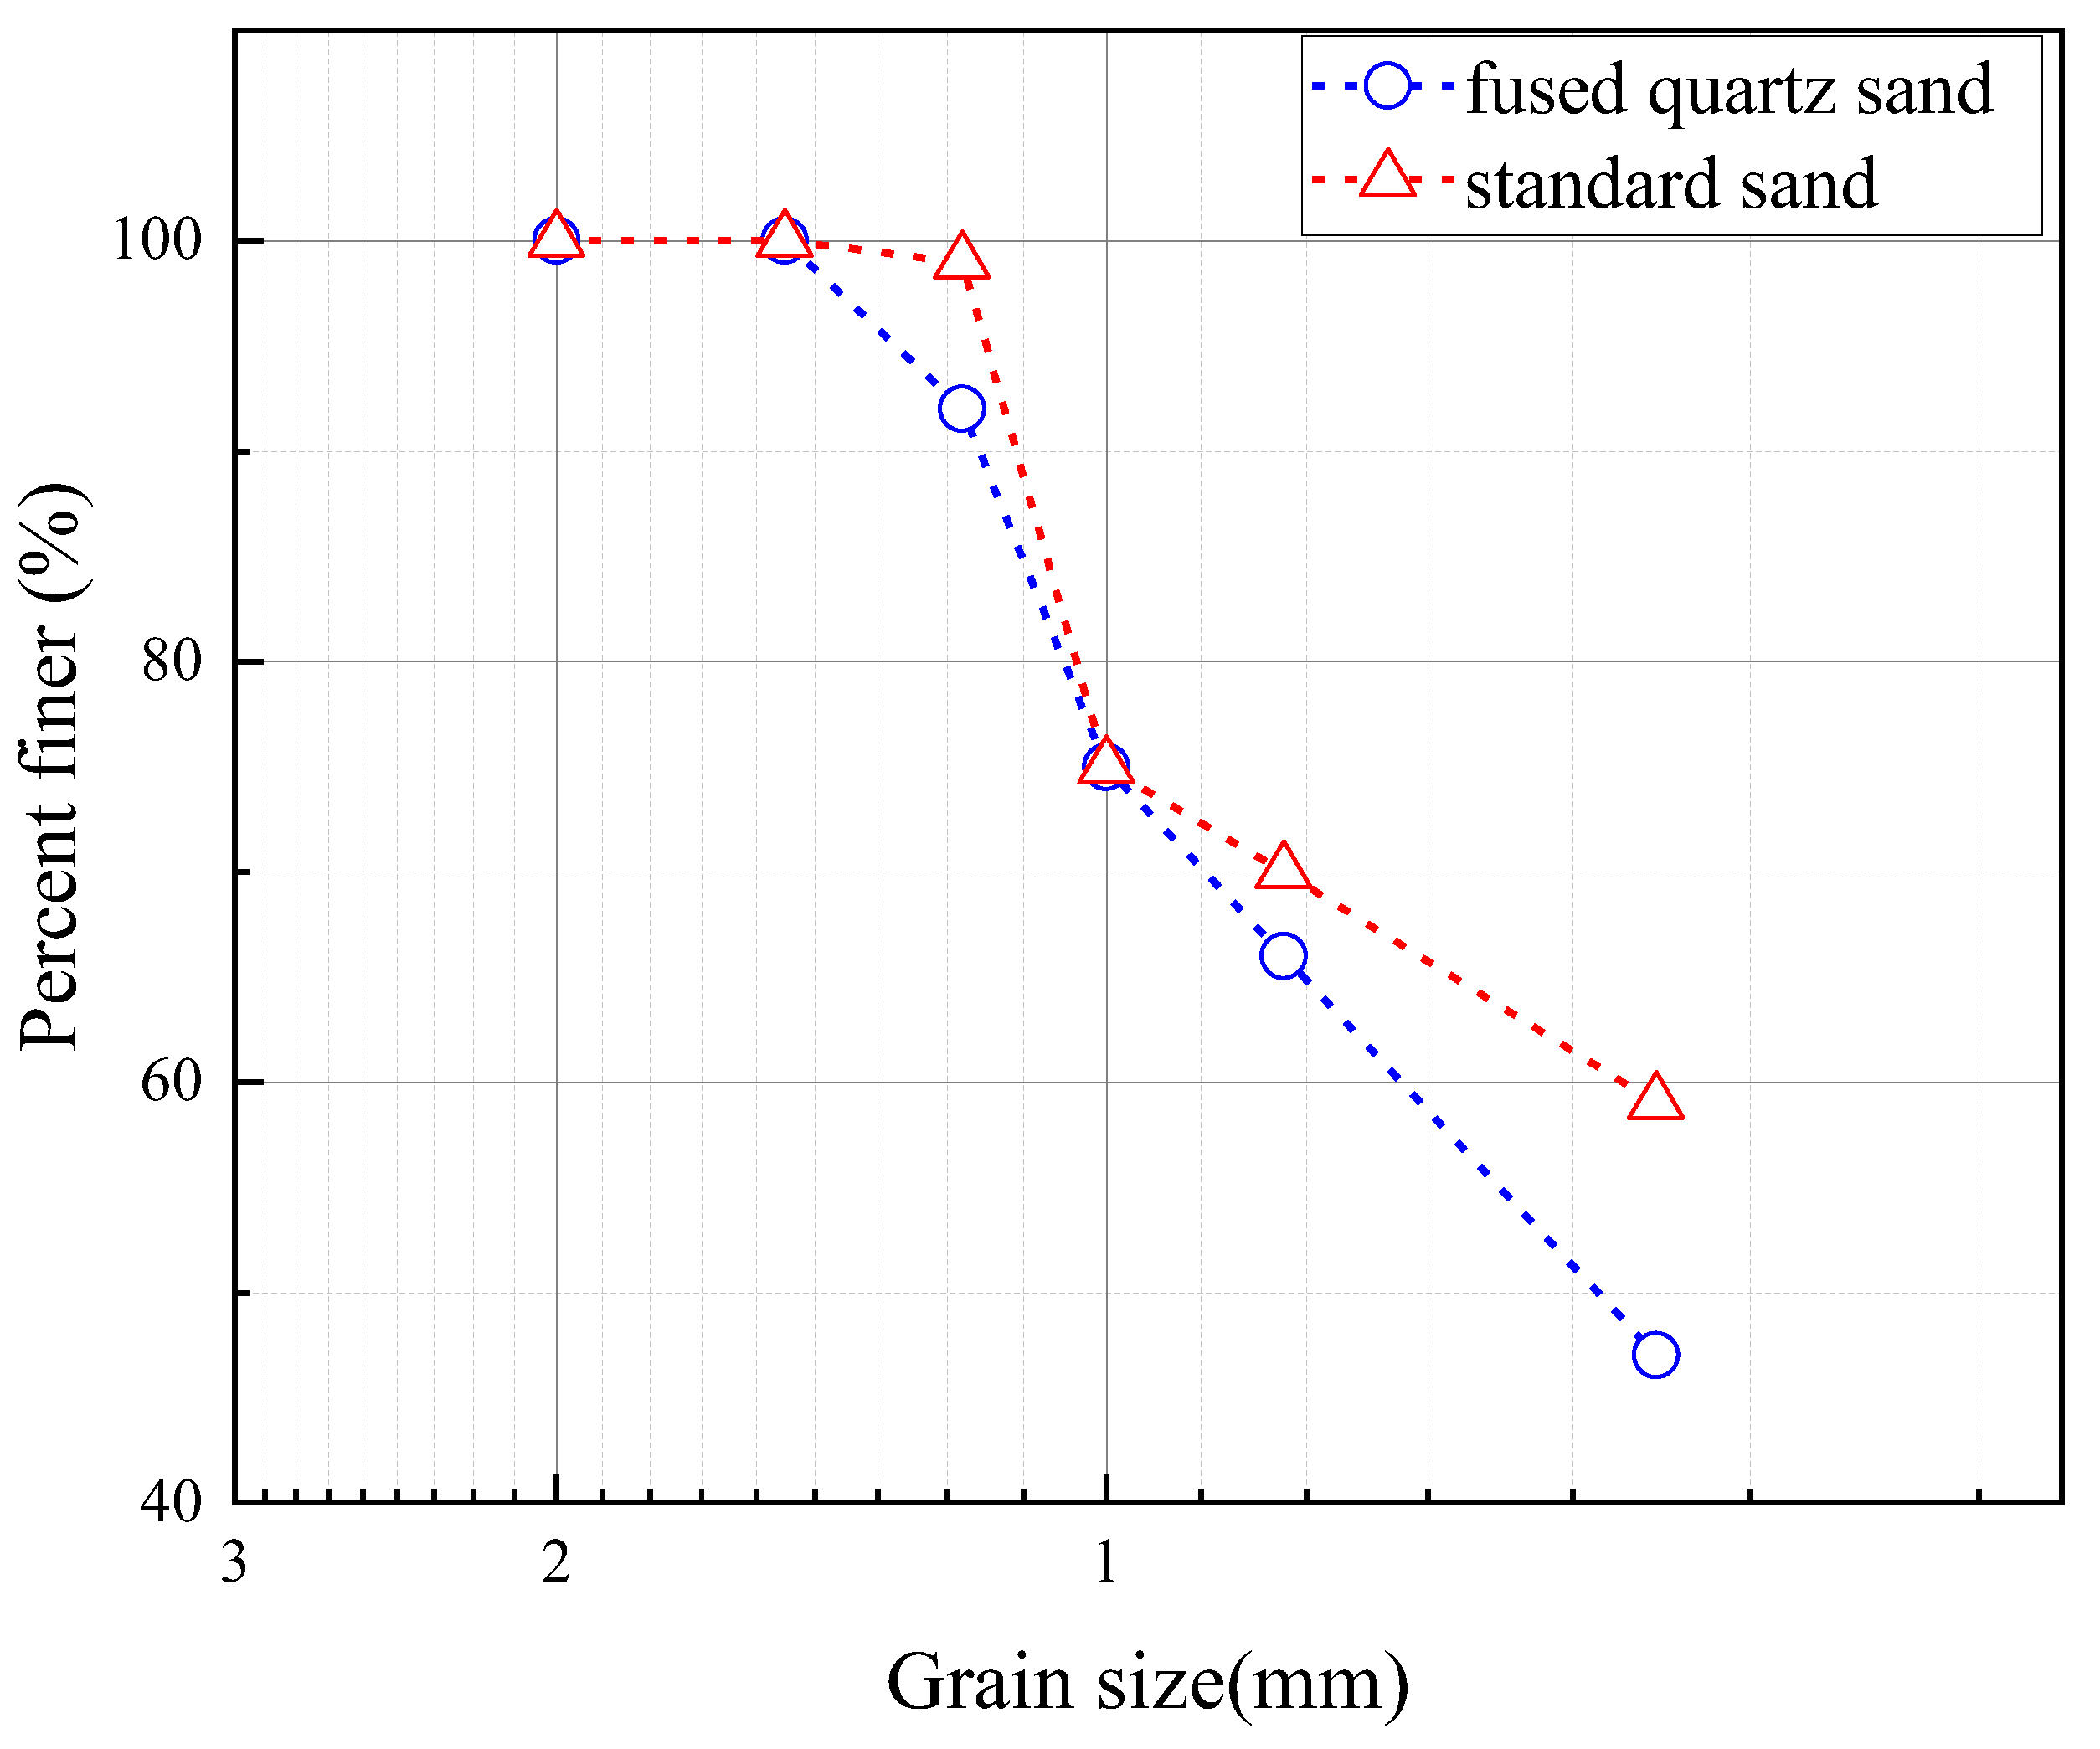
Figure 1. Grain-size curve of fused quartz sand and standard sand.
Sustainability 14 08681 g001
Figure 2. Transparent soil sample.
Sustainability 14 08681 g002
Figure 3. Model piles and necking. Note: S represents 100 mm from the necking to pile end; L, M and S represent 20 mm, 10 mm and 5 mm of the necking length, respectively; W, M and T represent 16 mm, 8 mm and 4 mm of necking diameter, respectively.
Sustainability 14 08681 g003
Figure 4. Experiment system.
Sustainability 14 08681 g004
Figure 5. Speckle image.
Sustainability 14 08681 g005
Figure 6. Displacement vector image.
Sustainability 14 08681 g006
Figure 7. Displacement of measured points on the same horizontal line.
Sustainability 14 08681 g007
Figure 8. Load-settlement curves of piles: (ac) represent that the necking lengths are 20 mm,10 mm and 5 mm, respectively.
Sustainability 14 08681 g008
Figure 9. Relationship between vertical bearing capacity and necking length.
Sustainability 14 08681 g009
Figure 10. Relationship between vertical bearing capacity and necking diameter.
Sustainability 14 08681 g010
Figure 11. Displacement vector diagram and displacement isoline diagram of soil around intact pile.
Sustainability 14 08681 g011
Figure 12. Displacement vector diagram and displacement isoline diagram of soil around MLW pile.
Sustainability 14 08681 g012
Figure 13. Displacement vector diagram and displacement isoline diagram of soil around MLM pile.
Sustainability 14 08681 g013
Figure 14. Displacement vector diagram and displacement isoline diagram of soil around MLT pile.
Sustainability 14 08681 g014
Figure 15. Displacement vector diagram and displacement isoline diagram of soil around MMW pile.
Sustainability 14 08681 g015
Figure 16. Displacement vector diagram and displacement isoline diagram of soil around MMM pile.
Sustainability 14 08681 g016
Figure 17. Displacement vector diagram and displacement isoline diagram of soil around MMT pile.
Sustainability 14 08681 g017
Figure 18. Displacement vector diagram and displacement isoline diagram of soil around MSW pile.
Sustainability 14 08681 g018
Figure 19. Displacement vector diagram and displacement isoline diagram of soil around MSM pile.
Sustainability 14 08681 g019
Figure 20. Displacement vector diagram and displacement isoline diagram of soil around MST pile.
Sustainability 14 08681 g020
Figure 21. Necking is filled by surrounding soil.
Sustainability 14 08681 g021
Figure 22. Friction on the soil interface.
Sustainability 14 08681 g022
Figure 23. The displacement of MLT pile before and after loading.
Sustainability 14 08681 g023
Table 1. Physical and mechanical parameters of transparent soil.
CuCcρd/(g·cm−3)ρdmax/(g·cm−3)ρdmin/(g·cm−3)γ/(kN·m−3)
61.3541.4381.4811.2392.51
Publisher’s Note: MDPI stays neutral with regard to jurisdictional claims in published maps and institutional affiliations.