1. Introduction
Global trade contributes one-fifth of the world’s GDP. As more and more countries participate in global value chains (GVCs), the flow network of production factors becomes increasingly complex [
1]. While promoting economic prosperity, GVCs have created a large number of jobs, especially in developing economies [
2]. The export-oriented trade strategies implemented by developing countries such as China and India have given full play to the advantages of cheap labor in their own countries. Lower production costs create greater market demand for their products and services, which in turn, generates more employment. Therefore, it is generally believed that the liberalization of export trade has had a positive impact on employment in developing countries [
3,
4].
However, recently, trade protectionism has begun to rise in some regions, such as the Sino-US trade war [
5,
6] and Brexit [
7]. In particular, since 2020, the COVID-19 epidemic has spread globally. To curb the spread of the virus, many regions have imposed strict lockdown measures [
8], and many countries and cities set up excessive import tariffs or non-tariff barriers to enhance the competitiveness of local products [
9]. The freedom of global trade has been greatly hindered. In this context, we question how the employment impact of trade liberalization will change, and whether it will lead to severe unemployment in developing economies. This work aims to study this issue.
Previous studies have only explored the impact of regional trade restrictions on individual participating countries but rarely dealt with the employment impact of trade lockdown on a global scale. To explore the difference between the trade employment impacts on developing and developed countries, we establish an accounting model for global trade-related employment based on the multi-regional input–output model (MRIO). The two scenarios of normal trade and restrictive trade are set up to determine how protectionism might change this effect. Specifically, at first, we established the employment flow networks induced by global trade and discussed the countries’ trade-related employment and the evolution from the industry level and trade pattern level. Secondly, a comparative analysis of countries’ employment under the two scenarios is carried out to discuss the impact of trade lockdown. The impact mechanism is also discussed from the perspective of trade patterns and sectors.
The rest of the study is arranged as follows. The second section systematically sorts out and reviews the relevant literature and proposes the main contributions of this study. The third section introduces the technical route and data sources, including the MRIO model and the trade-employment impact accounting model. The fourth section discusses the employment impact of trade liberalization and trade lockdown from the perspective of trade patterns and sectors. The fifth section is the conclusion and limitations of this study.
2. Literature Review
Scholars have been exploring the impact of international trade on employment since the early 20th century. Trade liberalization is the result of a market economy. Hayek et al. pointed out that the advantage of the free market is that it provides people with the greatest degree of freedom to use the information that only they have [
10]. He criticized European-style conservatism and believed that too much government intervention could lead to a crisis [
11]. Keynes linked foreign trade and employment theory and believed that economic growth and employment increases caused by foreign trade would have a multiplier effect through the industrial chain [
12]. A series of empirical studies on developing countries support this conclusion. Krueger was the first to study the employment impact of export-promotion and import-substitution and found that in developing countries, export-oriented trade strategies can take advantage of their cheap labor, expand production and exports, and thus promote the increase in domestic jobs [
2]. The trade policies of these countries greatly affect the scale effect of promoting employment [
13]. Jenkins studied the employment effect of Vietnam’s trade and found that export trade liberalization greatly promoted the development of labor-intensive industries in Vietnam and led to employment, but this positive effect was also offset by import substitution [
14]. Wang et al. studied the impact of foreign investment on China’s labor market and found that foreign investment has a positive impact on employment in China, especially in the service industry [
15]. Chen et al. studied the economic and employment benefits of China’s export trade in 2002 and 2007. It is found that the economic and employment effects of China’s non-processing export trade are greater than that of processing export trade, which is more dependent on imported intermediate inputs [
16]. Empirical studies on developed countries have shown inconsistent conclusions. Greenaway et al.’s research on the UK from 1979 to 1992 showed that trade increased domestic productivity in the UK, but reduced the demand for labor, and import competition may increase unemployment in the short term [
17]. Katrin and Winkler studied the impact of trade integration between China, Eastern Europe, and Germany on employment and found that regional trade freedom exacerbates labor income inequality [
18]. The research on the employment effect of US trade found that the increase in employment brought about by US export trade basically offset the negative impact of China’s import competition [
19,
20]. Ricardo’s trade theory of comparative advantage explains the basis and gains from trade. Under the free-trade scenario, the domestic labor cost of imported goods is generally higher, and the domestic labor cost of exported goods is generally lower. Of course, this is not absolute, because, in addition to labor, a comparative advantage is also reflected in factors such as technology costs and environmental costs [
21]. Therefore, it can be seen that the impact of trade on employment in different countries is different. Export trade can drive the increase in domestic employment, while import trade can offset this effect to a certain extent [
22].
The employment impact of trade largely depends on trade policy. In recent years, the employment impact of trade patterns evolution and the complexity of global value chains has also attracted widespread attention from scholars [
23]. China’s entry into the WTO has promoted the prosperity of global trade, and the competition effect and scale effect brought about by it also have a significant impact on the labor market of some countries [
24,
25]. He et al. used micro-survey data to reveal the impact of the Sino-US trade war on Chinese enterprises’ employment needs and found that industries facing higher tariffs were greatly affected, and the jobs provided were significantly reduced [
26]. Some scholars have also studied the employment impact of the Sino-US trade war from a macro perspective. Li and Whalley pointed out that the US trade lockdown measures led to an increase in the demand for domestic products, but this effect was passed on to the service industry due to the increase in value, which eventually led to the loss of manufacturing employment [
27]. Ciuriak et al. specifically quantified the potential impact of steel and aluminum tariffs set by the United States [
28]. Carvalho et al. pointed out that the trade war has caused welfare losses to both China and the United States [
29]. At the same time, as production becomes more fragmented, the network of global value chains becomes more complex, with more complex employment implications. The impact mechanism of intermediate product outsourcing and final product outsourcing on the labor market is different [
30]. The production of intermediate goods in the value chain can increase the labor demand of downstream industries [
31]. Szymczak et al. systematically studied the relationship between global value chains and labor markets and found that the employment-promoting effect of exports is especially reflected in the trade of intermediate products [
32]. Moreover, the impact of trade on the employment of countries is closely related to their position in the value chain. Less-developed countries are located downstream of the value chain, and the positive impact of trade on their employment is very weak [
33]. Most of the current research on the impact of trade lockdown on employment focuses on the Sino-US trade war, and very few studies involve global or developing economies. In addition, the process of globalization has made the value chain a complex network, and it is difficult for regional research to quantify the overall impact and impact mechanism.
Input–output models are widely used to measure the economic, social, and environmental impacts of global trade. For example, Wiedmann et al. point out that a multi-regional input–output model can make it possible to map the social impact of global trade, with the general direction of this impact flowing from developed to developing countries [
34]. Yang et al. calculated the embodied labor flow in the Asia–Pacific trade network based on the MRIO model and found that the social impact of trade in the region is uneven [
35]. Feenstra et al. quantified the impact of China’s participation in the global supply chain on the U.S. job market based on a multi-regional input–output model and found the key role of trade in intermediate goods [
36]. In addition, the model is also able to simulate trade lockdown scenarios in two ways. The first method assumes that exports are eliminated and import demand is replaced by domestic goods and services; that is, “total substitution”. Using this method, Xu et al. measured the sustainability performance of developed and developing countries under trade and no-trade scenarios, covering multiple social indicators to measure the impact of trade freedom [
37]. The second method assumes that exports are cancelled, and domestic technology replaces foreign technology used to produce imported goods, that is, ‘technology substitution’ [
38]. This method has been widely used to study the economic, social, and environmental impacts of trade-restrictive measures, and most of the indicators of the social dimension are employment [
39,
40]. This study covers global economies, with large technological differences between countries. In the case of complete trade lockdown, the substitution of domestic technology for importing a country’s technology will inevitably bring about errors caused by differences in productivity levels. Therefore, the second hypothesis is more realistic than the first and suitable for this study.
Therefore, the contribution of this paper includes two aspects. First, most current research focuses on the local social impact of regional tariffs and trade restrictions, and few studies quantify the employment impact of global trade lockdown. This study aims to address this reality in order to provide policy makers with reference information on the social impact of trade lockdown. Second, this study is the first to build a global trade-related employment accounting model based on a multi-regional input–output model. The model can simulate the induced employment of various trade patterns under the free trade and trade lockdown scenarios. This provides a methodological reference for related research.
4. Results and Discussion
4.1. Trade-Related Employment
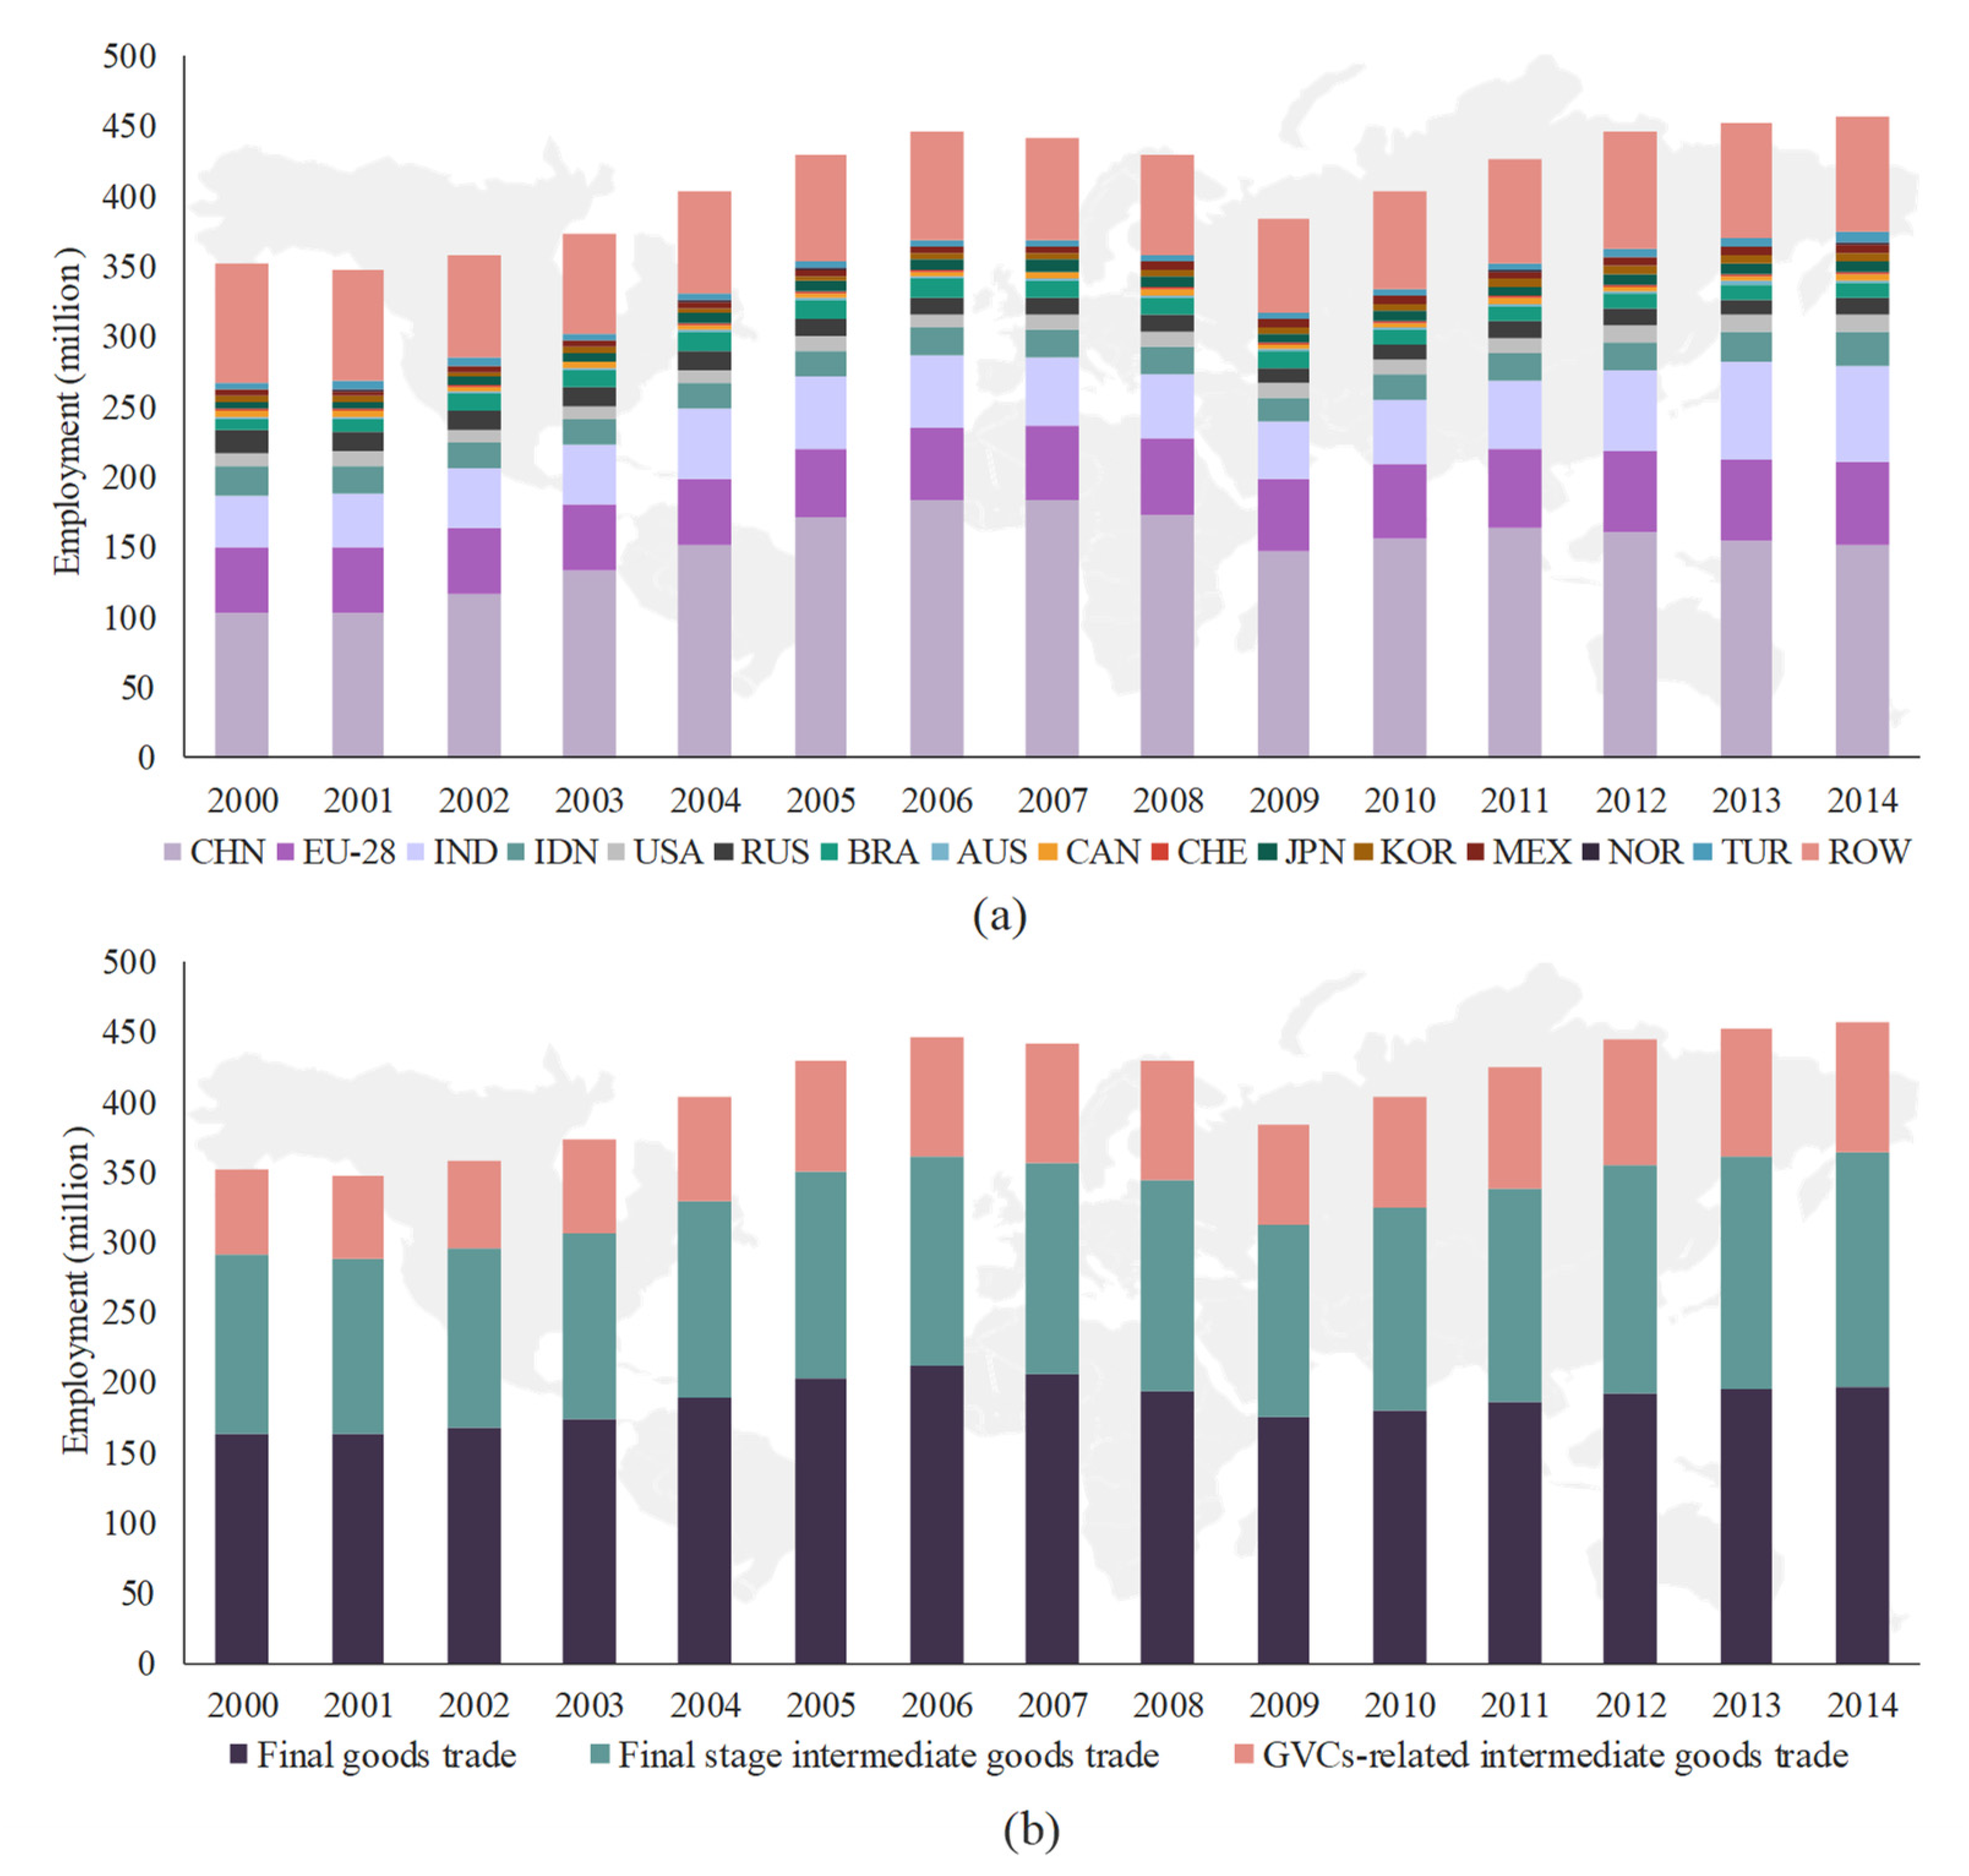
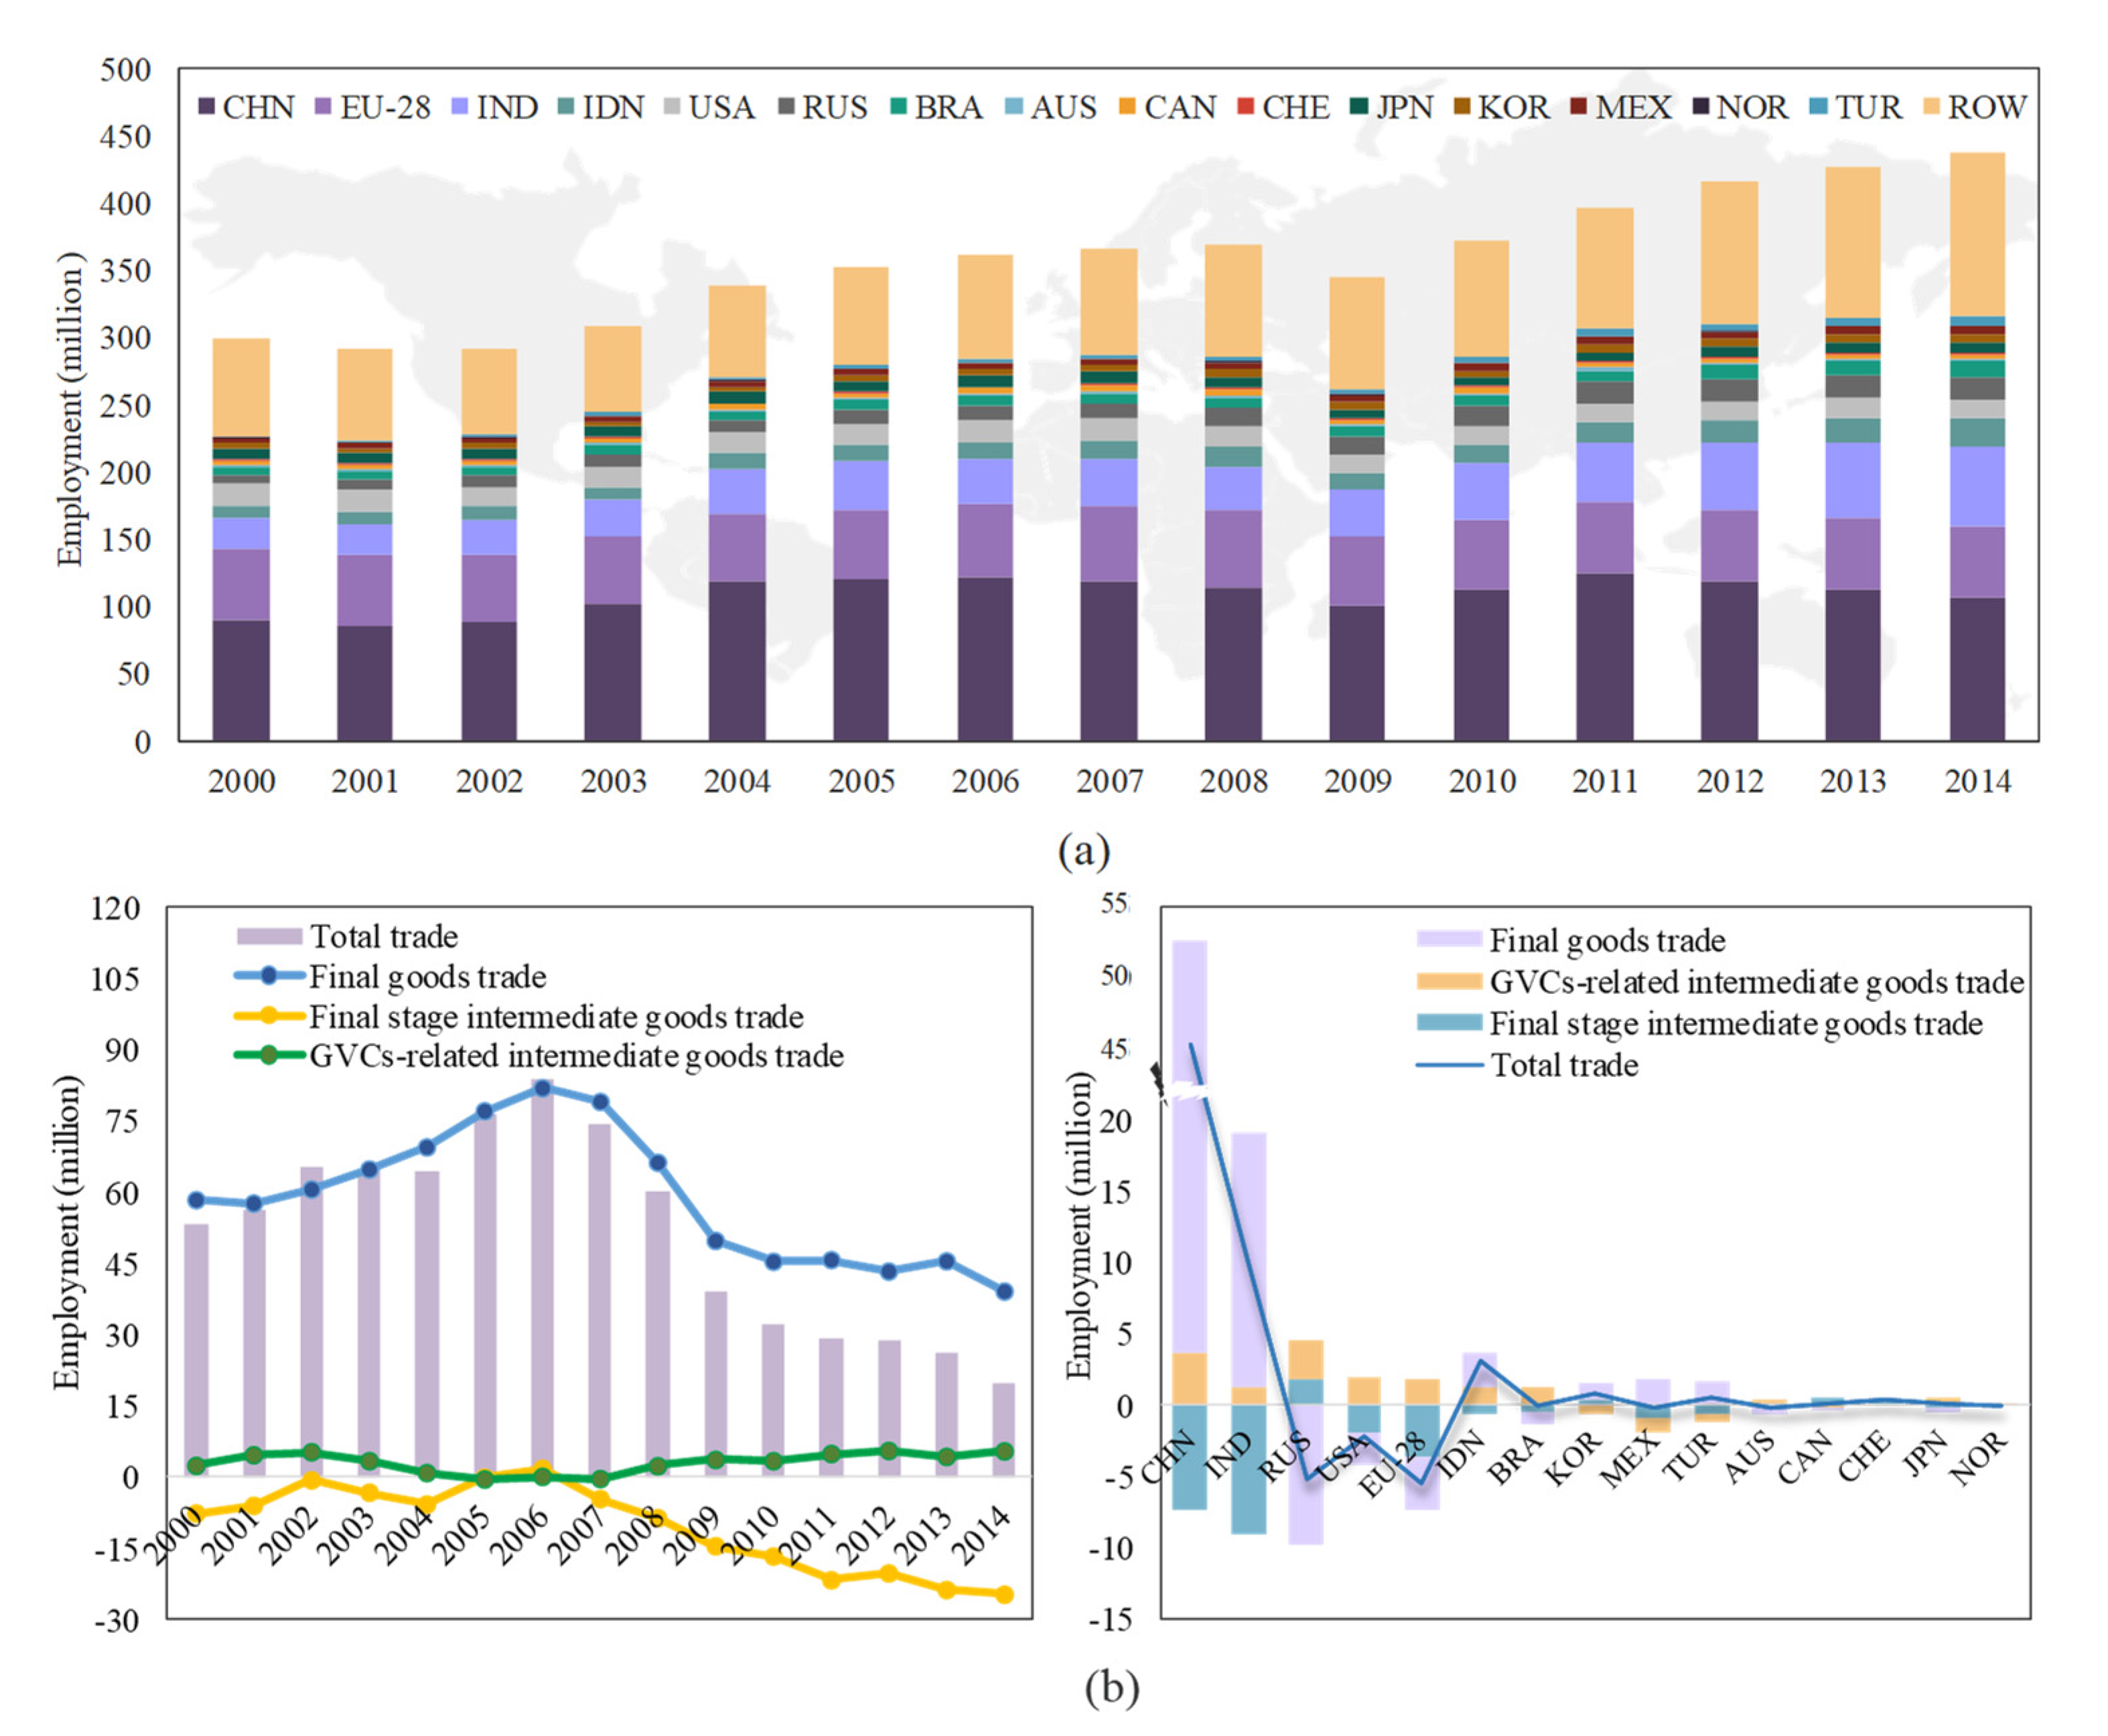
With the continuous development of global value chains, more than 15% of the world’s labor is engaged in value chain-related production and service activities. In 2006, this proportion reached 18.76%. This section analyzes the composition of trade-induced employment. As shown in
Figure 1, between 2000 and 2014, the size of global trade-related employment generally expanded, and only fluctuated during the financial crisis. In 2000, trade-related employment was 351.79 million and reached 445.44 million in 2006, with an average annual growth rate of approximately 4.05% during this period. Since then, global trade has begun to tighten, multinational companies have gradually laid off employees, and the scale of global trade-related employment has gradually shrunk. In 2008, the financial crisis broke out and spread globally, which brought the lowest point of trade-induced employment in 2009 at 383.17 million. Since then, as the trade situation has improved, its employment impact has gradually increased. In 2014, the number of trade-related employment was 457.14 million.
From the perspective of the composition of trade-related employment, the trade-related employment of the 15 economies covered in this study accounts for more than 80% of the global total. Among them, China, the European Union, and India occupy the largest share. As shown in
Figure 1a, in 2006, when the effect of trade employment was the most obvious, the scale of trade-related employment in China, the EU, and India reached 182.95, 51.35, and 52.88 million, respectively, accounting for 41.07%, 11.53%, and 11.87% of the global total. The main reason for this is the large trade volume of these countries. China and India are both populous countries, and most developed manufacturing is labor-intensive.
The three trade patterns play different roles in the global employment scale. Among them, the trade of final goods leads to the largest amount of employment, followed by the trade of final-stage intermediate goods, and the trade of GVCs-related intermediate goods. In 2014, the employment numbers caused by these three patterns were 195.75, 168.36, and 93.03 million, accounting for 42.82%, 36.83%, and 20.35%, respectively. With more and more countries participating in international trade, the level of the international division of labor has been continuously improved. The processing of final goods also tends to be specialized. For example, major trading countries such as China and India, relying on their labor cost advantages, are widely involved in the assembly of final goods, which brings a broad employment market. This ultimately leads to a very strong employment effect on final goods’ trade.
Further,
Figure 2 shows the role of the three trade patterns in some major countries, whose trade employment effect is more obvious. Here, the final stage intermediates and the GVCs-related intermediates are collectively referred to as intermediates. It can be seen that China and India show the same characteristics, that is, the amount of employment caused by final goods trades is greater than that caused by intermediate goods trades. With its abundant natural resources, Russia exports a large number of raw materials or primary processed products, so the employment related to trade in intermediate goods accounts for the largest proportion. In developed economies such as the European Union and the United States, the employment impact of intermediate goods trade is slightly higher than that of final goods trades. This is because these countries’ exports are dominated by intermediate goods with higher economic value added. In general, it can be seen that most of the trade employment effect of developing countries comes from the export of final goods, while most in developed countries come from the export of intermediate goods.
4.2. Employment Flows Embodied in Trades
This section provides a detailed analysis of the employment flows induced by global trade.
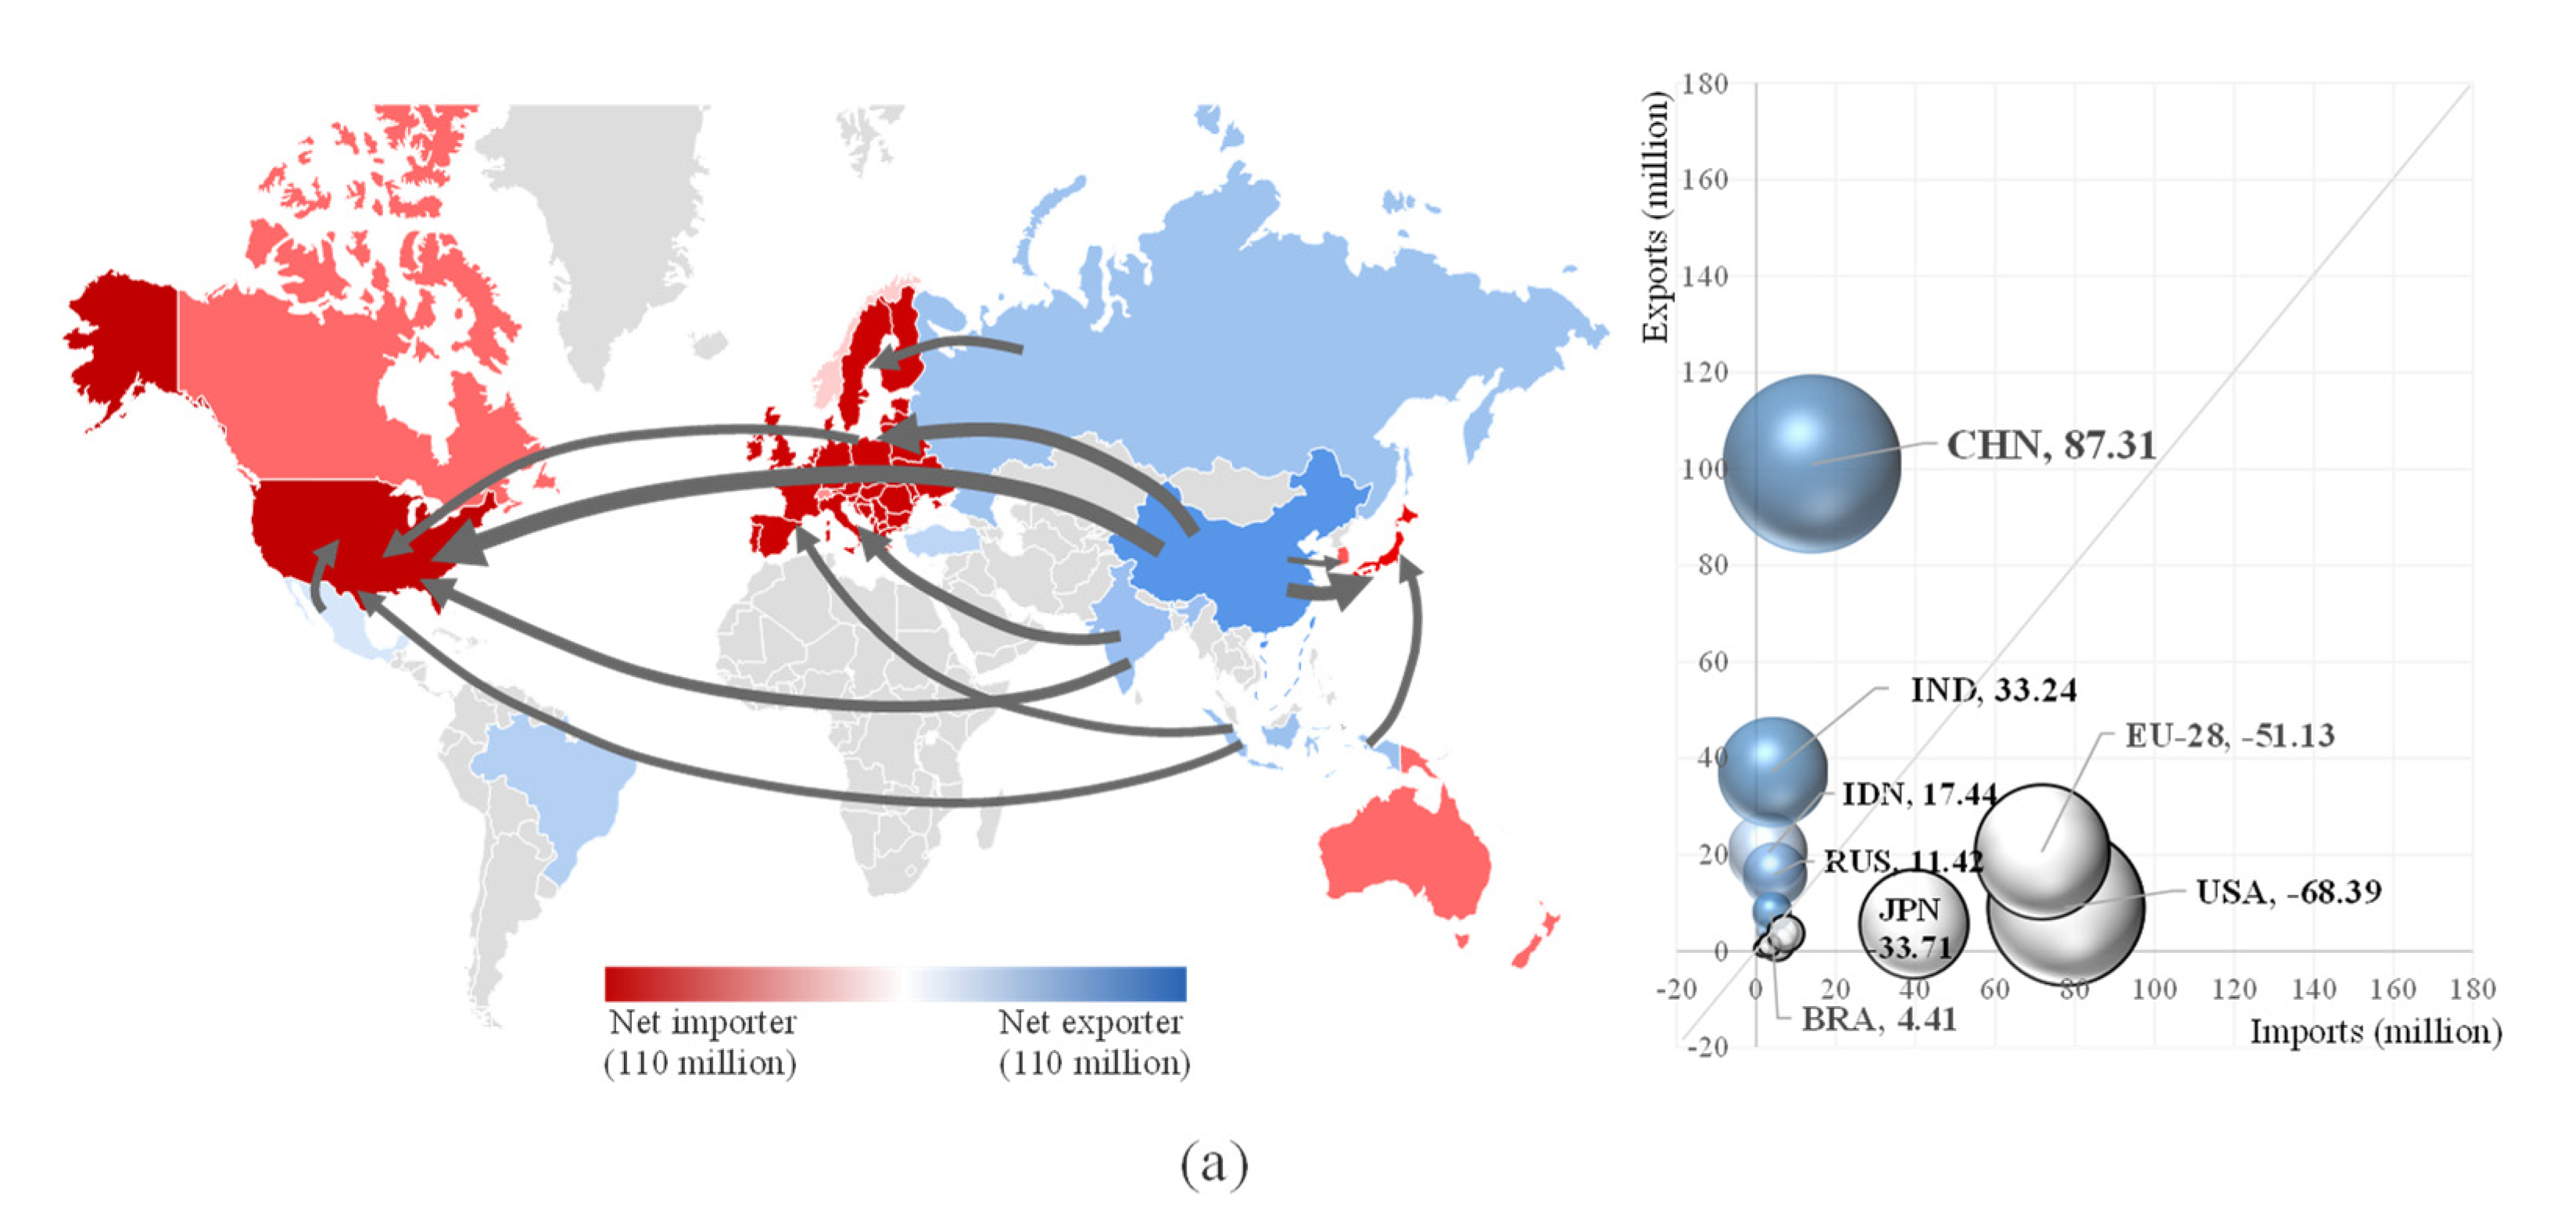
Figure 3 shows the main flows in 2000 (a) and 2014 (b). The flows represented by the arrows in the map on the left cover the employment flows of greater than 3 million people embodied in trade, and the colors of the regions represent the roles of the economies. Net importers of embodied employment are marked in red and net exporters are marked in blue. The bubble chart on the right shows the value of net exports (blue, positive) and net imports (colorless, negative) by country.
In 2000, there were 351.79 million people worldwide working for the production of goods and services along global value chains. As each country’s role in the global value chain is different, the employment induced by their imports and exports is also different. From the flow map in
Figure 3a, it can be seen that the most important flow of employment related to international trade is from developing countries such as China and India to developed countries such as the EU and the United States. On the one hand, export trade activities have brought a lot of employment opportunities to developing economies; on the other hand, the relatively cheap labor force in developing countries has also saved a great deal of production costs for developed countries. In 2000, 21.71, 17.33, 17.48, and 3.51 million employments were embodied in exports of goods and services from China to the US, EU, Japan, and Korea. There are 9.25 and 8.70 million embodied employment flows from India to the EU and the US. In addition, there are also flows to the US from the EU, Indonesia, and Mexico. Overall, in 2000, the United States was the largest net importer of embodied employment, with net imports of 68.39 million people. The EU is second with a net import volume of 51.13 million people. Japan again. The largest net exporter of embodied employment was China, with net exports of 87.31 million people. India, Indonesia and Russia followed.
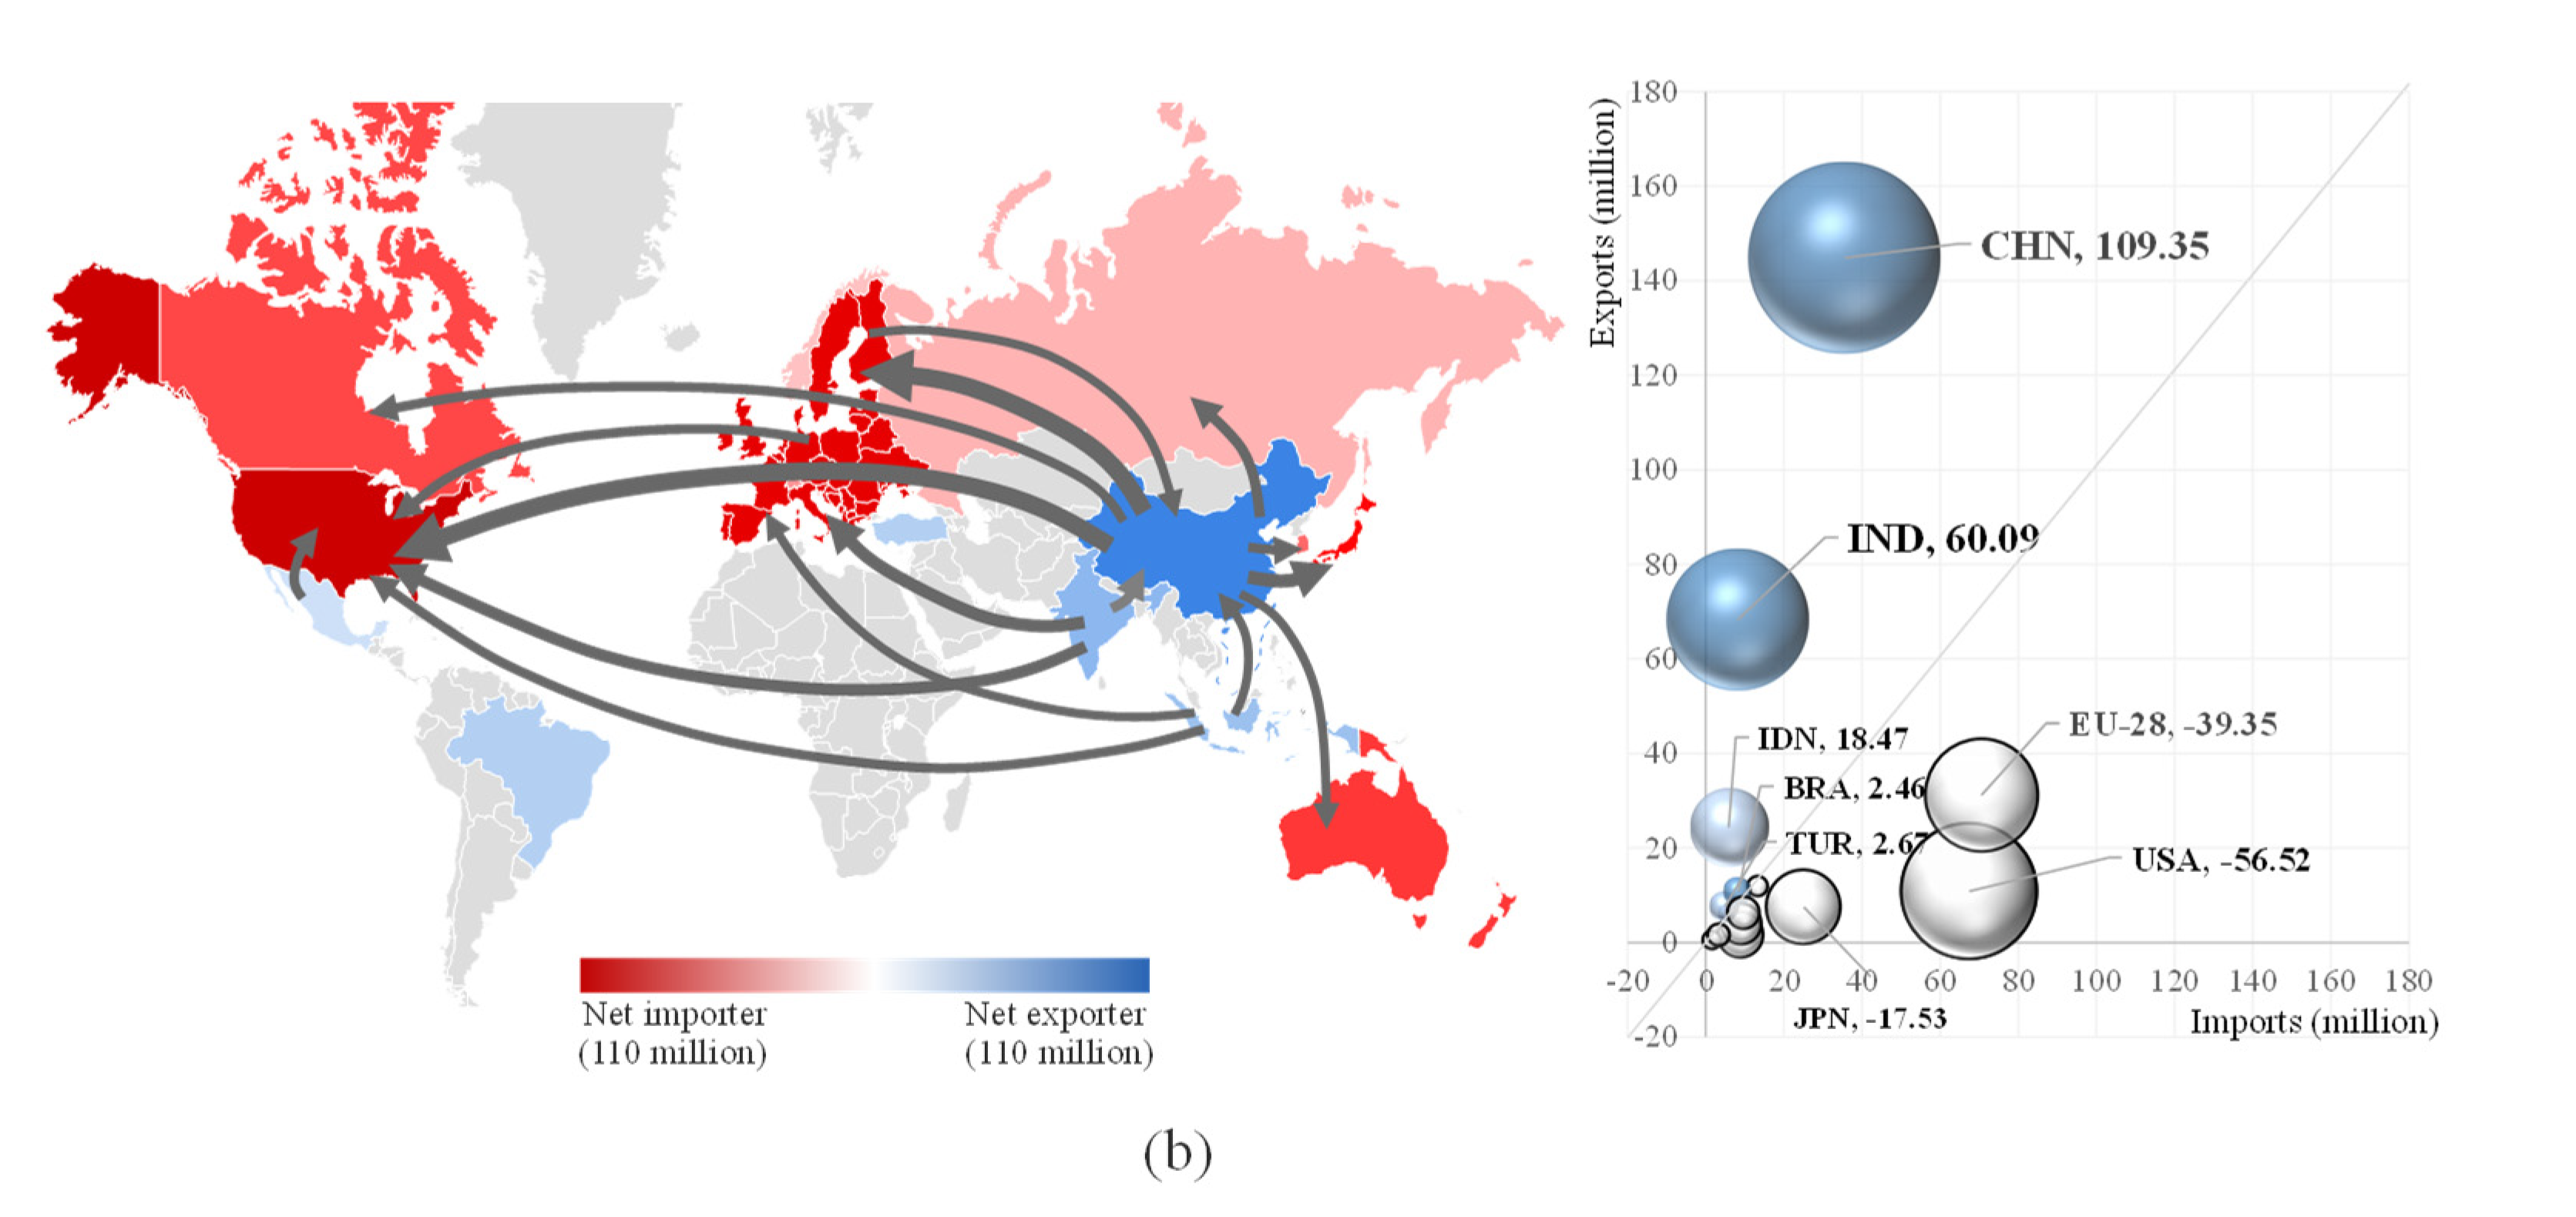
Between 2000 and 2014, as the scale of global trade continued to expand, the employment network embodied in trade also became more complex. As can be seen from
Figure 3b, compared with 2000, the most important feature of the flow distribution in 2014 is that China’s role has become more diversified. Except for the EU, the United States, and Japan, China’s embodied employment export destinations also added Canada, Australia, and Russia. China’s imports of embodied employment have expanded. In 2014, embodied employment of 5.19, 3.16, and 3.07 million people flowed into China from the EU, India, and Indonesia, meeting China’s needs for various goods and services. From the bubble chart on the right side of
Figure 3b, we can see that the distribution of net exporters and net importers of embodied employment in 2014 is basically the same as in 2000. China and India remained the largest net exporters of labor, with net exports of 109.35 and 60.09 million people, respectively. The United States and the EU remained the largest net importers of labor, with net imports of 56.52 and 39.35 million people, respectively.
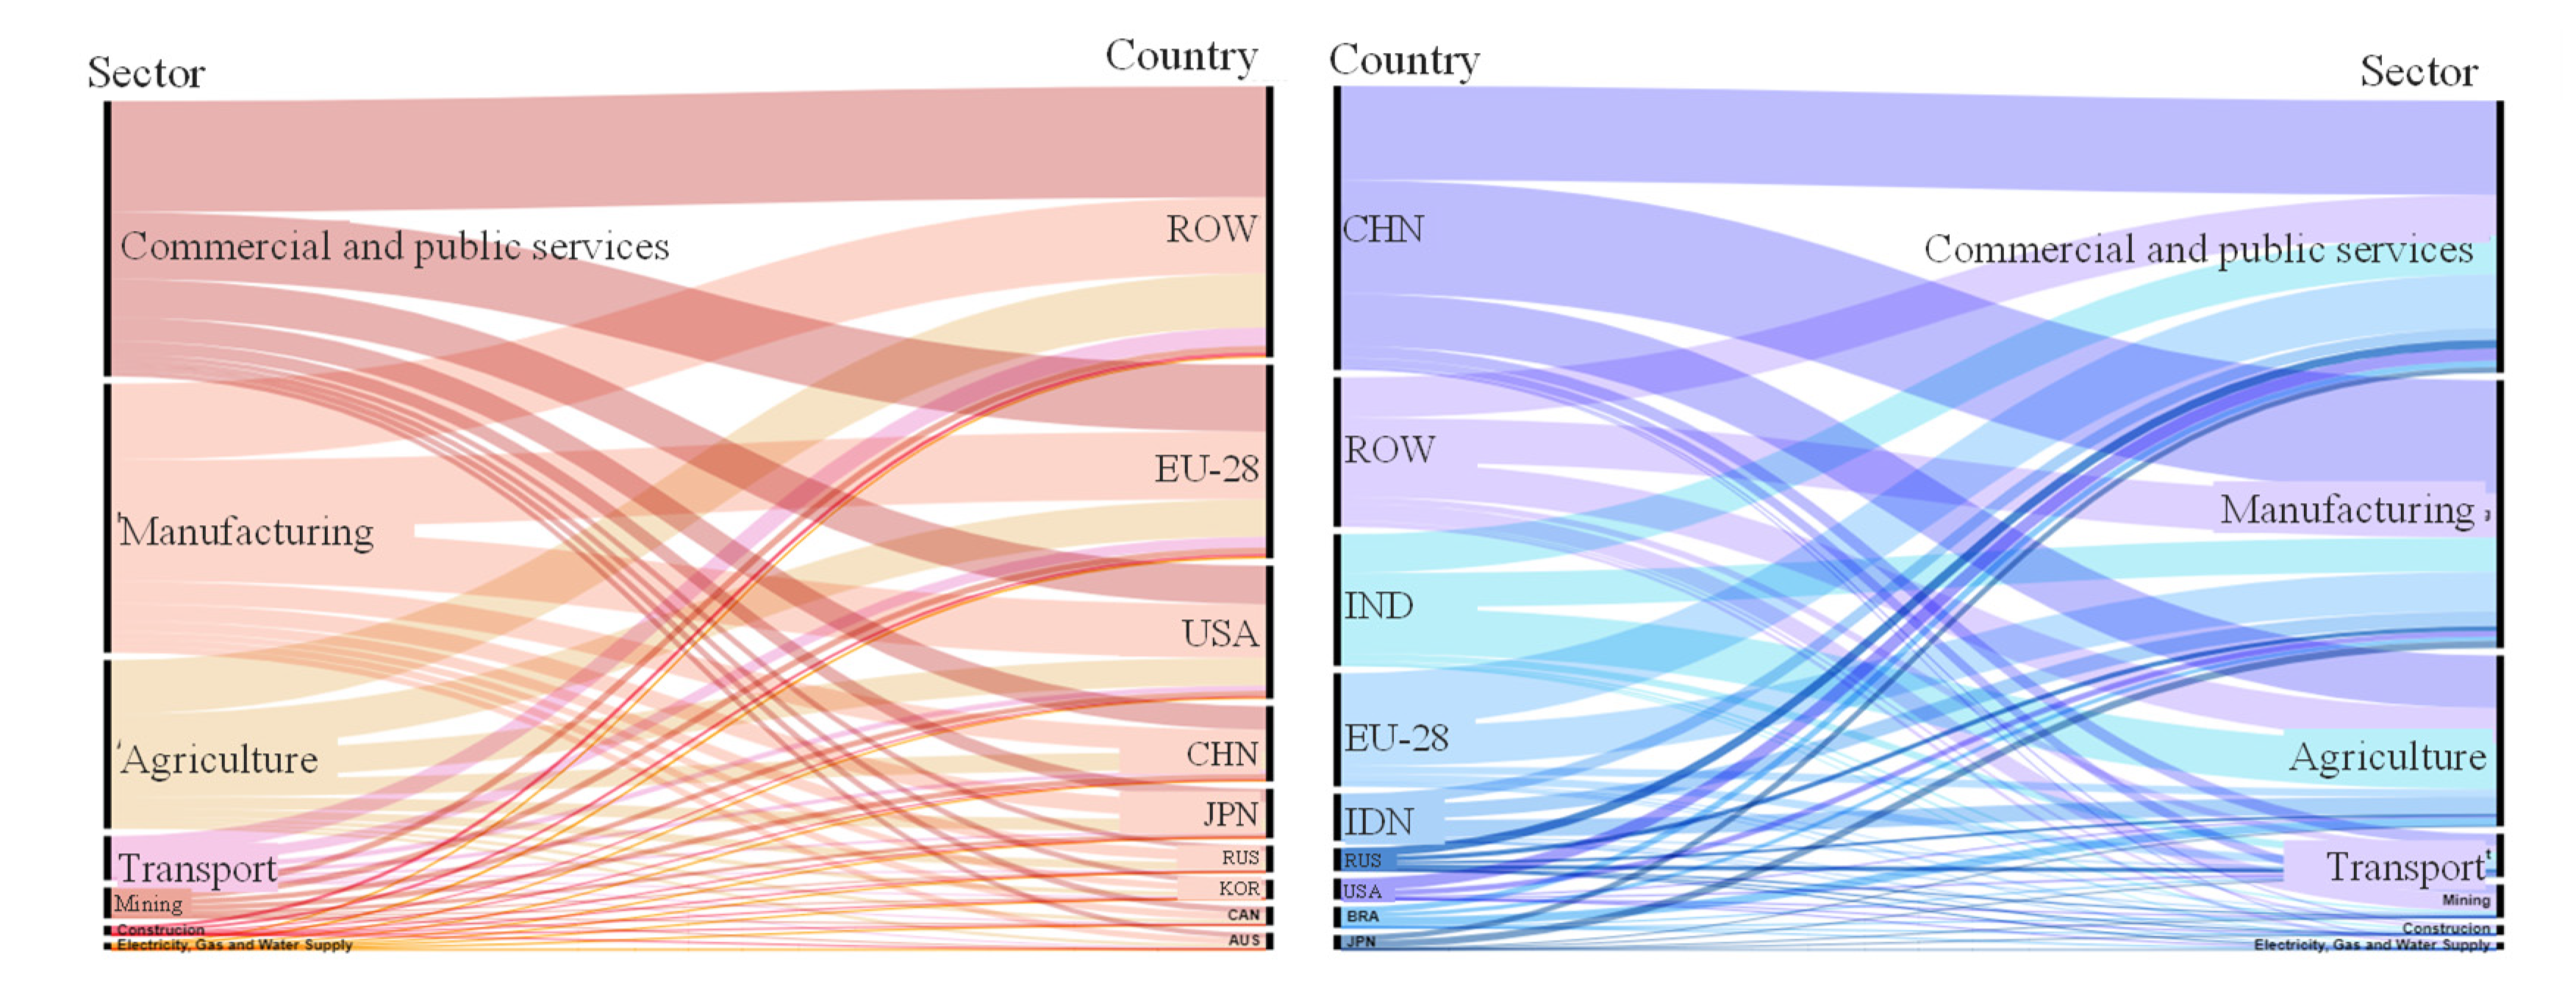
Further,
Figure 4 presents the industry distribution of the above-mentioned major employment flows. The Sankey diagram on the left shows the source industries of each economy’s embodied employment imports, and the Sankey diagram on the right shows the industries where their embodied employment exports go. Commercial and public service, Manufacturing, and Agriculture are the most important sectors involved in the embodied employment trade. Manufacturing, Commercial and public services, and Agriculture accounted for 40.6%, 26.1%, and 22.4% of the total U.S. embodied employment imports, respectively. In the EU, the three industries also have a similar distribution. China is the largest exporter of embodied employment, and manufacturing is the main channel for labor outflows. There are 34.71 million people working for manufactured goods exports, accounting for 33.85% of the total employment embodied in China’s exports. Commercial and public services and Agriculture accounted for 30.49% and 26.38%, respectively.
4.3. Trade Lockdown’s Impact on Countries’ Employment
Considering the rising trend of trade lockdowns in recent years, this section presents the changes in the employment of various countries under the trade lockdown scenario. As shown in
Figure 5, the upper histogram presents the temporal evolution of global relative employment as the trade-related industries return. In this no-trade scenario, labor originally working for exporting goods is replaced by labor working for import-substituting products. Relative employment refers to the amount of labor that produces import-substituting goods. The lower column-line shows the difference in employment under the two scenarios, which reflects the employment impact of trade lockdown and is subdivided into the impact of three trade patterns. The graph on the right shows the employment impact of trade lockdown on participating countries.
As shown in
Figure 5a, under the scenario of trade lockdown, the global related employment in 2000 was 298.64 million, of which China, the EU, and India accounted for 30.23%, 17.80%, and 7.20%, respectively. In a normal scenario, global trade-related employment is 351.79 million. This shows that trade has led to an increase in employment, while trade lockdown will reduce some jobs. In terms of technology and the division of labor in 2000, the positive impact of global trade on employment was 53.15 million people. From the bar chart on the left of
Figure 5b, it can be seen that from 2000 to 2014, the impact of trade on the global job market has been positive, and this effect reached a peak in 2006. In 2006, compared to the no-trade scenario, trade freedom increased global employment by 83.77 million people. Since then, with the financial crisis and the contraction in global trade, the positive impact of trade on employment has gradually diminished to 19.86 million in 2014.
As far as the three trade patterns are concerned, the positive impact of final goods trade on employment is the most obvious. As shown in
Figure 5b, trade in final goods dominates the total impact of trade. A very small part of this is offset by the negative impact of trade in final-stage intermediate goods. The impact of GVCs-related intermediate goods trade is not obvious. In 2000, trade restrictions would cause the loss of 53.15 million jobs worldwide, of which the restrictions on final goods trade would reduce it by 58.42 million, and the final-stage intermediate goods trade would increase it by 7.65 million. The role of trade in GVCs-related intermediate goods is weak. Most of the final products on the global value chain are processed and assembled before they flow to the final consumer countries. This process requires a lot of labor. Therefore, changes in the trade situation have a greater impact on this link.
As mentioned earlier, the current employment flows embodied in the global trade of final goods are mainly exported from developing countries to developed countries. The histogram on the right of
Figure 5b also presents this finding. Free trade has greatly increased jobs in China and India. The employment reduction brought about by the trade lockdown has the greatest negative impact on these two countries. Taking 2014 data as an example, trade lockdown will cause a total loss of 19.86 million jobs worldwide. Among them, the reduction of employment in China and India reached 45.24 million and 10.10 million. The negative impact of restrictions on trade in final goods was most pronounced in China and India, which eliminated 48.97 and 17.87 million jobs, respectively. Trade affects countries differently, with free trade reducing labor requirements by 5.52 million and 2.23 million in the EU and US, respectively. This effect is mainly driven by trade in final goods and final-stage intermediate goods. These countries move labor-intensive manufacturing and assembly processes to developing economies, where cheap labor is available, thereby reducing their own costs. When protectionist measures are implemented, these industries would flow back to developed economies, increasing the demand for local labor.
4.4. Trade Lockdown’s Impact on Sectors’ Employment
Because the industry structure of economies differs, the employment impact of the evolving trade situation is also different. On the basis of the aggregate analysis, this section presents the key driving sectors of the employment impact.
Figure 6 shows the sectoral impact of the three trade patterns on employment across economies. The bar values represent the difference in employment for that sector of the economy under the free trade and no-trade scenarios, representing the impact of free trade. For example, participation in free trade increased employment in China’s manufacturing sector by 24.19 million.
From the value of the horizontal axis, the key sectors of the employment impact of each trade pattern are different. The final goods trade mainly produces employment-promoting effects through manufacturing, followed by agriculture and commercial and public services. The impact of this pattern on each country is also different. The free export of final goods has played a role in promoting employment in various industries in China, with the most obvious positive impact on manufacturing and commercial and public services, which added 24.19 million and 11.39 million jobs, respectively. China’s manufacturing industry is an important channel for labor outflows, and thus, is the sector most vulnerable to the trade situation. Moreover, the positive impact of free trade in final goods in India is mainly reflected in agriculture and commercial and public services, which added 6.92 and 6.52 million jobs, respectively. Conversely, free trade in final products would reduce Russia’s manufacturing sector by 6.80 million jobs, suggesting that in a trade-restricted scenario, the return of manufacturing would bring more jobs to Russia.
The employment impact of the two intermediate goods trade patterns on sectors varies greatly between countries. The final-stage intermediate goods’ trades have the effect of reducing employment in the United States mainly in manufacturing and commercial and public services, with a reduction in employment of 0.87 and 0.78 million, respectively. The effect of this pattern on the reduction of EU employment mainly comes from Commercial and public services, with a reduction of 2.35 million people. Manufacturing and service industries are important channels for labor output from developing economies and labor inflow from developed economies. In the scenario of trade lockdown, the processing and assembly of intermediate products are all completed within the country. Although the results show that trade lockdown can increase employment in developed economies through intermediate goods, it also reflects that in the scenario of free trade, the level of labor division in developed economies’ supply chains needs to be improved.
5. Conclusions
This study aims to explore the employment impact of trade lockdown. We establish a multi-regional input–output model covering global 15 major economies and quantify the evolution and industry distribution of trade-related employment across countries under trade liberalization and trade lockdown scenarios. In addition, we measure the employment impact of multiple trade patterns on countries and explore the impact mechanism of trade lockdown from the perspective of the global value chain.
The findings show that between 2000 and 2014, employment induced by global trades expanded from 351.79 million to 445.44 million. Among the subdivided trade links, the trade in final goods leads to the most employment, followed by trade in final-stage intermediate goods and GVCs-related intermediate goods. The trade-induced employment of the 15 economies covered by this study accounts for more than 80% of the global total, of which China, the European Union, and India account for 41.07%, 11.53%, and 11.87%, respectively. At present, the induced employment mainly flows from developing countries such as China and India to developed countries such as the European Union and the United States. Most of the trade-related employment in developing countries such as China and India is caused by the export of final products, while in developed countries such as the European Union, most of the trade-related employment is caused by the export of higher value-added intermediate products. In the employment network, commercial and public service, Manufacturing, and Agriculture are the most important sectors with embodied employment inflows and outflows.
Upon comparing the results under the trade liberalization and trade lockdown scenarios, it is found that trade lockdown would generally reduce employment in developing countries and increase employment in developed countries. Under the scenario of trade lockdown, China and India would lose 45.24 million and 10.10 million jobs, respectively, while the EU and the US would gain 5.52 and 2.23 million jobs. However, for the world, the impact is negative, with trade lockdown cutting 19.86 million jobs worldwide. Since the processing and assembling of final products are mostly labor-intensive, this link has the most obvious effect on driving employment, so the adverse impact of trade restrictions on this link is the greatest, and only a small part of it is offset by trade in intermediate goods.
Therefore, the trade lockdown advocated by developed countries is rather unfavorable to the global labor market. While ensuring epidemic prevention and control, countries should gradually lower trade barriers and give full play to the role of trade in driving global employment. Developing countries, such as China and India, should take measures to deal with the adverse impact of trade protection on employment: (1) Establish an employment emergency mechanism to deal with trade conflicts as soon as possible to prevent large-scale unemployment and layoffs due to trade conflicts in a short period of time; (2) expand trade channels, reduce foreign trade dependence on a few countries, and promote the diversification of import and export trade links and industries; and (3) the structure of labor-intensive export trade should be changed to accelerate the realization of an innovation-driven, technology-intensive, and resource-saving development pattern.
Inevitably, this study has the following limitations. First, limited by the lag in the update of the input–output table, the selected research interval is from 2000 to 2014. Although the data used are the latest available to meet research needs, they are still relatively old. In future studies, data will be updated with the database to make the findings as relevant as possible to current needs. Second, this study uses the domestic technology assumption to calculate the outcome of the lockdown scenario, which means that in the no-trade scenario, countries use domestic technology to produce the original imported goods. However, the reality is that a country may not have the appropriate technology or resource endowments to make it happen. In future studies, computable general equilibrium models will be used to simulate the effects of various specific trade-restrictive measures.


