Article

Spatial and Temporal Nutrient Dynamics and Water Management of Huanglongbing-Affected Mature Citrus Trees on Florida Sandy Soils

by
Alisheikh A. Atta
1,*,
Kelly T. Morgan
2 and
Davie M. Kadyampakeni
3
1
Southwest Florida Research and Education Center, University of Florida, 2685 SR 29 N, Immokalee, FL 34142, USA
2
Soil and Water Sciences Department, University of Florida, 2157 McCarty Hall, Gainesville, FL 32611, USA
3
Citrus Research and Education Center, 700 Experiment Station Rd., Lake Alfred, FL 33850, USA
*
Author to whom correspondence should be addressed.
Sustainability 2022, 14(12), 7134; https://doi.org/10.3390/su14127134
Submission received: 3 April 2022 / Revised: 3 June 2022 / Accepted: 4 June 2022 / Published: 10 June 2022

Abstract

:
Nutrients are vital for plant growth, development, and aid in disease control because nutrients affect host plant and pathogen interactions. Once a citrus tree is infected with the phloem-limited, Gram-negative bacteria, Candidatus Liberibacter asiaticus (CLas), huanglongbing (HLB; citrus greening), it would fall under threat of survival as the disease has no known control mechanism discovered thus far. The objective of this study was to determine if split soil applications of essential nutrients improve the availability and accumulation, reduce leaching of these nutrients beyond the root zone, and promote root growth and water dynamics of HLB-affected citrus trees in the soil–plant–atmosphere continuum. Split soil applications of three N rates (168, 224, and 280 kg ha−1 year−1) were the main blocks. Micronutrients were randomly applied to the sub-blocks assigned in a split-split plot design, applied in three splits annually. The micronutrients were applied to foliage and soil as follows: foliar only 1× (1×), foliar 1× and soil-applied 1× (2×), and foliar 1× and soil-applied 2× (3×)× (1× = 9 kg ha−1 year−1 of Mn and Zn to each foliar and soil along with 2.3 kg ha−1 year−1 of B). Significant soil NH4-N and NO3-N, Zn, and Mn were retained within the active soil root zone (0–30 cm). Higher soil acidity was detected when trees received the highest micronutrient rate in the upper soil layers (0–15 cm) as compared with the middle (15–30 cm) and the lowest (30–45 cm) soil layers. Fine root length density (FRLD) was significantly lower at the highest micronutrient rates, manifesting root growth negatively associated with high Mn and low soil pH. Invariably, the water dynamics: stem water potential (ψstem), stomata conductance (gs), and sap flow were also negatively affected when trees received foliar 1× and soil 2× (3×) treatment as compared with the other treatments. Split application of nutrients had a significant effect on FRLD growth, retaining soil-applied nutrients within the active root zone, and improved water use efficiency.

1. Introduction

Huanglongbing (HLB) disease has no known control once citrus trees are affected. HLB-affected trees develop symptoms of blotchy mottle of mature leaves, loss of foliage, veinal chlorosis, shortening of internodes, upper canopy twigs dying, lopsided fruits with color inversion, produce aborted seeds, and foliar and premature fruit drop [1,2]. Many of these symptoms have been associated with reduced nutrient concentrations in HLB-affected trees [2]. Nutrients are essential for plant growth and development and are key factors in disease control [3] because nutrients influence plant, pathogen, and microbial growth and their host plant relations [4,5]. The complexity of nutrient management studies lies in their combination with declining fine root length density (FRLD) of HLB-affected citrus trees associated with HLB disease. Inherently, Florida sandy soils, with a high amount of rainfall or irrigation, and the transformation, leaching, and movement of the applied essential nutrients in the soil decreases nutrient uptake efficiency [6,7,8]. Therefore, the estimation of crop water demand based on reference crop evapotranspiration (ETo) and crop coefficient (Kc) are essential methodologies for improving crop water and nutrient uptake, hence productivity [9].
Ground-applied fertilizers are prone to unfavorable soil reactions that may result in the precipitation of nutrients to plant unavailable forms, leaching beyond the root zone, and runoff [6,10,11]. Meanwhile, following the infection of citrus trees with CLas, FRLD decline, water and nutrient uptake, xylem sap flow, and phloem movement are being severely disrupted [12,13]. Agriculture consumes more than 70% of freshwater withdrawals and 90% of consumptive water use; this results in a decline in surface water flow, groundwater depletion, and water quality and triggers eutrophication worldwide [14,15]. Thus, the use of precise irrigation scheduling and fertigation management strategies should be the focus of studies in stimulating citrus root improvement, water and nutrient uptake efficiency, and growth of HLB-infected citrus trees on Florida’s sandy soils. Hence, split application of essential nutrients has been studied as a therapeutic effect in HLB-affected citrus trees so that nutrients will be available in the root zone during the entire growing season [5,16,17].
Foliar applications of secondary macronutrients: Magnesium (Mg), and micronutrients: manganese (Mn), Zinc (Zn), and boron (B) [2,6,17,18], antibiotics [19], and other precursor compounds, such as salicylic acid, and phosphite [1,2,20], have the potential to substantially reduce costs and increase the prospect of citrus production that could profitably manage HLB-infected trees in the commercial Florida citrus industry. However, the appropriate method, optimum rate, and frequency of application were lacking and have been the focus of study in recent years. Therefore, the following hypotheses were explored: (1) foliar and/or soil-applied essential nutrients improve the spatial and temporal soil nutrient dynamics, availability, and accumulation in improving nutrient uptake in HLB-affected citrus trees; (2) timely application of essential nutrients minimize nutrient leaching in citrus trees affected by HLB; (3) split application of essential nutrients promotes fine root density and increases water use efficacy of HLB-affected citrus trees. The objectives of this study were to (1) determine whether split applications of essential nutrients increase soil-available N, Mn, and Zn uptake and accumulation with an emphasis on the root-zone soil pH; (2) compare if foliar only or the combination of foliar and soil-applied essential nutrients to improve the soil nutrient availability and accumulation, and reduce leaching of these nutrients beyond the root zone; and (3) evaluating foliar nutrient coupled with soil applications to reduce the leaching of nutrients and improve water-use efficiency in HLB-affected citrus trees beyond the root zone and the soil–plant–atmosphere continuum, respectively.

2. Materials and Methods

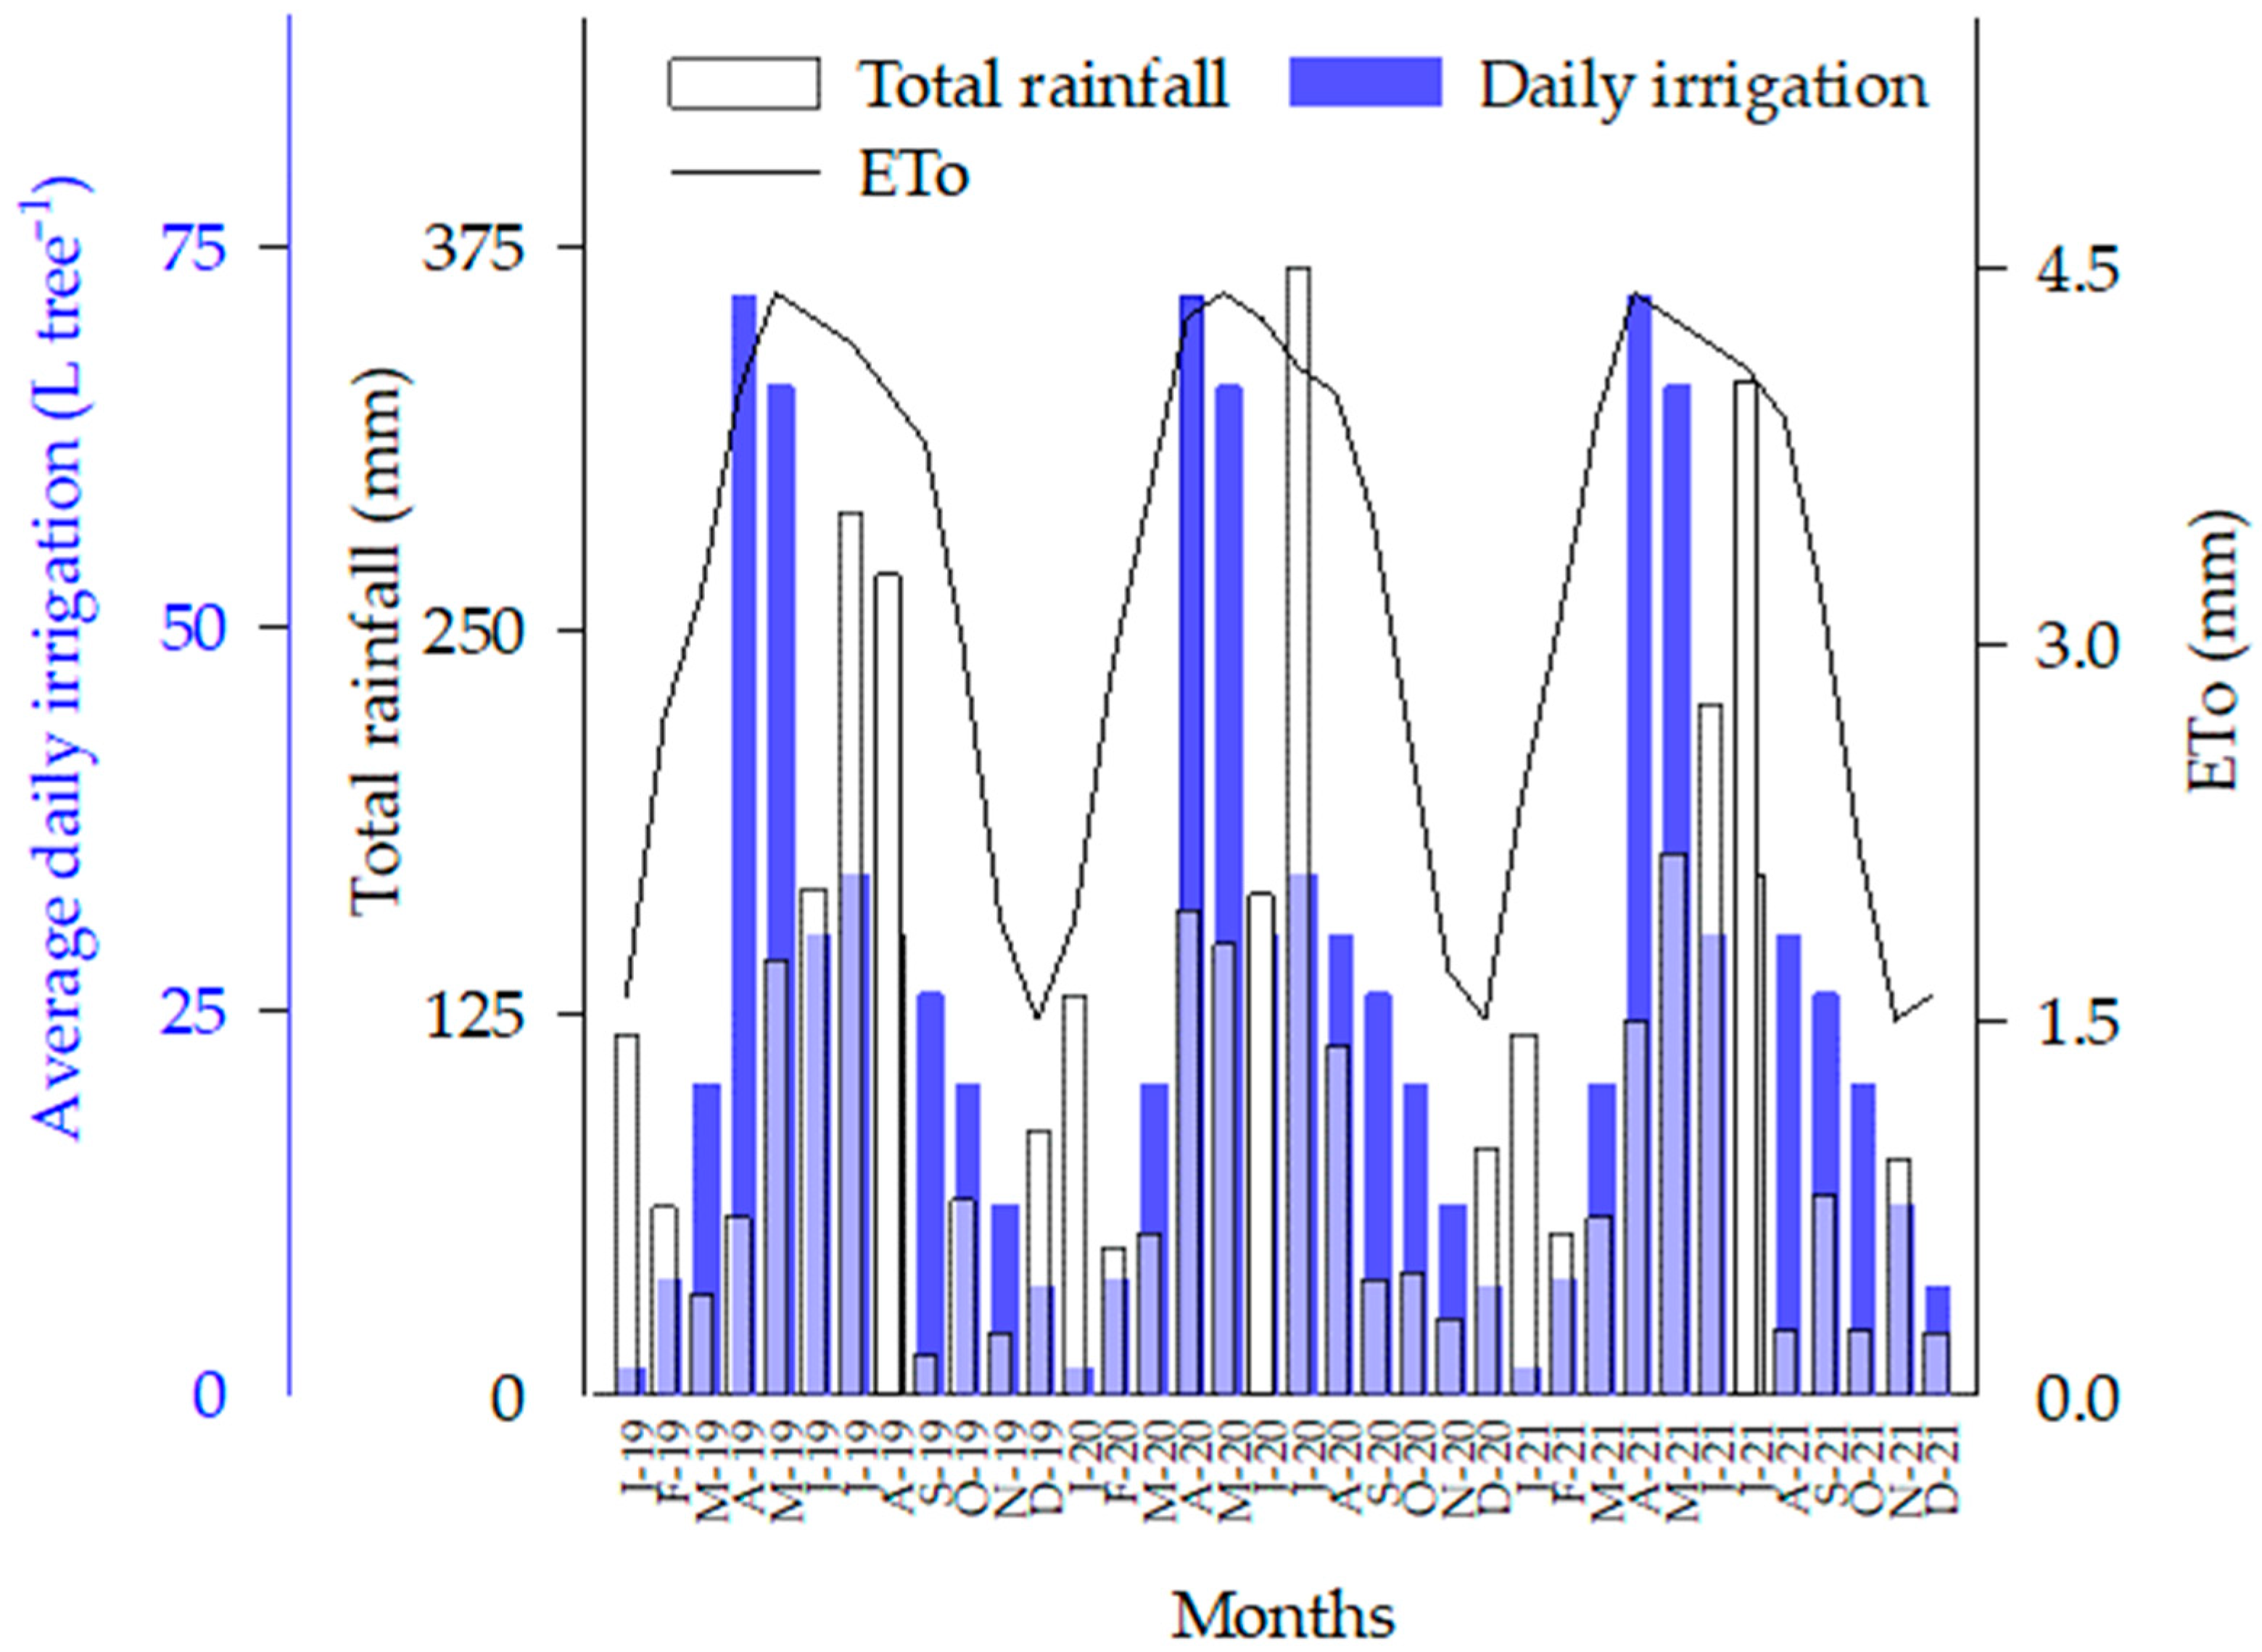
2.1. Study Site Conditions

The field trial was established near Immokalee, FL, USA, at the University of Florida, Southwest Florida Research and Education Center (SWFREC) research citrus grove (lat. 26.46° N, long. 81.44° W). The elevation at the study site was 10 m above sea level. The weather data for the SWFREC site from 2010 to 2021 was obtained from the Florida Automatic Weather Network (FAWN) weather station located about 200 m from the study site [6]. The daily annual rainfall was 9.98 ± 0.52 mm; mean reference evapotranspiration (ETo) was 3.2 ± 0.056 mm day−1, and minimum and maximum daily annual average temperatures of 16.7 ± 0.4 and 28.6 ± 0.3 °C, respectively (Figure 1). Ten-year records between 2010 and 2020 indicated that the site had a total rainfall record of 1281.4 mm per year (Figure 2). Florida has a warm and humid subtropical climate with a bi-modal rainfall pattern and peaks during the rainy season that spans from May to October and accounts for 80% of the annual rainfall [21].
The soil series at the study site is Immokalee fine sand (sandy, siliceous, hyperthermic Arenic Alaquods) and is characterized as having low organic matter, poorly drained soil, with sandy marine sediments, nearly level (slopes < 2%), and low hydraulic conductivity horizon at less than 1 m soil depth from the surface of the soil (Table 1) [22,23]. The studies were conducted on mature sweet orange trees (Citrus × sinensis L. Osbeck cv. ‘Valencia Late’ budded onto Swingle (Swc) citrumelo (Citrus × paradisi Macf. × Citrus trifoliata L.) rootstocks planted in April 2006. A randomly selected mature five leaves per tree (n = 24 trees) were collected and processed for quantitative polymerase chain reaction (qPCR) analysis for HLB-causing bacteria at an HLB diagnostic laboratory located at SWFRE, Immokalee, FL. The foliar laboratory results showed that the trees had a value of 24.7 ± 0.19 cycle threshold, indicating the presence of an active CLas infection in the trees.

2.2. Experimental Design and Treatments

The experiment was a split-plot design consisting of three N rates as the main plot and three micronutrient rates/application methods and control as sub-plots. The three N rates (168, 224, and 280 kg ha−1 year−1) in which the micronutrient rates and method of applications were randomly assigned within the experimental units. All plots received K fertilizer (as K2O) at 168 kg ha−1 year−1. The N and K fertilizers were fertigated as a split biweekly application from February to November of each year for 2019–2021 in 20 applications per year. In addition, each experimental unit of the three N rates received either 0× (control), foliar only 1× (1×), foliar 1x and soil-applied 1× (2×), and foliar 1× and soil-applied 2× (3×) (Table 2). The product of the soil-applied micronutrient was a Bentonite clay-encapsulated micronutrient consisting of elemental sulfur (S), Mn, and Zn oxide. Each of the 1× doses was equivalent to 9 kg ha−1 year−1 each of Mn and Zn oxides and 2.3 kg ha−1 year−1 of B as B2O3. The micronutrient treatment rates were determined as previously suggested by the University of Florida, Institute of Food and Agricultural Sciences for citrus nutrition [24]. The Mn, Zn, and B foliar applications were performed in three splits per year during the early spring (March), summer (June), and late summer (September) leaf flush seasons [25,26,27]. These nutrients were applied with a truck-mounted sprayer motor pump (Hypro corporation, New Brighton, MN, USA). An aluminum Spray GunJet (AA(B) 43L-AL4, Spraying Systems Co., Glendale Heights, IL, USA) connected to a motor pump with a pressure capacity of 5515.81 kpa was used to homogeneously spray the solution in each experimental unit. The volume of the soil-applied solution was determined and standardized using a stopwatch [25].
Irrigation was applied with a micro-sprinkler installed approximately 15 cm from each tree trunk. A pump with a capacity that harnessed a force of 172 kpa and a flow rate of 45 Lh−1 irrigated each tree with Max-14 Fill In (360°× 14) (Maxijet Inc., Dundee, FL, USA). Based on crop water requirements, the trees received daily minimum, average, and maximum volumes of water 2, 27, and 72, L day−1, respectively (Figure 2). The daily irrigation was estimated with irrigation scheduling using the Citrus Smart irrigation app available on the mobile device operating systems: iOS and Android packages [6]. For every amount, the grove received daily rainfall in rainy seasons of <6.5, 6.5–12.5, and 12.5–20 mm, and irrigation was delayed for one, two, and three days, respectively. The smartirrigation apps work with the principles of ETo estimated with the Food and Agricultural Organization (FAO) PenmanMonteith and Kc linked with the real-time meteorological data developed from the Florida Automated Weather Network.

2.3. Data Collection and Sample Analyses

2.3.1. Soil Sampling and Analysis

The soil samples were collected at about a 1 m radius from a tree trunk, at three different locations, and in three soil depths: 0–15, 15–30, and 30–45 cm. The samples were mixed by depth, pooled, and kept in separate sampling bags. The samples were collected twice a year in spring (Mar.) and summer (Sep.) of 2019–2021 using a 2.5 cm i.d. soil core sampler. The soil samples were kept in a freezer at <4 °C, pending soil analysis for N and micronutrients. Soil N (NH4-N and NO3-N) was determined using the 2 M KCl extraction procedure as explained in Ringuet et al. [28]. Approximately 5.0 g (±0.05) of wet soil was weighed, and 40 mL of 2 M KCl solution was added into a 50 mL extraction tube, capped, and shaken at the lowest rate (60 oscillations per minute) for 30 min. The extractant was filtered using Whatman No. 42 filter paper, decanted into a 25 mL plastic tube, and stored at <4 °C pending analysis. Soil N was determined using a spectrophotometric Microplate Reader (Epoch BioTec, Winooski, VT, USA) method at 630 and 540 nm, respectively.
The percent water content was determined by weighing a wet soil sample of 25 g, drying, and reweighed. The percent dry weight was used to determine mg nutrient per kg dry soil weight. Oven dry soil samples of approximately 2.5 g (±0.05) and 25 mL (1:10 mass:volume) were added to 25 mL of Mehlich III solution (0.2 M CH3COOH + 0.015 MNH4F + 0.013 M HNO3 + 0.001 M EDTA + 0.25 MH4NO3), placed into a 50 mL extraction tube, capped, and shaken at the higher rate (200 oscillations per minute) for 5 min. Then, the extractant was set for 30 min to settle the mixed solution [6,29]. The extractant was filtered using Fisher Scientific filter paper medium porosity set onto labeled 25 mL vials and kept in a freezer until further analysis of soil P, K, Ca, Mg, Zn, Cu, Mn, and B using inductively coupled plasma optical emission spectroscopy (ICP-OES) (Spectro Ciros CCD, Fitzburg, MA, USA). All results were calculated based on an oven-dry soil weight basis. The root-zone soil pH was determined by adding a 1:2 soil to water ratio by volume with an AR 15 Accumet® Research pH meter (Fisher Scientific, Lakewood, CO, USA).

2.3.2. Minirhizotron Root

Transparent acrylic minirhizotron tubes were installed at approximately 0.5 m from the tree trunk at a right angle to the irrigation sprinklers that ran along with the tree row N to the S direction. The tubes were inserted into the ground at 45° to the soil surface [30,31]. The bottom of the tubes was closed with a plastic plug, and the upper was sealed with a plastic cup to impede the leak of water and soil into the tubes. The extension of the tubes above the ground was covered with black plastic tape to eliminate exposure of the roots to light and heat [7,25,31]. Root data were collected every month for two years and processed using a root scanner system (CI-600 Root Growth Monitoring System, Fa. CID, Camas, WA, USA). The fine root images around the minirhizotron tubes (21 × 19 ≈ 400 cm2) were traced to determine their length using RootSnap Version 1.3.2.25 Release software (CID Bio-Science, Inc. Camas, WA, USA). The total fine root length was divided by the area covered by the image of the camera to determine the FRLD of each month [7,25].

2.3.3. Water Relations

Stomata conductance (gs). The gs measurement was conducted on randomly selected leaf samples from the outermost part of the tree; they were selected from the upper 2/3 of the tree canopy facing towards the southwest. Data collection was conducted on sunny days in spring (February or March) and in summer (August or September) each year [32,33]. Stomatal conductances gs were measured in the late morning (1000 to 1200 HR) to eliminate extra-high afternoon temperatures and low relative air humidity. Stomatal conductance (gs) measurements were conducted on two mature and fully expanded, sunlit leaves (n = 24 trees) using an SC-1 leaf porometer (ICT international, Armidale, NSW, Australia).
The stem water potential (ψstem). The stem (ψstem) was measured on three mature, fully expanded leaves in spring (February or March) and summer (August or September) in the 2020 and 2021 growing seasons. The leaves were selected from the upper 2/3 of the tree canopy and they were fully exposed to sunlight. Each leaf was covered with a transparent plastic membrane, followed by the aluminum foil overnight. After an equilibrium period, the measurement of the ψstem was conducted at around noon (1200 to 1300 HR). The leaf with its petiole intact was cut from the tree branch, and the ψstem leaf was measured with a pressure chamber (Model 3005, Santa Barbara, CA, USA) [12,33,34].
Sap flow. The sap flow data collection was conducted from the last week of April to the first week of May in 2020 and 2021 to determine the irrigation schedule effect and avoid the rainy season. The sap flow data were determined with sap flow sensors (Flow32-1K; Dynamax®, Houston, TX, USA) connected to two branches (13–25 mm diameter) per tree of four trees per cycle and replicated twice. The branches were gently rubbed to avoid any dirt sticking to the branches. Then, the branches were covered with thin silicone grease (Dow Corning 4; Dow Corning, Midland, MI, USA) to enhance the contact of the sensors with the branch and avoid the branches from thermal impairment. The sap flow sensors were connected to a data logger (CR 1000, Campbell Scientific Inc., Logan, UT, USA) to record the data of each sap flow from the branches for two weeks, a customary span used for the stem heat balance (SHB) technique [12,35]. The leaf area on the selected branches was estimated by a digital portable leaf area meter (LI-COR LI-3000A and LI-3050A/4, Columbia, MO, USA). Sap flow data recorded by the data logger (g h−1) were converted to water flow per unit leaf area over which the data sensors were attached [12,22,35].

2.4. Statistical Analysis

Three-way interaction: depth, N rates, and micronutrient rate treatment effects were established on soil nutrient concentrations and acidity. Time and/or soil depth on soil nutrients, FRLD, and water relation data were considered as fixed factors to see treatment effects. The data were tested for linearity, normality, homoscedasticity, and independent errors. Log transformation was used to normalize the soil nutrient concentration and soil pH for data that violated the above fundamental statistical assumptions. Repeated-measures analyses of variance based on PROC GLM (General Linear Model) were used to detect significant differences in each response variable. Data analyses were conducted using the PROC GLM (General Linear Model) procedures with SAS (version 14.1; SAS Institute, Cary, NC, USA). Tukey’s honestly significant difference grouping range test was applied to the means to imply the mean separation among the means with a statistical family error rate of p ≤ 0.05. The logarithmic regression analysis of solar radiation and sap flow data was performed using sigma plot 14 (SigmaPlot 14, Systat Software, San Jose, CA, USA).

3. Results and Discussion

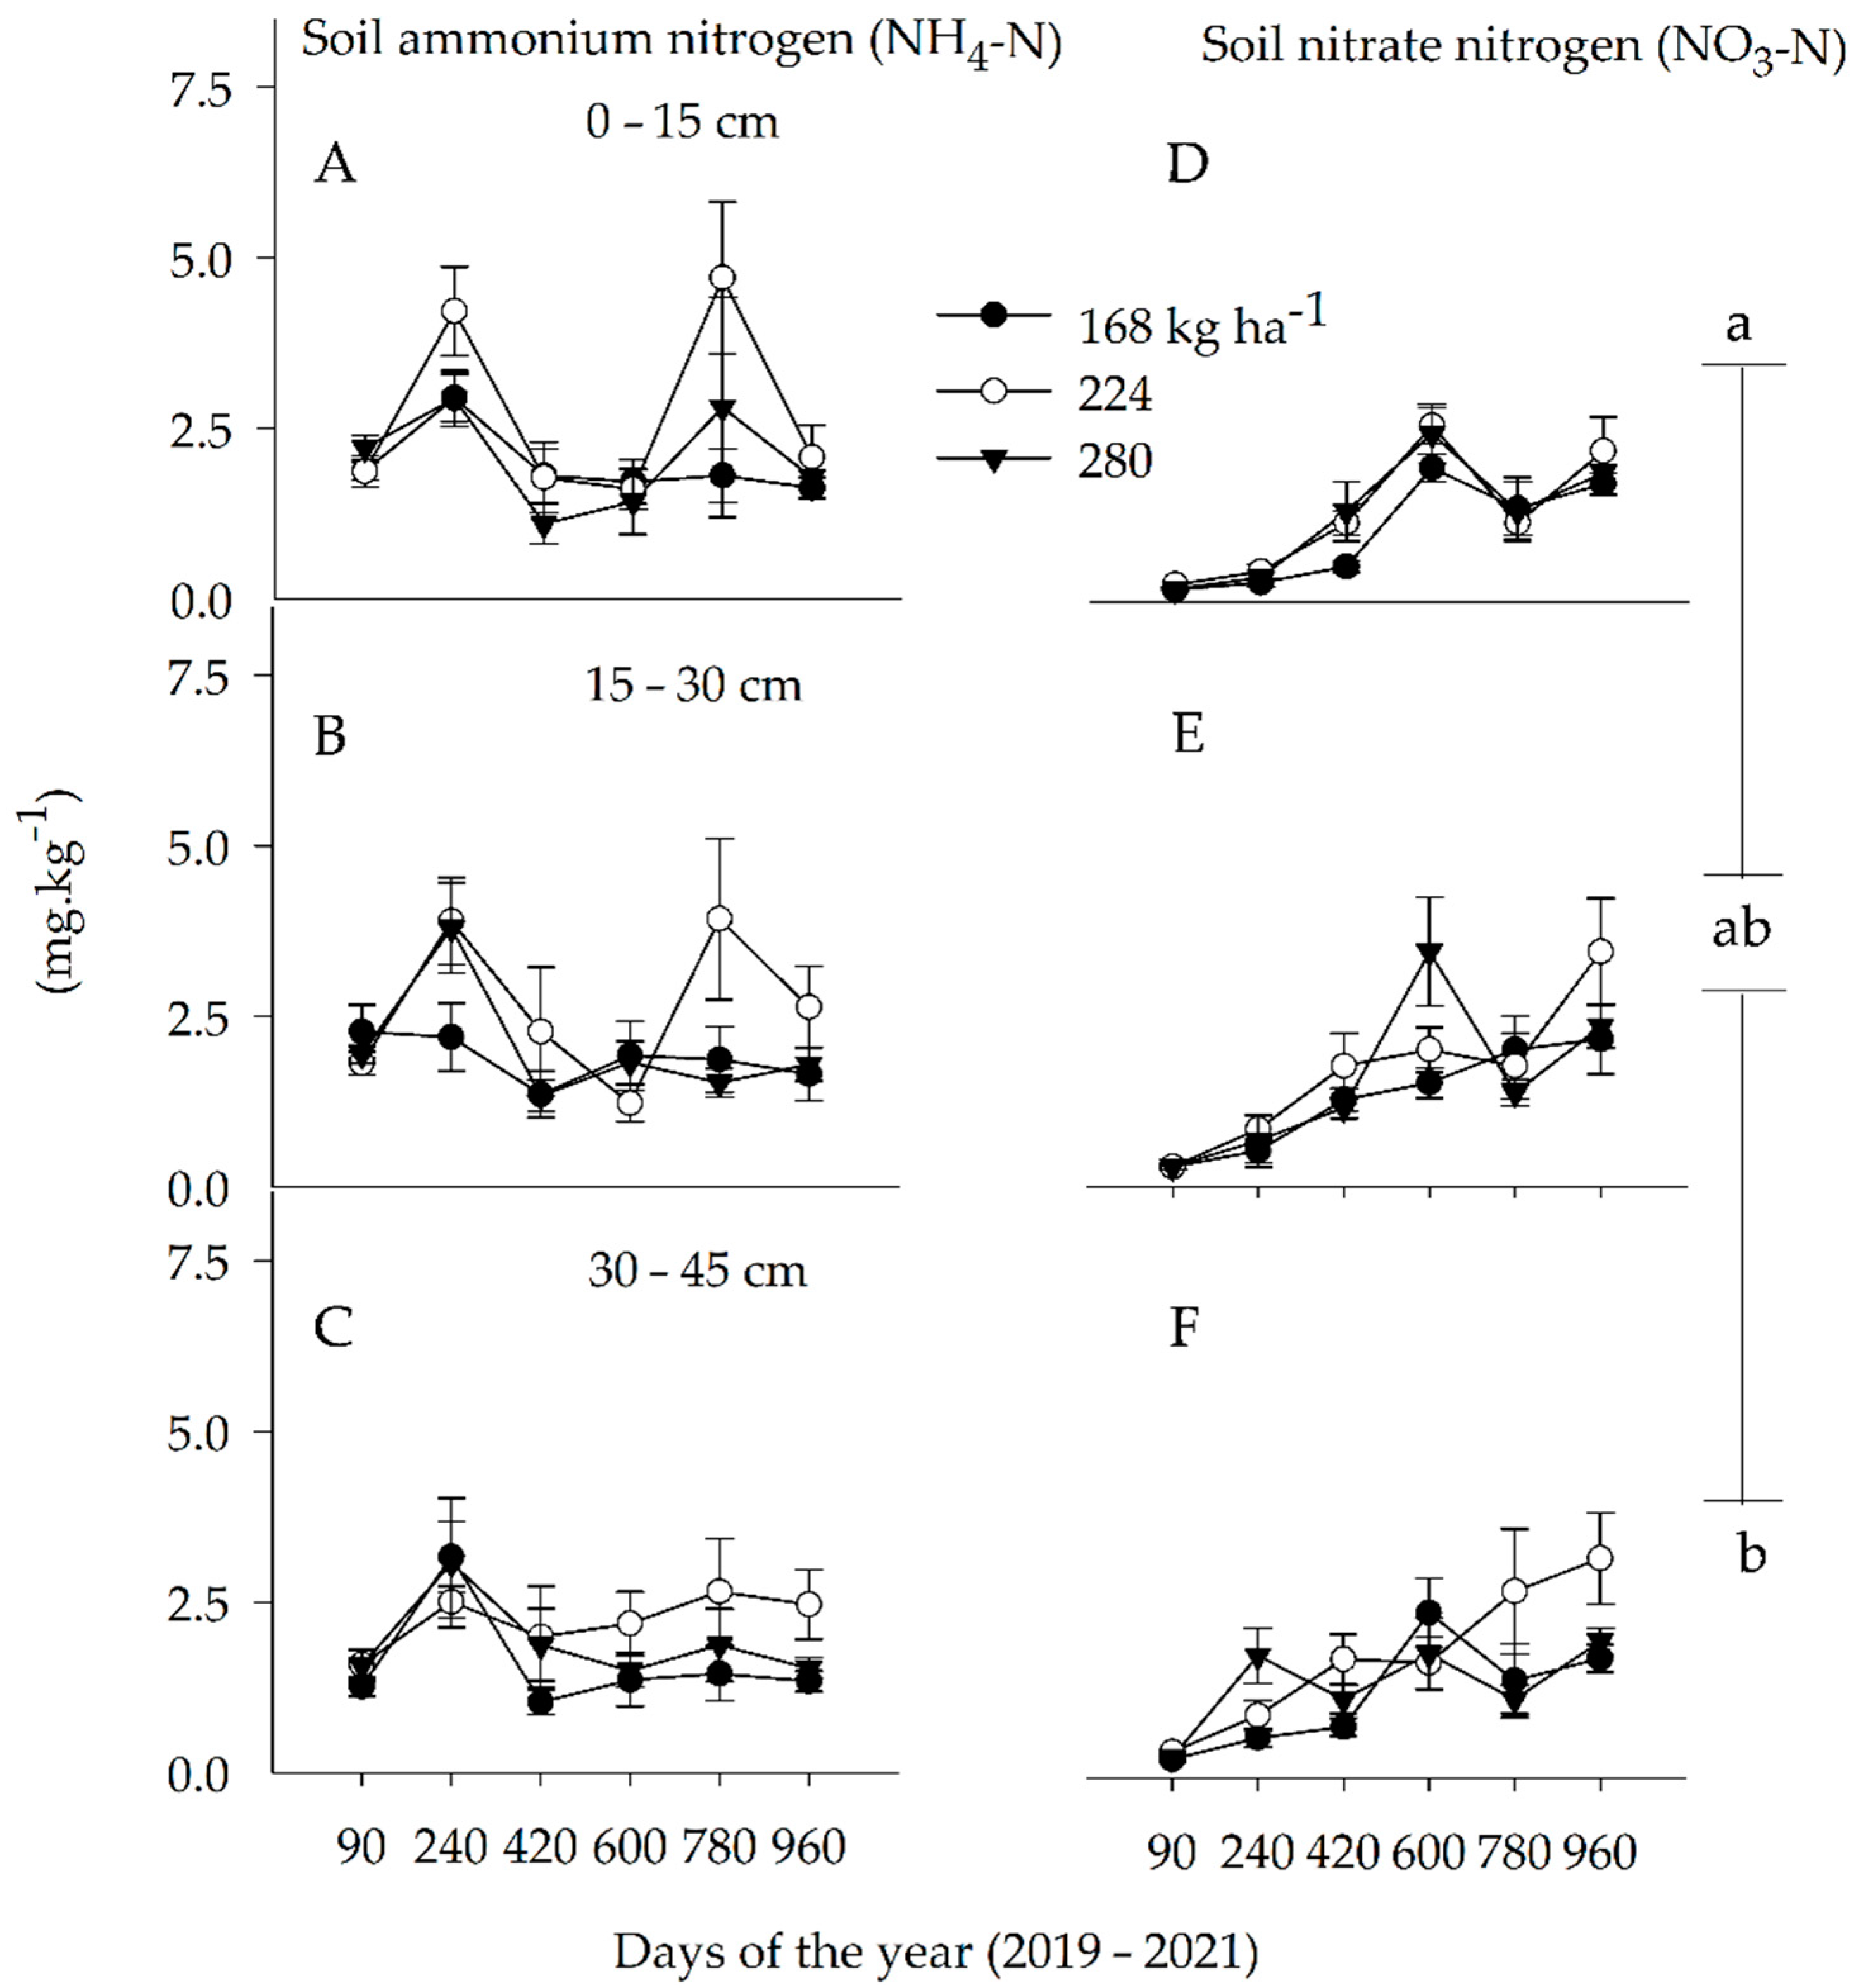
3.1. Soil N Concentration

Soil ammonium nitrogen. The spatial and temporal soil ammonium N (NH4-N) concentration showed a similar pattern between the three soil profiles (0–15, 15–30, and 30–45 cm) for the entire seasons (Figure 3A–C). However, there was a significantly higher soil NH4-N concentration for 240 and 780 days of the study in the upper soil layer (0–15 cm) and middle (15–30 cm) soil layers at 600–960 days and at the lowest soil layer (30–45 cm) for the trees that received 224 kg ha−1 N per year. During each spring season, the amount of soil NH4-N concentration was significantly greater when trees receiving foliar and soil-applied Mn and Zn nutrients at 9 kg ha−1 year−1 each (Table 3). However, the variation in soil NH4-N concentration was not significant during the summer seasons regardless of the micronutrient rates.
The amount of soil NH4-N concentration had a magnitude of 1.8–2.5, 3.15–4.06, and 2.29–2.41 mg kg−1 pertaining to 168, 224, and 280 kg ha−1 year−1 on the upper soil layer. There were 56%, 47%, and 19% greater soil NH4-N concentrations in the upper soil layer, but 61%, 8%, and 65% lesser soil NH4-N concentrations attributed to 168, 224, and 280 kg N ha−1 year−1 on the upper soil layer as compared with the lowest soil layer, respectively. In the current study, the N rate did not show a significant difference in soil NH4-N concentrations. These results may indicate reduced uptake in the spring and the non-significance in the summer because high temperature and precipitation may trigger the conversion of NH4-N to NO3-N and leaching. The NH4-N applied to the Florida sandy soil showed the conversion of 33% to 41% of the applied NH4-N to NO3-N in seven days [36]. Previous studies also indicated that the leaching of NH4-N was restricted as compared with NO3-N because of the adsorption, the conversion of NH4-N to NO3-N, the increased uptake by the trees, and the dynamics of the NO3-N from the upper to the lowest soil layer [6,12,36].
Soil nitrate-nitrogen. The soil nitrate N (NO3-N) concentrations increased over time and showed as significantly higher in the upper soil layers as compared with the lowest soil layer (Figure 3D–F). The amount of soil NO3-N concentration was significantly higher when trees received either 224 or 280 N kg ha−1 year−1 at all soil layers. The ANOVA results indicated that the N rate and depth of the soil were the factors that showed a significant variation in soil NO3-N concentrations (Table 3). The amount of soil NO3-N concentration had a magnitude of 0.88–1.25, 1.23–1.64, and 1.19–1.48 mg kg−1 attributed to 168, 224, and 280 kg ha−1 year−1 in the upper soil layer. There were 60%, 25%, and 55% greater soil NO3-N concentrations in the upper soil layer, but 38%, 51%, and 46% lesser soil NO3-N concentration in reaction to 168, 224, and 280 kg N ha−1 year−1 in the upper soil layer as compared with the lowest soil layer during the spring and summer season of the study years, respectively.
The overall results indicated that trees that received 224 kg N ha−1 year−1 had greater accumulation and leaching as compared with the lowest and highest N rates. Previous studies indicated that the estimated soil NO3-N concentration in the 0–30 cm in mature commercial citrus groves and optimal irrigation scheduling had a magnitude of 8–15 mg kg−1 [37] and 5–10 mg kg−1 [38] had a magnitude of 3–15-fold more than the current study. Hence, the split application of N in association with optimum irrigation scheduling of the current study could be deemed as the BMP protocol for the citrus industry with HLB-infected citrus groves.

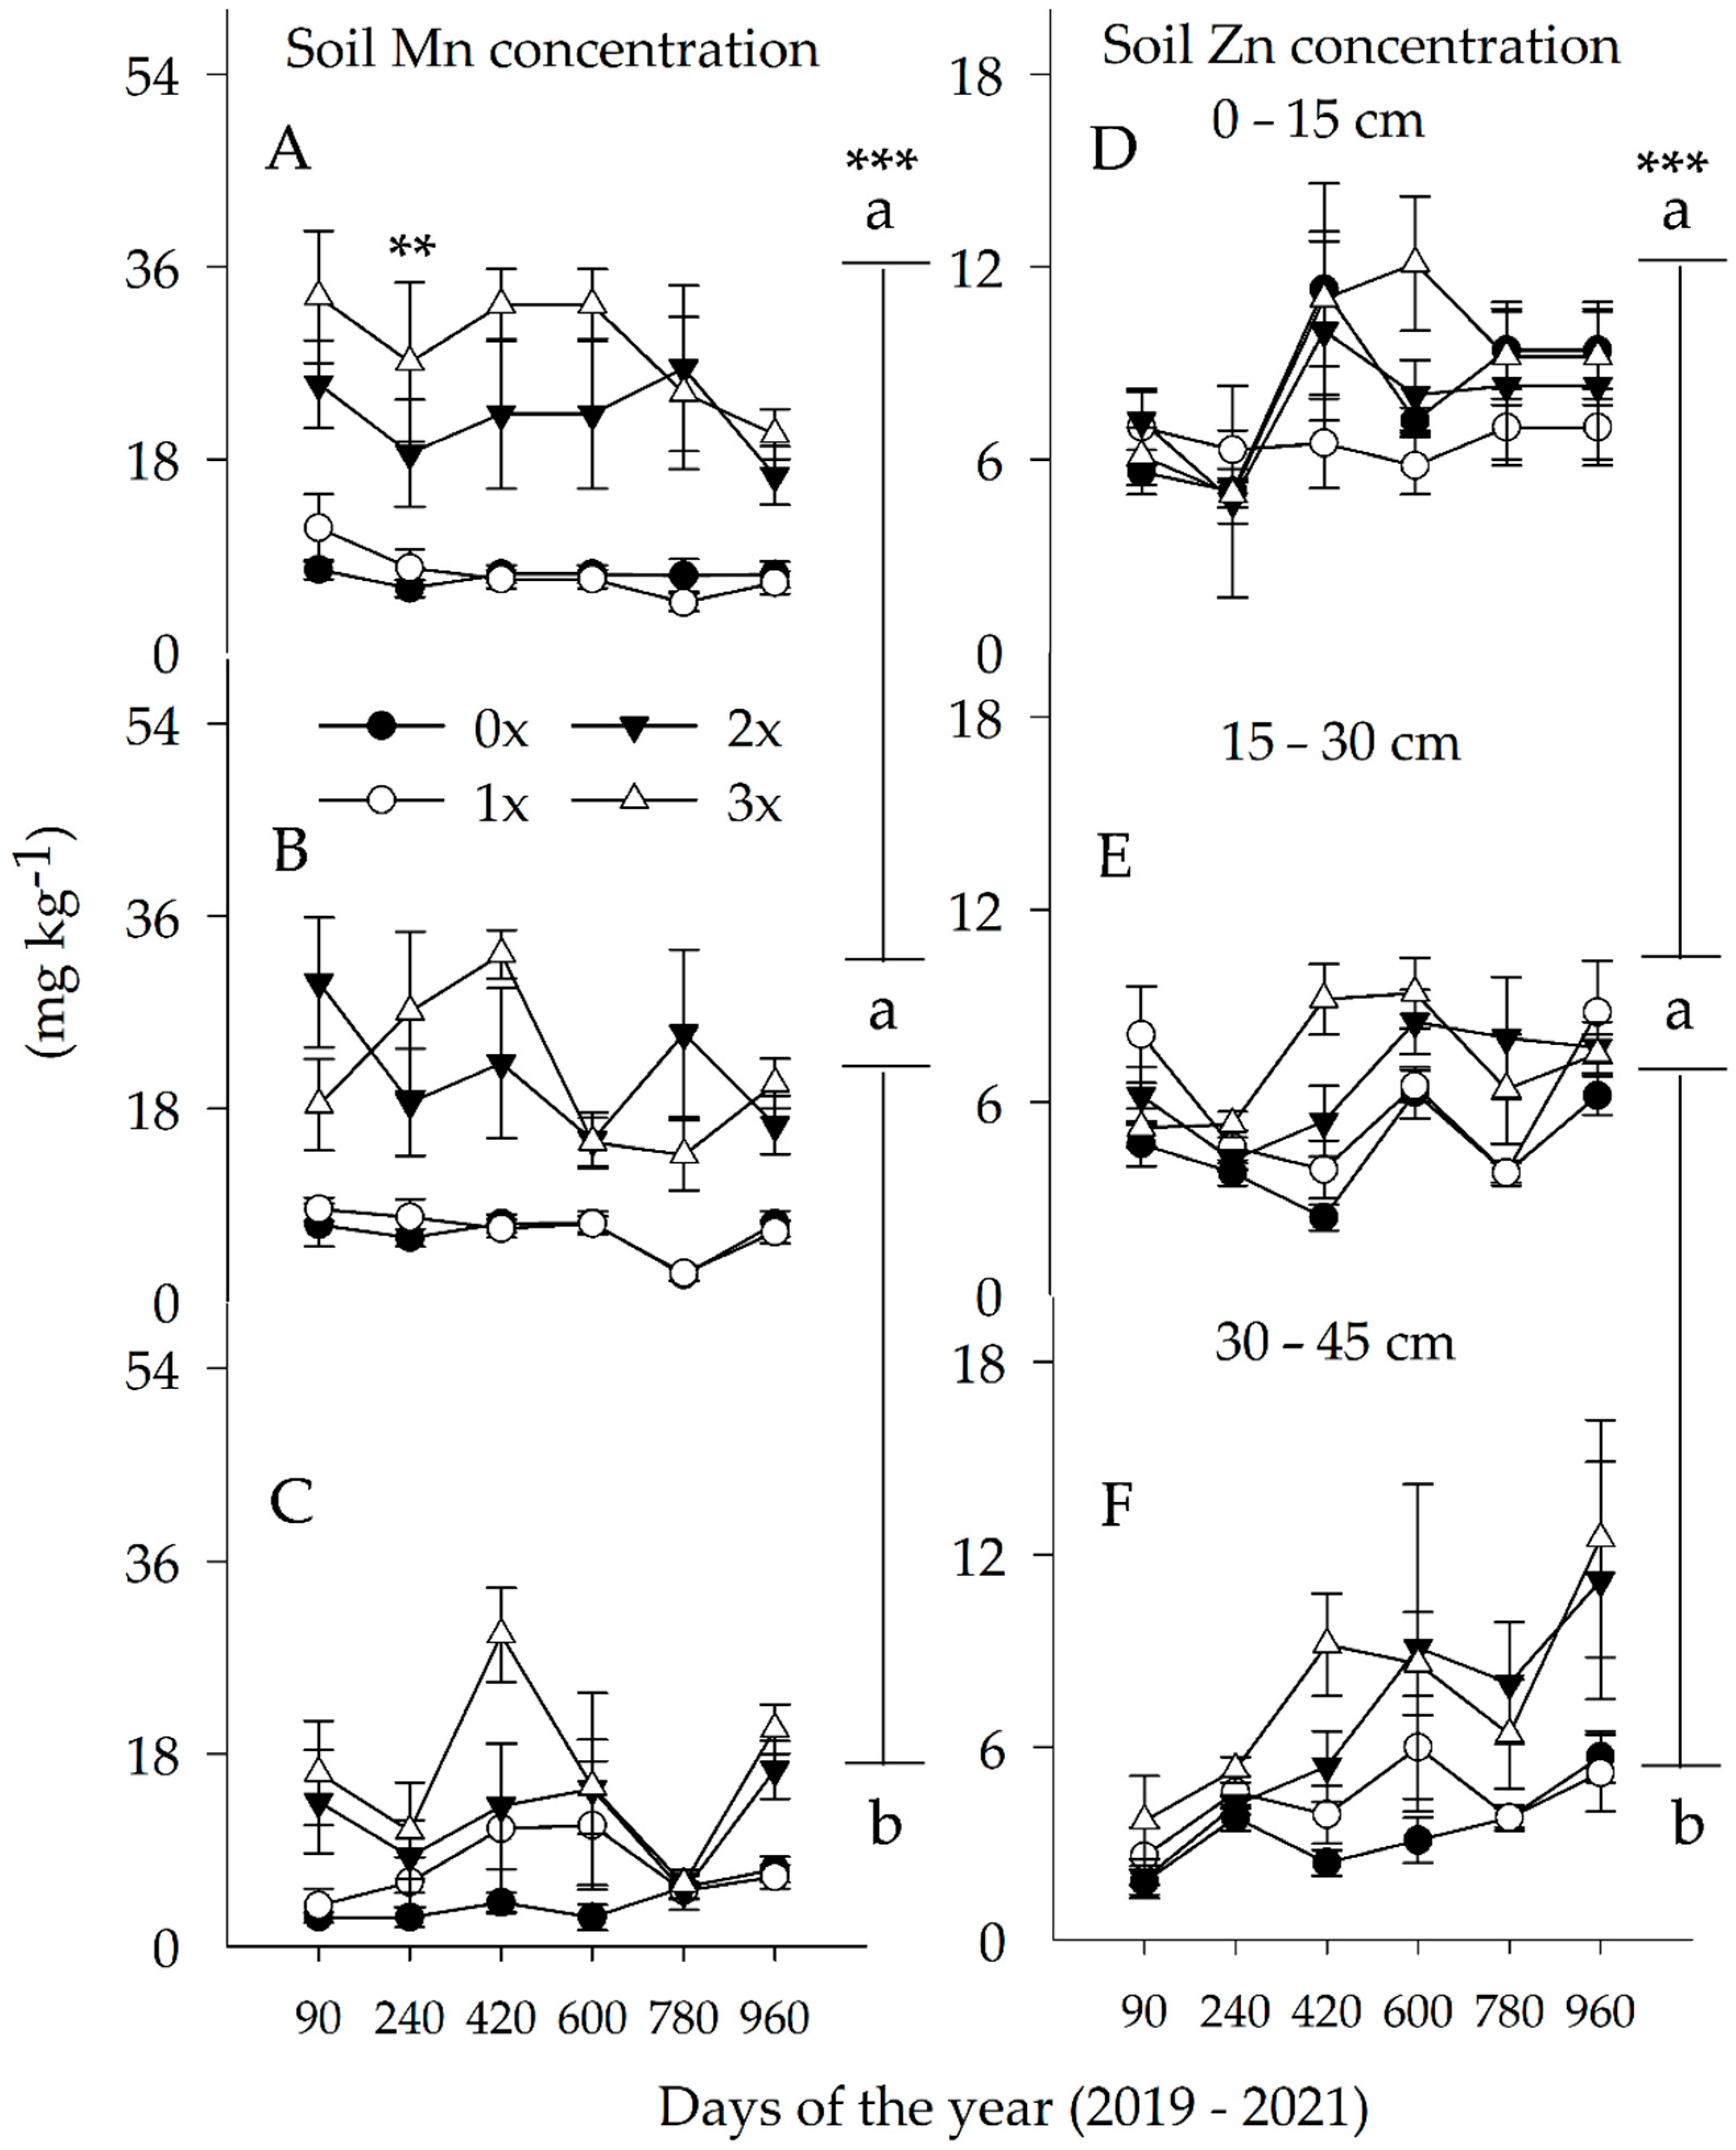
3.2. Soil Mn and Zn Concentrations

Soil Mn concentration. Soil Mn concentration was significantly higher in the upper and middle soil layers as compared with the lowest soil layer (Figure 4A–C). Likewise, trees under foliar and soil-applied treatment had significantly higher soil Mn concentration as compared with only foliar treated or control trees in the upper soil layers. The soil Mn concentration increased with a magnitude 1–2-fold, 3–4-fold, and 3–4-fold greater than the control trees under the trees treated with foliar only (9), foliar 9 and soil 9 (18), and foliar (9) and soil 18 (27) kg ha−1 year−1 Mn nutrition in the upper and middle soil layers, respectively. These soil Mn concentration results were similar to those findings reported at Immokalee site, FL, on Immokalee fine sand [6], and Lake Alfred, FL site on Candler fine sand [39]. Uthman et al. [39] speculated that the higher Mn concentration in the upper soil layers might be ascribed to the adsorption of Mn.
Soil Zn concentration. Soil Zn concentration was significantly higher in Zn concentration in the upper and middle soil layers as compared with the lowest soil layer (Figure 4D–F) during the first 420 days of the study. Trees under foliar and soil-applied treatments had significantly higher soil Zn concentration as compared with control trees in the upper and middle soil layers. The soil Zn concentration had magnitudes of 1–1.5-fold and 1.1–1.8-fold greater than the control trees under the trees treated with foliar 9 and soil 9 (18), and foliar (9) and soil 18 (27) kg ha−1 year−1 Zn nutrient content in the upper and middle soil layers, respectively. Soil-applied Zn is sparingly accessible to plant roots because of its low mobility in the soil–plant interfaces and high conversion to soil unavailable forms [6,40,41]. Therefore, previously reported studies indicated that it is less likely to improve Zn soil accumulation by applying to the soil and because of less immobilized Zn within the plant tissue [6]. Therefore, foliar application of Zn is a recommended means to boost leaf Zn tissue concentration in plants [2,6,40].
Other soil nutrients. Soil P showed a significantly lower concentration at the lowest soil layer when trees received the highest N rate in both the spring and summer seasons (Table 3). This indicated that the uptake of P increased with the increasing N rates. However, since the N concentrations were higher in the upper soil layer, lower soil P was detected at the highest soil layers as compared with the lowest soil layers. Soil K concentration was highest at the upper and middle layer than in the lowest soil layer, and the pattern was similar with the moderate and the highest N rates as compared with the lowest N rate. This showed that the split fertigation of K promoted the availability year-round in the upper and middle soil layers (0–15 and 0–30 cm).
Even though the soil reaction regarding Ca was not evident in the spring seasons, soil Ca concentration was higher in the upper and middle soil layers than in the lowest soil layers during the summer seasons. This difference was prevalent in the lowest N rate. Similarly, soil Mg was also the highest in the upper and middle soil layers when trees received the lowest N rate. The soil Mg concentration was the highest in the control trees as compared with the foliar and soil-treated trees with Mn and Zn nutrition. Since Mg is a mobile nutrient, the increase in the aboveground biomass may be triggered by Mn and Zn nutrition, prompting the uptake of Mg by the trees. A significantly higher soil B concentration was observed when trees received the highest N rate and at the lowest soil layer. Soil Cu concentration was higher in the upper and middle soil layers than in the lowest soil layer only when the tree received the highest N rate. On the other hand, soil Fe concentrations were significantly higher in the upper and middle layers when they received the lowest and middle N rates.

3.3. Root Zone Soil pH

Root zone soil pH was significantly affected by the interaction of N and micronutrient rates in the summer seasons (Table 4). There was significantly lower soil pH under the trees that received foliar 1× and soil-applied 1× (2×) and foliar 1× and soil-applied 2× (3×), as compared with the foliar only 1× (1×) and control trees regardless of soil depths. Similarly, the soil pH was significantly lower in the upper soil layer than in the lowest soil layer, regardless of the N rates. The drop in soil pH from the start of the study to the end on average was 7.3–5.9 ± (0.10), 7.1–5.9 ± (0.13), 6.8–5.3 ± (0.17), and 6.4–5.2 ± (0.15) in response to the control, foliar only 1× (1×), foliar 1× and soil-applied 1× (2×), and foliar 1× and soil-applied 2× (3×) treatments, respectively. This indicated that the drop in soil pH was the result of elemental S released S encapsulated Mn and Zn products added to the soil. Except for the highest micronutrient rates, the soil pH was in the range that promotes the availability of soil Mn and Zn for uptake by the trees. Soil acidifiers such as elemental S converts to sulfuric acid in the soil, which decreases soil pH [42]. Previous studies on acidified high bicarbonate irrigation water treatment indicated that amending with elemental S resulted in a soil pH ranging from 4.0 to 7.0 that boosted root growth, availability of soil nutrients, and the uptake of Ca, Mg, Mn, and Zn in response to a gradual reduction in soil pH of orange groves [6,43].

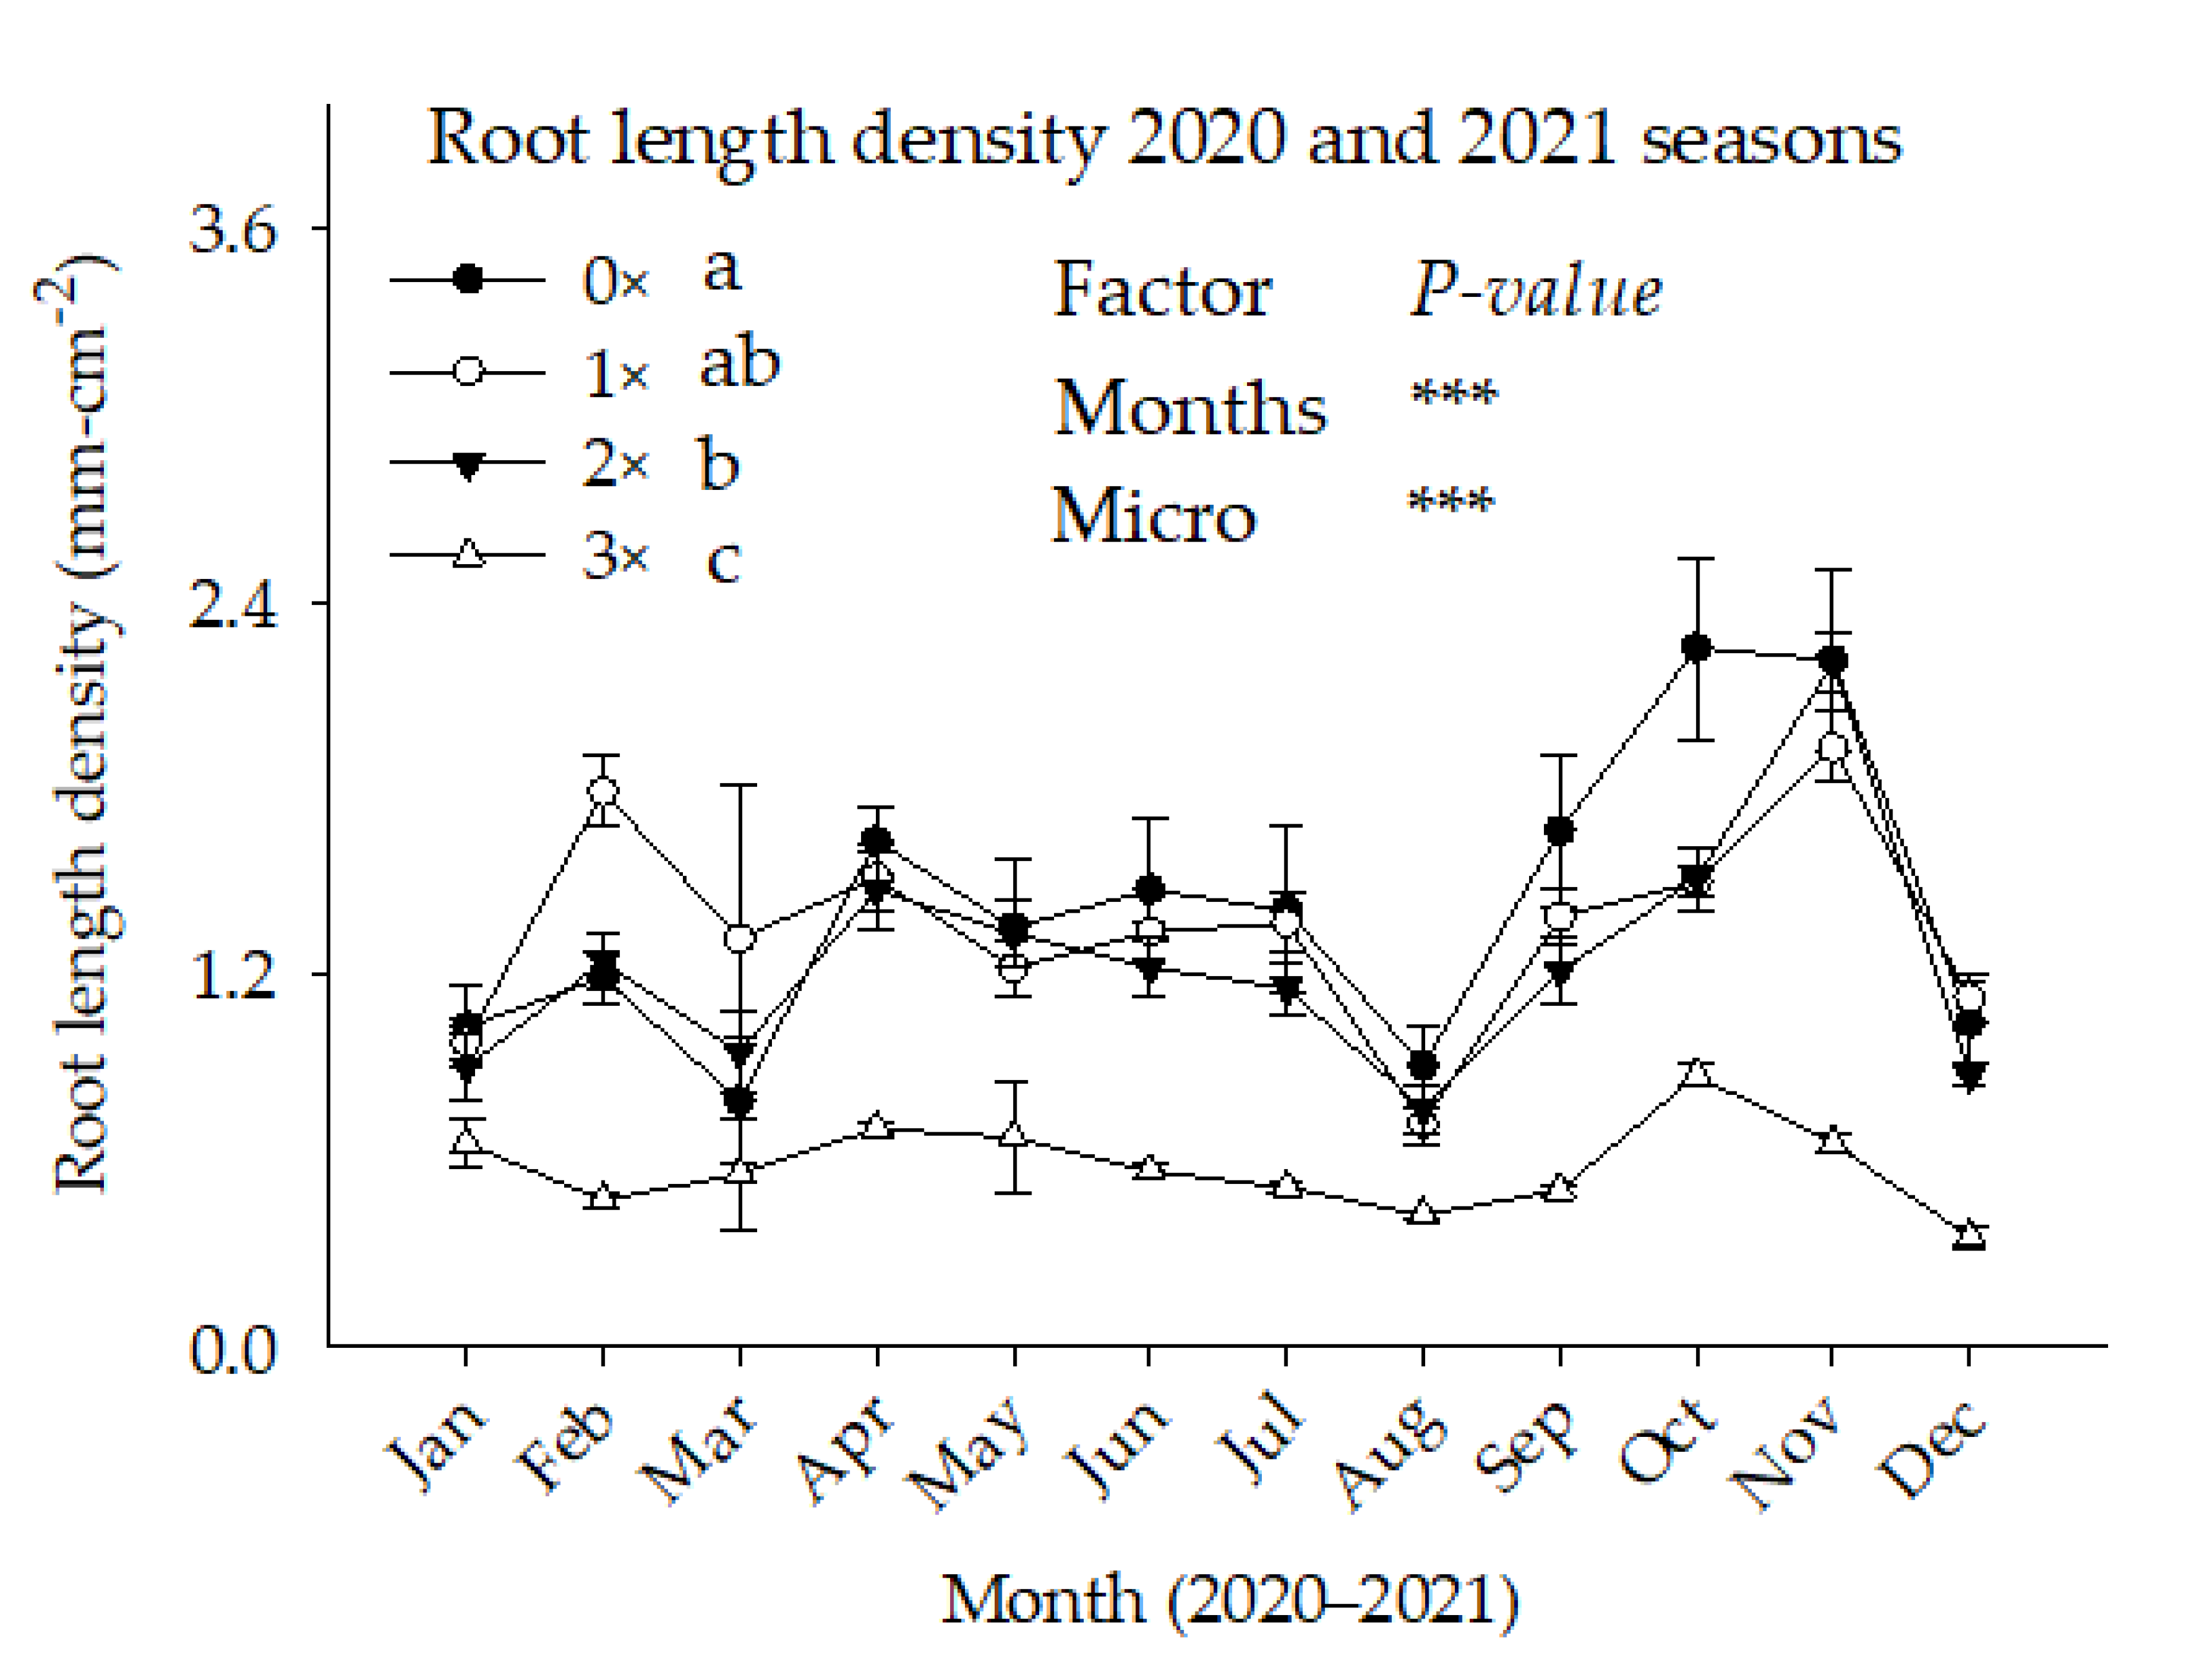
3.4. Root Length Density

The FRLD significantly increased in the spring and summer seasons in reaction to the foliar only (1×), foliar and soil-applied (2×), and the control trees (Figure 5). The highest micronutrient treatments, foliar 1× and soil-applied 1× (2×), showed the least increase in FRLD year-round, indicating that restriction in the belowground biomass could be caused by prolonged exposure of the root to high soil acidity. Similar results were also detected in the aboveground-biomass: leaf area index and canopy volume when the trees received the highest micronutrient treatments [6]. During the spring (February and March), the relative increase in FRLD was the highest as compared to the rest of the months, coinciding with the spring and late summer leaf flushes. While, during the late summer (Sep. and Oct.), when the trees had maximum leaf density and fruit-bearing, the FRLD increased only in the control trees as compared with the treated trees. Previous findings showed that soil pH in the ranges of 5.5–6.5 resulted in greater root density and nutrient uptake [25,43]. With dropping root zone soil pH, soil minerals such as Al3+ dissociate and are released into the aqueous soil solution that eventually hampers FRLD [25,44]. Invariably, prolonged exposure to high H+ activity in the root zone could affect the integrity of root plasma membrane permeability; disrupt the electrochemical gradient, eventually influencing plant nutrient uptake and utilization [44].

3.5. Water Relations

3.5.1. Stem Water Potential (ψstem)

Seasonal variation and micronutrient rates had a significant effect on ψstem. The variation of ψstem was significantly lower during the summer season than in the spring seasons when higher solar radiation and transpiration were anticipated (Table 5). There was 31%, 31%, and 42% greater ψstem for the foliar only 1× (1×), foliar 1× and soil-applied 1× (2×), and foliar 1× and soil-applied 2× (3×) in the summer seasons, respectively. These results were similar to the FRLD in which the highest micronutrient rate manifested the least FRLD, hence lower ψstem. Τrees with greater FRLD were expected to have greater water uptake and higher ψstem. The ψstem during summer was significantly lower than in the spring season. The increased ψstem because of the seasonal variation can be associated with the weather conditions: increased water vapor deficit, evapotranspiration, and temperature and increase in vegetative growth that generally increases the crop water demand. Since the foliar only 1× (1×), foliar 1× and soil-applied 1× (2×) treated trees had significant tree canopy volume and leaf area index [6], it resulted in significantly lower ψstem. Similar results had been reported on well water Valencia citrus trees [33], Cu-treated sweet oranges [45], and Ca and Mg-treated trees [12].

3.5.2. Stomata Conductance (gs)

The midday stomata conductance (gs) indicated that seasonal and micronutrient-treated trees had significantly higher gs than untreated trees (Table 5). The treated trees had 18%, 10%, and 10% greater gs in the spring season compared with the control trees pertained to the foliar only 1× (1×), foliar 1× and soil-applied 1× (2×), and foliar 1× and soil-applied 2× (3×), respectively. These results showed that the micronutrients have a significant effect on the water control mechanism of the trees. The lowest gs detected in the control trees could be the relatively smaller canopy volume and leaf area index (LAI) that were exposed to the overhead solar radiation that induces the opening of stomata as compared with the treated trees [33,46]. Moreover, trees have an intrinsic ability to check the water loss that is accomplished by regulating gs [12,33].

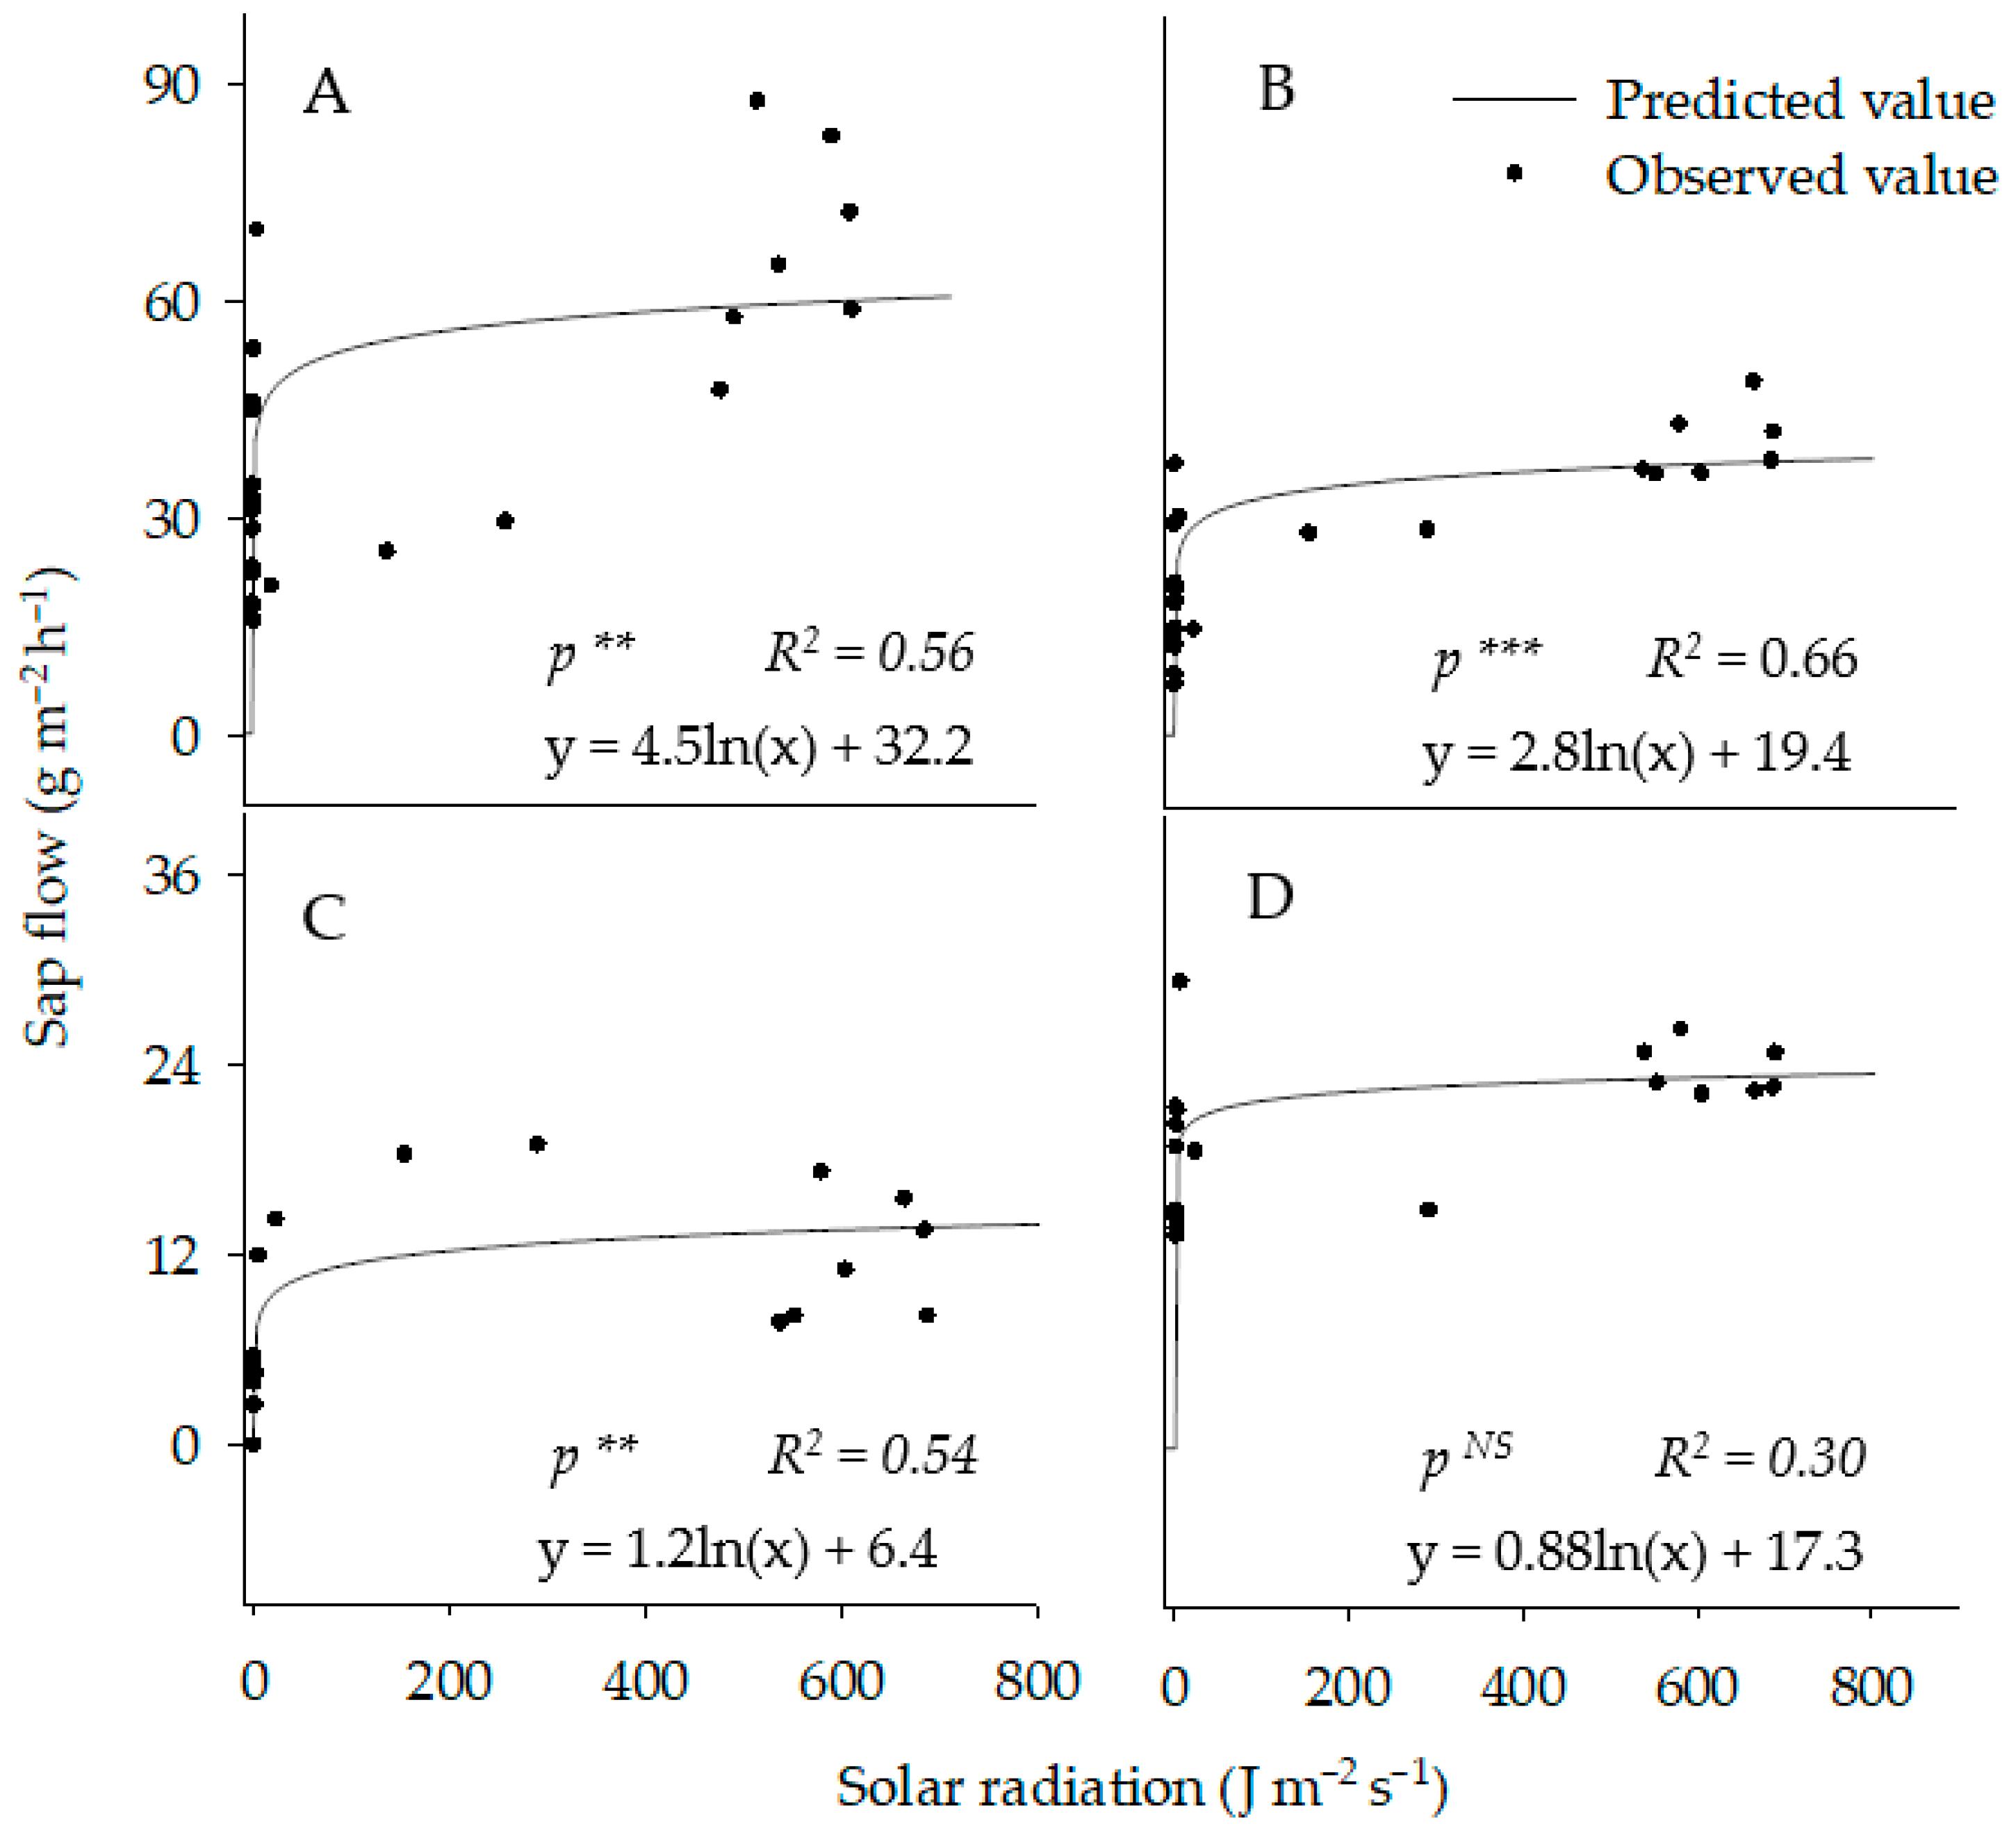
3.5.3. Stem Sap Flow

A significantly higher sap flow was detected with the control trees as compared with untreated trees, indicating less water use efficiency in the control trees (Figure 6). The mid-day sap flow reading of the untreated control trees had a magnitude of 2-fold, 3.4-fold, and 8-fold greater sap flow (water consumption) per unit LA as compared with the foliar only 1× (1×), foliar 1×, and soil-applied 1× (2×), and foliar 1× and soil-applied 2× (3×)-treated trees, respectively. The diurnal sap flow had a similar bell-shaped pattern per the daily global radiation. The pattern of the sap flow showed a departure from zero sap flow at around 08:00 AM, reaching its peak at around midday through the late afternoon at around 5:00 PM, and back to its zero at around 6:00 PM. The sap flow reached its maximum when the sunlight was overhead when the daily temperature and vapor deficit were at their maximum.
A sap flow rate was tracked by the diurnal pattern on sunny days, which increased as the sunshine intensity increased during the early morning hours, and there was a slight decline during the afternoon, indicating that the flow rate is regulated by the stomata water regulation mechanism [12,47,48]. Similar results had been reported on ‘Valencia’ citrus trees grafted on ‘Swingle’ rootstocks [12,35], ‘Hass’ avocado trees grafted onto clonal D7 (H/D7), and TC (H/TC) rootstocks [48]. Even though the difference in the FRLD was similar among the trees and received similar treatments, the relative canopy size and leaf density were also other limiting factors for the water balance in the soil–plant–atmosphere continuum of the trees. There was also a strong logarithmic relationship between the solar radiation and sap flow (R2 = 0.56, 0.66, 0.54, and 0.30) attributed to the control, foliar only 1× (1×), foliar 1×, and soil-applied 1× (2×), and foliar 1× and soil-applied 2× (3×)-treated trees, respectively (Figure 7A–D). These results were similar to the FRLD, LAI, and canopy volume of the respective treated trees.

4. Conclusions

The information in the current study suggests trees under 224 kg N ha−1 year−1, foliar (9 kg ha−1 year−1 each of Mn and Zn nutrients) only and soil-applied (9 kg ha−1 year−1 each of Mn and Zn nutrients) showed positive impacts on root growth and nutrient availability in the soil. These results indicated relatively lower leaching of nutrients beyond the root zone and satisfactory water-saving strategies in the soil–plant–atmosphere continuum. The split application of nutrients coupled with scheduling irrigation played a two-fold role in keeping most of the nutrients on the upper and middle soil layers and boosted FRLD. Elemental S encapsulating Mn and Zn nutrition was a factor for the drop soil in pH to reasonable ranges that enhanced nutrient availability and uptake, improved FRLD, and water relations in the soil and the soil–plant interfaces. The study has also shown a significant impact on young established citrus groves as these nutrients contribute to promoting the establishment of FRLD and boost the availability of soil nutrients with emphasis on the root-zone soil acidity.

Author Contributions

Conceptualization, A.A.A. and K.T.M.; methodology, A.A.A., K.T.M. and D.M.K.; validation, A.A.A. and K.T.M.; formal analysis, A.A.A.; investigation, K.T.M. and D.M.K.; resources, K.T.M.; data curation, A.A.A.; writing—original draft preparation, A.A.A.; writing—review and editing, K.T.M. and D.M.K.; visualization, K.T.M. and D.M.K.; supervision, K.T.M.; project administration, K.T.M.; funding acquisition, K.T.M. All authors have read and agreed to the published version of the manuscript.

Funding

The authors appreciatively acknowledge the Citrus Initiative (Florida legislature) and Multi-Agency Committee (MAC) for funding the project.

Institutional Review Board Statement

Not applicable.

Informed Consent Statement

Not applicable.

Data Availability Statement

Not applicable.

Acknowledgments

The Citrus Initiative (Florida legislature) and Multi-Agency Committee (MAC) funded this research and experimental site accommodated by the SWFREC Institute of Food and Agricultural Sciences/FAS of the University of Florida. We thank Ann Summeralls for facilitating the fieldwork and Kamal Mahmoud for analytical assistance in the laboratory at the SWFREC.

Conflicts of Interest

The authors declare that they have no conflict of interest.

References

  1. Gottwald, T.R.; Graham, J.H.; Irey, M.S.; McCollum, T.G.; Wood, B.W. Inconsequential effect of nutritional treatments on huanglongbing control, fruit quality, bacterial titer and disease progress. Crop Prot. 2012, 36, 73–82. [Google Scholar] [CrossRef]
  2. Morgan, K.T.; Rouse, R.E.; Ebel, R.C. Foliar applications of essential nutrients on growth and yield of ‘Valencia’ sweet orange infected with huanglongbing. HortScience 2016, 51, 1482–1493. [Google Scholar] [CrossRef]
  3. Christos, D. Role of nutrients in controlling plant diseases in sustainable agriculture. A review. Agron. Sustain. Dev. 2008, 28, 33–46. [Google Scholar]
  4. Cao, J.; Cheng, C.; Yang, J.; Wang, Q. Pathogen infection drives patterns of nutrient resorption in citrus plants. Sci. Rep. 2015, 5, 14675. [Google Scholar] [CrossRef] [Green Version]
  5. Uthman, Q.O.; Kadyampakeni, D.; Nkedi-Kizza, P.; Barlas, N.; Atta, A.; Morgan, K. Comparative response of Huanglongbing-Affected sweet orange trees to nitrogen and zinc fertilization under microsprinkler irrigation. Agriculture 2020, 10, 489. [Google Scholar] [CrossRef]
  6. Atta, A.A.; Morgan, K.T.; Kadyampakeni, D.M.; Mahmoud, K.A. The effect of foliar and ground-applied essential nutrients on Huanglongbing-affected mature citrus trees. Plants 2021, 10, 925. [Google Scholar] [CrossRef]
  7. Hamido, S.A.; Morgan, K.T. Effect of various irrigation rates on growth and root development of young citrus trees in high-density planting. Plants 2020, 9, 1462. [Google Scholar] [CrossRef]
  8. Kadyampakeni, D.M.; Morgan, K.T.; Schumann, A.W.; Nkedi-Kizza, P.; Mahmoud, K. Ammonium and nitrate distribution in soil using drip and microsprinkler irrigation for citrus production. Soil Sci. Soc. Am. J. 2014, 78, 645–654. [Google Scholar] [CrossRef]
  9. Hamido, S.A.; Morgan, K.T. The effect of irrigation rate on the water relations of young citrus trees in high-density planting. Sustainability 2021, 13, 759. [Google Scholar] [CrossRef]
  10. Morgan, K.T.; Kadyampakemi, D. Open field hydroponics: Concept and application. In Advances in Citrus Nutrition; Srivastava, A.K., Ed.; Springer: Berlin/Heidelberg, Germany, 2012; pp. 271–280. [Google Scholar] [CrossRef]
  11. Fu, X.; Xing, F.; Cao, L.; Chun, C.; Ling, L. Effects of foliar application of various zinc fertilizers with organosilicone on correcting citrus zinc deficiency. HortScience 2016, 51, 422–426. [Google Scholar] [CrossRef] [Green Version]
  12. Atta, A.A.; Morgan, K.T.; Hamido, S.A.; Kadyampakeni, D.M.; Mahmoud, K.A. Water and Soil Nutrient Dynamics of Huanglongbing-Affected Citrus Trees as Impacted by Ground-Applied Nutrients. Agronomy 2020, 10, 1485. [Google Scholar] [CrossRef]
  13. Graham, J.H.; Johnson, E.G.; Gottwald, T.R.; Irey, M.S. Presymptomatic fibrous root decline in citrus trees caused by huanglongbing and potential interaction with phytophthora spp. Plant Dis. 2013, 97, 1195–1199. [Google Scholar] [CrossRef] [PubMed] [Green Version]
  14. Holt, N.; Sishodia, R.P.; Shukla, S.; Hansen, K.M. Improved water and economic sustainability with low-input compact bed plasticulture and precision irrigation. J. Irrig. Drain. Eng. 2019, 145, 04019013. [Google Scholar] [CrossRef]
  15. Siebert, S.; Burke, J.; Faures, J.M.; Frenken, K.; Hoogeveen, J.; Döll, P.; Portmann, F.T. Groundwater use for irrigation—A global inventory. Hydrol. Earth Syst. Sci. 2010, 14, 1863–1880. [Google Scholar] [CrossRef] [Green Version]
  16. Atta, A.A.; Morgan, K.T.; Mahmoud, K.A. Split application of nutrients improve growth and yield of Huanglongbing-affected citrus trees. Soil Sci. Soc. Am. J. 2021, 85, 2040–2053. [Google Scholar] [CrossRef]
  17. Zambon, F.T.; Kadyampakeni, D.M.; Grosser, J.W. Ground application of overdoses of manganese have a therapeutic effect on sweet orange trees infected with Candidatus Liberibacter asiaticus. HortScience 2019, 54, 1077–1086. [Google Scholar] [CrossRef] [Green Version]
  18. Stansly, P.A.; Arevalo, H.A.; Qureshi, J.A.; Jones, M.M.; Hendricks, K.; Roberts, P.D.; Roka, F.M. Vector control and foliar nutrition to maintain economic sustainability of bearing citrus in Florida groves affected by huanglongbing. Pest Manag. Sci. 2014, 70, 415–426. [Google Scholar] [CrossRef]
  19. Aubert, B. Huanglongbing (HLB) a Diagnosis and Strategies for Control in Reunion Island a Case Study. IRCHLB Proc. 2008, 1–34. Available online: https://swfrec.ifas.ufl.edu/hlb/database/pdf/22_IRCHLB_08.pdf (accessed on 2 April 2022).
  20. Pustika, A.B.; Subandiyah, S.; Holford, P.; Beattie, G.A.C.; Iwanami, T.; Masaoka, Y. Interactions between plant nutrition and symptom expression in mandarin trees infected with the disease huanglongbing. Australas. Plant Dis. Notes 2008, 3, 112. [Google Scholar] [CrossRef]
  21. Kiggundu, N.; Migliaccio, K.W.; Schaffer, B.; Li, Y.; Crane, J.H. Water savings, nutrient leaching, and fruit yield in a young avocado orchard as affected by irrigation and nutrient management. Irrig. Sci. 2012, 30, 275–286. [Google Scholar] [CrossRef]
  22. Kadyampakeni, D.M.; Morgan, K.T.; Schumann, A.W.; Nkedi-Kizza, P.; Obreza, T.A. Water use in drip- and microsprinkler-irrigated citrus trees. Soil Sci. Soc. Am. J. 2014, 78, 1351. [Google Scholar] [CrossRef]
  23. Kadyampakeni, D.M.; Morgan, K.T.; Schumann, A.; Alfred, L.; Nkedi-kizza, P. Phosphorus and potassium distribution and adsorption on two florida sandy soils. Soil Sci. Soc. Am. J. 2014, 78, 325–334. [Google Scholar] [CrossRef]
  24. Obreza, T.A.; Morgan, K.T. Recommended fertilizer rates and timing. In Nutrition of Florida Citrus Trees; Elec. Data Info. Source, SL 253; University of Florida Institute of Food and Agricultural Sciences: Gainesville, GL, USA, 2008. [Google Scholar]
  25. Atta, A.A.; Morgan, K.T.; Hamido, S.A.; Kadyampakeni, D.M. Effect of essential nutrients on roots growth and lifespan of huanglongbing affected citrus trees. Plants 2020, 9, 483. [Google Scholar] [CrossRef] [Green Version]
  26. Hall, D.G.; Road, S.R.; Pierce, F.; Albrigo, L.G. Estimating the relative abundance of flush shoots in citrus with implications on monitoring insects associated with flush. HortScience 2007, 42, 364–368. [Google Scholar] [CrossRef] [Green Version]
  27. Jenkins, D.A.; Hall, D.G.; Goenaga, R. Diaphorina citri (Hemiptera: Liviidae) abundance in Puerto Rico declines with elevation. J. Econ. Entomol. 2015, 108, 252–258. [Google Scholar] [CrossRef] [PubMed]
  28. Ringuet, S.; Sassano, L.; Johnson, Z.I. A suite of microplate reader-based colorimetric methods to quantify ammonium, nitrate, orthophosphate and silicate concentrations for aquatic nutrient monitoring. J. Environ. Monit. 2011, 13, 370–376. [Google Scholar] [CrossRef] [PubMed]
  29. Scrimgeour, C. Soil Sampling and Methods of Analysis, 7th ed.; Carter, M.R., Gregorich, E.G., Eds.; CRC Press: Boca Raton, FL, USA, 2008; p. 1224. ISBN 978-0-8593-3586-0. [Google Scholar]
  30. Abrisqueta, J.M.; Mounzer, O.; Álvarez, S.; Conejero, W.; García-Orellana, Y.; Tapia, L.; Vera, J. Root dynamics of peach trees submitted to partial rootzone drying and continuous deficit irrigation. Agric. Water Manag. 2008, 95, 959–967. [Google Scholar] [CrossRef]
  31. Box, J.E.; Smucker, A.J.M.; Ritchie, J.T. Minirhizotron installation techniques for investigating root responses to drought and oxygen stresses. Soil Sci. Soc. Am. J. 1989, 53, 115–118. [Google Scholar] [CrossRef]
  32. Keel, S.G.; Pepin, S.; Leuzinger, S.; Körner, C. Stomatal conductance in mature deciduous forest trees exposed to elevated CO2. Trees-Struct. Funct. 2007, 21, 151–159. [Google Scholar] [CrossRef] [Green Version]
  33. McCutchan, H.; Shackel, K.A. Stem-water potential as a sensitive indicator of water stress in prune trees (Prunus domestica L. cv. French). J. Am. Soc. Hortic. Sci. 2019, 117, 607–611. [Google Scholar] [CrossRef] [Green Version]
  34. Hamido, S.A.; Ebel, R.C.; Morgan, K.T. Interaction of huanglongbing and foliar applications of copper on water relations of Citrus sinensis cv. Valencia. Plants 2019, 8, 298. [Google Scholar] [CrossRef] [PubMed] [Green Version]
  35. Hamido, S.A.; Morgan, K.T.; Ebel, R.C.; Kadyampakeni, D.M. Improved irrigation management of sweet orange with Huanglongbing. HortScience 2017, 52, 916–921. [Google Scholar] [CrossRef]
  36. Sato, S.; Morgan, K.T.; Ozores-Hampton, M.; Simonne, E.H. Spatial and temporal distributions in sandy soils with seepage irrigation: I. ammonium and nitrate. Soil Sci. Soc. Am. J. 2009, 73, 1044–1052. [Google Scholar] [CrossRef]
  37. Paramasivam, S.; Alva, A.K.; Fares, A.; Sajwan, K.S. Fate of nitrate and bromide in an unsaturated zone of a sandy soil under citrus production. J. Environ. Qual. 2002, 31, 671–681. [Google Scholar] [CrossRef]
  38. Quiñones, A.; Martínez-Alcántara, B.; Legaz, F. Influence of irrigation system and fertilization management on seasonal distribution of N in the soil profile and on N-uptake by citrus trees. Agric. Ecosyst. Environ. 2007, 122, 399–409. [Google Scholar] [CrossRef]
  39. Uthman, Q.O.; Kadyampakeni, D.M.; Nkedi-Kizza, P. Manganese adsorption, availability, and uptake in citrus under microsprinkler irrigation. Agrosyst. Geosci. Environ. 2020, 3, e20061. [Google Scholar] [CrossRef]
  40. Hippler, F.W.R.; Boaretto, R.M.; Quaggio, J.A.; Boaretto, A.E.; Abreu-Junior, C.H.; Mattos, D., Jr. Uptake and distribution of soil applied zinc by Citrus trees—Addressing fertilizer use efficiency with 68Zn labeling. PLoS ONE 2015, 10, e0116903. [Google Scholar] [CrossRef]
  41. Srivastava, A.K.; Singh, S. Zinc nutrition, a global concern for sustainable citrus production. J. Sustain. Agric. 2015, 25, 5–42. [Google Scholar] [CrossRef]
  42. Kadyampakeni, D.M.; Morgan, K.T. Nutrition of Florida Citrus Trees, in Special Situations; Elec. data info. Source, SL465; University of Florida Institute of Food and Agricultural Sciences: Gainesville, GL, USA, 2008. [Google Scholar]
  43. Morgan, K.T.; Graham, J.H. Nutrient status and root density of Huanglongbing-affected trees: Consequences of irrigation water bicarbonate and soil pH mitigation with acidification. Agronomy 2019, 9, 746. [Google Scholar] [CrossRef] [Green Version]
  44. Brunner, I.; Sperisen, C. Aluminum exclusion and aluminum tolerance in woody plants. Front. Plant Sci. 2013, 4, 172. [Google Scholar] [CrossRef] [Green Version]
  45. Ebel, R.C.; Hamido, S.; Morgan, K.T.; Bov, F. Interaction of huanglongbing and foliar applications of copper on growth and nutrient acquisition of Citrus sinensis cv. Valencia. HortScience 2019, 54, 297–302. [Google Scholar] [CrossRef] [Green Version]
  46. Hu, L.M.; Xia, R.X.; Xiao, Z.Y.; Huang, R.H.; Tan, M.L.; Wang, M.Y.; Wu, Q.S. Reduced leaf photosynthesis at midday in citrus leaves growing under field or screenhouse conditions. J. Hortic. Sci. Biotechnol. 2007, 82, 387–392. [Google Scholar] [CrossRef]
  47. Annamalainathan, K.; Joseph, J.; Alam, B.; Satheesh, P.R.; Jacob, J. Seasonal changes in xylem sap flow rate in mature rubber plants. J. Plantaion Crop. 2013, 41, 343–349. [Google Scholar]
  48. Fassio, C.; Heath, R.; Arpaia, M.L.; Castro, M. Sap flow in ‘Hass’ avocado trees on two clonal rootstocks in relation to xylem anatomy. Sci. Hortic. 2009, 120, 8–13. [Google Scholar] [CrossRef]
Figure 1. The mean rainfall and reference evapotranspiration (ETo), maximum, and minimum temperature of Immokalee, FL, ten years data (2010–2021).
Sustainability 14 07134 g001
Figure 2. The mean monthly total rainfall and reference evapotranspiration (ETo) and amount of irrigation received by the trees during the study duration, 2019–2021.
Sustainability 14 07134 g002
Figure 3. The spatial and temporal soil ammonium nitrogen (NH4-N) and nitrate-nitrogen (NO3-N) dynamics at three soil depths (AC) and (DF), respectively. Bars ± standard error of the mean values on vertical columns (n = 12 trees) with different lowercase letters are significantly different at p < 0.05, based on Tukey’s honestly significant difference test.
Sustainability 14 07134 g003
Figure 4. The mean (n = 12 trees) values of spatial and temporal soil Mn and Zn dynamics at three soil depths (AC) and (DF), respectively. Treatments: closed circles 0× (control), closed triangles foliar only 1× (1×), open circles foliar 1× and soil-applied 1× (2×), and open triangles foliar 1× and soil-applied 2× (3×), (1× = 9 kg ha−1 year−1 of Mn and Zn each and 2.3 kg ha−1 year−1 of B). Asterisks: ** and *** represent significant at p < 0.01 and p < 0.0001, respectively.
Sustainability 14 07134 g004
Figure 5. Mean fine root length density of Swingle rootstock (n = eight minirhizotron data) on Sweet orange (cv. Valencia) during the 2020 and 2021 growing seasons. Bars are the mean seasonal fine root length density (n = 8 trees) ± SEM. Letters on the legend followed by different lowercase letters are significantly different at p < 0.05, according to the Tukey’s honestly significant difference test. Asterisks: *** represent ANOVA significant level at p < 0.0001. Treatments: 0× (control), foliar only 1× (1×), foliar 1× and soil-applied 1× (2×), and foliar 1× and soil-applied 2× (3×), (1× = 9 kg ha−1 year−1 of Mn and Zn each and 2.3 kg ha−1 year−1 of B).
Sustainability 14 07134 g005
Figure 6. Diurnal solar radiation and sap flow rate pattern using sap flow sensors (Flow32-1K.; Dynamax®) in reaction to treatments: 0× (control), foliar only 1× (1×), foliar 1× and soil-applied 1× (2×), and foliar 1× and soil-applied 2× (3×), (1× = 9 kg ha−1 year−1 of Mn and Zn each and 2.3 kg ha−1 year−1 of B) during spring 2020–2021.
Sustainability 14 07134 g006
Figure 7. Logarithmic relationship of solar radiation and sap flow in reaction to the treatments: panels (AD): 0× (control), foliar only 1× (1×), foliar 1× and soil-applied 1× (2×), and foliar 1× and soil-applied 2× (3×), (1× = 9 kg ha−1 year−1 of Mn and Zn each and 2.3 kg ha−1 year−1 of B), respectively. The NS or asterisks: ** and *** represent none significant or significant at p < 0.001, and < 0.0001, respectively.
Sustainability 14 07134 g007
Table 1. The physicochemical property of Immokalee fine sand at the study site.
Soil Depth pH aNO3-NNH4-N PKCaMgMnZnBCuFeOrganic Matter 2Cation Exchange Capacity 2Bulk Density 2
(cm) ------------------------------ (mg kg−1) 1 -----------------------------------%cmolc kg−1g cm−3
0–155.670.812.79193319517842.017520.617.631.62
15–305.930.992.681531187171042.015500.410.741.62
30–456.291.242.07102213110433.011500.490.331.59
a Soil acidity measurements were conducted with a soil/water ratio of 1:2 by volume. 1 Data of two years studies taken in the spring seasons of 2019–2021. 2 Data adopted from Kadyampakeni et al. [8,22].
Table 2. Foliar and soil-applied essential nutrients on mature HLB-affected citrus trees in Florida sandy soils.
Method and Rate of Application (kg ha−1 year−1)
Soil 2Foliar 3Soil 4
Treatments 1N MnZnBMnZnB
168̶̶̶̶̶̶
224̶̶̶̶̶̶
280̶̶̶̶̶̶
168992.3̶̶̶
224992.3̶̶̶
280992.3̶̶̶
168992.3992.3
224992.3992.3
280992.3992.3
168992.318184.6
224992.318184.6
280992.318184.6
1 Treatment packages: 0× (control), foliar only 1× (1×), foliar 1× and soil-applied 1× (2×), and foliar 1× and soil-applied 2× (3×), (1× treatment = 9 kg ha−1 year−1 of Mn and Zn each and 2.3 kg ha−1 year−1 of B). 2 Nitrogen fertigation, 3 foliar, and 4 soil-applied micronutrient applications.
Table 3. Soil nutrient concentration of essential nutrients at 0–15 cm soil depth under Huanglongbing-affected sweet orange (cv. ‘Valencia Late’) on Swingle rootstocks at Immokalee, FL, during the 2020–2021 growing seasons.
Soil Nutrient Concentration (mg kg−1) 2
Spring
Treatments 1NO3-NNH4-NPKCaMgBCuFe
0.8 ± 0.11.8 ± 0.2 b19 ± 1.733 ± 1.1195 ± 1417 ± 1.41.1 ± 0.115 ± 1.2 b52 ± 3.0
0.7 ± 0.12.0 ± 0.2 ab12 ± 1.127 ± 1.9165 ± 1213 ± 1.01.2 ± 0.118 ± 1.4 a36 ± 2.4
0.9 ± 0.22.7 ± 0.4 a14 ± 1.028 ± 1.2172 ± 139 ± 0.51.4 ± 0.115 ± 0.7 ab36 ± 2.7
0.7 ± 0.12.2 ± 0.2 ab16 ± 1.732 ± 1.7143 ± 1216 ± 1.31.6 ± 0.220 ± 1.2 ab46 ± 1.8
Model EffectANOVA
Nitrogen**NSNSNSNSNSNSNSNS
MicronutrientNS*NSNSNSNSNS*NS
DepthNS*******NSNS**NS
Nitogen × DepthNSNS**NSNS***NSNS*
Summer
1.6 ± 0.22.7 ± 0.211 ± 1.322 ± 1.9252 ± 16 ab18 ± 1.4 a0.9 ± 0.0 6.1 ± 0.436 ± 1.9
1.3 ± 0.12.3 ± 0.114 ± 1.220 ± 1.7306 ± 25 a16 ± 1.2 ab1.3 ± 0.36.9 ± 0.633 ± 2.5
1.3 ± 0.11.8 ± 0.111 ± 1.613 ± 1.1224 ± 28 b12 ± 1.2 ab0.8 ± 0.14.8 ± 0.423 ± 2.3
1.3 ± 0.12.3 ± 0.117 ± 2.416 ± 1.3231 ± 23 ab16 ± 1.41.1 ± 0.16.8 ± 0.640 ± 2.8
Model EffectANOVA
Nitrogen**NSNS*****NS
MicronutrientNSNSNSNSNSNSNSNSNS
Depth*NSNS*******NS*NS
Nitogen × DepthNSNS**NSNSNS***NS**
1 Treatments: 0× (control), foliar only 1× (1×), foliar 1× and soil-applied 1× (2×), and foliar 1× and soil-applied 2× (3×), (1× = 9 kg ha−1 year−1 of Mn and Zn each and 2.3 kg ha−1 year−1 of B). 2 Values are the mean (n = 12 trees) ± standard error and those on vertical columns followed by different lowercase letters are significantly different at p < 0.05, according to the Tukey’s honestly significant difference test. The NS or asterisks: *, **, and *** represent non-significant or significant at p ≤ 0.05, < 0.01, and < 0.0001, respectively.
Table 4. Mean root-zone soil pH of foliar and ground-applied Mn and Zn treatments (n = 12) in Immokalee fine sand at three soil depths.
SpringSummer
Depths (cm)
Micro 10–1515–3030–450–1515–3030–45
6.1 ± 0.13 a 26.3 ± 0.12 a6.6 ± 0.09 a5.6 ± 0.07 a5.9 ± 0.11 a6.3 ± 0.10 a
5.8 ± 0.08 a6.3 ± 0.10 a6.6 ± 0.11 a5.7 ± 0.08 a5.8 ± 0.10 a6.2 ± 0.11 a
5.4 ± 0.09 b5.6 ± 0.13 b6.0 ± 0.15 b5.3 ± 0.11 ab5.2 ± 0.18 b5.6 ± 0.18 b
5.2 ± 0.07 b5.4 ± 0.12 b5.7 ± 0.18 b5.0 ± 0.09 b5.1 ± 0.08 b5.5 ± 0.11 b
p-value******************
N rate (Kg ha−1)
Depth (cm) 3168224280168224280
0–155.6 ± 0.15 a5.6 ± 0.12 a5.6 ± 0.14 a5.5 ± 0.13 a5.3 ± 0.11 a5.4 ± 0.11 a
15–305.9 ± 0.15 ab5.9 ± 0.17 ab5.9 ± 0.14 ab5.6 ± 0.14 ab5.5 ± 0.15 ab5.4 ± 0.17 ab
30–456.2 ± 0.15 b6.2 ± 0.17 b6.3 ± 0.2 b5.9 ± 15 b5.9 ± 0.15 b5.8 ± 0.18 b
p-value*******
Model effect 4ANOVA
Depth*****
Micronutrient******
Nitogen × DepthNS**
1 Treatments: 0× (control), foliar only 1× (1×), foliar 1× and soil-applied 1× (2×), and foliar 1× and soil-applied 2× (3×), (1× = 9 kg ha−1 year−1 of Mn and Zn each and 2.3 kg ha−1 year−1 of B). 2 Values are the mean of two years and those on vertical columns followed by different lowercase letters are significantly different at p < 0.05, according to the Tukey’s honestly significant difference test. 3 Soil depths along with the soil profile. 4 The NS or asterisks on the model (depth, micro, and Nitrogen effects represented as *, **, and ***) were significant at p ≤ 0.05, 0.001, or <0.0001, respectively.
Table 5. Mean stem water potential (ψstem) and stomata conductance (gs) of HLB-affected Valencia citrus trees (n = 12) as affected by foliar and ground-applied Mn and Zn treatments.
Stem Water Potential (Mpa)Stomata Conductance (mmol m−2 s−1)
Micro 1SpringSummerSpringSummer
0.94 ± 0.04 21.18 ± 0.05 a313 ± 13 a185 ± 18
0.93 ± 0.031.25 ± 0.06 ab383 ± 20 b205± 13
0.98 ± 0.041.25 ± 0.05 ab349 ± 15 ab197 ± 16
1.03 ± 0.031.32 ± 0.0 8b349 ± 17 ab188 ± 18
p-valueNS***NS
Model effect 3ANOVA
Season*****
Micronutrient***
1 Treatments: 0× (control), foliar only 1× (1×), foliar 1× and soil-applied 1× (2×), and foliar 1× and soil-applied 2× (3×), (1× = 9 kg ha−1 year−1 of Mn and Zn each and 2.3 kg ha−1 year−1 of B). 2 Values are the mean of two years and those on vertical columns followed by different lowercase letters are significantly different at p < 0.05, according to the Tukey’s honestly significant difference test. 3 The NS or asterisks: *, **, and *** represent none significant or significant at p ≤ 0.05, 0.001, and <0.0001, respectively.
Publisher’s Note: MDPI stays neutral with regard to jurisdictional claims in published maps and institutional affiliations.

