Abstract
Thermal compression-driven heat pump plants usually use solar collectors only providing direct heating when possible and low-temperature (but higher than outside air) cold sources for the heat pump evaporator otherwise. At the same time, solar collectors drive absorption chillers only during summer. In this paper, the possibility of employing evacuated tube collectors to drive an absorption heat pump that operates in summer as a chiller was evaluated from both energy and economic points of view. The ground and solar energy at low temperature were used as cold sources. The ground can be recharged by the cooling of the absorber/condenser in the summer and by solar energy during the mid-seasons. The yearly operation analysis in two different climates here proposed also considered also the utilization of suitable storage capabilities varying the size of the ground probes, solar field, and Generator Tank. A primary energy ratio of 4.75 in a cold and cloudy climate and of 5.9 in a warmer and clearer sky climate was obtained in the best plant configuration. An economic analysis on the actual investment costs was presented. The final evaluation considered a cost reduction on the basis of recent price lists available on the Asian market.
1. Introduction
One of the first technologies studied after the 1973 energy crisis was solar thermal cooling. Many pilot plants have been implemented in the past, but the technology has not taken off. Over and over, intergovernmental organizations [1,2] or multistakeholder governance groups [3] highlighted the importance of the continuous development of solar cooling. Despite this, the last recorded installation record worldwide was only 1350 plants up to 2015, most of them in Europe [4]. In China, only a few tens of solar thermal cooling plants have been installed [5]. The main reason is that the system appears expensive and complex, and this often limits the use of these systems to demonstration projects [6]. Recently, Al-Yasiri et al. compared different solar thermal air conditioning systems based on technical, operational, economic, and environmental parameters [7]. Numerical studies, conducted mainly by the TRNSYS [8] dynamic tool, were used much more than experimental studies because of the complexity of such systems.
As one of the main aspects, in temperate climates the ab/adsorption chiller in thermal solar cooling is utilized only in summer, and the solar section provides some contributions to winter heating or domestic hot water (DHW) production to the extent allowed by the lower solar energy availability in winter, so that the investment cost is even less advisable. Khan et al. [9] simulated a single-effect solar-based absorption cooling system with a peak cooling capacity of 298 kW. They highlighted that evacuated tube collectors (ETC) had a monthly efficiency of up to 30% in comparison with the flat plate solar collector (FPC). The design of an 8.4 kW thermal solar cooling warehouse was studied in a remote area in Senegal to conserve three tons of fish per day [10]; the thermal collector area and the solar cooling efficiency were determined considering the meteorological data and the predicted cooling load.
In addition, just in the first decade of the present century, the progressive reduction in the cost of photovoltaic (PV) panels highlighted the possible competition by solar PV-driven compression cooling systems. The further impressive reduction in PV prices over the last decade has accelerated this process, and now the competition for solar electric cooling in terms of overall cost is on par with conventional air conditioning [11]. As a matter of fact, in recent years many studies have been proposed to evaluate the energy performance of electric and thermal solar cooling technologies. For example, Hartmann et al. [12] presented a comparison for a typical small office building in two different European climates (Freiburg and Madrid). They concluded that to have the same primary energy savings, it was necessary to have a solar electrical collector area six times smaller than the solar thermal collector field. In another study [13], a Life Cycle Assessment of energy performance of PV and thermal solar-assisted cooling systems was presented compared with conventional ones. The authors highlighted that the PV grid-connected plant frequently performed best. More recently, TRNSYS software [8] has been used to model solar photovoltaic and thermal air conditioning systems under different conditions, temperature, surface area, yield, and cost [14]. The authors found that the absorption systems allowed saving up to 170% of the total energy with respect to electric compression systems during the hot season.
The application of the ab/adsorption chiller as a heat pump was proposed to improve the annual performance of a solar cooling plant in a temperate climate [15]. An ab/adsorption heat pump operates in the same way as an absorption cooling unit, but now the useful effect is provided by the cooling of the ad/absorber condenser, whereas the generator is driven by a traditional boiler. Solar collectors were considered to be a suitable cold source (to feed the evaporator heat pump) whenever the solar radiation intensity did not allow direct use of the collected heat. The primary energy ratio (PER) of an absorption heat pump can exceed 1.6 if the evaporator is kept at temperatures greater than 10 °C. Then, an all-year utilization of the system would be possible for heating and cooling.
The above reasoning did not consider the impressive development of ETCs with a strong reduction of thermal losses compared with the old models, so that they can operate efficiently at temperatures as high as 80–90 °C even with low ambient temperatures [11]. As an example, a modern ETC can work at 90 °C with 50% efficiency for an ambient temperature of 0 °C and a solar radiation intensity of only 400 W m−2. The idea is to reverse the above-proposed scheme in the sense that the ab/adsorption heat pump can be driven by the solar section whenever possible, just as in summer operation. A conventional boiler drives the heat pump in case of low levels of solar radiation, whereas the solar section can operate as a heat pump cold source.
The author of the present paper already studied a similar plant [16]; in that case, the Photovoltaic/Thermal (PVT) modules provided a further contribution as the solar heat source of the heat pump. PVTs allow an exploitation of the thermal fraction by producing hot water by cooling PV cells [17,18,19,20]. As a main novelty of the present study, only ETCs were used to drive the absorption heat pump/chiller and as heat sources of the heat pump. The presence of ETC only without PVT modules allows a more simplified plant scheme and control logic and a substantial savings in initial investment costs. In the absence of solar radiation, the proposed scheme is dual source through the use of vertical tube boreholes. At the same time, they provide a heat sink in summer operation or when solar energy exceeds requirements. An existing commercial model of a LiBr absorption heat pump has been considered. The behavior of such a system is considered for cooling and heating of an existing real building in two quite different climates for different sizes of both the solar section and the ground field. As a further novelty of the present study with respect to the scheme in ref. [16], a final economic analysis is proposed to investigate the possible feasibility of the system.
2. Methods
The simulation model of the multisource absorption ETC-driven heat pump developed in TRNSYS [8] is described in this section. The system was dynamically simulated (with a 15 min time step) to find the best size of the equipment to optimize energy performance.
2.1. Description of the Simulation Model
2.1.1. The Building and Thermal Loads
The study proposed here is based on an existing building located at the ENEA Casaccia Research Center near Rome (Italy). The building is used for teaching activities for the “Scuola delle energie” (“Energies School”), so teaching rooms and offices are present. The three floors (basement, ground, and first floor) comprise a floor surface of 230 m2 and a volume of 620 m3. The plant and building were modeled by TRNSYS [8]. ENEA provided details about the thermal characteristics of opaque and transparent surfaces, thermal/cooling plant schedules, and internal gains [21]. Thermal loads for heating and cooling were calculated based on the climatic data of two Italian resorts (EN ISO 15927-4 European standard [22]). Belluno and Rome (respectively 46.14° N and 41.9° N latitude) were chosen, and had very different air temperature Ta and clearness indexes MT [23] (Figure 1).
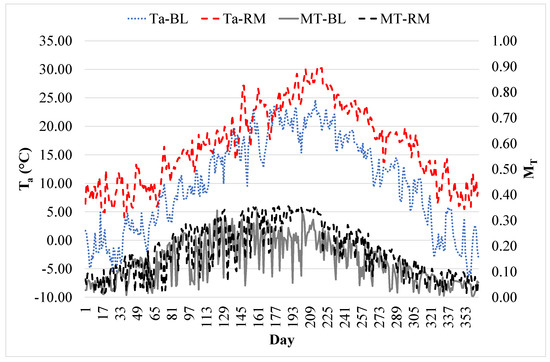
Figure 1.
Daily average values of the clearness index (MT) and outside air temperature (Ta) (RM = Rome, BL = Belluno).
Taking into account an appropriate scheduling for the internal gains and the presence of people, the following thermal loads and needs were determined:
- heating season (1 November–15 April for Rome, 15 September–30 April for Belluno): 11 kW and 16 kW, 11.18 GJ y−1 and 49.2 GJ y−1 (13.5 and 59.4 kWh m−2 y−1) respectively for Rome and Belluno;
- cooling season: 15.9 kW and 10 kW, 35.5 GJ y−1 and 12.5 GJ y−1 (42.9 and 15.1 kWh m−2 y−1) respectively for Rome and Belluno.
The demand for domestic hot water is very low due to the kind of use of the building and was not considered in this study.
2.1.2. The Cooling and Heating Plant
As an original feature of the plant, the ETCs drive the thermally driven absorption heat pump. Furthermore, they provide heat as the heat pump source (HEX2 in the simplified plant scheme in Figure 2) or for direct heating (by HEX1) in case the temperature is sufficient. In Figure 2, the main equipment is coupled using appropriate storage tanks.
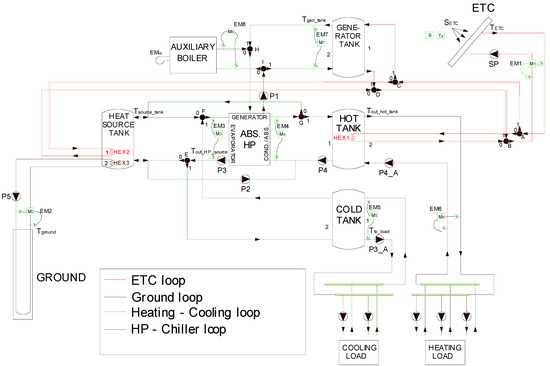
Figure 2.
Scheme of the heating and cooling plant: pumps are named Pi, the letters from A to I name the flow mixers and diverters whose flows are numbered as 0 and 1, EMNG is the input power to the Auxiliary Boiler as natural gas (NG), and EMi represents the energy meters which are based on flow (Mi) and temperature (Ti) measurements.
Four main loops characterize the plant, whose control logic is described in Section 2.2:
- ETC loop: ETCs produce hot water that is used to drive the heat pump (Generator Tank) or for direct heating (by means of HEX1 in the Hot Tank);
- Ground loop: allows keeping the temperature of the Heat Source Tank within the right range as the heat source of the heat pump (2–20 °C);
- Heating—Cooling loop: the Cold Tank and the Hot Tank satisfy the cooling and the heating load, respectively;
- Heat Pump—Chiller loop: the Heat Source Tank is fed by the ETCs and by the ground, providing the heat pump cold source. The Hot Tank is fed by the heat pump condenser, facing the heating load. The Cold Tank is cooled by the heat pump evaporator facing the cooling load. During the operation of the heat pump as a chiller, the heat pump condenser can provide useful heat. In summer, excess heat (i.e., from the heat pump condenser and the solar field) is directed to recharge the ground.
The control logic is based on an operation threshold of 50 W m−2 of solar radiation intensity (SETC), and on the comparison of the temperatures in the different circuits with the suitable set points of the tanks (Figure 2). Every floor of the building is supplied by an independent circuit (fan coils for the basement, both radiant floors, and fan coils for the other two floors).
2.1.3. Equipment Modeling
A modern collector (tilt 30°, azimuth 0°) with a very low first-order heat loss coefficient (Table 1 and Table 2) was modeled by type 71.

Table 1.
Characteristics of the Evacuated Tube Collector (http://en.kloben.it/uploads/files/ProductAttachment/SCHEDA_PRODOTTO_SKY_PRO1800eng_hi.pdf, accessed on 14 March 2022).
Table 2.
Incident Angle Modifier of the evacuated tube collector.
The ground field was modeled by type 557a and was composed of n × 50 m in a vertical-row tube U heat exchanger with an outer diameter of 32 mm and a thickness of 2.9 mm. n varied with the ETC field area. The thermal properties of the ground were: conductivity 2.87 W m−1 K−1, heat capacity 2016 kJ m−3 K−1. Type 4a modeled the Cold Tank and the Generator Tank, whereas type 60d modeled the Hot Tank and the Heat Source Tank. The water–water absorption heat pump, whose capacity was selected based on the maximum thermal load, was modelled by type 927 based on nominal data from a manufacturer on thermal power consumption, and thermal and cooling power produced (Figure 3). Performance was calculated using the TRNSYS [8] type by interpolating the data of the figure at the different operating temperatures of the heat source (2 ≤ Tsource_tank ≤ 20 °C), the heat sink (Hot Tank or Heat Source Tank max 40 °C), and the generator (75 ≤ Tgen_tank ≤ 95 °C). Such data were reported in a text file.
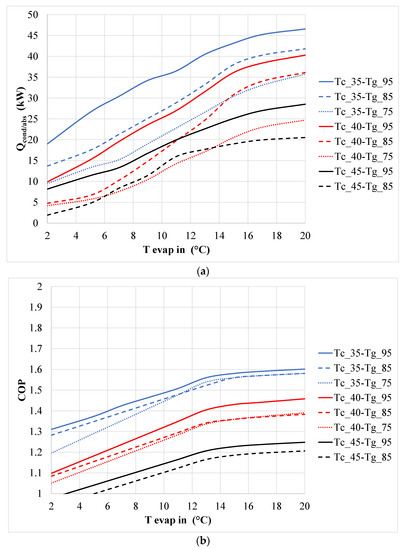
Figure 3.
Performance data of a commercial thermally driven w/w absorption heat pump/chiller varying the outlet absorber/condenser temperature (Tc), inlet evaporator (Tevap in), and inlet generator temperature (Tg): (a) useful thermal power at condenser/absorber; (b) coefficient of performance (COP).
Refer to Table 3 for a brief description of the main types used in the TRNSYS [8] model of the simulated plant.
Table 3.
Main types in the TRNSYS [8] model.
2.2. Plant Control Strategy
The control logic of the main apparatus is reported in this section.
2.2.1. ETC Operation
Heating season: the thermal energy of the ETC field for two values of the reduced-temperature Tred determined its operation logic. Tred is defined in Equation (1) as the ratio of the difference between the mean temperature inside the collector (Tm) and the external air temperature (Ta) with the global solar radiation on the tilted surface SETC:
The first value of Tred (Tred1) depended on the return temperature of the Generator Tank, and Tred2 on the return temperature from the Hot Tank (with Tred1 > Tred2). In correspondence of Tred1 and Tred2, the thermal efficiency of ETC was calculated as in Equation (2):
η0 is the zero-order efficiency coefficient (that is, optical efficiency), a1 is the first-order efficiency coefficient (that is, the heat loss coefficient), and a2 is the second-order efficiency coefficient (that is, the temperature dependence of the heat loss coefficient) (Table 1). The thermal energy usefully produced by the plant (Qus) was then calculated in the two following cases (COP is the coefficient of performance of the heat pump, HP):
- heating by HP: Qus,1 = ηth,ETC,1⋅SETC⋅COP;
- heating by ETC: Qus,2 = ηth,ETC,2⋅SETC.
The greatest value between Qus,1 and Qus,2 determined the ETC field operation:
- if Qus,1 < Qus,2: ETC field fed the Hot Tank (A = B = 0) (direct heating by ETC).In case Tred < Tred2, the ETC field fed the Heat Source Tank (valves A = B = 1, C = D = 0);
- if Qus,1 > Qus,2: ETC field fed the Generator Tank (valves in Figure 2 A = B = C = D = 1) (indirect heating by HP).
Cooling season: valves A and B were both 1 (there were no heating loads, so there was no direct heating). The Generator Tank outlet temperature determined the ETC operation:
- if Tgen_tank < 95 °C: ETC fed the Generator Tank to drive the absorption HP generator (C = D = 1)
- if Tgen_tank > 95 °C: ETC fed the Heat Source Tank to regenerate the ground (C = D = 0).
2.2.2. Thermally Driven HP/Chiller Operation
Heating season: the machine operated as a heat pump, with the Heat Source Tank feeding the evaporator and the absorber/condenser feeding the Hot Tank. HP was operating when (COOLING_LOADS = 0 AND Tout_hot_tank < 40 °C).
Cooling season: the chiller was operating when (COOLING_LOADS > 0 AND Tto_load > 12 °C). Two operation modes were possible: if Tout_hot_tank < 38 °C the absorber/condenser was connected to the Hot Tank (operation with heat recovery); if Tout_hot_tank > 40 °C the absorber/condenser was connected to the Heat Source Tank (operation without heat recovery) (Table 4).
Table 4.
Status of the pump and valve control variables for the HP-Chiller loop (see Figure 2).
The HP/Chiller generator could be fed by the Generator Tank (when Tgen_tank > 75 °C, valves H = I = 1) or by an Auxiliary Boiler (when Tgen_tank < 75 °C, valves H = I = 0). In the latter case, the efficiency of the boiler was supposed constant and equal to 0.9.
2.2.3. Heat Source Tank Operation
The useful range for Tsource_tank was 2–20 °C. In case Tsource_tank > 20 °C, P5 was activated to use the ground as a thermal energy heat sink by HP or ETC. In case Tsource_tank < 2 °C, P5 was turned on and the ground acted as the heat source for the HP.
2.2.4. Generator Tank Operation
The useful range for Tgen_tank was 75–95 °C. In case Tgen_tank > 95 °C, the ETC output was directed to the Hot Tank (valves A = B = 0) or, if the latter was satisfied (Tout_hot_tank > 40 °C), to the Heat Source Tank (A = B = 1, C = D = 0). Instead, in case Tgen_tank < 75 °C, the Auxiliary Boiler was activated, and both valves H and I were 0.
2.3. Energy Performance of the Plant
Table 5 reports the indices to evaluate the energy performance of the plant based on the results of the simulations. Electric energy to drive auxiliary systems like pumps is considered to be withdrawn from the grid and converted to non-renewable primary energy by means of the non-renewable primary energy factor by Italian Decree DM 26/06/2015: fP,nren (electricity from the grid) = 1.95.
Table 5.
Energy performance indices.
As a matter of fact, the consumption of electric energy by the pumps is around 2800–3000 kWh in the Rome climate, and around 4100–4600 kWh for Belluno. These consumptions, converted in non-renewable primary energy, are not negligible at all with respect to the absorption heat pump: they are in the range between 17% and 56% for the different cases considered in the paper, mainly due to the high efficiency of the absorption heat pump and to the extended length of the ground boreholes.
3. Results and Discussion
The correct sizing of the main equipment of the plant (ETC area, Generator Tank capacity, length of the ground probes) is based on the energy performance evaluation. As the author already proved [20,24,25], increasing the solar field allows reducing the length of ground probes due to the increased contribution of solar energy to recharge the ground. Moreover, for the thermal loads and climates of the case study here considered, a minimum of 1 × 50 m vertical ground probes was considered. The size of the ground field is suitable for an absorption heat pump that usually exchanges a thermal power almost half of that of the compression heat pump with the same heating capacity. This feature was also taken into account in the following economic analysis. The Cold Tank capacity was 0.75 m3 for Belluno and 1 m3 for Rome. Instead, in both climates, the capacity of the Heat Source Tank and the Hot Tank was fixed at 1.5 m3 and 0.8, respectively. Table 6 reports the alternatives considered here, derived from different ETCs area, length of the ground probes, and Generator Tank capacity based on previous references [20,24].
Table 6.
Size of the solar ETC field, ground probes, and Generator Tank.
The results are reported as the energy balance for the main plant sections for the most favorable alternative for the milder climate (Rome) (n. 4 in Table 6) (Section 3.1). Then, a comparison is reported in terms of the energy (Section 3.2) and economic (Section 3.3) results for the different alternatives, also in comparison to the colder climate (Belluno).
3.1. Energy Analysis of the Best Alternative on a Monthly Basis
Figure 4 reports the solar energy balance for the ETC section. The positive input, that is, the solar radiation (S_ETC in the figure) is divided into four (negative) fractions:
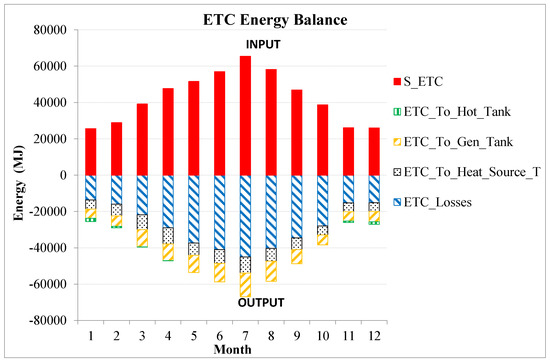
Figure 4.
Monthly ETC solar energy balances (RM).
- ETC_losses: thermal losses by convection and radiation;
- ETC_To_Gen_Tank: thermal energy to the Generator Tank for driving the heat pump/chiller;
- ETC_To_Heat_SourceT: thermal energy to the Heat Source Tank (heat pump cold source or ground recharging);
- ETC_To_Hot_Tank: thermal energy to the Hot Tank (direct heating).
ETCs offer a quite good contribution in winter as a cold source of the heat pump (gray dot in Figure 4), even if thermal losses generally are the largest part. During January (the most unfavorable month), ETC field provides 4803 MJ to the heat pump at a higher temperature than the ground source. In July, 8075 MJ of thermal energy was directed to recharge the ground (direct heating is not necessary). The main contribution of the ETC field is provided to the Generator Tank, i.e., for driving the HP. In any case, the control logic described above allows a not-negligible contribution for the direct heating (1142 MJ in January).
Figure 5 reports the energy balance of the thermally driven HP/Chiller operating throughout the year, as it satisfies both the cooling and the heating loads. During the colder months (operation as a heat pump), the Heat Source Tank operates as a cold source, whereas the Hot Tank operates as a heat sink (useful effect). For the best alternative considered here and the climate of Rome, energy needed by the generator is totally faced by the ETC field by means of the Generator Tank, and no energy is supplied by the Auxiliary Boiler. For the same climate, in case 1 of Table 6 (the one with the smallest ETC area), this percentage varied from 52% in January (the worst case) to 85% in mid-season (the best case). During hotter months (operation as a chiller), the HP/Chiller exchanges the condensation heat either to the Heat Source Tank or to the Hot Tank. In the latter case, there is a valuable heat recovery in the mid-season facing the (limited) heat loads.
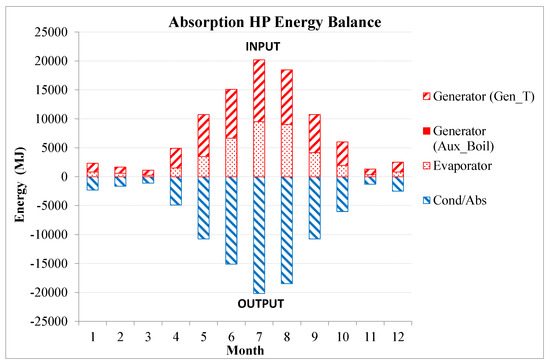
Figure 5.
Monthly HP/Chiller energy balances (RM) (in this case, no energy is supplied to the generator by the auxiliary boiler).
During the heating season, the Heat Source Tank can be alimented both by the ETCs and by the ground (Figure 6): the latter component is not so significant, while the energy from the ETC almost entirely feeds the heat pump evaporator. During the other months, the energy in output from this tank goes to the ground, whereas the energy from the heat pump condenser not requested by the heating is in the input.
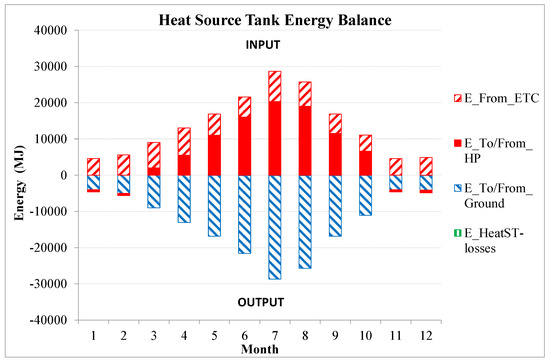
Figure 6.
Monthly energy balances of the Heat Source Tank (RM).
Regarding the Hot Tank (Figure 7), the positive contributions are provided by the heat pump absorber/condenser (until 78% in December) and direct heating by ETC (more than 50% in November). This is entirely directed at the satisfaction of the heating load (thermal losses were negligible). Finally, Figure 8 shows the energy balance of the Cold Tank.
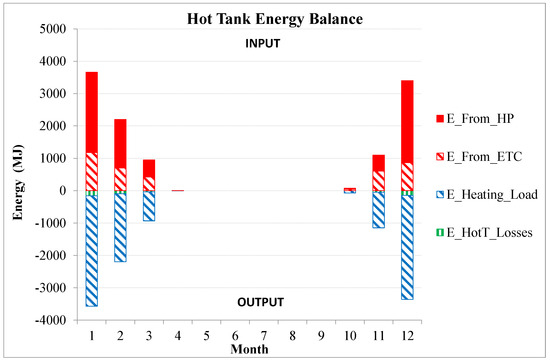
Figure 7.
Monthly energy balances of the Hot Tank (RM).
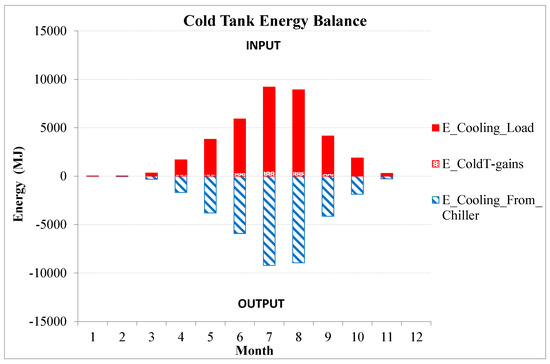
Figure 8.
Monthly energy balances of the Cold Tank (RM).
In terms of ETCs thermal efficiency, it was lower during the cooling season than during the heating season. As a matter of fact, solar energy was exploited better in relative terms during winter because of the oversizing of the solar field in summer. Reducing the ETC field area could be beneficial, as heat losses would be reduced during the cooling season. As is described in Section 3.2, this reasoning would not increase the energy performance of the plant.
3.2. Energy Analysis of Different Alternatives
Figure 9 and Figure 10 report the comparison based on non-renewable primary energy EPannual on a yearly basis of the different alternatives set up by combinations of Generator Tank volume and ETC area (Table 6). Both contributors (heating and cooling) are reported with respect to a traditional solution. The latter was set up by a natural gas (NG) boiler (efficiency 0.9) + a/w chiller (monthly mean energy efficiency ratio (EER) in Table 7). In the figures, the primary energy ratio (PERplant,nren) is calculated based on the yearly net non-renewable primary energy consumption of the plant, i.e., the Auxiliary Boiler and power of the pumps are considered (Table 5). The primary energy factors fP,nren for natural gas and for electrical energy from the grid are reported in Table 5. The pumps used in the traditional plant are considered the same as those proposed (except for the geothermal and solar pumps).
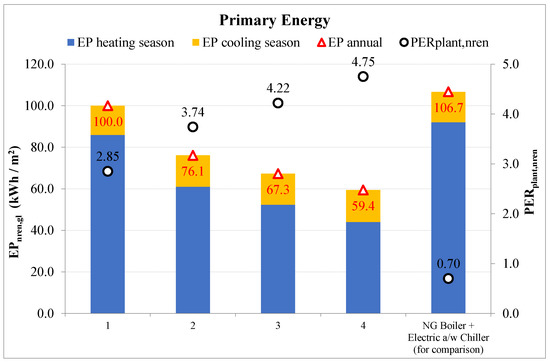
Figure 9.
Annual non-renewable primary energy consumption (EPnren,gl) and primary energy ratio (PERplant,nren) for the four alternatives compared with the conventional one (BL).
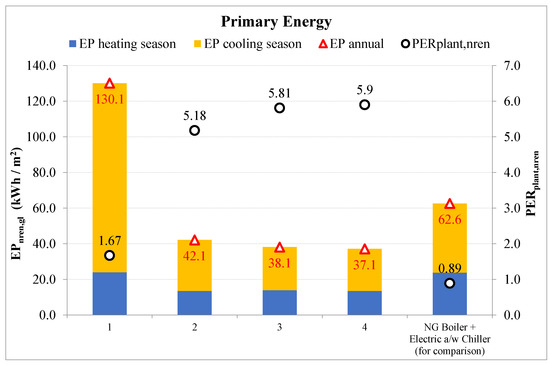
Figure 10.
Annual non-renewable primary energy consumption (EPnren,gl) and primary energy ratio (PERplant,nren) for the four alternatives compared with the conventional one (RM).
Table 7.
EER of the a/w chiller for the ‘traditional solution’ (monthly mean values).
The increase in the area of the ETCs is beneficial and the effect is a reduction in the EPannual (red triangle in Figure 9 and Figure 10). This is due to the decrease in the non-renewable primary energy consumed by the plant primarily in the heating season (blue bars) in colder climates (Figure 9), and mainly in the cooling season (orange bars) in hotter climates like Rome (Figure 10). As a matter of fact, the NG consumed by the Auxiliary Boiler decreased as the area of ETCs increased due to greater thermal energy production to drive the HP/Chiller. The increase in the capacity of Generator Tank is beneficial as well, that is, the EPannual of the plant decreased, but with a much lower derivative. Consequently, PERplant,nren increased when EPannual decreased, with particularly high values during the heating season: this is mainly due to the efficient utilization of the solar energy both indirectly (by the HP by means of both the Heat Source Tank as the heat source and the Generator Tank as driving) and directly (HEX1 in the Hot Tank).
For the BL climate, the best solution is n. 4 (ETC 140 m2, 8000 L Generator Tank): in this case, the EPannual is 59.4 kWh m−2 y−1 and PERplant,nren is equal to 4.75 (Figure 9). As a matter of fact, an ETC field area of less than 80 m2 is not advantageous, because EPannual would increase to more than the traditional solution.
For the climate of Rome (hotter and with a higher clearness index), increasing the capacity of the Generator Tank and the ETC area is much more beneficial in increasing the energy performance of the plant from solution 1 to 2 (Figure 10). In this case, there is the effect of both increasing the ETC field area and decreasing the ground probes length: whereas the ETC 20 m2, 2 × 50 m ground probes, 3000 L GenT capacity has a greater primary energy consumption of the traditional solution (respectively 130.1 vs. 62.6 kWh m−2 y−1); doubling the ETC area and reducing the ground probes length allows a sensible reduction of the EPannual to 42.1 kWh m−2 year−1. This value is lower than the traditional solution. Figure 10 shows that, for Rome, 80 m2 ETC, 1 × 50 m ground probes, 5000 L GenT capacity is the best solution. In this case, the EPannual is 37.1 kWh m−2 y−1, and the PERplant,nren is equal to 5.9. Increasing the ETC area or the volume of the Generator Tank to a greater extent would not allow substantial improvement. Instead, from the economic point of view it would not be sustainable (see Section 3.3).
The electricity consumption of the pumps is within 4300 and 4500 kWhel per year for both the climates. In Rome, this represents almost the whole primary energy consumption, whereas in Belluno it is a percentage within 40% and 60%. The best energy performance of the plant is obtained in Rome with a little less than 60% ETC area and something more than 60% GenT capacity with respect to the colder climate of Belluno.
3.3. Economic Analysis
For the innovative solution here proposed, we considered an additional investment of 6000 € with respect to the traditional one for Generator and Heat Source tanks, pumps, etc. Such a value was reduced to 4000 € for Rome, where the Auxiliary Boiler was not necessary, as energy to drive the absorption HP/Chiller was fully provided by the ETCs. Other CAPital EXpenditures (CAPEX) are reported in Table 8. The cost for NG and electricity from the grid was fixed at 0.9 € Sm−3 and 0.2 € kWh−1 respectively in order to calculate the OPerating EXPenses (OPEX). Table 9 and Table 10 report the total and split CAPEX and OPEX for the different alternatives and the traditional solution for the two climates.
Table 8.
CAPEX of the main equipment.
Table 9.
CAPEX and OPEX of the proposed and traditional solutions for Belluno (negative values, as they are all expenses when considered as cash flows).
Table 10.
CAPEX and OPEX of the proposed and traditional solutions for Rome (negative values, as they are all expenses when considered as cash flows).
Comparisons of the four alternatives considered here with the ”traditional“ solution NG boiler + a/w Chiller for the colder (BL) and hotter (RM) climate are reported in Figure 11 and Figure 12, respectively. Here, an interest rate of 2%, an annual increase of the energy price of 5%, and a 20-year time period for the analysis are fixed. The figures report the annual discounted cash flows with respect to the traditional solution: the values at the end of the period of the analysis are the net present worth (NPW), whereas the zero crossing values represent the discounted payback period (DPP). In both resorts, the most energy efficient solution (n. 4 for both) was revealed to be the worst from the economic point of view: it had the longest DPP and the smallest NPW as it featured the highest annual net saving but the highest extra-CAPEX as well (Table 9 and Table 10). The DPP was within 13 years (alternative n. 1 or 2) and 16 years (4) for both resorts, while in colder and cloudier climates (Figure 11) the economic investment is more advantageous, as the NPWs were greater than in Rome (Figure 12).
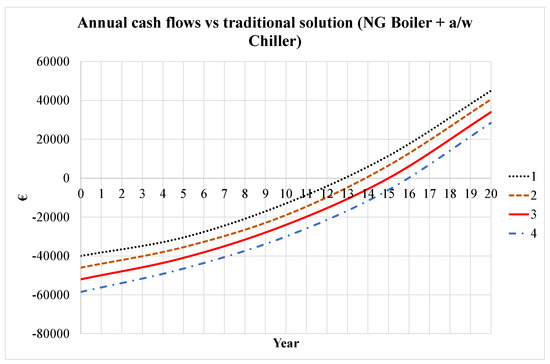
Figure 11.
Annual discounted cash flows of the four alternatives with respect to the NG boiler + a/w chiller (BL).
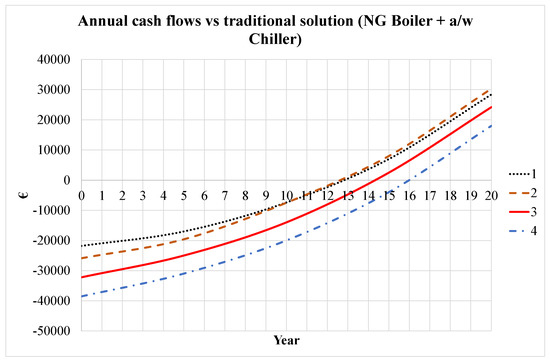
Figure 12.
Annual discounted cash flows of the four alternatives with respect to the NG boiler + a/w chiller (RM).
A different conclusion could be possible in case of an important decrease of the investment costs. Here, we consider a sensitivity analysis reducing the CAPEX of ground boreholes (both the fixed and variable cost) and of the solar collectors to 50% with respect to the values in Table 8. This could be possible, as the market prices of ETCs in India and China are already much lower (even less than half) than those of current European prices.
The economic feasibility of the proposed plant is much more sensitive to ETC than the investment cost of the ground boreholes. For example, in Belluno, the NPW increased by 7–10% for the different alternatives, reducing the investment cost of the ground boreholes by 50%, while it increased by 25–70% by reducing the ETC price by the same percentage. The highest sensitivity is due to the most energy-saving alternative—n. 4—for both climates. This solution had the highest increase in NPW for both ground boreholes and the increase in investment costs of the ETC. Figure 13 reports the annual discounted cash flows of this solution compared with the traditional one for the two resorts for a 50% decrease in the ETC investment cost. When comparing Figure 13 with the previous Figure 11 and Figure 12, the NPW increased slightly more: 70% for BL (from 29 to 50 k€) and somewhat less than 70% for RM (from 18.3 to 30.3 k€). The DPP decreased by 25% and 19%, respectively. Moreover, milder climates like Rome had more sensitivity to the cost of ground boreholes, whereas colder climates were more sensitive to the ETC cost.
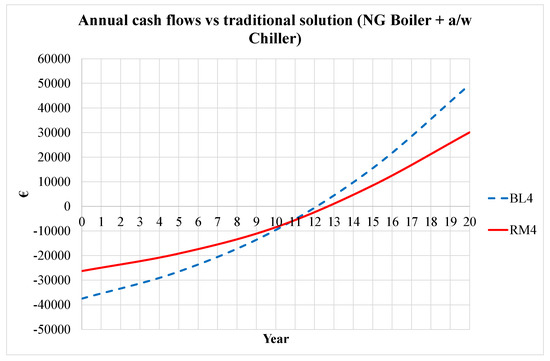
Figure 13.
Annual discounted cash flows of alternative n. 4 for the two climates compared with the conventional one reducing the ETC investment cost by 50%.
Sensitivity analysis revealed that the economic viability of the proposed plant is proved, above all considering a reduction of CAPEX to 50%. Economic incentives that are present in many countries from years were not necessary to make the solution here proposed economically viable in addition to being energy efficient. As a matter of fact, the reduction in market prices that are expected for ETC usefully rewards the most energy-efficient solutions, making them economically feasible.
4. Conclusions
The study demonstrated that modern high-efficiency ETCs are a very effective technical solution to increase the diffusion of solar heating and cooling systems with high energy performance. The greater advantage is the enhancement of the annual utilization of solar energy by the use of thermally driven heat pumps. The plant conceived in this study for an existing building in two different climates demonstrated the high energy efficiency of the proposed solution. An appropriate control logic for the operation of the two heat generators (ETCs and thermally driven heat pump, which in summer is the absorption chiller) were developed. The decoupling of the heat pump from the heat sources was allowed by an effective disposition of the storage tanks that allowed the improvement of energy performance of the plant in case of contemporaneous presence of heating and cooling loads.
The dynamic simulations by TRNSYS [8] allow the design of the plant considering different alternatives by varying the capacity of the Generator Tank and the ETCs area. The results revealed that the solution with the highest PERplant,nren and the lowest EPgl,nren featured around 60% ETC field area and 60% GenT capacity in the hottest areas and greater clearness indexes compared with the colder and cloudier ones. The most efficient solutions featured non-renewable primary energy savings in the range of 40–45% compared with the traditional one for both climates. The economic feasibility of the solar cooling and heating plant does not depend on the economic incentives. A decrease in European ETC cost to values similar to Chinese and Indian ones could make this solution competitive, particularly with respect to the PV-driven electric solar cooling solution, which is actually more advantageous. A further challenge of the proposed layout could be the comparison of the energy and economic performance of different configurations of the plant, varying the ETCs and absorption heat pump performance, in order to perform a sensitivity analysis of the advantages of the proposed system.
Finally, consider that the annual energy that the plant provides to the ground (by the condenser/absorber of the chiller and the solar section) is definitely higher than that withdrawn from the ground (e.g., it is around 20 times higher in the Belluno climate). For this reason, an increase in the mean temperature of the ground during the years of operation of the plant could be possible. However, this drawback can be limited as the ground-heat exchanger is a vertical boreholes type, not a horizontal one. To better quantify the possible deterioration of efficiency of operation of the absorption system, a 10-year simulation should be performed to obtain the mean ground temperature after a long period of operation. This could be a further development of this study.
Funding
This research received no external funding.
Institutional Review Board Statement
Not applicable.
Informed Consent Statement
Not applicable.
Data Availability Statement
Not applicable.
Conflicts of Interest
The authors declare that they have no conflict of interest.
References
- IEA; ETSAP; IRENA©. Technology Brief R12—January 2015, Solar Heating and Cooling for Residential Applications Technology Brief; IRENA: Abu Dhabi, United Arab Emirates, 2015. [Google Scholar]
- International Institute of Refrigeration. Solar Cooling, 34th Informatory Note on Refrigeration Technologies; International Institute of Refrigeration: Paris, France, 2017. [Google Scholar]
- REN21. Renewables 2020—Global Status Report; REN21: Paris, France, 2020; ISBN 978-3-948393-00-7. [Google Scholar]
- Alahmer, A.; Ajib, S. Solar cooling technologies: State of art and perspectives. Energy Convers. Manag. 2020, 214, 112896. [Google Scholar] [CrossRef]
- Huang, L.; Zheng, R. Energy and Economic Performance of Solar Cooling Systems in the Hot-Summer and Cold-Winter Zone. Buildings 2018, 8, 37. [Google Scholar] [CrossRef] [Green Version]
- Martínez, P.J.; Martínez, P.; Soto, V.M.; Bujedo, L.A.; Rodriguez, J. Design of a 35 kW solar cooling demonstration facility for a hotel in Spain. Appl. Sci. 2020, 10, 496. [Google Scholar] [CrossRef] [Green Version]
- Al-Yasiri, Q.; Szabó, M.; Arıcı, M. A review on solar-powered cooling and air-conditioning systems for building applications. Energy Rep. 2022, 8, 2888–2907. [Google Scholar] [CrossRef]
- Solar Energy Laboratory. Trnsys 17. TRaNsient SYstem Simulation Program; University of Wisconsin-Madison and Thermal Energy System Specialists: Madison, WI, USA, 2012. [Google Scholar]
- Khan, M.S.A.; Badar, A.W.; Talha, T.; Khan, M.W.; Butt, F.S. Configuration based modeling and performance analysis of single effect solar absorption cooling system in TRNSYS. Energy Convers. Manag. 2018, 157, 351–363. [Google Scholar] [CrossRef]
- Thiao., S.; Mar, A.; Diokh, R.M.N.; Mbow, C.; Youm, I. Feasibility study of a solar thermal cooling warehouse on a remote area: Estimation of the solar thermal collector area and efficiency. Int. J. Energy Convers. 2018, 6, 90–97. [Google Scholar] [CrossRef]
- Lazzarin, R.M.; Noro, M. Past, present, future of solar cooling: Technical and economical considerations. Sol. Energy 2018, 172, 2–13. [Google Scholar] [CrossRef]
- Hartmann, N.; Glueck, C.; Schmidt, F.P. Solar cooling for small office buildings: Comparison of solar thermal and photovoltaic options for two different European climates. Renew. Energy 2011, 36, 1329–1338. [Google Scholar] [CrossRef]
- Beccali, M.; Cellura, M.; Finocchiaro, P.; Guarino, F.; Longo, S.; Nocke, B. Life cycle performance assessment of small solar thermal cooling systems and conventional plants assisted with photovoltaics. Sol. Energy 2013, 104, 93–102. [Google Scholar] [CrossRef] [Green Version]
- Atia, M.; Ahriche, A.; Bekkar, B. Comparative study between photovoltaic and thermal solar cooling. In Proceedings of the SIENR 2021 6th International Symposium on New and Renewable Energies, Ghadaia, Algeria, 13–14 October 2021. [Google Scholar] [CrossRef]
- Lazzarin, R.M. Solar-assisted absorption heat pumps feasibility. Sol. Energy 1981, 26, 223–230. [Google Scholar] [CrossRef]
- Noro, M.; Lazzarin, R. PVT and ETC Coupling for Annual Heating and Cooling by Absorption Heat Pumps. Sustainability 2020, 12, 7042. [Google Scholar] [CrossRef]
- Makki, A.; Omer, S.; Sabir, H. Advancements in hybrid photovoltaic systems for enhanced solar cells performance. Renew. Sustain. Energy Rev. 2015, 41, 658–684. [Google Scholar] [CrossRef]
- Daghigh, R.; Ruslan, M.H.; Sopian, K. Advances in liquid based photovoltaic/thermal (PV/T) collectors. Renew. Sustain. Energy Rev. 2011, 15, 4156–4170. [Google Scholar] [CrossRef]
- Busato, F.; Lazzarin, R.; Noro, M. Experimental analysis of photovoltaic cogeneration modules. Int. J. Low Carbon Technol. 2008, 3, 221–244. [Google Scholar] [CrossRef]
- Lazzarin, R.; Noro, M. Photovoltaic/Thermal (PV/T)/ground dual source heat pump: Optimum energy and economic sizing based on performance analysis. Energy Build. 2020, 211, 109800. [Google Scholar] [CrossRef]
- Noro, M.; Lazzarin, R.; Busato, F. Solar cooling and heating plants: An energy and economic analysis of liquid sensible vs phase change material (PCM) heat storage. Int. J. Refrig. 2014, 39, 104–116. [Google Scholar] [CrossRef]
- EN ISO 15927-4:2005; Hygrothermal Performance of Buildings—Calculation and Presentation of Climatic Data—Part 4: Hourly Data for Assessing the Annual Energy Use for Heating and Cooling. ISO: Geneva, Switzerland, 2005.
- Duffie, J.A.; Beckman, W.A. Solar Engineering of Thermal Processes; John Wiley & Sons, Inc.: Hoboken, NJ, USA, 2013. [Google Scholar]
- Busato, F.; Lazzarin, R.; Noro, M. Ground or solar source heat pump systems for space heating: Which is better? Energetic assessment based on a case history. Energy Build. 2015, 102, 347–356. [Google Scholar] [CrossRef]
- Lazzarin, R.; Noro, M. Lessons learned from long term monitoring of a multisource heat pump system. Energy Build. 2018, 174, 335–346. [Google Scholar] [CrossRef]
Publisher’s Note: MDPI stays neutral with regard to jurisdictional claims in published maps and institutional affiliations. |
© 2022 by the author. Licensee MDPI, Basel, Switzerland. This article is an open access article distributed under the terms and conditions of the Creative Commons Attribution (CC BY) license (https://creativecommons.org/licenses/by/4.0/).