You are currently viewing a new version of our website. To view the old version click .
Sustainability
  • Article
  • Open Access

16 May 2022

Design and Implementation of Machine Vision-Based Quality Inspection System in Mask Manufacturing Process

and
Department of Smart Factory Convergence, Sungkyunkwan University, 2066 Seobu-ro, Jangan-gu, Suwon 16419, Gyeonggi-do, Republic of Korea
*
Author to whom correspondence should be addressed.
This article belongs to the Special Issue Adoption of Management Strategies and Technologies for Sustainable Production: A Solution to Reduce Environmental Emissions

Abstract

With the advent of the 4th Industrial Revolution, research on anomaly detection in the manufacturing process using deep learning and machine vision is being actively conducted. There have been various attempts to innovate the manufacturing site by adopting advance information technologies such as machine vision, machine learning, and deep learning in many manufacturing processes. However, there have been no cases of designing and implementing these technologies at the mask manufacturing site, which is essential to tackle COVID-19 pandemic. The originality of this paper is to implement sustainability in the mask manufacturing environment and industrial eco-system by introducing the latest computer technology into the manufacturing process essential for pandemic-related disasters. In this study, the intention is to establish a machine vision-based quality inspection system in actual manufacturing process to improve sustainable productivity in the mask manufacturing process and try a new technical application that can contribute to the overall manufacturing process industry in Korea in the future. Therefore, the purpose of this paper is to specifically present hardware and software system construction and implementation procedures for inspection process automation, control automation, POP (Point Of Production) manufacturing monitoring system construction, smart factory implementation, and solutions. This paper is an application study applied to an actual mask manufacturing plant, and is a qualitative analysis study focused on improving mask productivity. “Company A” is a mask manufacturing company that produces tons of masks everyday located in Korea. This company planned to automate the identification of good and defective products in the mask manufacturing process by utilizing machine vision technology. To this end, a deep learning and machine vision-based anomaly detection manufacturing environment is implemented using the LAON PEOPLE NAVI AI Toolkit. As a result, the productivity of “Company A”’s mask defect detection process can be dramatically improved, and this technology is expected to be applied to similar mask manufacturing processes in the future to make similar manufacturing sites more sustainable.

1. Introduction

Entering the Post-COVID (Coronavirus Disease) era, creating a sustainable production environment across all industries has emerged as a top priority. COVID-19 pandemic has created surge demand for essential healthcare equipment along with the requirement for advance information technologies applications [1]. Health masks have emerged as a critical necessity as fine dust continues to gradually increase since the 2000s. According to AirVi-sual’s 2018 World Air Quality Report, South Korea has the second highest concentration of ultrafine dust among OECD (Organization for Economic Cooperation and Development) member countries. In particular, 76.5% of South Koreans check the fine dust information daily and the need for masks is increasing due to issues such as yellow dust, MERS (Middle East Respiratory Syndrome), and COVID-19.
Quality assurance of products are considered one of the most important inspection factors in the manufacturing process, including the textile industry. Textile product quality is seriously degraded by defects. Textile fabrics exhibit uniform patterns and texture properties in both horizontal and vertical directions. The damaged regions, which disfigure the patterns and the texture, are called fabric defects [2]. Failure to defect detection early in the process costs time, money, and consumer satisfaction. Thus, early and accurate fabric defect detection is an important phase of quality control [3]. Textile defect detection is a critical step in quality control in textile manufacturing because if there are defects in the textile fabric, its market price is reduced by more than half. That’s why Automatic fabric defect detection is considered to be of great interest for detection of different kinds of defects like hole, slub, oil stains, etc. [4]. The old way of carrying out defect detection is to assign a human inspector to look for flaws to ensure quality. Manual inspection is time consuming, and the level of accuracy is unsatisfactory to meet the present demand of the highly competitive international market [3]. Therefore, the expected quality cannot be maintained with manual inspection. A computer vision-based fabric defect inspection system is the solution to the problems caused by manual inspection because machine vision significantly improves the efficiency, quality, and reliability of defect detection [5]. Automated fabric defect inspection system has been attracting extensive attention of researchers across the globe for years [6].
In the case of the existing mask manufacturing process of “Company A”, automation was carried out only during the fabric input and production process. On the other hand, in the QA (Quality Assurance) process of finished products, it went through a manual process to distinguish between good and defective products through human eyes and hands. As a result, time and cost were extremely inefficient. To address this problem, we aim to dramatically increase the productivity of “Company A”’s mask defect detection process by designing and implementing a machine vision-based inspection system in the mask manufacturing process. To improve the performance of distinguishing good and defective products in the field through AI machine vision solutions, LAON PEOPLE NAVI AI Toolkit is used. Since its inception in 2010, LAON PEOPLE has been providing machine vision solutions for the manufacturing and logistics automation fields of leading companies in Korea and abroad. This program enabled the innovation of the manufacturing process with Korea’s first artificial intelligence machine vision inspection software in 2016 and helped to use a variety of machine vision products according to the environment including; AI inspection solution packages, 2D/3D cameras, smart cameras, and thermal imaging cameras. This study is conducted as an application study for a real-world factory for performance improvement with qualitative analysis. The composition of this paper is as follows; Section 2 deals with Computer Vision, Machine Vision-Based Quality Inspection, Machine Learning for manufacturing process, and Remaining Useful Life Prediction, Section 3 explains Sustainable Smart Factory Mask Manufacturing Process, Section 4 deals with Implementation and results, Section 5 explains the Conclusion.

3. Sustainable Smart Factory Mask Manufacturing Process

3.1. The Problems with “Company A”’s Existing Mask Manufacturing Process and the Following Solutions

This section describes the process for analyzing the existing mask manufacturing process of “Company A” to find problems and suggest solutions. Figure 1 shows the existing workflow chart for each major process. In the Fabric Insertion stage, the fabric for mask manufacturing is supplied to the left, right, center, and nose wires. The Fabric Alignment Control stage is the process of balancing the left and right sides of the fabric and aligning the location of the fabric to ensure that the Nose Wire Insertion is properly implemented. In the Nose Wire Insertion and Wire Cutting step, the nose wire is properly cut and inserted into the fabric inserted in the previous step. Thereafter, 1st Ultrasonic Welding is performed, and the fabric is folded to perform 2nd Ultrasonic Welding. In the Fabric Cutting stage, when Ultrasonic Welding is finished, cutting is performed according to the shape of the mask, and unnecessary extra scrap is removed. Finally, good and defective products are classified through screening tests along with the removal of the defective products.
Figure 1. Workflow chart for each major process.
There is a problem in that spatial constraints for constituting sensors and machine accessories are large, and that they are designed using inverter motors rather than automation methods. In addition, there is no manufacturing management system such as production management and quality control because the production facilities are not computerized. Due to the lack of systematic production management, some masks are classified as good products even though they are in fact defective. Therefore, it is necessary to establish a production management system step by step in order to manage realistic product specifications and production.
There are following problems with the existing manufacturing process. The fabric tension control and alignment are not uniformed in the tension control process. Therefore, fabric derivation occurs because tension control and alignment are not unformed, and it means that the fabric is inserted into an inappropriate position due to the imbalance in the left and right positions of the fabric. In addition, a foreign object test on fabric is conducted by an inspector, but an internal inspection test was not possible. Foreign object test on fabric is a process of inspecting whether the fabric is contaminated by foreign substances such as dust and stains. Internal inspection test refers to an inspection process that checks whether there is contamination inside the fabric. Since the three fabrics of left, right, center overlap and are inserted, the factory operator can only check the fabric on the surface, so the lining part of the fabric cannot be visually inspected.

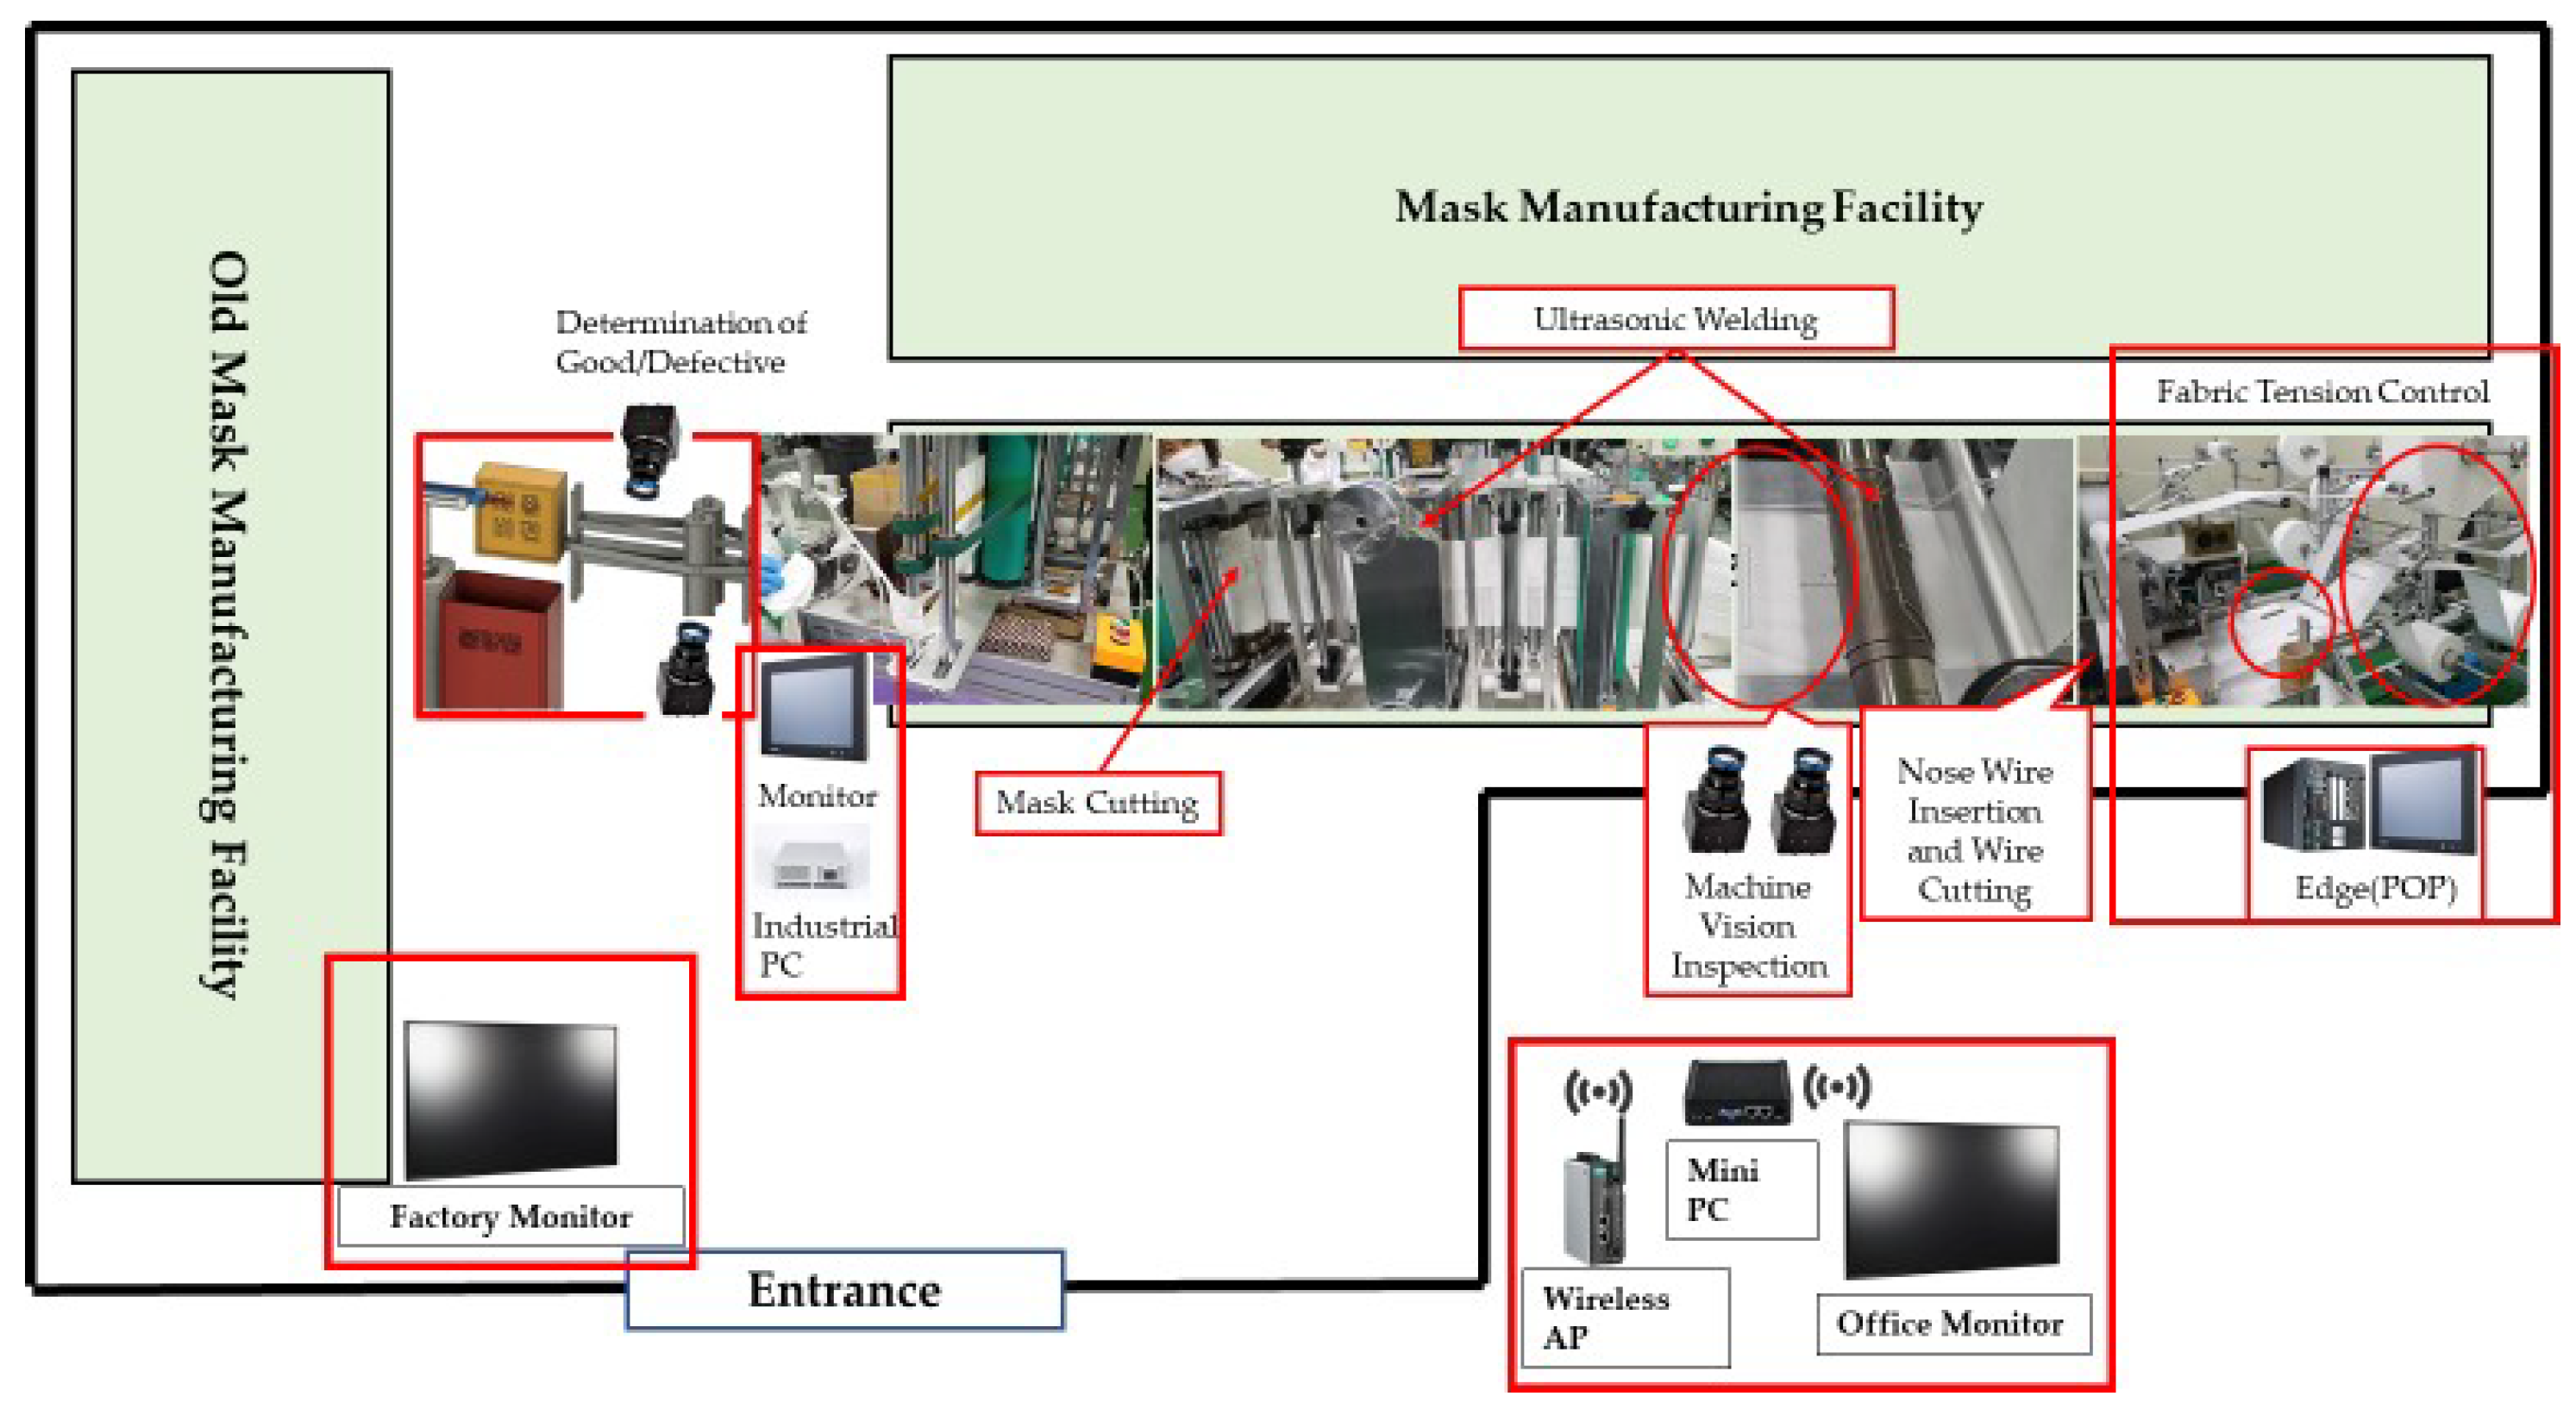
3.2. Machine Vision-Based Inspection Points on the Factory Floor to Solve Problems in the Maskmanu Facturing Process

In order to clearly identify these problems and create solutions for them, the following inspection points have been analyzed. The fabric tension control and alignment position are disproportionately formed due to irregular tension throughout the process, such as the Fabric Insertion part and the Ultrasonic Welding part, resulting in a defect. To solve this problem, machine vision-based inspection points are applied to the process. The decision is made to build a fabric inlet tension control system and make plans to build a supply power control system according to the weight of raw materials and a position control system through vision inspection or sensor feedback.
Figure 2 shows the inspection point of the nose wire fusion test. It is impossible to check whether the ultrasonic welding process is in progress in real time, and it is conducted by manually checking whether the product is defective. The quality of the inspection is not uniform due to the increase in fatigue caused by the inspector’s long-term inspection. To solve this problem, the internal and external machine vision-based inspection points of the mask fabric are determined, and a foreign sub-stance inspection and fusion point inspection solution are introduced.
Figure 2. Nose wire fusion test.
Figure 3 shows the machine vision-based inspection point for foreign object test on fabric. Manufacturing automation has been established that can aggregate good and defective products according to inspection results.
Figure 3. Foreign object test on fabric.

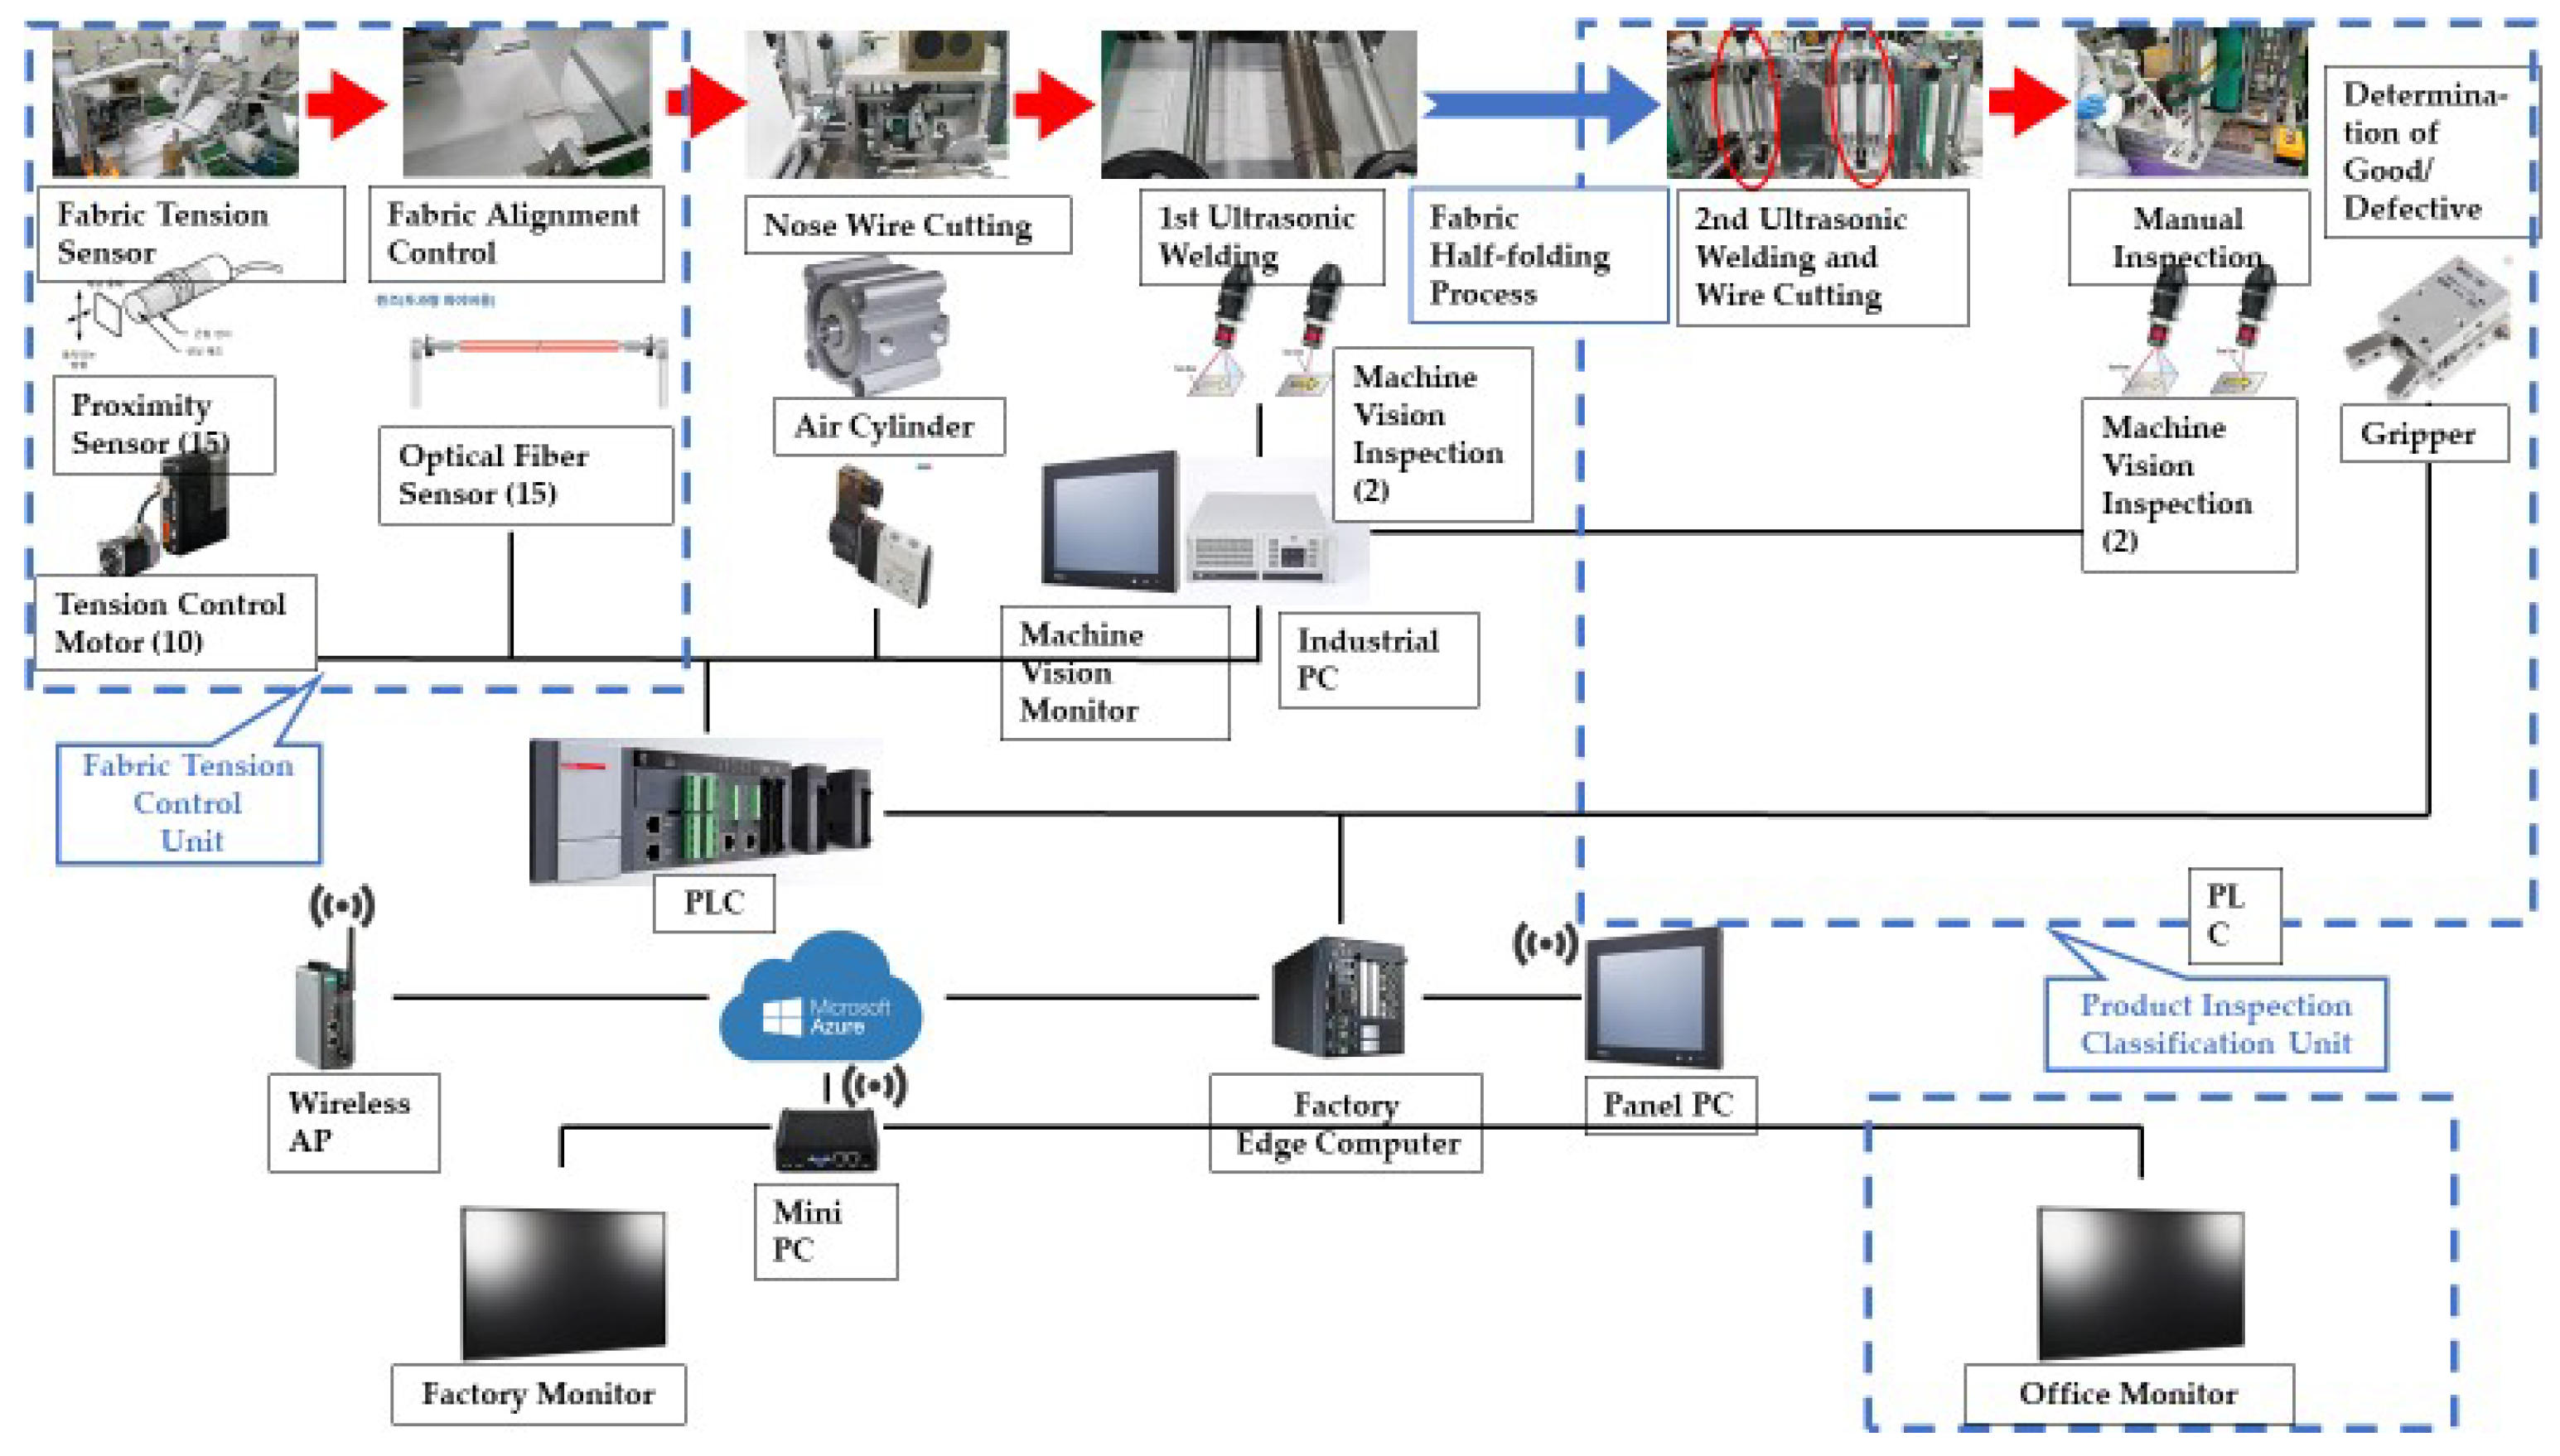
3.3. Machine Vision-Based Quality Inspection System Architecture

Figure 4 shows the overall hardware equipment to implement machine vision-based quality inspection system. To automate the input fabric tension, a motor is attached to the input of the fabric so that the input tension can be adjusted. A machine vision test was conducted on the fusion state in ultrasonic welding. In the case of ear straps, left and right alignments were checked through sensors. The cutting drive type according to the chain rotation cycle is improved to an independent air cylinder type cutting process. Therefore, the nose wire insertion and cutting can be performed at a certain point in time to prevent the shaking of the chain connected to the nose wire cutter from affecting the entire facility.
Figure 4. Hardware Architecture.
Figure 5 is Factory Layout and Equipment designed for machine vision-based quality inspection. To automate the inspection process that used to distinguish between good and defective products through visual inspection, machine vision is used to classify defective products through Mask Cutting and Ultrasonic Welding. In addition, it is made to automatically classify the results of the judgement of good and bad products through a automatic classification system. To collect images of good and defective products, three vision inspection points are set for Fabric Insertion, Ultrasonic Welding, and Fabric Cutting inspection. Images are collected so that vision images generated at the inspection points can be checked in the program regardless of both good and defective products.
Figure 5. Factory Layout and Equipment.
For the sake of enabling facility control such as start, stop, and motor control of the fabric input part on the POP touch panel, it is implemented to check the Machine Vision shot image in the POP. Also, in the UI (User Interface) design, the facility images are expressed similarly to the actual facility. During the production status monitoring, the overall line of the process and the input status of each product are expressed as charts. In addition, the status of the facility and production status can be expressed on the dashboard. Through production defect management, the history of defects can be managed and analyzed. Quality management by period, quality management by work instruction, and comprehensive quality management is possible. Figure 6 Shows the dashboard for monitoring effective mask products on the POP touch panel screen.
Figure 6. Dashboard for monitoring defective mask products.
In order to devise a method of displaying notifications when fabric shortage is expected, it has been confirmed that the smaller the remaining amount of fabric, the smaller the diameter of the fabric, the higher the speed of fabric release of the lift control device. When the speed of the fabric rises above a certain speed, an alarm rings to indicate the need for fabric replacement.

4. Implementation and Results

4.1. Hardware Specification and Network Configuration for Machine Vision-Based Inspection

Table 1 summarizes the Hardware Specification. The categories are classified into Hardware Equipment, Computing Equipment, Inspection Equipment, Dashboard, and Kiosk, and each quantity and specification were specified.
Table 1. Hardware Specification.
Figure 7 shows Network Configuration equipment. ipTIME, Edge Device, Wireless AP, Panel PC, Mini PC, Factory Monitor, and Office Monitor are required. The ipTIME PoE 8000 is an existing equipment at the mask manufacturing factory, and the part marked with a blue box represents the newly purchased equipment. The solid black line represents the Wired Network, and the dotted line represents the Wireless Network.
Figure 7. Network Configuration.

4.2. Communication Structure for Image Acquisition and Data Gathering Process

As shown in Figure 5 and Figure 6, cameras were installed in each part of the machine vision defective product determination process. The cameras were connected to each port of the Power over Ethernet (PoE) LAN card with an Ethernet cable (cat.5 or higher). The Power over Ethernet (PoE) refers to a system that reliably transmits data and power through an Ethernet cable. And the LAN card is a communication device in a computer that allows the computer to connect to a network and transmit data.
An Ethernet connection between the PLC and the Vision computer is performed to receive a photographing trigger through Socket communication. For image learning, machine vision learning is performed on the acquired image first. Then, a suitable model is created using NAVI Trainer. Next, learning is carried out by mixing unsupervised learning and supervised learning. The generated model is used to determine good and defective products for the acquired image. NAVI AI SDK USB is needed to build an image discrimination model. It must be connected to the vision computer by USB in order to distinguish between good and defective images.
Trigger.get is processed through an image acquisition and image determination process. Trigger.get was implemented with Socket communication. Trigger is an action that is automatically performed when the database meets a pre-determined condition or an action is performed. Triggers are useful for describing validity and integrity conditions for data in a database. HeartBeat is used to send machine vision results to MES. In a computer cluster, the HeartBeat network refers to a private network. Data is accumulated as a result from discriminating good and defective products through ma-chine vision. Vision.Result.Refresh received data from MES via MQTT in C++ code. Images are sent to MES via HTTP as Python code. Interval receives data from the MES in Python code through MQTT. Topic is company/mes/server and the Interval information is included in the refresh topic.
Table 2 summarizes the Data Gathering Process at a glance. The process goes through Fabric Tension Control, Cutting of the Nose Wire Insertion, and then Ultra-sonic Welding. Afterwards, it goes through the Cut the Fabric process after going through the Foreign Matter Test on Fusion and Lining, Fabric Half-folding Process, and 2nd Ultrasonic Welding. After the end of Process in the middle, Data Gathering continues in the order of Inspection of Fusion and Foreign Substance on the Outer Fabric and Entry Process.
Table 2. Data Gathering Process.

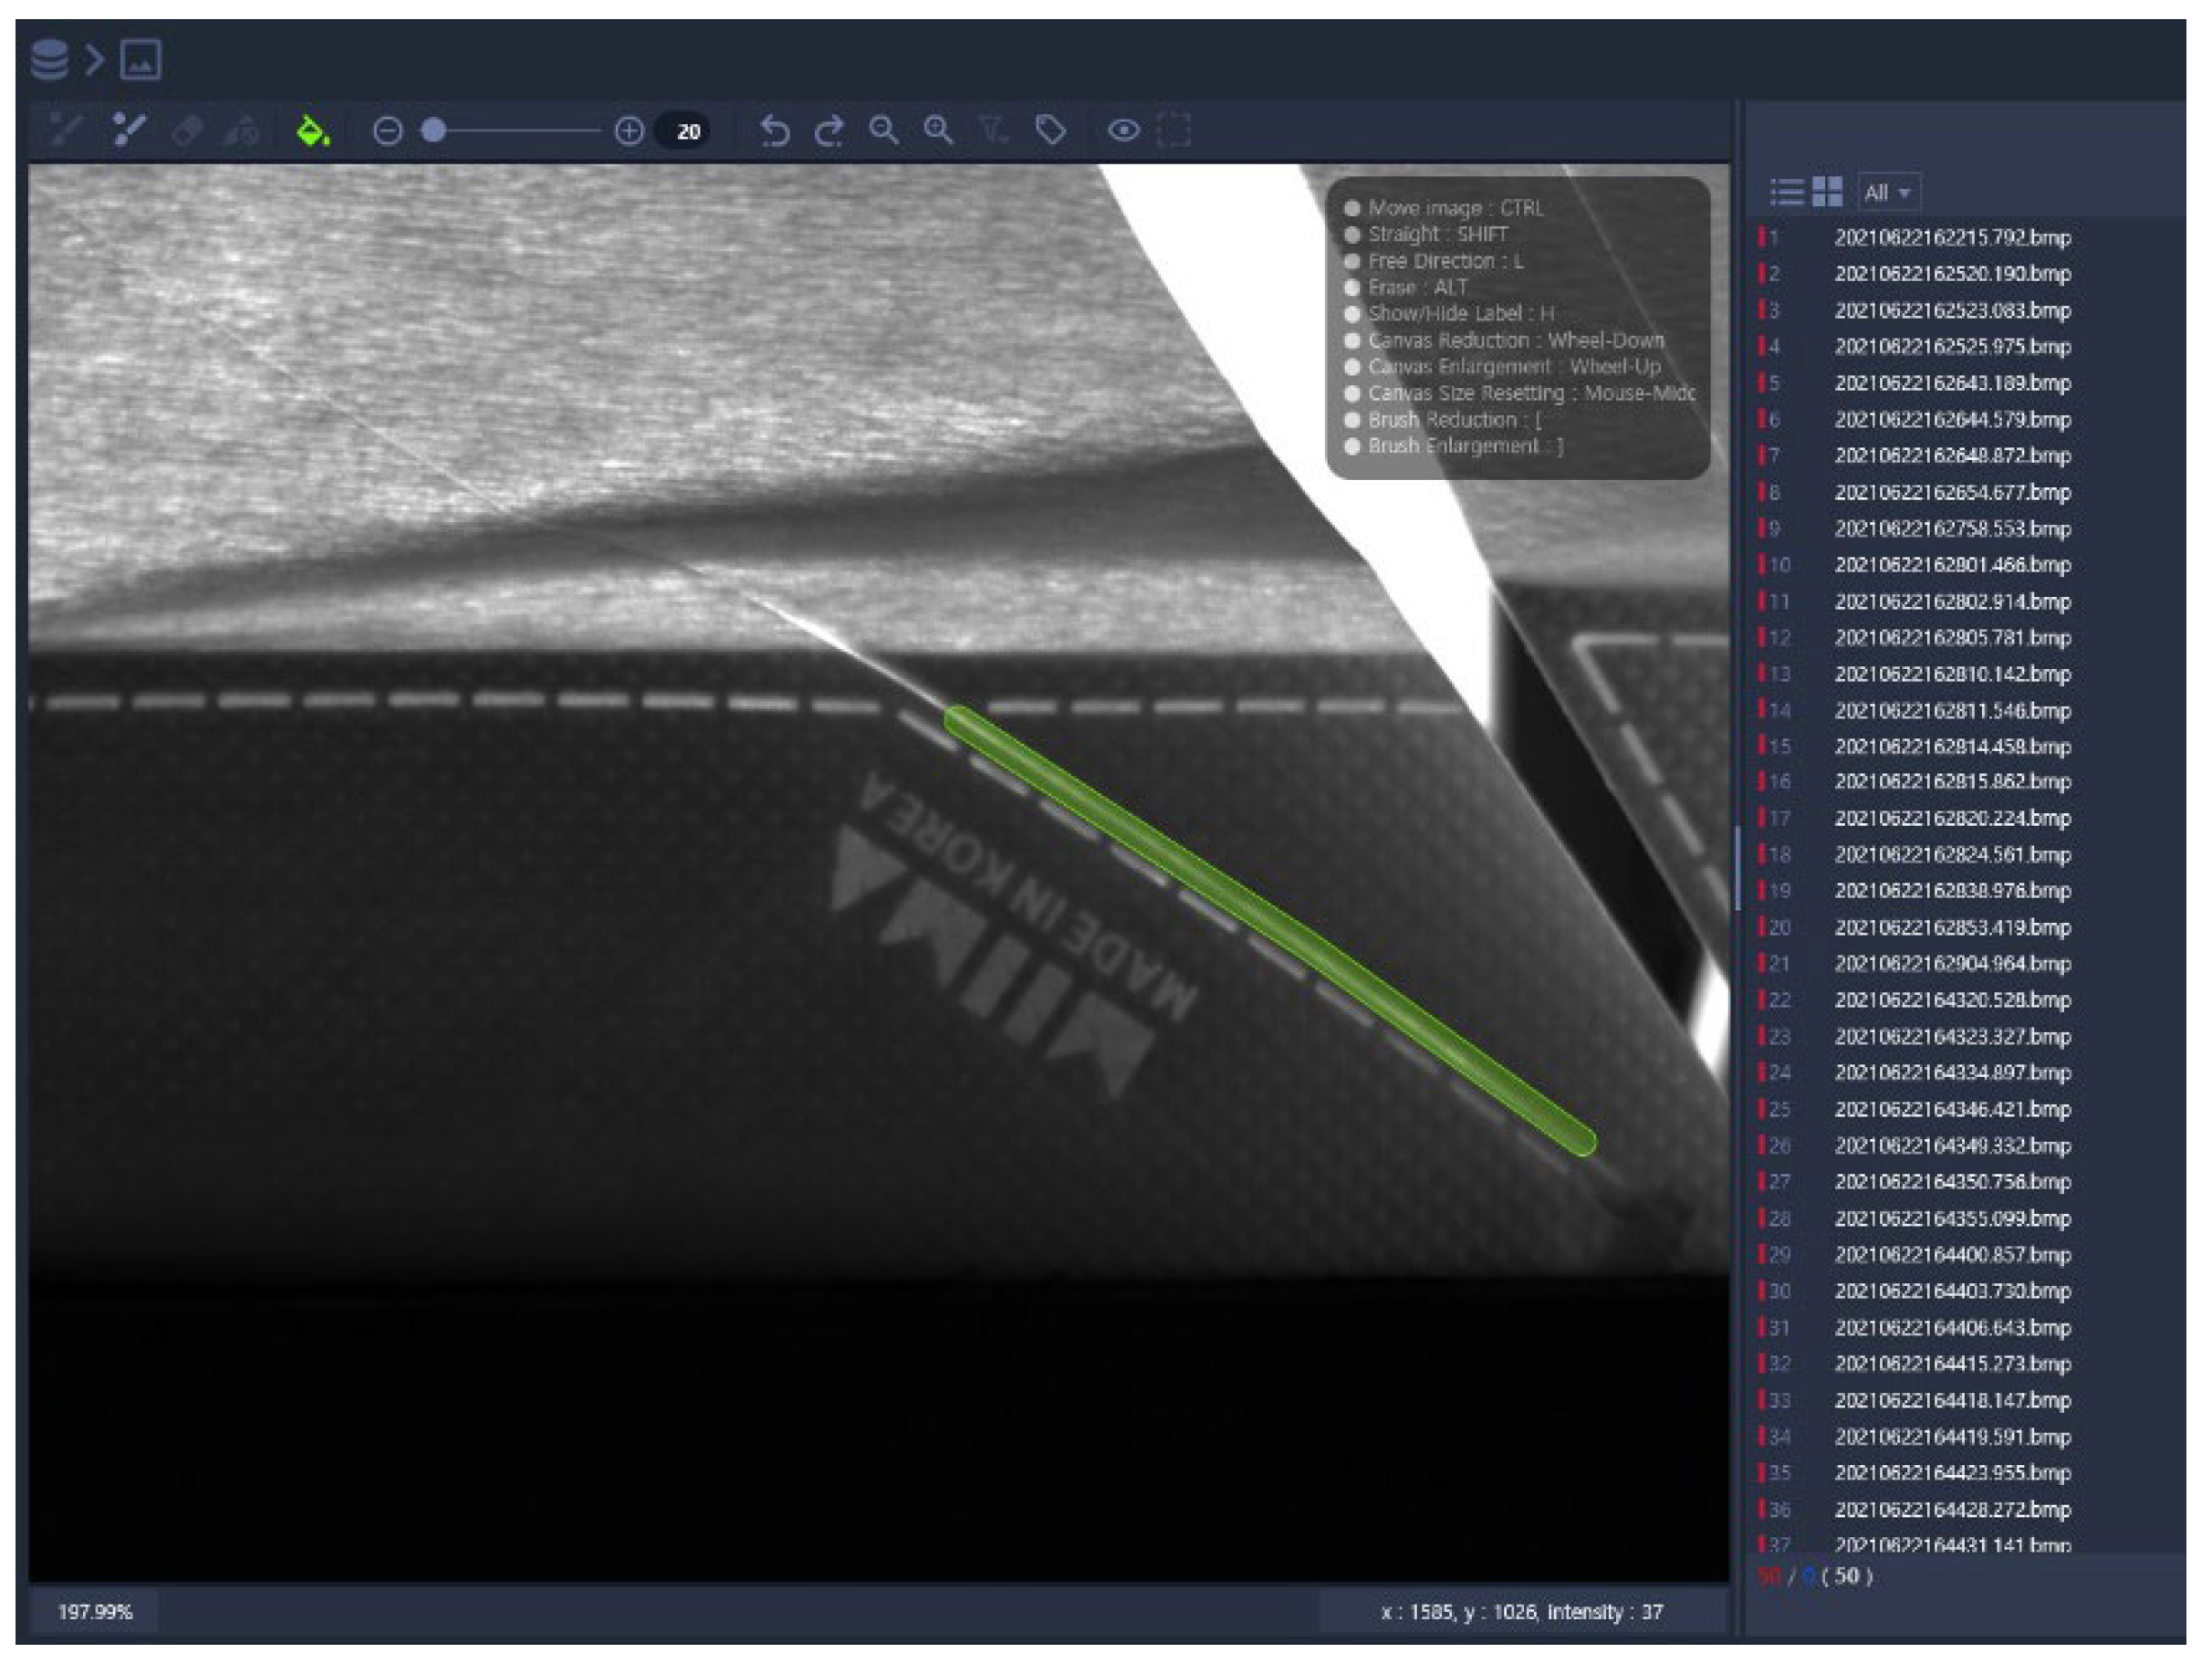
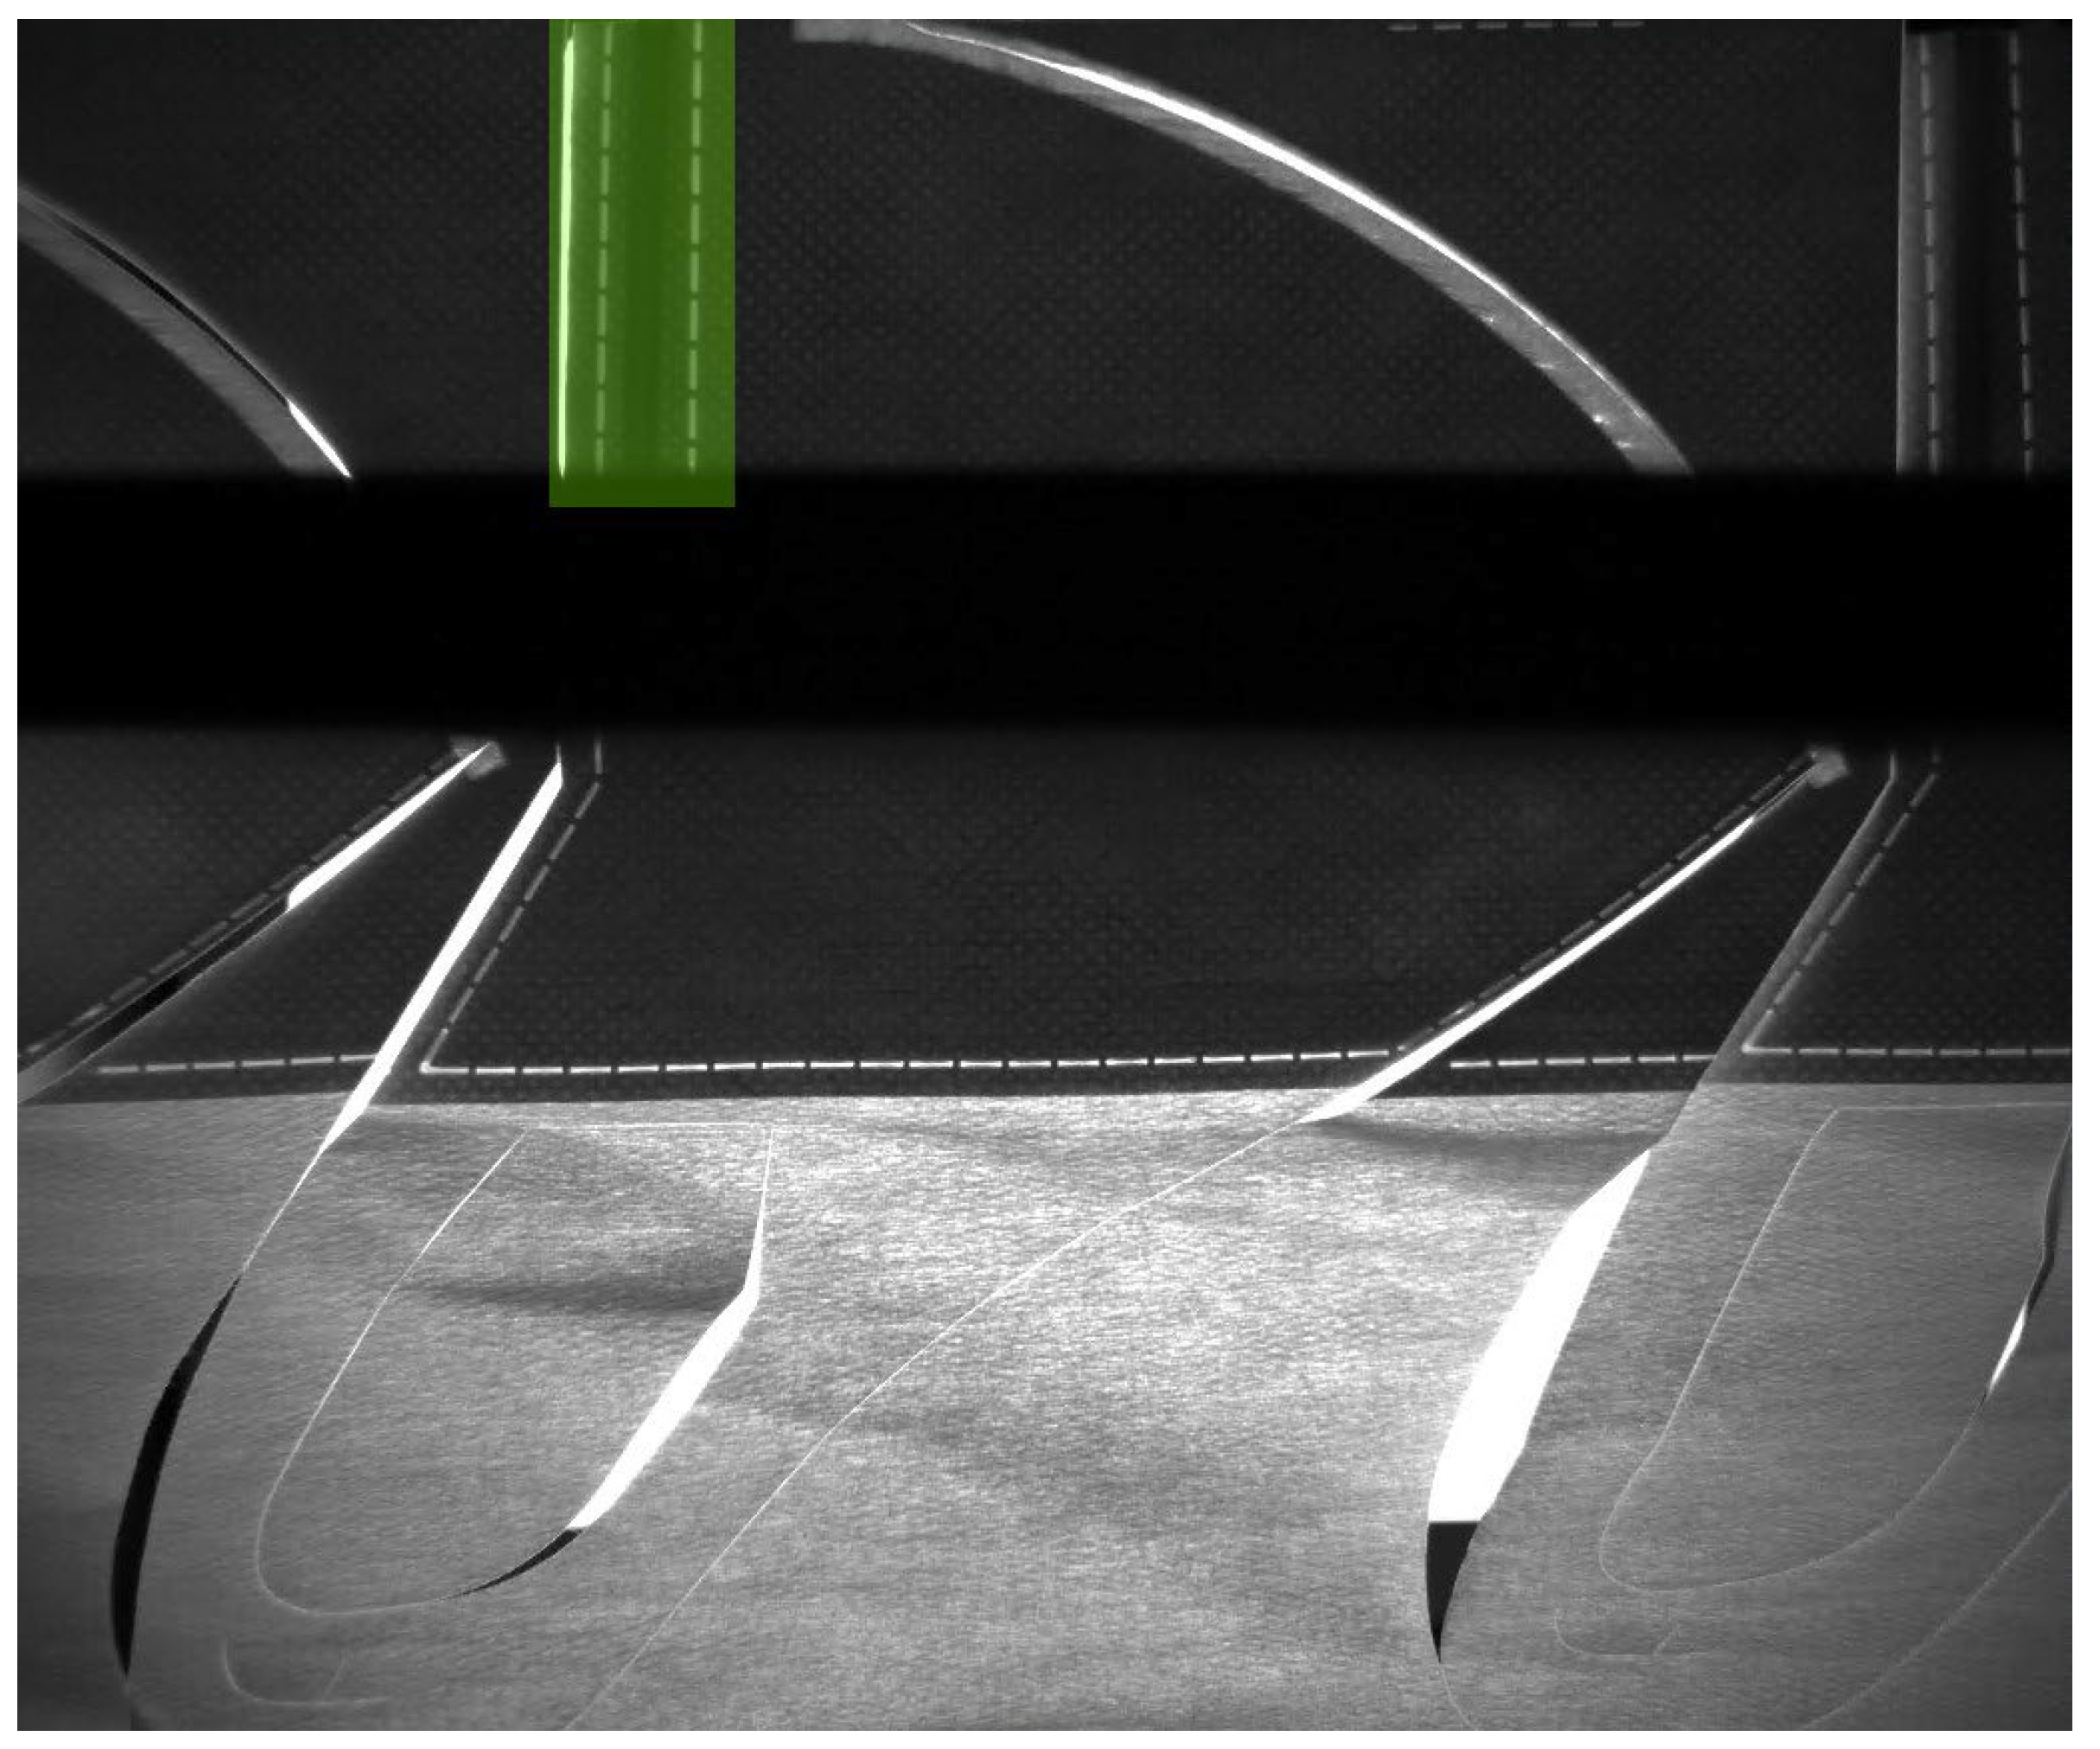
4.3. Database Management: Loading Image Data for Training, Classifying and Setting Types
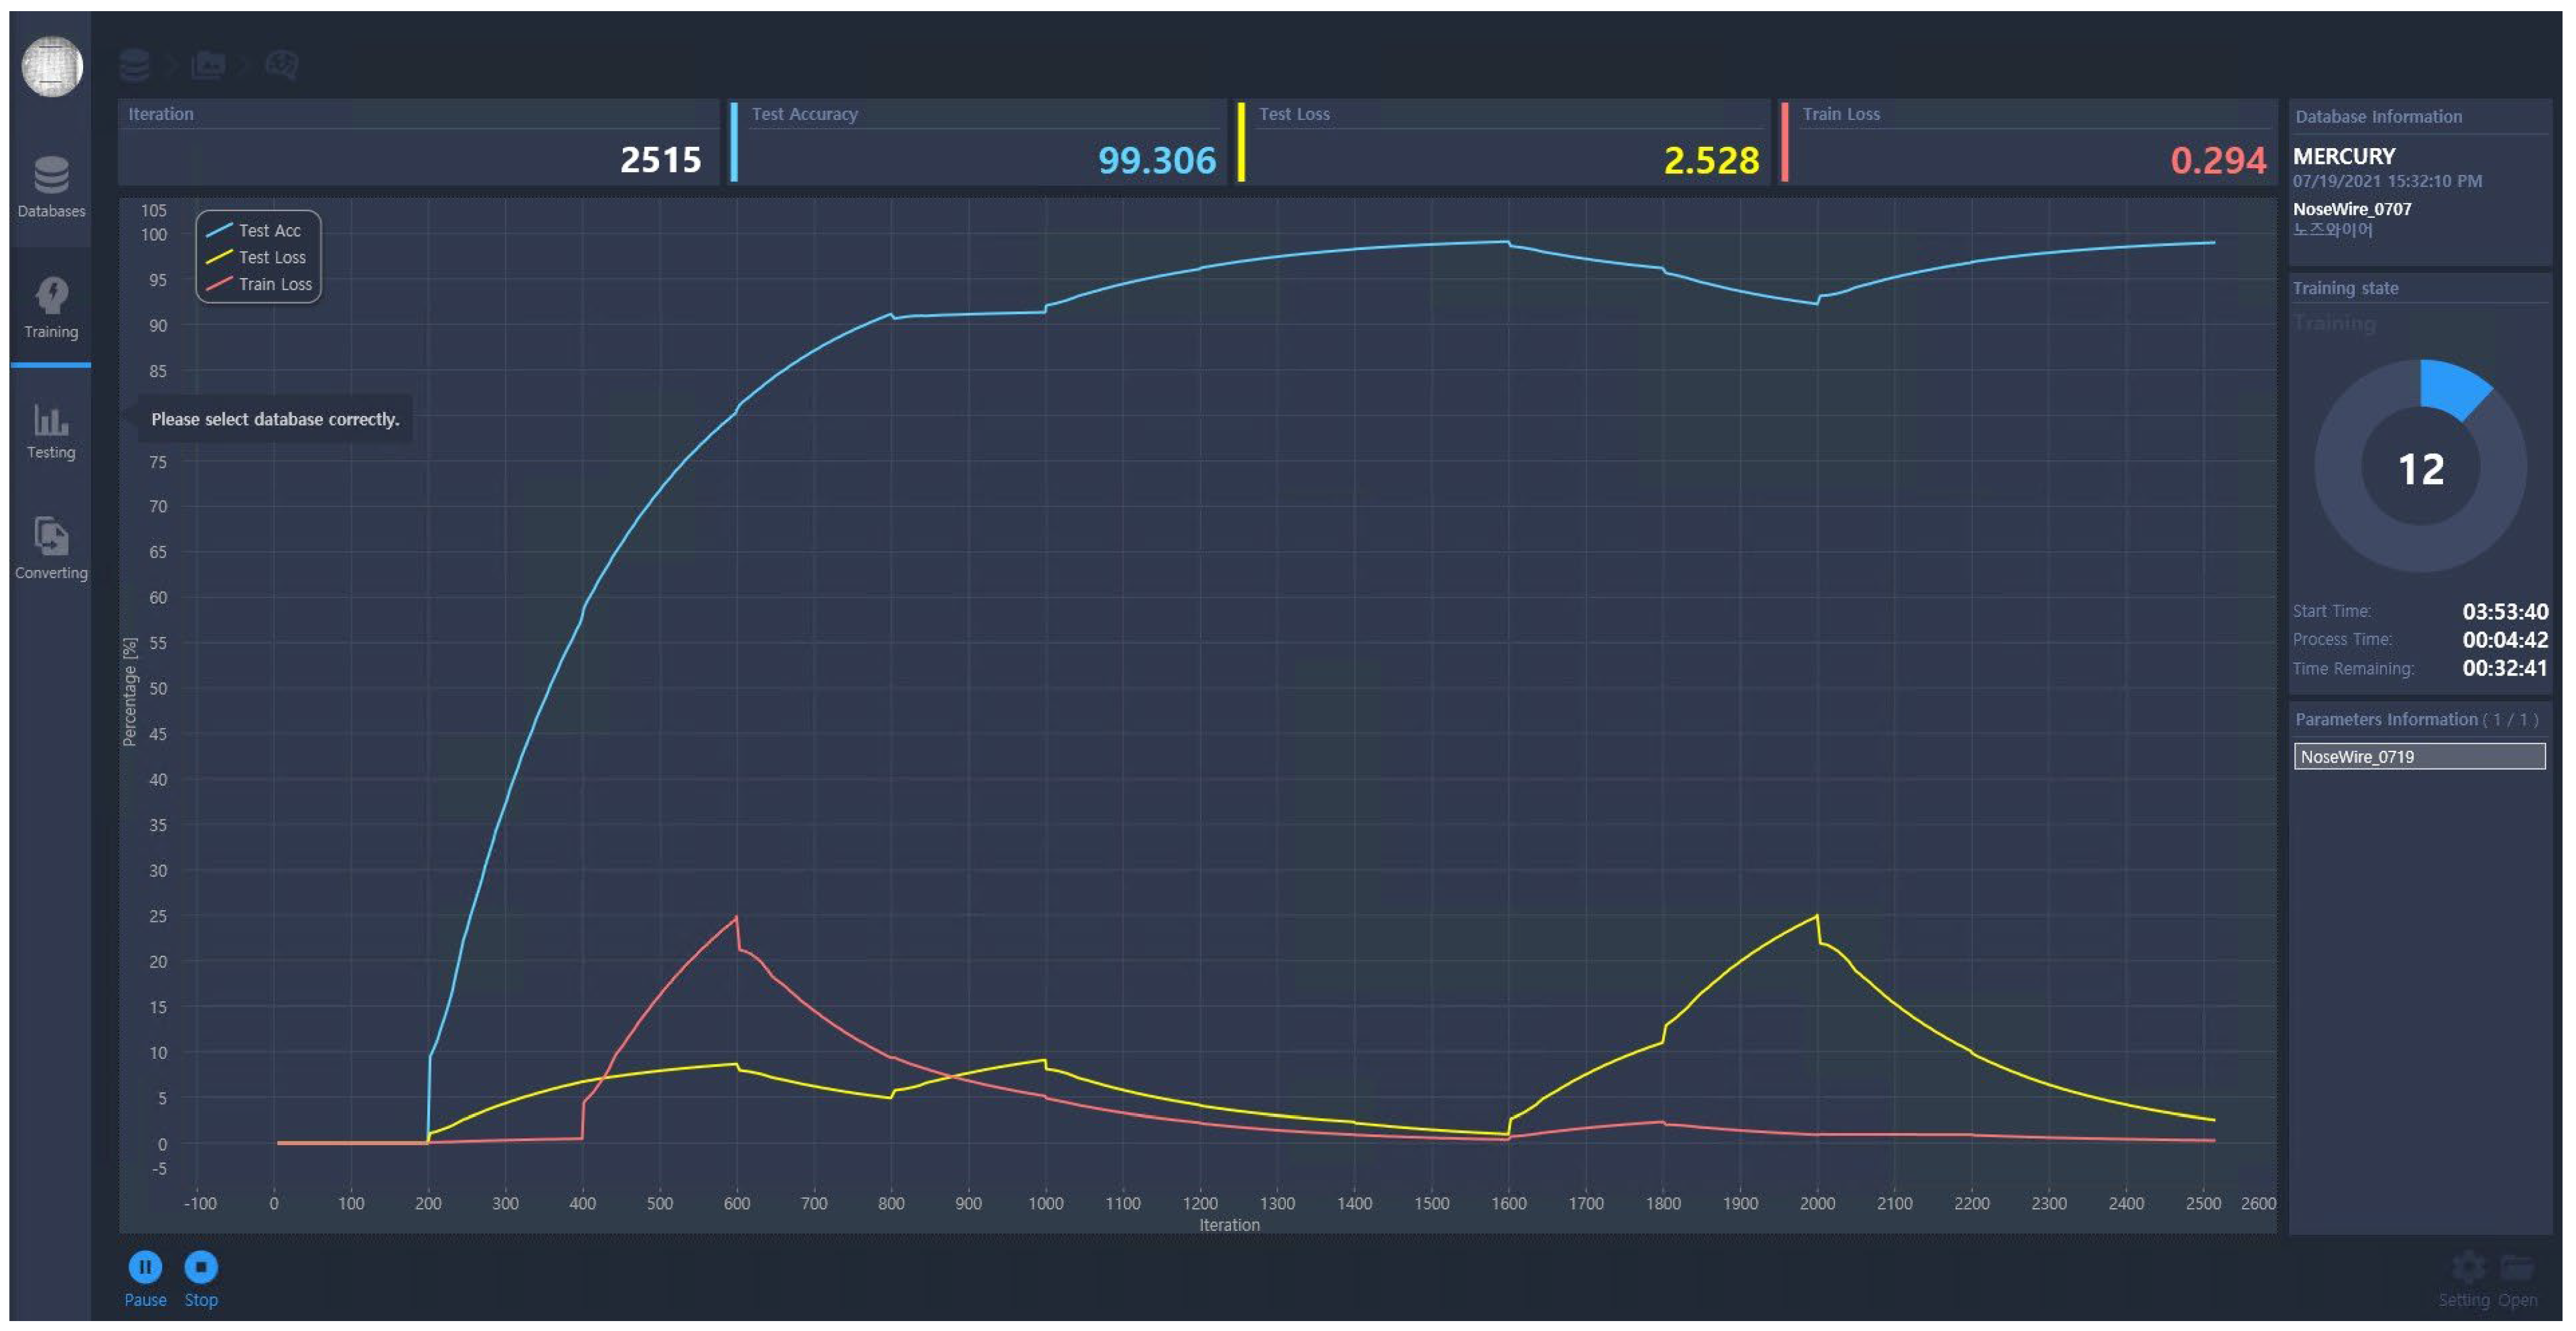
Image data for the Front Fusion Line Inspection and the Back Fusion Line Inspection as well as the nose wire fusion test of Figure 2 and the foreign object test on fabric of Figure 3 are obtained from the Machine Vision camera. Figure 8 shows the Front Fusion Line Inspection and Figure 9 shows the Back Fusion Line Inspection taken by the camera.
Figure 8. Front Fusion Line Inspection.
Figure 9. Back Fusion Line Inspection.
In the database stage, image data loading for training, type classification, and setting are managed. In the database creation step, a database that will be a training unit is added. For class configuration, classes are created for classification of types of images to be inspected. In the image classification step, addition/delete/movement is performed to classify the image of the class. Figure 10 is a screen that imports Good Image for AI Model training, and Figure 11 is a screen that imports Defect Image for training.
Figure 10. Good Image Import.
Figure 11. Defect Image Import.
Then, in the ROI designation step, a fixed region of interest of the retrieved images is designated and it also managed the defects of learning materials as a specific area and trained the selected area to identify the defect location. Figure 12 shows the ROI for Jaw Line, and Figure 13 shows the ROI for Cheek Line, respectively.
Figure 12. ROI for Jaw Line.
Figure 13. ROI for Cheek Line.
Figure 14 and Figure 15 are screens that label the Detection Line, which will be the basis for determining the good and defective products of the mask, within the ROI area.
Figure 14. Detection Line for Jaw.
Figure 15. Detection Line for Nose Wire.
As shown in Figure 16, In the parameter designation step, parameters are adjusted according to the characteristics of the retrieved image data. Learning parameters were set through Solver Parameters. Max Iteration means the maximum number of learning iterations, Step Count means the size of increase per learning cycle, and Base Learning Rate means the learning speed. In general, the smaller the learning speed, the slower the learning speed, and the greater the accuracy. Gamma refers to the coefficient value involved in the Base Learning Rate. Random Count, Probability is associated with overfitting issues, and when learning, it is well detected for images used in learning and poor detection performance for images (test data) not used in learning. To prevent this, the learning image is augmented through Data Augmentation.
Figure 16. Parameter Setting and Training based on the Prepared Database.
In the Training test stage, the learning results are checked through the test and the corresponding results through a report. When learning begins, it checks the progress in real time. In the test report stage, after training, the test image is retrieved, and the test is performed at the same time to check the learning result. Figure 17 shows the AI Model Training Process. The learning graph refers to a graph representing the calculated value during real-time learning. Iteration refers to the repetition of current learning, Test Accuracy refers to the degree to which the prediction of the model currently being learned is accurate, Test Loss refers to the degree to which the prediction of the validation set is incorrect, and Train Loss currently learning model is incorrect.
Figure 17. AI model training process on screen.

4.4. Results

Table 3 summarizes the results of performance evaluation using production, quality, cost, and delivery as KPIs to measure performance after the introduction of the Machine Vision-Based Quality Inspection System in the mask manufacturing process. The KPI and performance are verified by smart factory experts from the Ministry of SMEs and Startups and Korea Smart Manufacturing Office (KOSMO) following strict standards. In the evaluation of Table 3, ‘before’ refers to the situation before the establishment of the Machine Vision-based Quality Inspection System, and ‘after’ refers to the situation after the establishment of the system.
Table 3. Evaluation Indicator by KPI.
In the evaluation column, P represents Productivity. The hourly production of masks were previously 2600 sheets per hour, and after the establishment of the Machine Vision based Quality Inspection System, 4189 sheets per hour were produced, increasing the production by 61.1%. Q represents the Quality, which checks how much the defect rate has been reduced in the mask manufacturing process. In the existing mask manufacturing process, the defect rate averaged 8.3%, but after the Machine Vision-based Quality Inspection System was introduced, the defect rate decreased to 5.69%. C stands for Cost. This estimates how much cost occurs based on the number of hours workers work in the factory. In the existing mask manufacturing process, workers worked 12 h a day, but after construction, only 10 h of work satisfies daily production. D stands for Delivery. To confirm this, we check how long it takes based on the lead time from order to shipment. In the existing mask manufacturing process, it took 38.5 h to produce and ship 100,000 masks, but after the establishment of the Machine Vision-based Quality Inspection System, the same delivery can be completed in 25 h.
Table 4 expresses the logic for calculating each KPI and formulates it. Production refers to the amount of production per hour and is calculated by dividing the production by the input time. Quality represents the defect rate occurring in a finished product, which is calculated by dividing the number of productions by the number of defects occurring in the finished product and multiplying it by 100. Cost is the time spent on the task to numerically represent the work capabilities that the worker can produce in the mask production task. Delivery calculates the time it takes to manufacture and ship products from receipt of orders. To this end, 100,000 masks were divided into daily production of equipment, focusing on the fact that they can be shipped in units of 100,000 masks.
Table 4. The Basis for Calculating KPI.
Table 5 summarizes the Qualitative Performance after the introduction of the Machine Vision-Based Quality Inspection System evaluated from the perspective of Factory Workers and Management Workers. This qualitative performance measurement was conducted by surveying workers at the mask production site and office workers in charge of business management, and it thoroughly complied with the anonymity of the respondents’ evaluations to increase reliability. For Factory Workers, the main concerns are quality improvement using Sensor and Machine Vision, Adaptation of Control/Inspection Automation, and Real-time Data Management. Target Achievement in the Quality Improvement category is to reduce worker fatigue through Sensor Control, increase inspection accuracy through the introduction of Machine Vision, and improve quality through data analysis. In the case of Adoption of Control/Inspection Automation, efficient use of time through the automation, real-time manufacturing site control through data-based feedback, and real-time operation monitoring can be performed in real time. Real-time Data Management is to improve real-time production management through computerization.
Table 5. Qualitative Performance.
On the other hand, the main interests of Management Workers are Quality Improvement, Management Planning, and KPI (Key Performance Indicator). Quality Improvement is to enhance manufacturing capacity by using sensor data, improve quality assurance through the introduction of machine vision, and improve the production process to ulti mately make a good mask and amplify the customer’s experience. Management planning executes production planning through data collection in the manufacturing process, secures base data in smart factory construction, creates a visible management system by monitoring the production site, and secures a quality management system through data collection. KPI focuses on real-time quality control implementation, goal-oriented on-site data processing, and improved quality control using computer equipment.
Table 6 is a comparative chart that compares and analyzes the effects of the Machine Vision-Based Quality Inspection System (After) compared to the existing system (Before) in each process. Process includes the main inspection processes; Fabric Tension Control, Cutting of the Nose Wire Insertion, Ultrasonic Welding and Alignment Foreign Matter Inspection, Automation of final inspection process, Manufacturing facility management, Real-time manufacturing history management, and Production status monitoring. Before describes problems in the existing inspection process and includes actual photos at the inspection process site. After also includes actual photos of each process after the introduction of the Machine Vision System and describes improvements. Effectiveness details what effectiveness and performance improvements have actually been achieved by comparing Before and After, and details the operations received from the field workers and management workers of Machine Vision System.
Table 6. Before vs. After Comparison.

5. Conclusions

To establish a sustainable production environment in the mask manufacturing process, machine vision-based quality inspection system, control automation, POP manufacturing monitoring system, smart factory hardware and software system, and data aggregation system by process and equipment were established. In addition, an image training model using LAON PEOPLE NAVI AI Toolkit is developed to classify good products and defective products with excellent performance in the mask manufacturing process. As a result, the productivity of “Company A”’s mask defect detection process can be dramatically increased.
An unresolved problem in this study is that in certain cases, inaccuracies in the detection of defective products may arise. In addition, it revealed that good products can indeed look like defective products at the time of detecting the image from the machine vision camera. Issues such as excess fabric scrap, fabric wrinkling, and fabric pulling are caused by the movement of the gripper. What this suggests is that even when machine vision systems are deployed in the field, human assistance is still necessary. This is because operator intervention is unavoidable for reasons such as fabric exhaustion and equipment maintenance in the manufacturing process. The challenge for future research is to find a machine vision construction methodology that resolves the unresolved inaccuracies mentioned above, and to apply the machine vision to other industries beyond the mask manufacturing process to dramatically increase PQCD and ensure a sustainable business environment.

Author Contributions

Conceptualization, M.P.; methodology, M.P.; validation, M.P. and J.J.; formal analysis M.P.; investigation, M.P.; resources, M.P.; data curation, M.P.; writing—original draft preparation, M.P.; writing—review and editing, M.P.; supervision, J.J.; project administration, M.P.; funding acquisition, J.J. All authors have read and agreed to the published version of the manuscript.

Funding

This research was supported by the MSIT (Ministry of Science and ICT), Korea, under the ICT Creative Consilience Program (IITP-2022-2020-0-01821) supervised by the IITP (Institute for Information & communications Technology Planning & Evaluation), and the National Research Foundation of Korea (NRF) grant funded by the Korea government (MSIT) (No. 2021R1F1A1060054).

Institutional Review Board Statement

Not applicable.

Data Availability Statement

Not applicable.

Acknowledgments

This research was supported by the SungKyunKwan University and the BK21 456 FOUR (Graduate School Innovation) funded by the Ministry of Education (MOE, Korea) and National 457 Research Foundation of Korea (NRF).

Conflicts of Interest

The authors declare no conflict of interest.

References

  1. Javaid, M.; Haleem, A.; Vaishya, R.; Bahl, S.; Suman, R.; Vaish, A. Industry 4.0 technologies and their applications in fighting COVID-19 pandemic. Diabetes Metab. Syndr. Clin. Res. Rev. 2020, 14, 419–422. [Google Scholar] [CrossRef] [PubMed]
  2. Dlamini, S.; Kao, C.Y.; Su, S.L.; Jeffrey Kuo, C.F. Development of a real-time machine vision system for functional textile fabric defect detection using a deepYOLOv4 model. Text. Res. J. 2021, 92, 675–690. [Google Scholar] [CrossRef]
  3. Patil, M.; Verma, S.; Wakode, J. A review on fabric defect detection techniques. Int. Res. J. Eng. Technol. 2017, 4, 131–136. [Google Scholar]
  4. Soma, S.; Pooja, H. Machine Learning System for Textile Fabric Defect Detection Using GLCM Technique. In Proceedings of the Second International Conference on Advances in Computer Engineering and Communication Systems, Tamilnadu, India, 20–22 December 2021; Springer: Berlin/Heidelberg, Germany, 2022. [Google Scholar]
  5. Ren, Z.; Fang, F.; Yan, N.; Wu, Y. State of the art in defect detection based on machine vision. Int. J. Precis. Eng. Green Technol. 2021, 9, 661–691. [Google Scholar] [CrossRef]
  6. Kupchak, C.; Mittiga, T.; Jordaan, B.; Namazi, M.; Nölleke, C.; Figueroa, E. Automated fabric defect inspection: A survey of classifiers. arXiv 2014, arXiv:1405.6117. [Google Scholar]
  7. LeCun, Y.; Boser, B.; Denker, J.S.; Henderson, D.; Howard, R.E.; Hubbard, W.; Jackel, L.D. Backpropagation applied to handwritten zip code recognition. Neural Comput. 1989, 1, 541–551. [Google Scholar] [CrossRef]
  8. Nanni, L.; Paci, M.; Brahnam, S.; Lumini, A. Comparison of Different Image Data Augmentation Approaches. J. Imaging 2021, 7, 254. [Google Scholar] [CrossRef]
  9. Jing, J.; Zhuo, D.; Zhang, H.; Liang, Y.; Zheng, M. Fabric defect detection using the improved YOLOv3 model. J. Eng. Fibers Fabr. 2020, 15, 1558925020908268. [Google Scholar] [CrossRef]
  10. Shorten, C.; Khoshgoftaar, T.M. A survey on image data augmentation for deep learning. J. Big Data 2019, 6, 60. [Google Scholar] [CrossRef]
  11. Ade, F.; Lins, N.; Unser, M. Comparison of various filter sets for defect detection in textiles. In Proceedings of the International Conference on Pattern Recognition, Montreal, QC, Canada, 30 July–2 August 1984. [Google Scholar]
  12. Xin, S.; Zhao, C.; Sun, Y. A Machine Vision-based Fabric Defect Detection Solution for Textile Production Industry Using Object Detection. In Proceedings of the 2021 33rd Chinese Control and Decision Conference (CCDC), Kunming, China, 22–24 May 2021; IEEE: Piscataway, NJ, USA, 2021. [Google Scholar]
  13. Ozcan, S.; Simsir, F. A new model based on Artificial Bee Colony algorithm for preventive maintenance with replacement scheduling in continuous production lines. Eng. Sci. Technol. Int. J. 2019, 22, 1175–1186. [Google Scholar] [CrossRef]
  14. Kim, D.H.; Boo, S.B.; Hong, H.C.; Yeo, W.G.; Lee, N.Y. Machine Vision-based Defect Detection Using Deep Learning Algorithm. J. Korean Soc. Nondestruct. Test. 2020, 40, 47–52. [Google Scholar] [CrossRef]
  15. Zhao, Z.Q.; Zheng, P.; Xu, S.T.; Wu, X. Object detection with deep learning. Comput. Vis. Pattern Recognit. 2018, 30, 3212–3232. [Google Scholar]
  16. Lin, T.-Y.; Goyal, P.; Girshick, R.; He, K.; Dollár, P. Focal loss for dense object detection. In Proceedings of the IEEE International Conference on Computer Vision, Venice, Italy, 22–29 October 2017. [Google Scholar]
  17. Cha, Y.; Choi, W.; Suh, G.; Mahmoudkhani, S.; Büyüköztürk, O. Autonomous Structural Visual Inspection Using Region-Based Deep Learning for Detecting Multiple Damage Types. Comput. Civ. Infrastruct. Eng. 2017, 33, 731–747. [Google Scholar]
  18. Pang, G.; Shen, C.; Cao, L.; Hengel, A.V.D. Deep learning for anomaly detection: A review. ACM Comput. Surv. CSUR 2021, 54, 1–38. [Google Scholar] [CrossRef]
  19. Qiu, K.; Song, W.; Wang, P. Abnormal data detection for industrial processes using adversarial autoencoders support vector data description data description. Meas. Sci. Technol. 2022, 33, 5. [Google Scholar] [CrossRef]
  20. Brito, T.; Queiroz, J.; Piardi, L.; Fernandes, L.A.; Lima, J.; Leitão, P. A machine learning approach for collaborative robot smart manufacturing inspection for quality control systems. Procedia Manuf. 2020, 51, 11–18. [Google Scholar] [CrossRef]
  21. Swain, M.J.; Ballard, D.H. Indexing via color histograms. In Active Perception and Robot Vision; Springer: Berlin/Heidelberg, Germany, 1992; pp. 261–273. [Google Scholar]
  22. Jiang, W. A Machine Vision Anomaly Detection System to Industry 4.0 Based on Variational Fuzzy Autoencoder. Comput. Intell. Neurosci. 2022, 2022, 1945507. [Google Scholar] [CrossRef]
  23. Xu, Z.; Guo, Y.; Saleh, J.H. Accurate Remaining Useful Life Prediction with Uncertainty Quantification: A Deep Learning and Nonstationary Gaussian Process Approach. IEEE Trans. Reliab. 2021, 71, 443–456. [Google Scholar] [CrossRef]
  24. Mao, W.; He, J.; Zuo, M.J. Predicting remaining useful life of rolling bearings based on deep feature representation and long short-term memory neural network. Adv. Mech. Eng. 2018, 10, 1–18. [Google Scholar] [CrossRef]
  25. Kang, Z.; Catal, C.; Tekinerdogan, B. Remaining useful life (RUL) prediction of equipment in production lines using artificial neural networks. Sensors 2021, 21, 932. [Google Scholar] [CrossRef]
  26. Salonen, A.; Deleryd, M. Cost of poor maintenance: A concept for maintenance performance improvement. J. Qual. Maint. Eng. 2011, 17, 63–73. [Google Scholar] [CrossRef]
  27. Luo, R.C.; Wang, H. Diagnostic and prediction of machines health status as exemplary best practice for vehicle production system. In Proceedings of the 2018 IEEE 88th Vehicular Technology Conference (VTC-Fall), Chicago, IL, USA, 27–30 August 2018; IEEE: Piscataway, NJ, USA, 2018. [Google Scholar]
Publisher’s Note: MDPI stays neutral with regard to jurisdictional claims in published maps and institutional affiliations.

Article Metrics

Citations

Article Access Statistics

Multiple requests from the same IP address are counted as one view.