
Internal Heat Exchanger Influence in Operational Cost and Environmental Impact of an Experimental Installation Using Low GWP Refrigerant for HVAC Conditions

 ,
, 
 ,
,  and
and
Abstract
:1. Introduction
2. Characteristics of R1234ze(E) as an Alternative Refrigerant
Environmental Effects
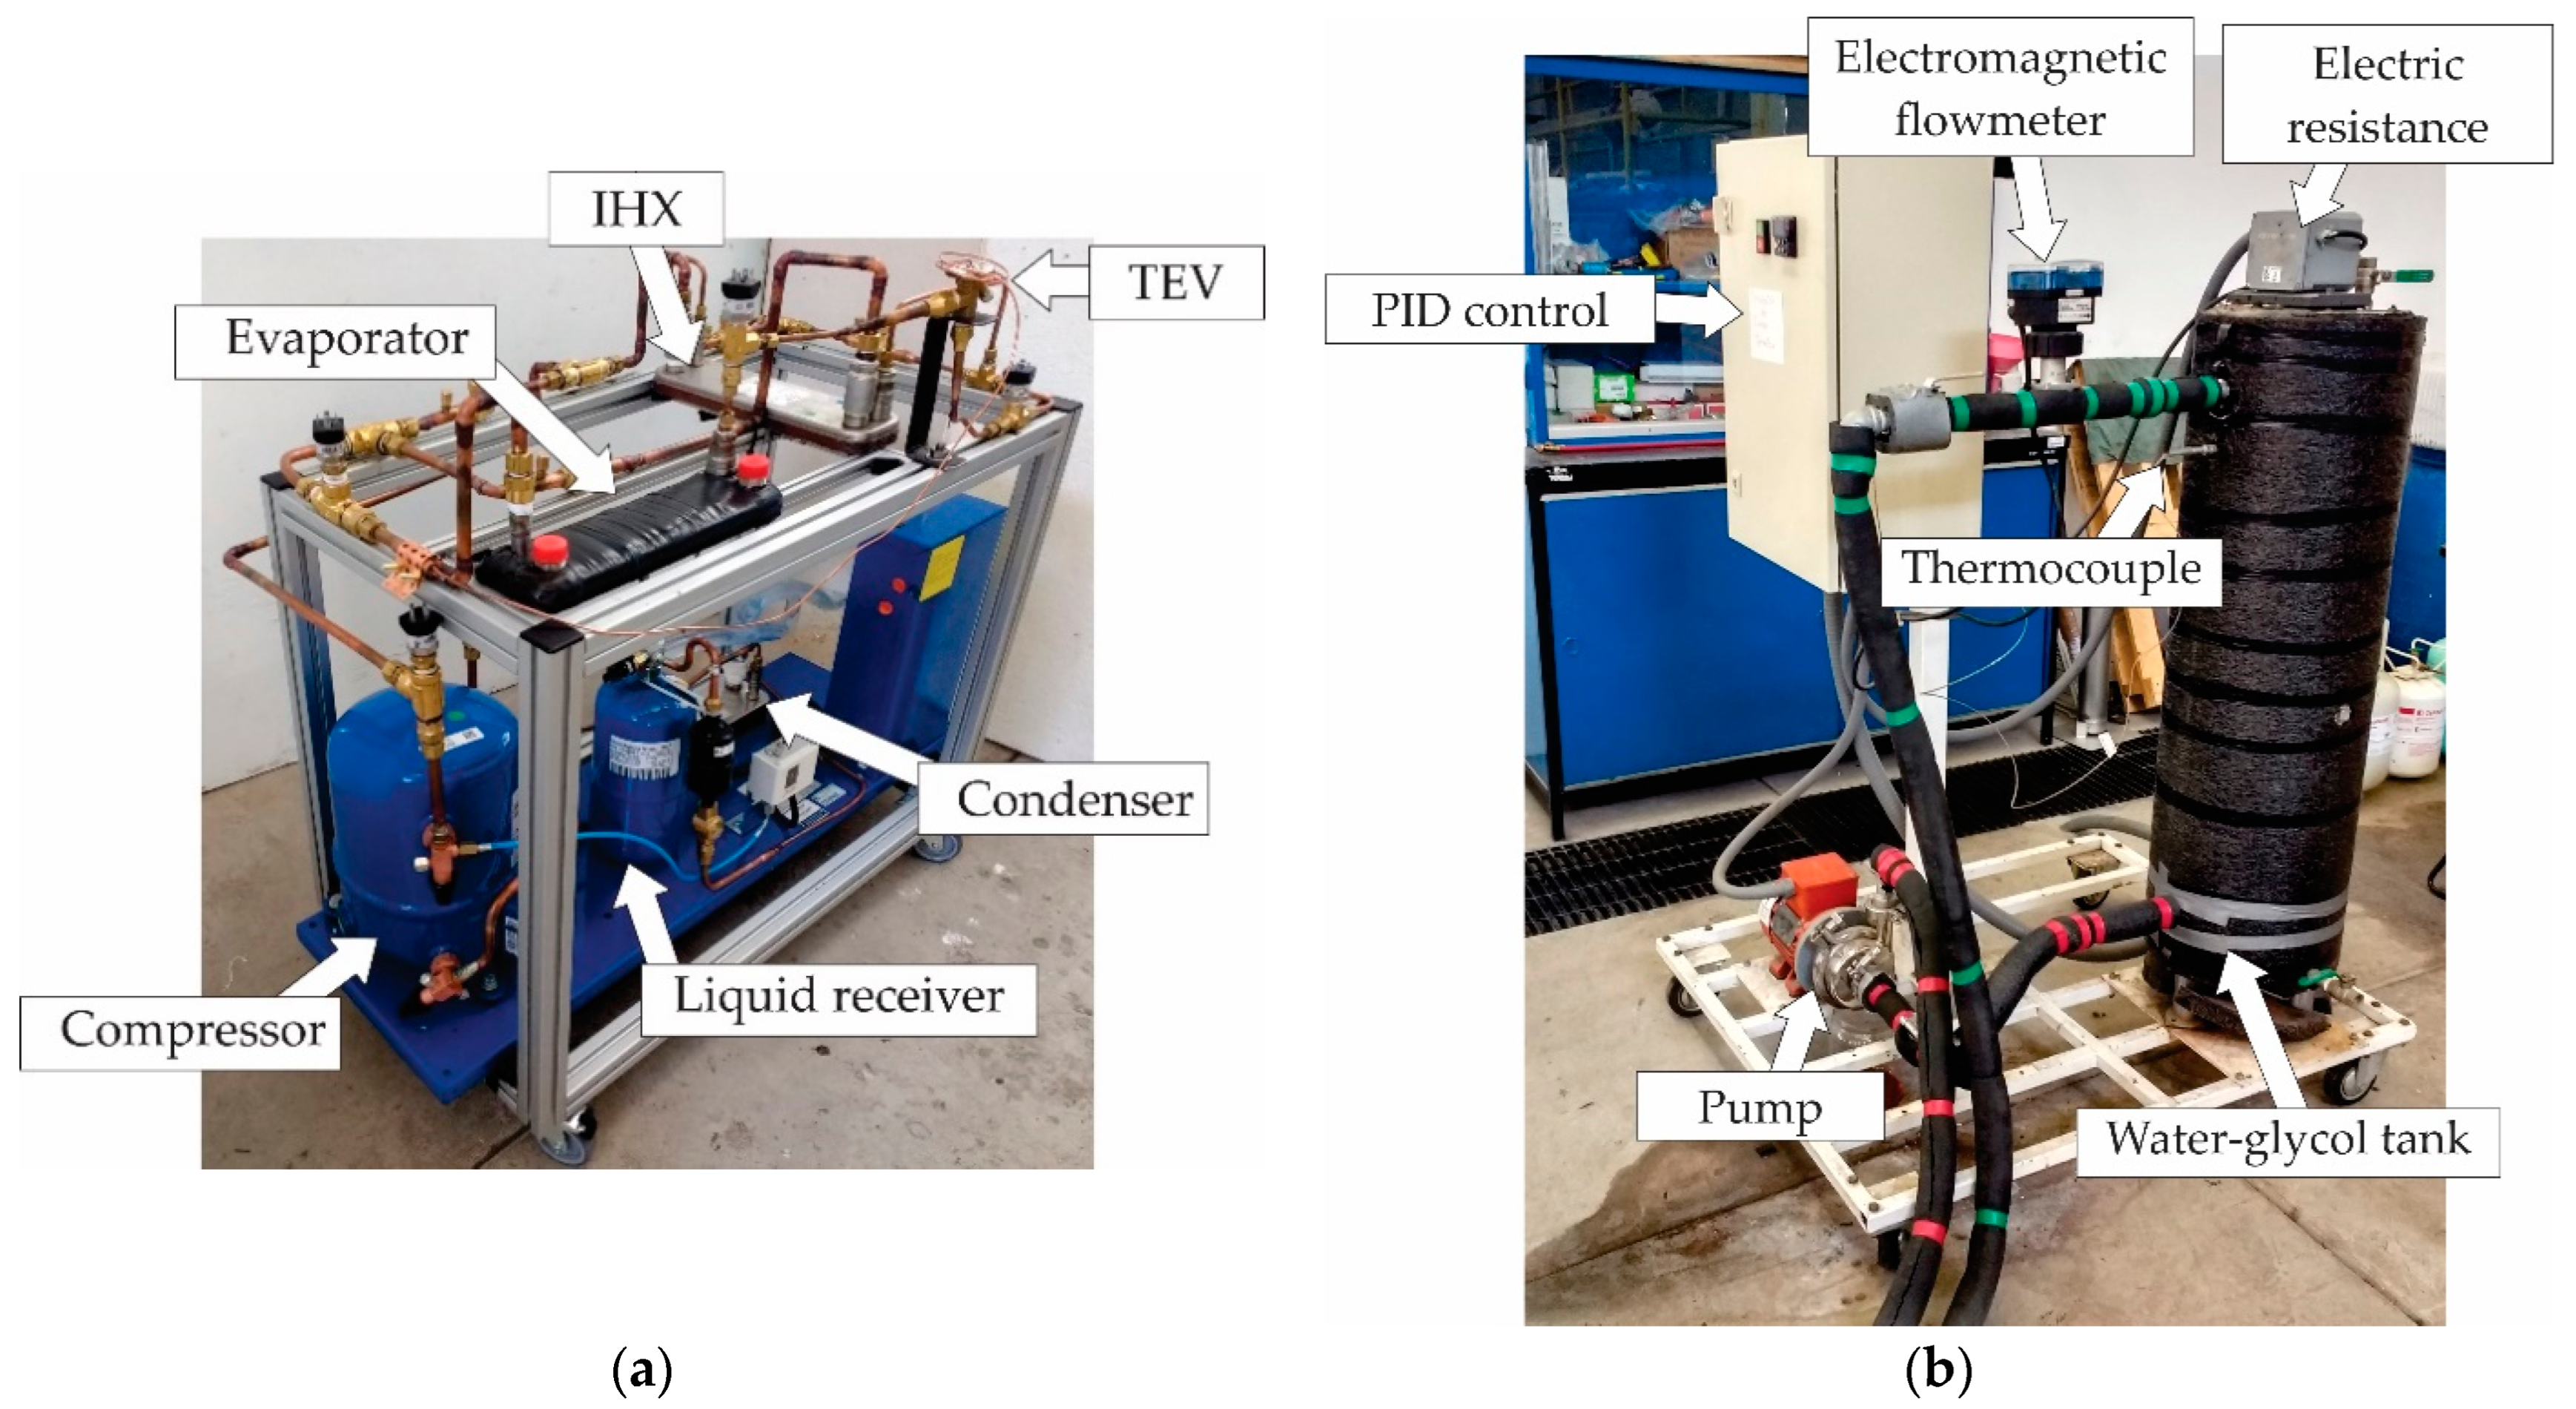
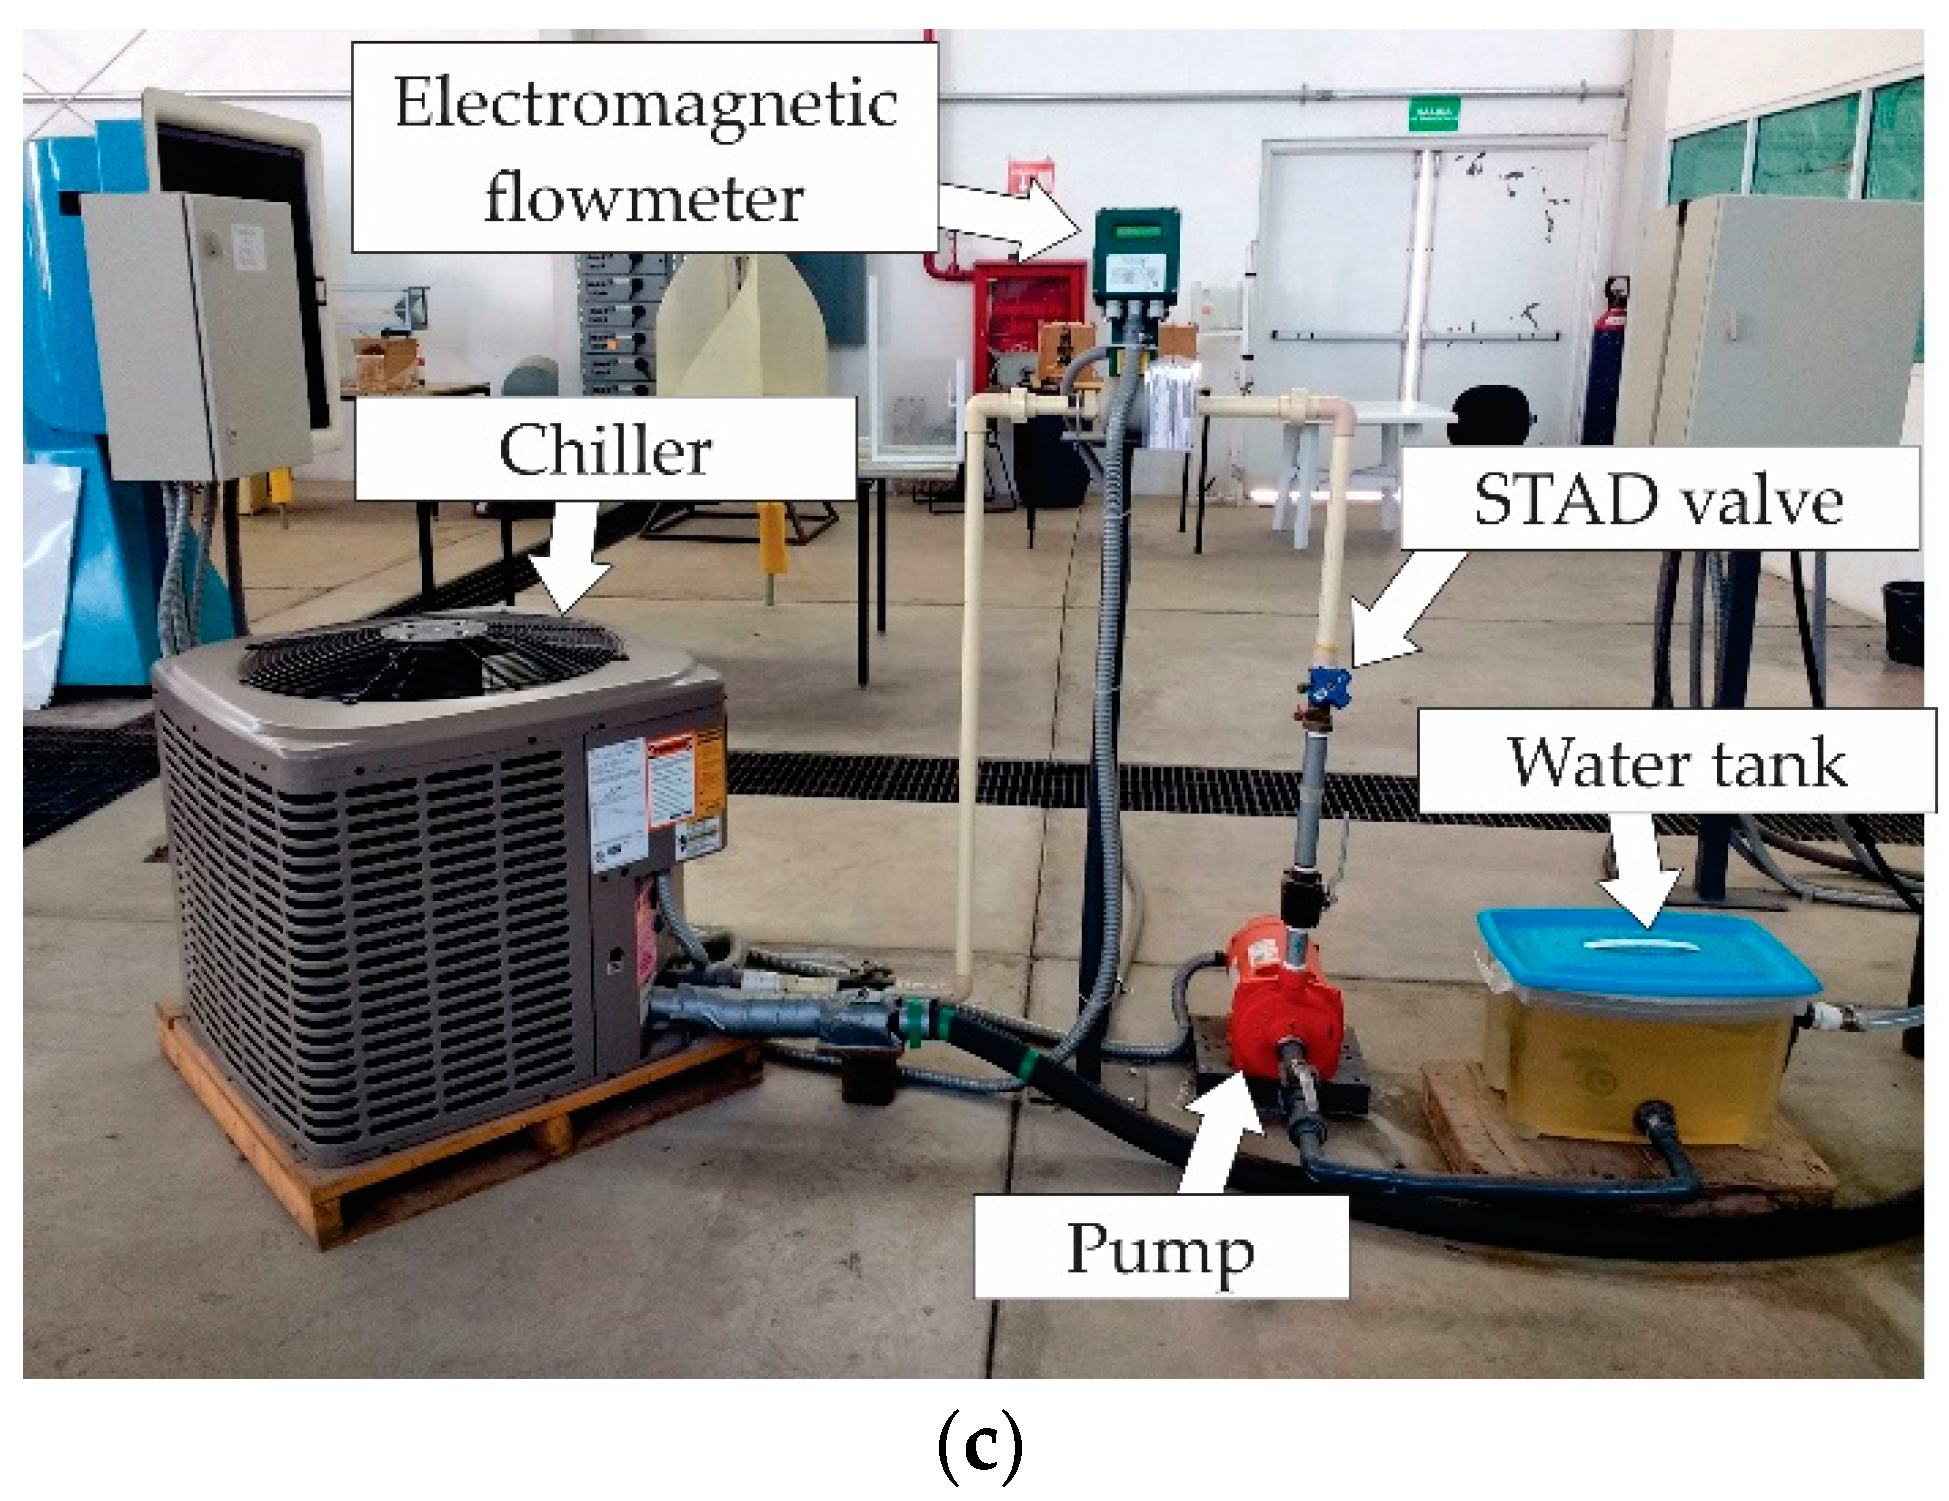
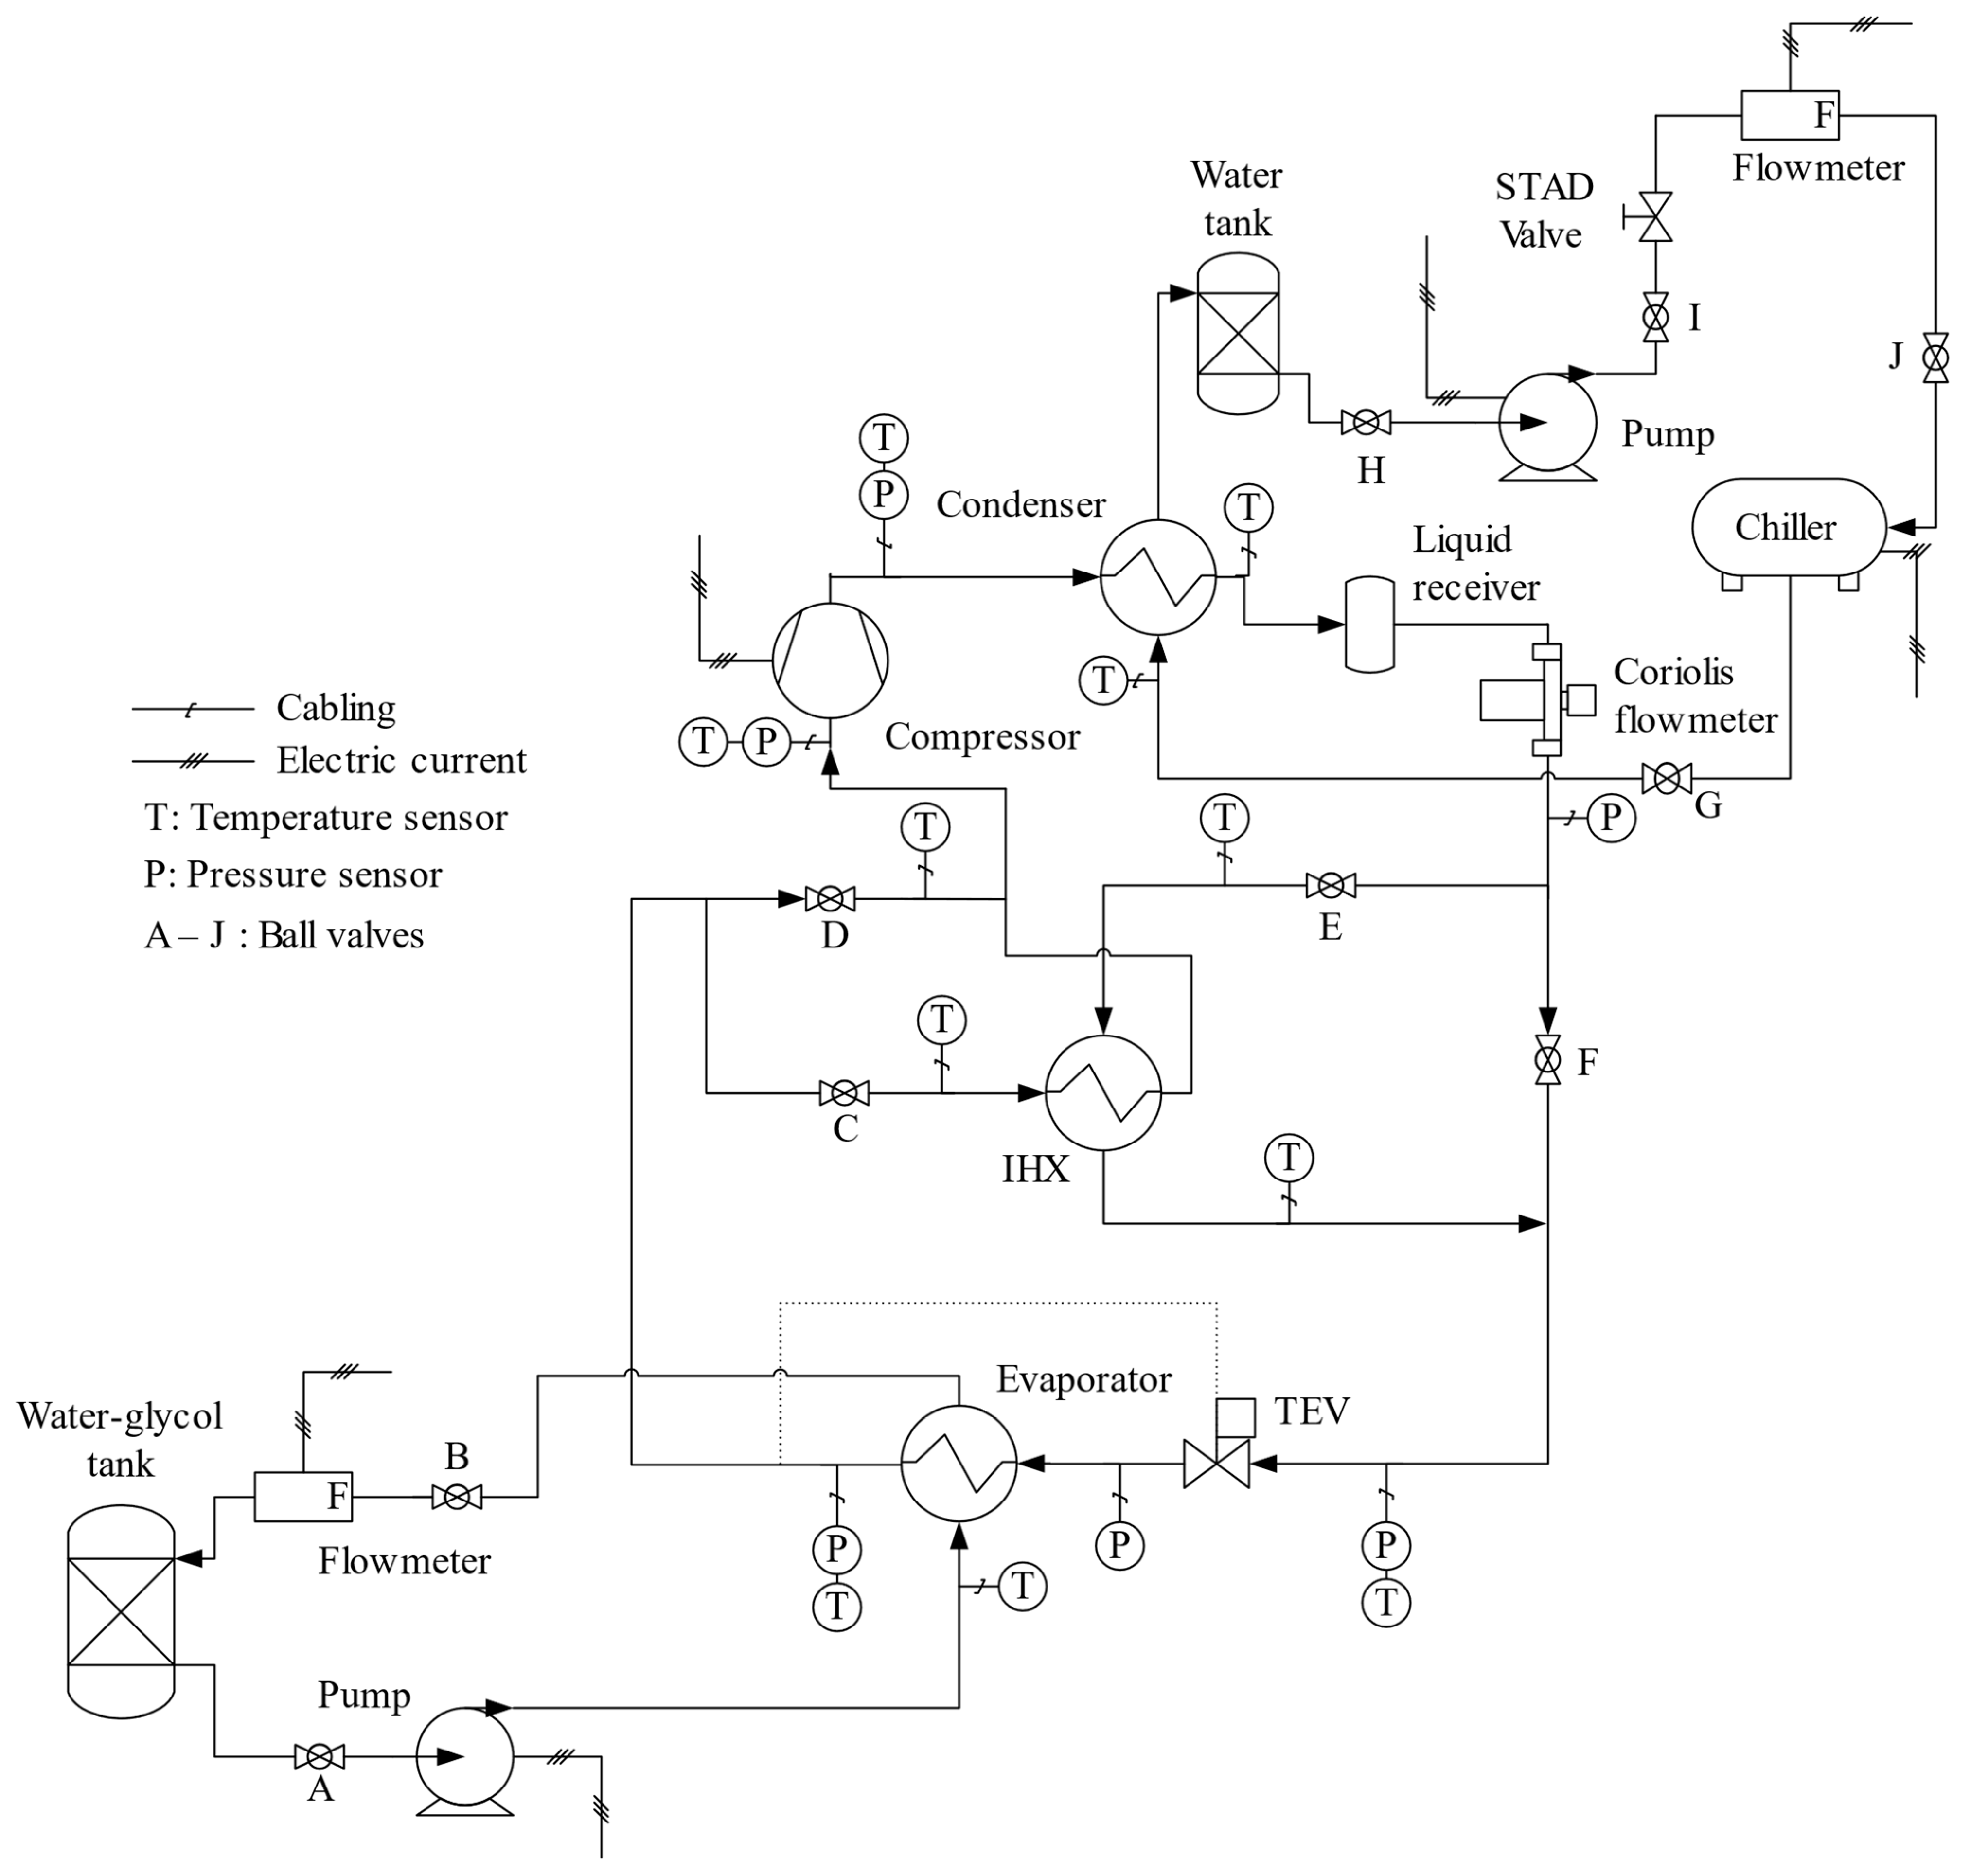
3. Experimental Procedure
- -
- BRC.
- -
- IHXC.
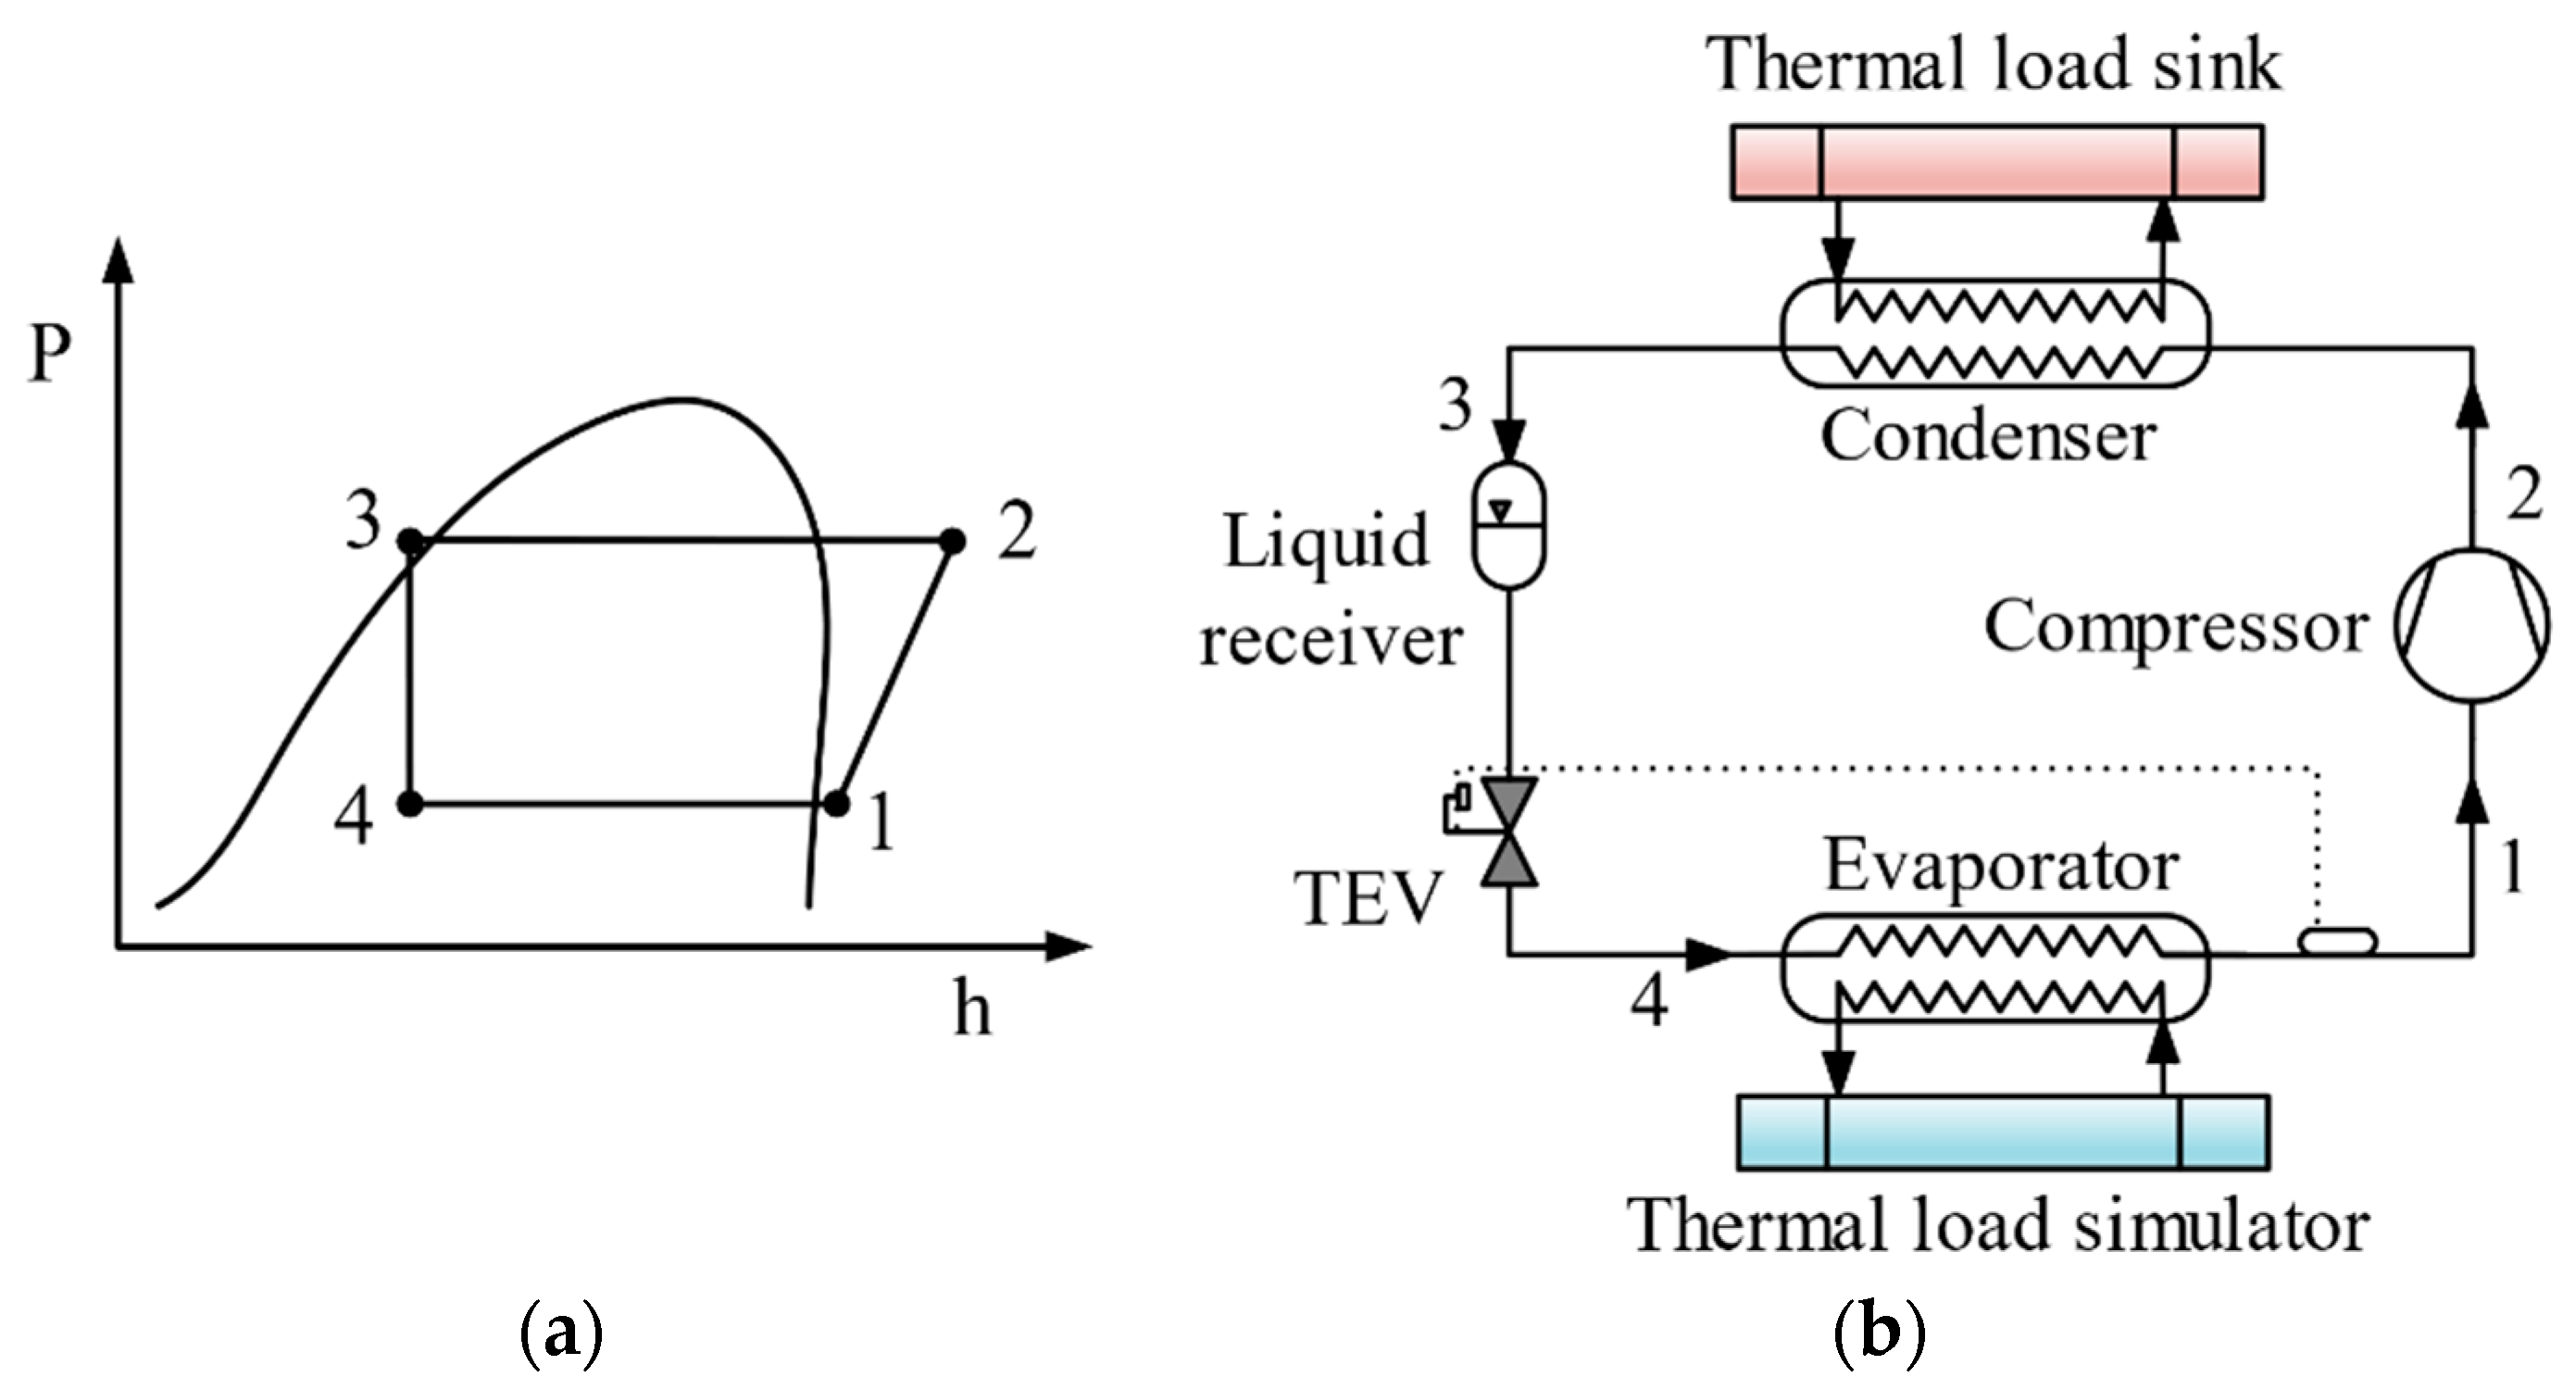
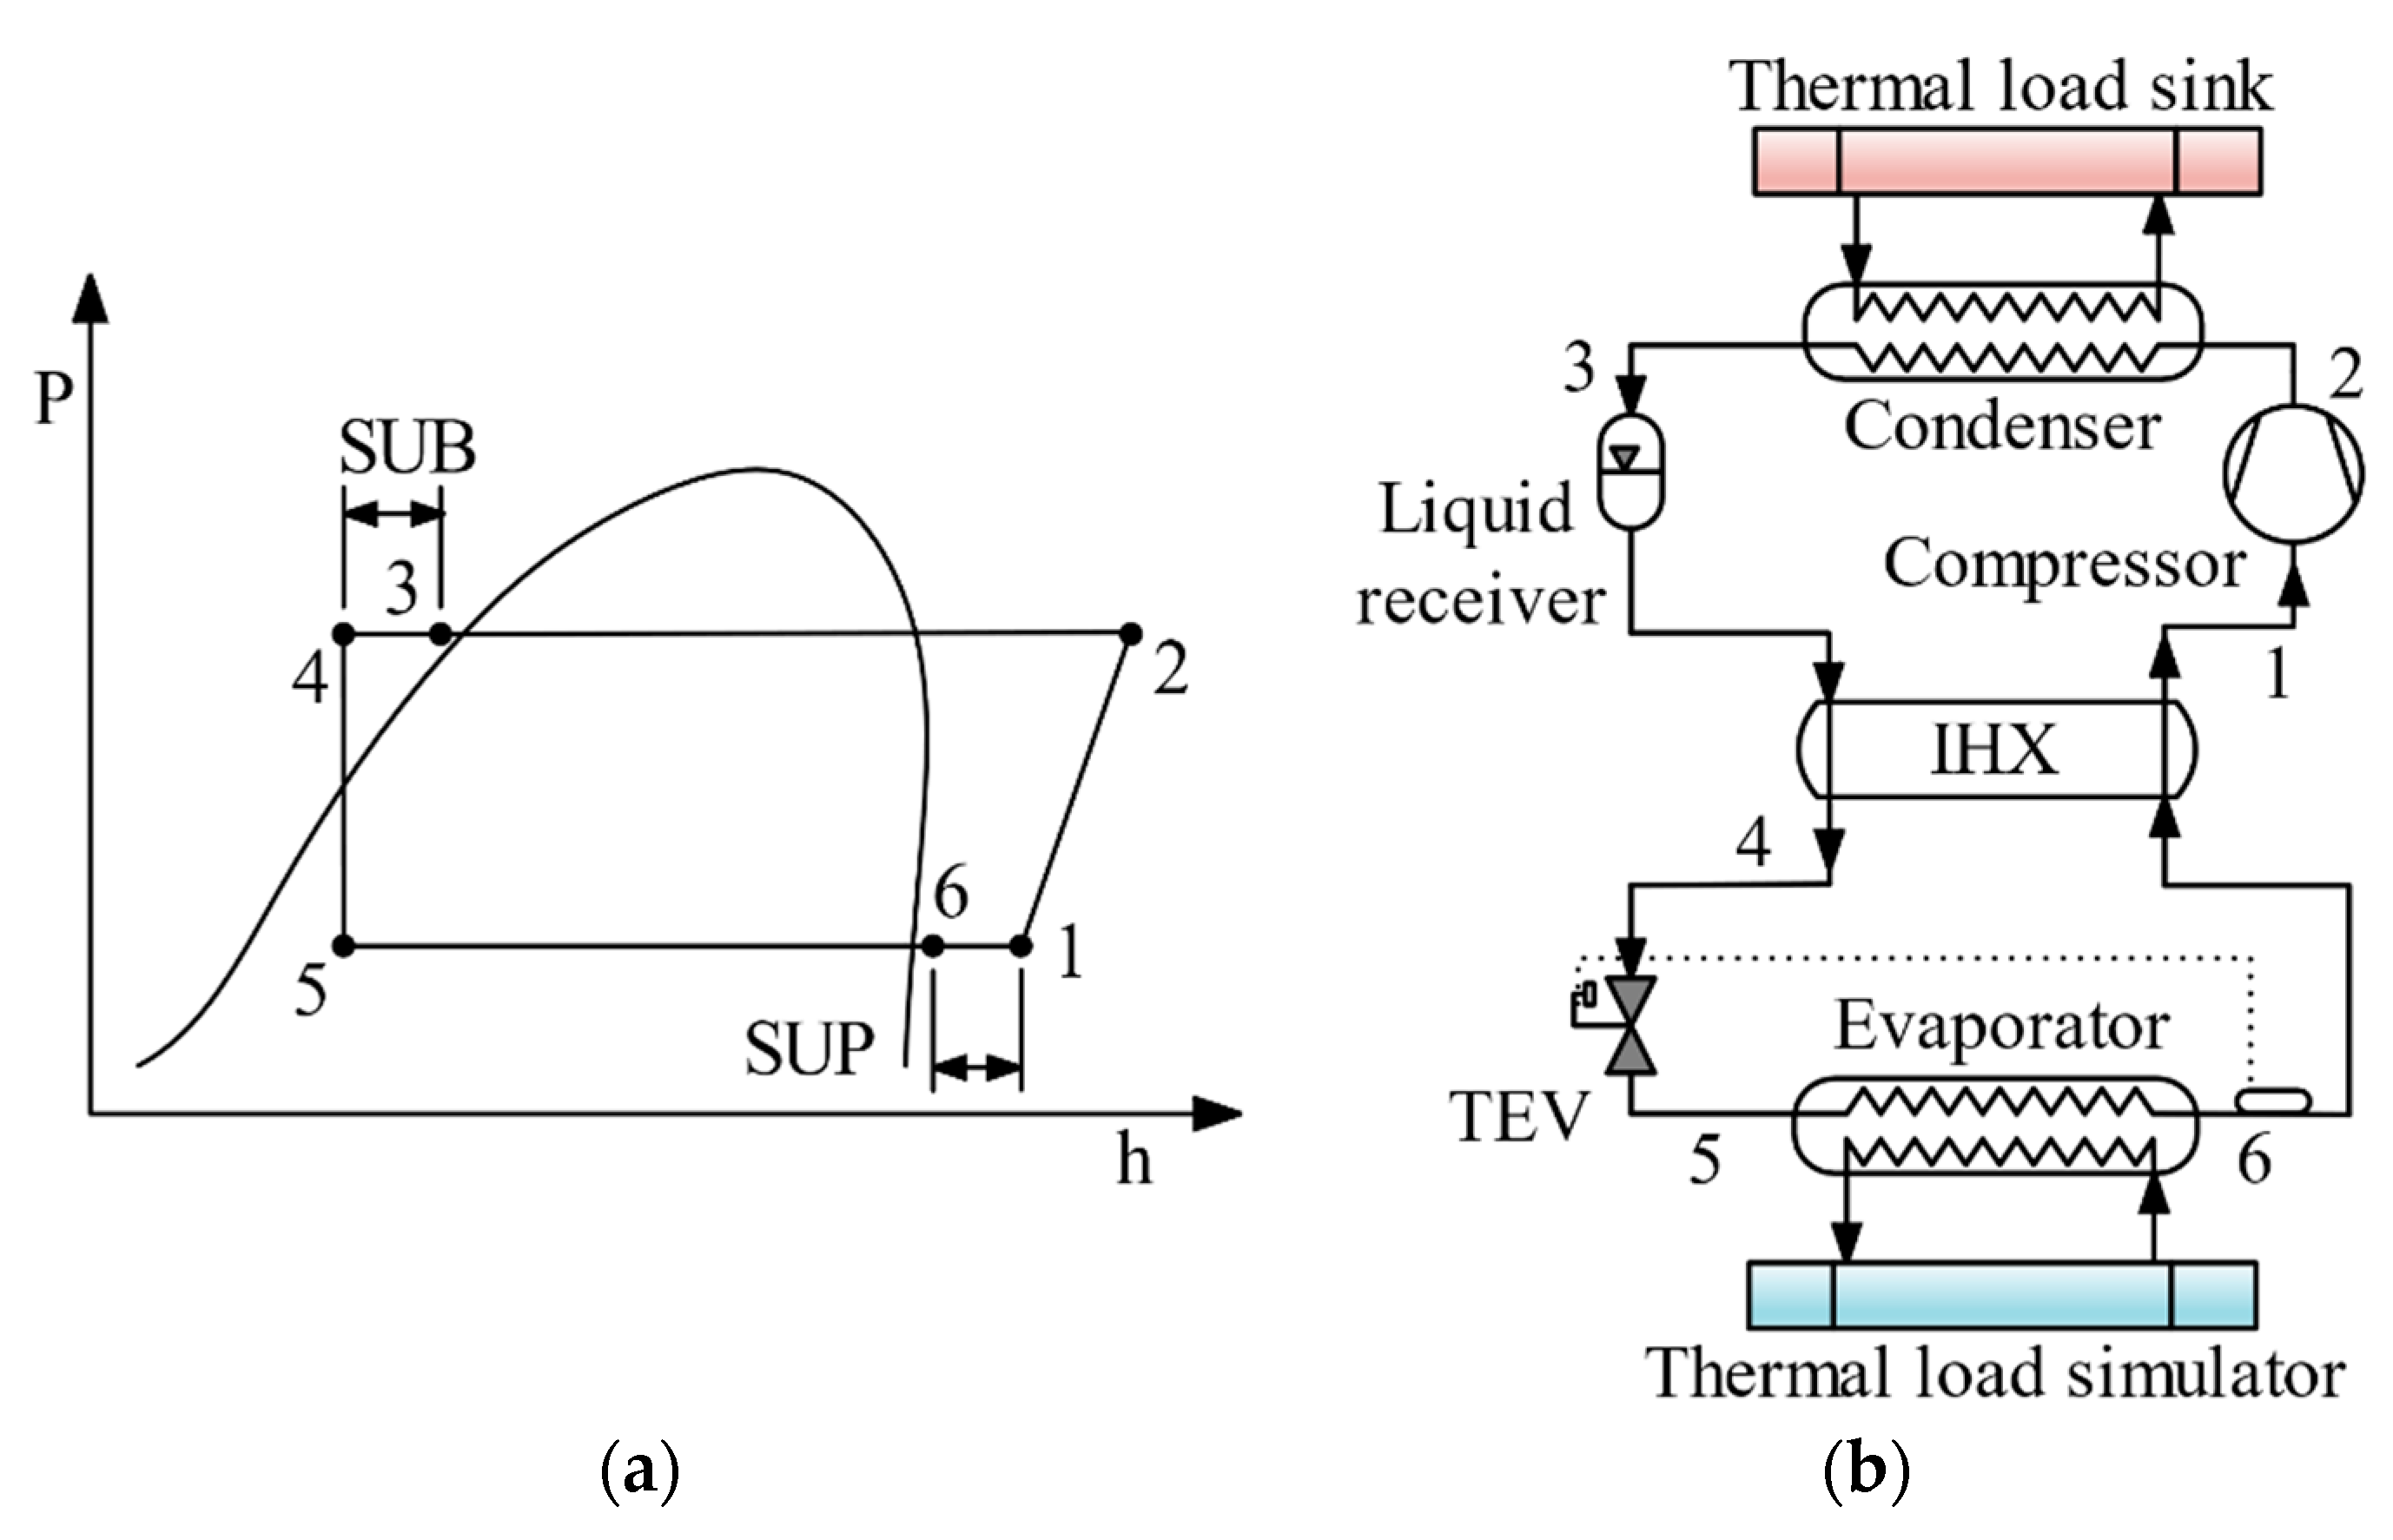
3.1. Basic Refrigeration Cycle (BRC)
3.2. Use of an IHX as Improvement on BRC
4. Integral Analysis
4.1. Energy Study
4.2. Exergy Study
4.3. Exergoeconomic Study
4.4. Life Cycle Climate Performance Study
5. Results
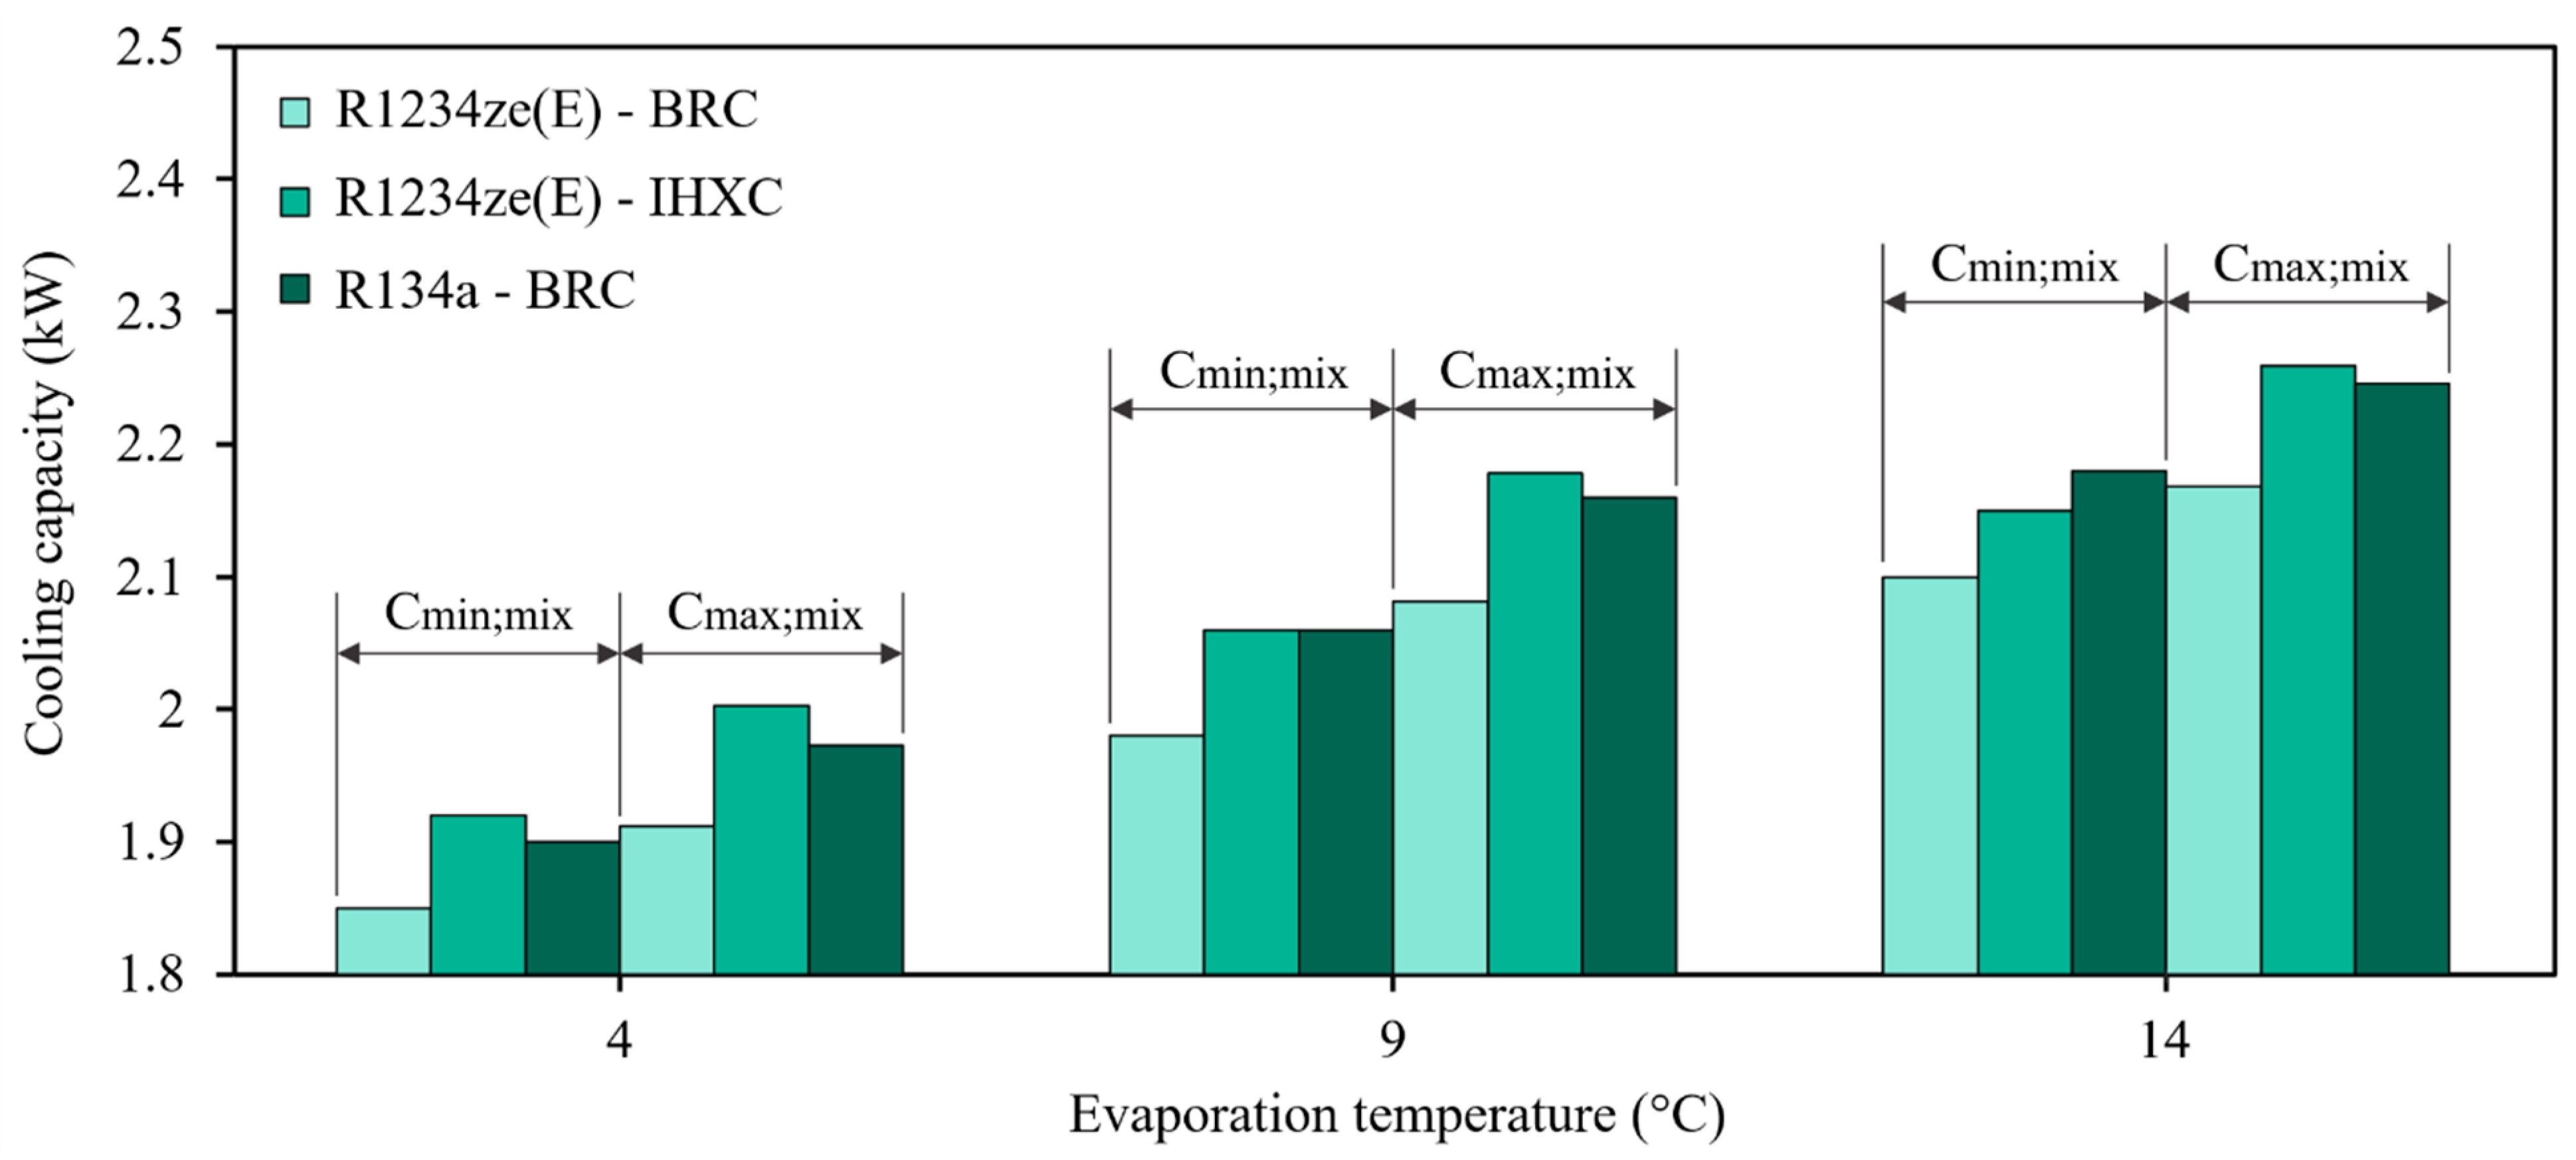
5.1. Cooling Capacity
5.2. Coefficient of Performance (COP)
5.3. Exergy Efficiency
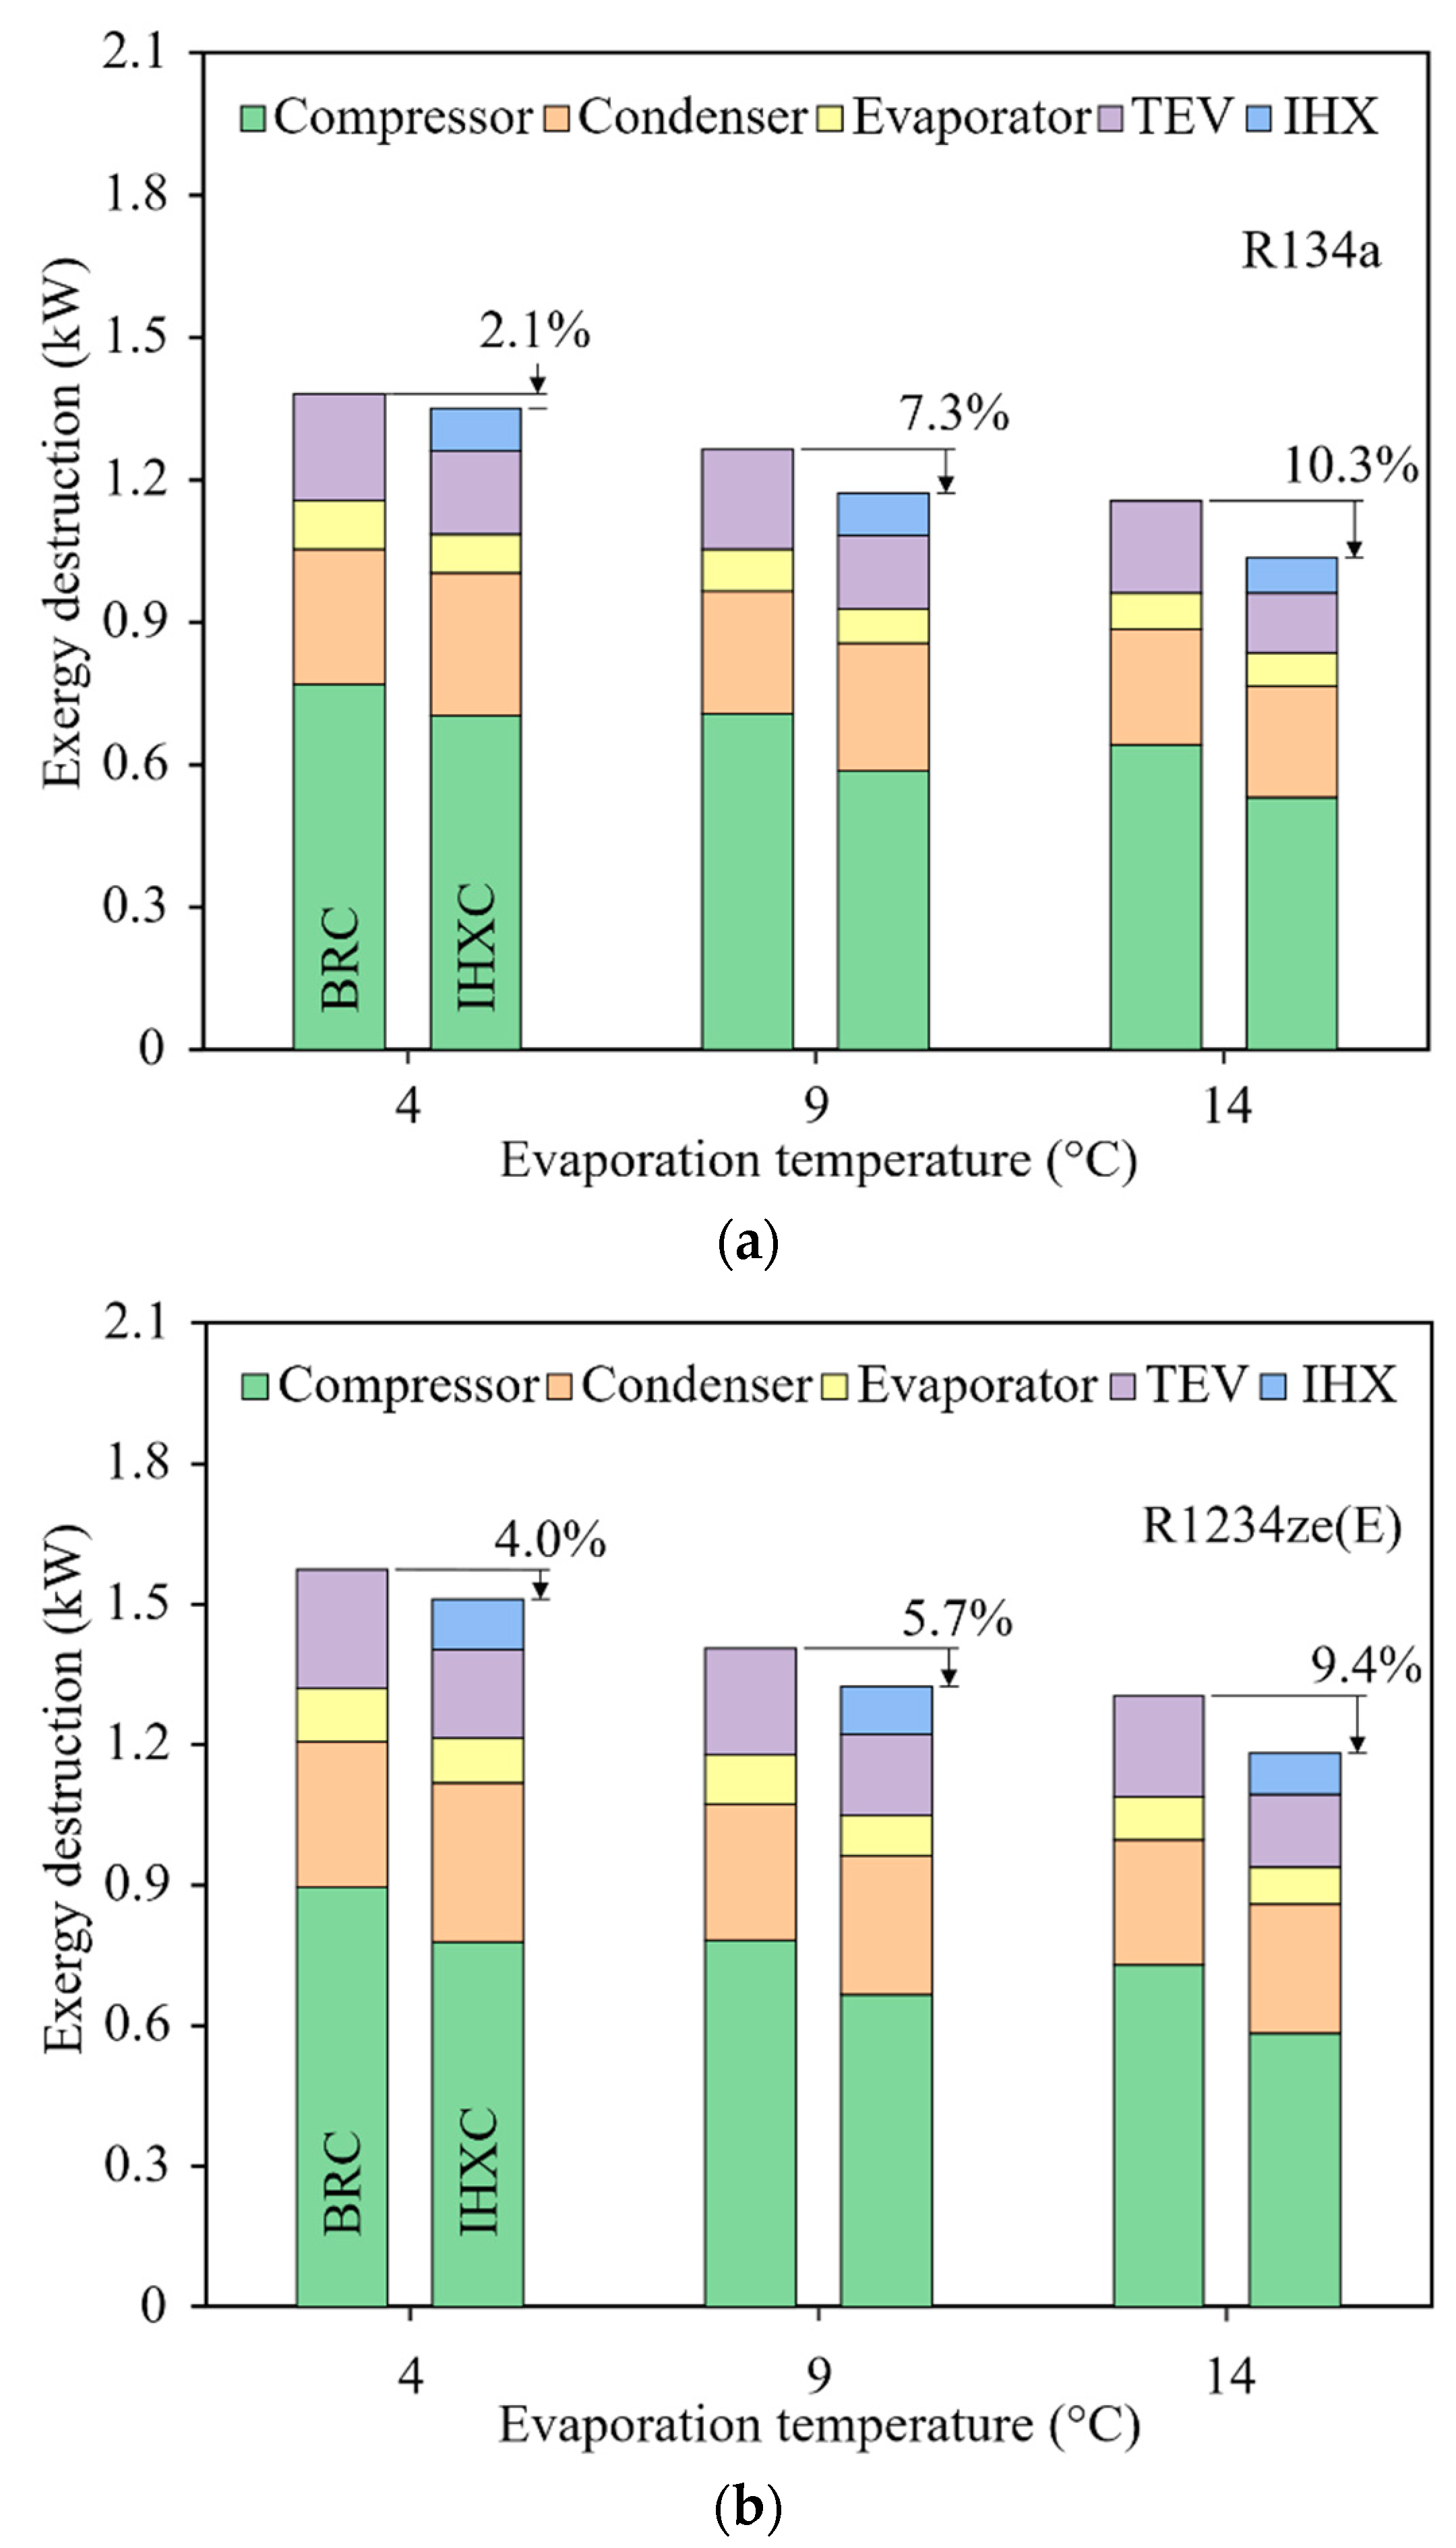
5.4. Destruction of Exergy
5.5. Operational Costs
5.6. LCCP Evaluation
6. Conclusions
Author Contributions
Funding
Institutional Review Board Statement
Informed Consent Statement
Data Availability Statement
Acknowledgments
Conflicts of Interest
Nomenclature
| A | amps |
| flow, L/s | |
| unit exergy cost, $/kJ | |
| exergy cost rate, $/h | |
| refrigerant charge, kg | |
| direct emissions, kgCO2eq | |
| exergy rate, kW | |
| power plant emission factor, kgCO2eq/kWh | |
| specific enthalpy, kJ/kg | |
| indirect emissions, kgCO2eq | |
| interest rate, % | |
| average lifetime of equipment, year | |
| mass flow rate, kg/s | |
| mass of unit or material, kg | |
| CO2e produced per kg of material, kgCO2eq/kg | |
| mass of recycled material, kg | |
| lifetime, year | |
| pressure, kPa | |
| heat transfer, kW | |
| specific entropy, kJ/kg-K | |
| annual operating time, h | |
| temperature, °C | |
| V | volts |
| power consumption, kW | |
| purchase cost associated with a component, $ | |
| capital cost rate, $/h | |
| Abbreviations | |
| GWP of atmospheric degradation product of the refrigerant: kgCO2eq/kg | |
| annual energy consumption, kWh | |
| annual leakage rate, % of refrigerant charge | |
| BRC | basic refrigeration cycle |
| COP | coefficient of performance |
| CRF | capital recovery factor |
| end of life refrigerant leakage, % of refrigerant charge | |
| GWP | global warming potential |
| HFC | hydrofluorocarbon |
| HFO | hydrofluoroolefin |
| IHXC | cycle with internal heat exchanger |
| IIR | institute of international refrigeration |
| LCCP | life cycle climate performance |
| ODP | ozone depletion potential |
| refrigerant disposal emissions per unit mass of refrigerant, kgCO2eq/kg | |
| refrigerant manufacturing emissions per unit mass of refrigerant, kgCO2eq/kg | |
| specific life cycle climate performance, kgCO2eq/kWh | |
| SUB | subcooling |
| SUP | superheating |
| total cost rate, $/h | |
| TEV | thermostatic expansion valve |
| Subscripts | |
| CI | capital investment |
| cold | cold stream |
| comp | compressor |
| cond | condenser |
| D | destruction |
| eq | equivalent |
| evap | evaporator |
| f | fuel |
| hot | hot stream |
| in | inlet |
| iso | isentropic |
| component | |
| max | maximum |
| min | minimum |
| mix | mixture |
| o | ambient |
| OM | operation and maintenance |
| out | outlet |
| p | product |
| PH | physical |
| ref | refrigerant |
| TOT | total |
| water | |
| wgm | water-glycol mixture |
| Greek symbols | |
| effectiveness | |
| efficiency | |
| operation and maintenance cost factor | |
| rational efficiency | |
References
- European Commission. Regulation (EU) No 517/2014 of the European Parliament and the Council of 16 April 2014 on fluorinated greenhouse gases and repealing Regulation (EC) No 842/2006. Off. J. Eur. Union 2014, L150, 195. [Google Scholar]
- UNEP (United Nations Environment Programme). Twenty-Eighth Meeting of the Parties to the Montreal Protocol on Substances that Deplete the Ozone Layer. Furth. Amend. Montr. Protoc. 2016, 1–72. Available online: https://ozone.unep.org/sites/default/files/2019-08/MOP-28-12E.pdf (accessed on 20 March 2022).
- Liu, W.; Meinel, D.; Wieland, C.; Spliethoff, H. Investigation of hydrofluoroolefins as potential working fluids in organic Rankine cycle for geothermal power generation. Energy 2014, 67, 106–116. [Google Scholar] [CrossRef]
- Mota-Babiloni, A.; Navarro-Esbrí, J.; Molés, F.; Cervera, Á.B.; Peris, B.; Verdú, G. A review of refrigerant R1234ze(E) recent investigations. Appl. Therm. Eng. 2016, 95, 211–222. [Google Scholar] [CrossRef]
- Mota-Babiloni, A.; Navarro-Esbrí, J.; Barragán, Á.; Molés, F.; Peris, B. Drop-in energy performance evaluation of R1234yf and R1234ze(E) in a vapor compression system as R134a replacements. Appl. Therm. Eng. 2014, 71, 259–265. [Google Scholar] [CrossRef] [Green Version]
- Sánchez, D.; Cabello, R.; Llopis, R.; Arauzo, I.; Catalán-Gil, J.; Torrella, E. Energy performance evaluation of R1234yf, R1234ze(E), R600a, R290 and R152a as low-GWP R134a alternatives. Int. J. Refrig. 2017, 74, 269–282. [Google Scholar] [CrossRef]
- Devecioglu, A.G.; Oruc, V. Improvement on the energy performance of a refrigeration system adapting a platetype heat exchanger and low-GWP refrigerants as alternatives to R134a. Energy 2018, 155, 105–116. [Google Scholar] [CrossRef]
- Colombo, L.P.M.; Lucchini, A.; Molinaroli, L. Experimental analysis of the use of R1234yf and R1234ze(E) as drop-in alternatives of R134a in a water-to-water heat pump. Int. J. Refrig. 2020, 115, 18–27. [Google Scholar] [CrossRef] [Green Version]
- Sethi, A.; Vera Becerra, E.; Yana Motta, S. Low GWP R134a replacements for small refrigeration (plug-in) applications. Int. J. Refrig. 2016, 66, 64–72. [Google Scholar] [CrossRef]
- Nawaz, K.; Shen, B.; Elatar, A.; Baxter, V.; Abdelaziz, O. R-1234yf and R-1234ze(E) as low-GWP refrigerants for residential heat pump water heaters. Int. J. Refrig. 2017, 82, 348–365. [Google Scholar] [CrossRef]
- Jribi, S.; Saha, B.B.; Koyama, S.; Chakraborty, A.; Ng, K.C. Study on activated carbon/HFO-1234ze(E) based adsorption cooling cycle. Appl. Therm. Eng. 2013, 50, 1570–1575. [Google Scholar] [CrossRef]
- Fukuda, S.; Kondou, C.; Takata, N.; Koyama, S. Low GWP refrigerants R1234ze(E) and R1234ze(Z) for high temperature heat pumps. Int. J. Refrig. 2013, 40, 161–173. [Google Scholar] [CrossRef]
- Le, V.L.; Feidt, M.; Kheiri, A.; Pelloux-Prayer, S. Performance optimization of low-temperature power generation by supercritical ORCs (organic Rankine cycles) using low GWP (global warming potential) working fluids. Energy 2014, 67, 513–526. [Google Scholar] [CrossRef]
- Abdalla, G. Performance Characteristics of Automotive Air Conditioning System with Refrigerant R134a and Its Alternatives. Int. J. Energy Power Eng. 2015, 4, 168–177. [Google Scholar]
- Kasaeian, A.B.; Daviran, S. Performance Analysis of Solar Combined Ejector-Vapor Compression Cycle Using Environmental Friendly Refrigerants. IIUM Eng. J. 2013, 14, 93–103. [Google Scholar] [CrossRef]
- Direk, M.; Soylu, E. The effect of internal heat exchanger using R1234ze(E) as an alternative refrigerant in a mobile air-conditioning system. J. Mech. Eng. 2018, 64, 114–120. [Google Scholar]
- Lemmon, E.W.; Bell, I.H.; Huber, M.L.; McLinden, M.O. NIST Standard Reference Database 23: Reference Fluid Thermodynamic and Transport Properties-REFPROP; Version 10.0; National Institute of Standards and Technolog: Gaithersburg, MA, USA, 2018.
- Bolaji, B.O. Theoretical assessment of new low global warming potential refrigerant mixtures as eco-friendly alternatives in domestic refrigeration systems. Sci. Afr. 2020, 10, e00632. [Google Scholar] [CrossRef]
- Zyczkowski, P.; Borowski, M.; Luczak, R.; Kuczera, Z.; Ptaszynski, B. Functional Equations for Calculating the Properties of Low-GWP R1234ze(E) Refrigerant. Energies 2020, 13, 3052. [Google Scholar] [CrossRef]
- Bobbo, S.; Di Nicola, G.; Zilio, C.; Brown, J.S.; Fedele, L. Low GWP halocarbon refrigerants: A review of thermophysical properties. Int. J. Refrig. 2018, 90, 181–201. [Google Scholar] [CrossRef]
- Liu, Y.; Wen, J.; Xu, P.; Khan, M.; Wang, S.; Tu, J. Numerical investigation on the condensation of R134a, R1234ze(E) and R450A in mini-channels. Int. J. Refrig. 2021, 130, 305–316. [Google Scholar] [CrossRef]
- Tsatsaronis, G. Definitions and nomenclature in exergy analysis and exergoeconomics. Energy 2007, 32, 249–253. [Google Scholar] [CrossRef]
- Bejan, A.; Tsatsaronis, G.; Moran, M.J. Thermal Design and Optimization; John Wiley and Sons: New York, NY, USA, 1996. [Google Scholar]
- Kotas, T.J. The Exergy Method of Thermal Power Plants Analysis; Krieger Publ. Co.: Malabar, FL, USA, 1995. [Google Scholar]
- Fazelpour, F.; Morosuk, T. Exergoeconomic analysis of carbon dioxide transcritical refrigeration machines. Int. J. Refrig. 2014, 38, 128–139. [Google Scholar] [CrossRef]
- Ahmadzadeh, A.; Reza Salimpour, M.; Sedaghat, A. Thermal and exergoeconomic analysis of a novel solar driven combined power and ejector refrigeration (CPER) system. Int. J. Refrig. 2017, 83, 143–156. [Google Scholar] [CrossRef]
- Mousavi, S.A.; Mehrpooya, M. A comprehensive exergy based evaluation on cascade absorption compression refrigeration system for low temperature applications—Exergy, exergoeconomic, and exergoenvironmental assessments. J. Clean. Prod. 2020, 246, 119005. [Google Scholar] [CrossRef]
- Makhnatch, P.; Khodabandeh, R. The role of environmental metrics (GWP, TEWI, LCCP) in the selection of low GWP refrigerant. Energy Procedia 2014, 61, 2460–2463. [Google Scholar] [CrossRef] [Green Version]
- IIR (International Institute of Refrigeration). Guideline for Life Cycle Climate Performance; International Institute of Refrigeration: Paris, France, 2016. [Google Scholar]
- Troch, S.; Lee, H.; Hwang, Y.; Radermacher, R. Harmonization of Life Cycle Climate Performance (LCCP) Methodology. Int. J. Refrig. Air Cond. Conf. 2016, 1724. Available online: http://docs.lib.purdue.edu/iracc/1724 (accessed on 20 March 2022).
- Lee, H.; Troch, S.; Hwang, Y.; Radermacher, R. LCCP evaluation on various vapor compression cycle options and low GWP refrigerants. Int. J. Refrig. 2016, 70, 128–137. [Google Scholar] [CrossRef]
- Choi, S.; Oh, J.; Hwang, Y.; Lee, H. Life cycle climate performance evaluation (LCCP) on cooling and heating systems in South Korea. Appl. Therm. Eng. 2017, 120, 88–98. [Google Scholar] [CrossRef]

| Property | R134a (HFC) | R1234ze(E) (HFO) |
|---|---|---|
| ASHRAE Safety Group | A1 | A2L |
| GWP | 1300 | <1 |
| ODP | 0 | 0 |
| Critical pressure (kPa) | 4059.3 | 3634.9 |
| Critical temperature (K) | 374.2 | 382.5 |
| Boiling point at 1 atm (K) | 247.1 | 253.9 |
| ASHRAE Flammability | No | Low |
| ASHRAE Toxicity | No | No |
| Molecular weight (kg/kmol) | 102 | 114 |
| Liquid density * (kg/m3) | 1294.8 | 1240.1 |
| Vapor density * (kg/m3) | 14.4 | 11.7 |
| Specific heat of liquid * (kJ/kgK) | 1.34 | 1.34 |
| Specific heat of vapor * (kJ/kgK) | 0.897 | 0.897 |
| Latent heat of vaporization (kJ/kg) | 198.6 | 184.2 |
| Liquid thermal conductivity * (kJ/kgK) | 92 × 10−3 | 83.1 × 10⁻³ |
| Vapor thermal conductivity * (kJ/kgK) | 11.5 × 10⁻³ | 11.6 × 10⁻³ |
| Liquid viscosity * (Pa/s) | 266.5 × 10⁻⁶ | 262.6 × 10⁻⁶ |
| Vapor viscosity * (Pa/s) | 10.7 × 10⁻⁶ | 10.7 × 10⁻⁶ |
| Sensor | Specification | Measuring Range | Sensitivity |
|---|---|---|---|
| Temperature | Thermocouple type K | −270 to 1372 °C | 3.6 mV/100 °C |
| Pressure | WIKA | 0 to 25 bar and 0 to 100 bar | ≤±0.3% |
| Coriolis flowmeter | SITRANS FC Coriolis | 4500 kg/h | ±0.2% with liquids and ± 0.4% with gases |
| Electromagnetic flowmeter (Secondary circuits) | ONICON | 0.1 to 0.6 kg/s | ±0.4% |
| Power measurement | FLUKE 1736 | 1000 V and 40 A | ±0.2% V and ±0.7% A |
| Component | Specification | Number of Plates | Dimensions (cm) (Length × Width × Height) |
|---|---|---|---|
| Evaporator | PHE B3-030-10 | 10 | 32.5 × 9.5 × 2.4 |
| Condenser | PHE B3-030-20 | 20 | 32.5 × 9.5 × 3.9 |
| IHX | PHE B3-030-10 | 10 | 32.5 × 9.5 × 2.4 |
| Component | Model | Energy Analysis | Exergy Analysis | Exergoeconomic Analysis |
|---|---|---|---|---|
| Compressor |  | |||
| Condenser | 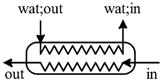 | |||
| IHX | 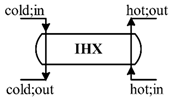 | |||
| TEV |  | |||
| Evaporator | 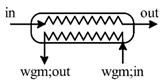 |
| Component | Capital Investment Cost ($) |
|---|---|
| Compressor | 751.11 |
| Condenser | 144.52 |
| TEV | 34.16 |
| Evaporator | 98.37 |
| IHX | 98.37 |
| Parameter | Description | Unit | Value |
|---|---|---|---|
| Interest rate 1 | % | 10 | |
| Lifetime | year | 15 | |
| Annual operating time | h | 4000 | |
| Operation and maintenance cost factor 2 | % | 1.06 |
| Item | R134a BRC | R1234ze(E) BRC | R1234ze(E) IHXC |
|---|---|---|---|
| Refrigerant charge, kg | 0.52 | 0.5 | 0.63 |
| Unit weight, kg | 115 | 115 | 120 |
| Annual refrigerant leakage 1,2, % | 4 | 4 | 4.4 |
| EOL leakage 1,2, % | 15 | 15 | 17 |
| Lifetime 1, year | 15 | 15 | 15 |
| Equipment manufacturing 3, kgCO2eq | 409 | 409 | 450 |
| Nominal cooling capacity, kW | 3.0 | 3.0 | 3.5 |
| Refrigerant | Configuration | Evaporation Temperature (°C) | Suction Pressure (kPa) | Discharge Pressure (kPa) | Superheating (K) |
|---|---|---|---|---|---|
| R1234ze(E) | BRC | 4 | 152.2 | 672.3 | 4.89 |
| 9 | 189.9 | 679.2 | 5.14 | ||
| 14 | 254.3 | 686.5 | 5.39 | ||
| R1234ze(E) | IHXC | 4 | 165.7 | 680.2 | 5.28 |
| 9 | 202.4 | 696.4 | 5.09 | ||
| 14 | 267.1 | 701.1 | 5.37 | ||
| R134a | BRC | 4 | 226.1 | 883.8 | 5.54 |
| 9 | 299.2 | 893.6 | 5.92 | ||
| 14 | 370.9 | 911.1 | 5.43 |
| Refrigerant | Configuration | Evaporation Temperature Operational (°C) | Compression Power (kW) | COP | (%) | TCR ($/h) | SLCCP (kgCO2eq/kWh) |
|---|---|---|---|---|---|---|---|
| R134a | BRC | 4 | 0.883 | 3.165 | 29.96 | 0.07667 | 63.64 |
| 9 | 0.835 | 3.544 | 34.65 | 0.06228 | 59.45 | ||
| 14 | 0.798 | 3.871 | 38.69 | 0.05403 | 57.46 | ||
| IHXC | 4 | 0.859 | 3.306 | 38.67 | 0.08784 | 62.35 | |
| 9 | 0.823 | 3.622 | 40.28 | 0.07145 | 59.72 | ||
| 14 | 0.779 | 4.049 | 42.99 | 0.07148 | 60.11 | ||
| R1234ze(E) | BRC | 4 | 0.909 | 3.064 | 28.17 | 0.08744 | 58.83 |
| 9 | 0.867 | 3.359 | 29.52 | 0.07406 | 59.87 | ||
| 14 | 0.841 | 3.726 | 33.80 | 0.06405 | 54.72 | ||
| IHXC | 4 | 0.872 | 3.155 | 32.95 | 0.09726 | 57.32 | |
| 9 | 0.824 | 3.493 | 35.19 | 0.09093 | 54.47 | ||
| 14 | 0.793 | 3.849 | 36.88 | 0.08053 | 50.7 |
Publisher’s Note: MDPI stays neutral with regard to jurisdictional claims in published maps and institutional affiliations. |
© 2022 by the authors. Licensee MDPI, Basel, Switzerland. This article is an open access article distributed under the terms and conditions of the Creative Commons Attribution (CC BY) license (https://creativecommons.org/licenses/by/4.0/).
Share and Cite
Méndez-Méndez, D.; Pérez-García, V.; Belman-Flores, J.M.; Riesco-Ávila, J.M.; Barroso-Maldonado, J.M. Internal Heat Exchanger Influence in Operational Cost and Environmental Impact of an Experimental Installation Using Low GWP Refrigerant for HVAC Conditions. Sustainability 2022, 14, 6008. https://doi.org/10.3390/su14106008
Méndez-Méndez D, Pérez-García V, Belman-Flores JM, Riesco-Ávila JM, Barroso-Maldonado JM. Internal Heat Exchanger Influence in Operational Cost and Environmental Impact of an Experimental Installation Using Low GWP Refrigerant for HVAC Conditions. Sustainability. 2022; 14(10):6008. https://doi.org/10.3390/su14106008
Chicago/Turabian StyleMéndez-Méndez, Dario, Vicente Pérez-García, Juan M. Belman-Flores, José M. Riesco-Ávila, and Juan M. Barroso-Maldonado. 2022. "Internal Heat Exchanger Influence in Operational Cost and Environmental Impact of an Experimental Installation Using Low GWP Refrigerant for HVAC Conditions" Sustainability 14, no. 10: 6008. https://doi.org/10.3390/su14106008
APA StyleMéndez-Méndez, D., Pérez-García, V., Belman-Flores, J. M., Riesco-Ávila, J. M., & Barroso-Maldonado, J. M. (2022). Internal Heat Exchanger Influence in Operational Cost and Environmental Impact of an Experimental Installation Using Low GWP Refrigerant for HVAC Conditions. Sustainability, 14(10), 6008. https://doi.org/10.3390/su14106008