Article

Policy Evaluation of Drama-Related Intangible Cultural Heritage Tourism for Boosting Green Industry: An Empirical Analysis Based on Quasi-Natural Experiment

1
College of Media Convergence, Chongqing College of International Business and Economics, Chongqing 401519, China
2
School of Communication Sciences and Arts, Chengdu University of Technology, Chengdu 610051, China
3
School of Economics, Shandong University of Technology, Zibo 255022, China
*
Authors to whom correspondence should be addressed.
Sustainability 2022, 14(9), 5380; https://doi.org/10.3390/su14095380
Submission received: 27 March 2022 / Revised: 17 April 2022 / Accepted: 27 April 2022 / Published: 29 April 2022

Abstract

:
Drama-related intangible cultural heritage is rich in connotations, and the development of tourism value of drama-related intangible cultural heritage can promote the service industry and boost the development of green economy. Using panel data of 31 provinces, municipalities directly under the central government and autonomous regions in China from 2000 to 2019, this paper empirically analyzed the global picture of the effectiveness of sustainable policies for drama-related intangible cultural heritage tourism through the double difference method of quasi-natural experiment, then analyzed the different performance of policies among regions with different geographical characteristics, and finally analyzed the patterns of four batches of policies in time sequentially in multiple periods. The results found that sustainable policies for drama-related intangible cultural heritage tourism can promote the development of green service industries. These policies can promote the service industry in areas with a relatively backward economy, a single industrial sector, and a low degree of openness, but with outstanding ethnic characteristics, and can effectively promote rural revitalization. Besides, these policies first promote the growth rate of the green service industry, and the effectiveness of the policies has a certain time lag. As the effect of the policies accumulates, the growth rate of the green service industry slows down, the scale benefits appear, and the proportion of the industry is obviously increased.

1. Introduction

1.1. Background

As China has achieved total poverty eradication, there is a growing demand for higher levels of material culture for the entire population. Constrained by the macro goal of ecological civilization construction, the combination of intangible cultural heritage and tourism will effectively improve the economic structure and make it cleaner, greener, and more sustainable [1,2]. In China, there is a very large number of ethnic minorities and the settlements of these minorities are also often important industrial areas [3]. As we know, regions like Shaanxi and Sichuan, for example, used to rely on industrial production to drive GDP [3], but they ignored the benefits brought by their ethnic culture [4]. In fact, efforts should be made to develop tourism based on the characteristics of the local culture and folk customs. This will not only bring unexpected economic benefits, but also make these areas less over-industrialized [5].
In fact, it is not as easy as we expected to develop tourism in some regions of China. First of all, the natural conditions such as climate and topography of some regions—such as the northwest—are not very promising [6], and these regions do not have the same advantages as other regions of China—the coastal areas-have superior natural resource endowments and famous landscapes [7]. Secondly, the infrastructure in some regions is not very well developed, and train stations, airports, hotels, and restaurants are not as convenient as in economically developed regions, which can make some people who prefer a comfortable tourism environment not choose to visit these regions [8]. Therefore, for a long time, the development of tourism in some areas of China, especially in the central and western regions, has been somewhat unsatisfactory. However, these regions have been historically inhabited by many nomadic or ethnic minorities, and there is a large amount of intangible cultural heritage with ethnic characteristics in these places, such as some folk dances, folk music, and folk customs [9]. It is worth considering whether this will become an important new factor to drive the development of China’s tourism industry, and what role a series of policies on the protection and development of intangible cultural heritage issued by China have played in promoting the growth of green industries by tourism.
The article empirically evaluates the effectiveness of the policy of drama-related non-heritage cultural tourism to promote the development of green industries through the DID method, which is divided into the following three steps: (1) In the benchmark regression, we set variables from two dimensions of domestic and foreign tourists’ trips and consumption on the basis of controlling individual differences, and differentially divide the observed objects into a control group and an experimental group, with a one-period lag of the policy enactment time as the time point for double difference. Before regression, a parallel trend test is first conducted to demonstrate the existence of significant policy shocks. Controlling for the effects of other variables, the drama-related non-heritage cultural tourism policy was able to promote the scale and industry share of green service industries. (2) In the heterogeneity test, the observations are divided into three groups of east, central, and west based on the geographical division of China, in order to analyze the spatial patterns of policies on different geographical characteristics. It is found that the policies can promote the development of the green service industry in regions with a relatively low economic level, more homogeneous industrial sectors, and less openness; however, they show inhibitory effects on economically developed regions. (3) In order to explore the superposition effect of policies and the pattern of policies in time, the robustness test is carried out by differencing the DID of multiple periods. It is found that the policy first promotes the growth rate of the green service industry, and then promotes the scale, and the growth rate slows down when the scale and industry share can be increased.

1.2. Tourism Development for Regional Sustainability

In the past, the development of some regions in China has been goal-oriented and eager for quick success and instant benefit [10]. This has led to an imbalance in the industrial structure, depletion of resources, and environmental pollution in some cities where industry is the main production sector, especially in resource-based cities [3]. Since the introduction of sustainable promotion policies such as “civilized cities”, “sanitary cities”, and “garden cities” in China, many of these cities have developed tourism and the upgrading of industrial structure and the sustainable development of regional economy [11,12]. Gradually, the newly acquired economic growth of these cities has become greener. The development of tourism can lead to the development of local transportation, retail, hospitality, and other service industries [13]. The intangible cultural heritage makes tourism prosperous, which in turn puts forward higher requirements for local infrastructure construction [14]. This will not only create new employment opportunities and promote the growth of GDP, but if green transportation, green buildings, and other environmental protection facilities are placed in a privilege position, perhaps such GDP growth will be greener [15]. Although intangible cultural heritage is not everywhere, there are many intangible cultural heritages distributing in rural areas. Intangible cultural heritage tourism may be one of many ways to revitalize rural areas, but it is relatively green comparing with developing industrial production in these areas [16,17].

1.3. Integration of Intangible Cultural Heritage with Tourism

There is a great need to integrate tourism with intangible cultural heritage. First of all, intangible cultural heritage is rich in cultural values and spiritual power, which can precisely meet the current demands of Chinese people for a higher spiritual and cultural level [18,19]. Tourism projects that incorporate intangible cultural heritage are often accompanied by a certain ethnic color, which will attract those who are willing to pursue mystery and history [20]. Therefore, intangible cultural heritage is a more commercially valuable tourism resource to be developed and it has a great market potential. On the other hand, nowadays, intangible cultural heritage in China is all financially allocated by the government in helping them to pass on. Obviously, it is not enough to rely on official funds [21]. We need to let intangible cultural heritage create the funds needed for its own development [22]. Whether from the perspective of the dissemination of intangible cultural heritage or from the perspective of self-satisfaction of intangible cultural heritage protection funds, the combination with tourism may be a good choice [9,19,23,24].

1.4. Intangible Cultural Heritage of Chinese Drama

From the provincial level to the national level, and then to UNESCO, the intangible cultural heritage published by these levels probably includes traditional art, traditional dance, traditional music, traditional medicine, and traditional folk customs [25]. Among the intangible cultural heritage, there are few categories related to performance and music, and opera is precisely an art form that combines music and performance, which includes many intangible cultural heritage categories and is an extremely important form included in intangible cultural heritage [26]. In general, the intangible cultural heritage of drama occupies a significant position in the whole intangible cultural heritage system [24,27,28], which is worth studying.

1.5. Innovations and Conributions

To sum up, the existing literature has conducted a lot of theoretical analyses on tourism promoting green economy development, the necessity and mechanism of combining ICH and tourism, and the feasibility of marketing ICH tourism, but little literature has evaluated the effectiveness of development and protection policies for ICH tourism, especially the impact on green service industries. Insufficient development and over-protection cannot only promote the development of the green service industry but will also make the market of ICH projects less dynamic and overly dependent on finance, and only with reasonably appropriate policies can the green industry develop healthily. Therefore, this paper quantitatively evaluates the policy, and the findings of the article not only help the identification of the effectiveness of the policy of non-heritage cultural tourism, but also explore the road for the articulation between ecological civilization construction and rural revitalization.

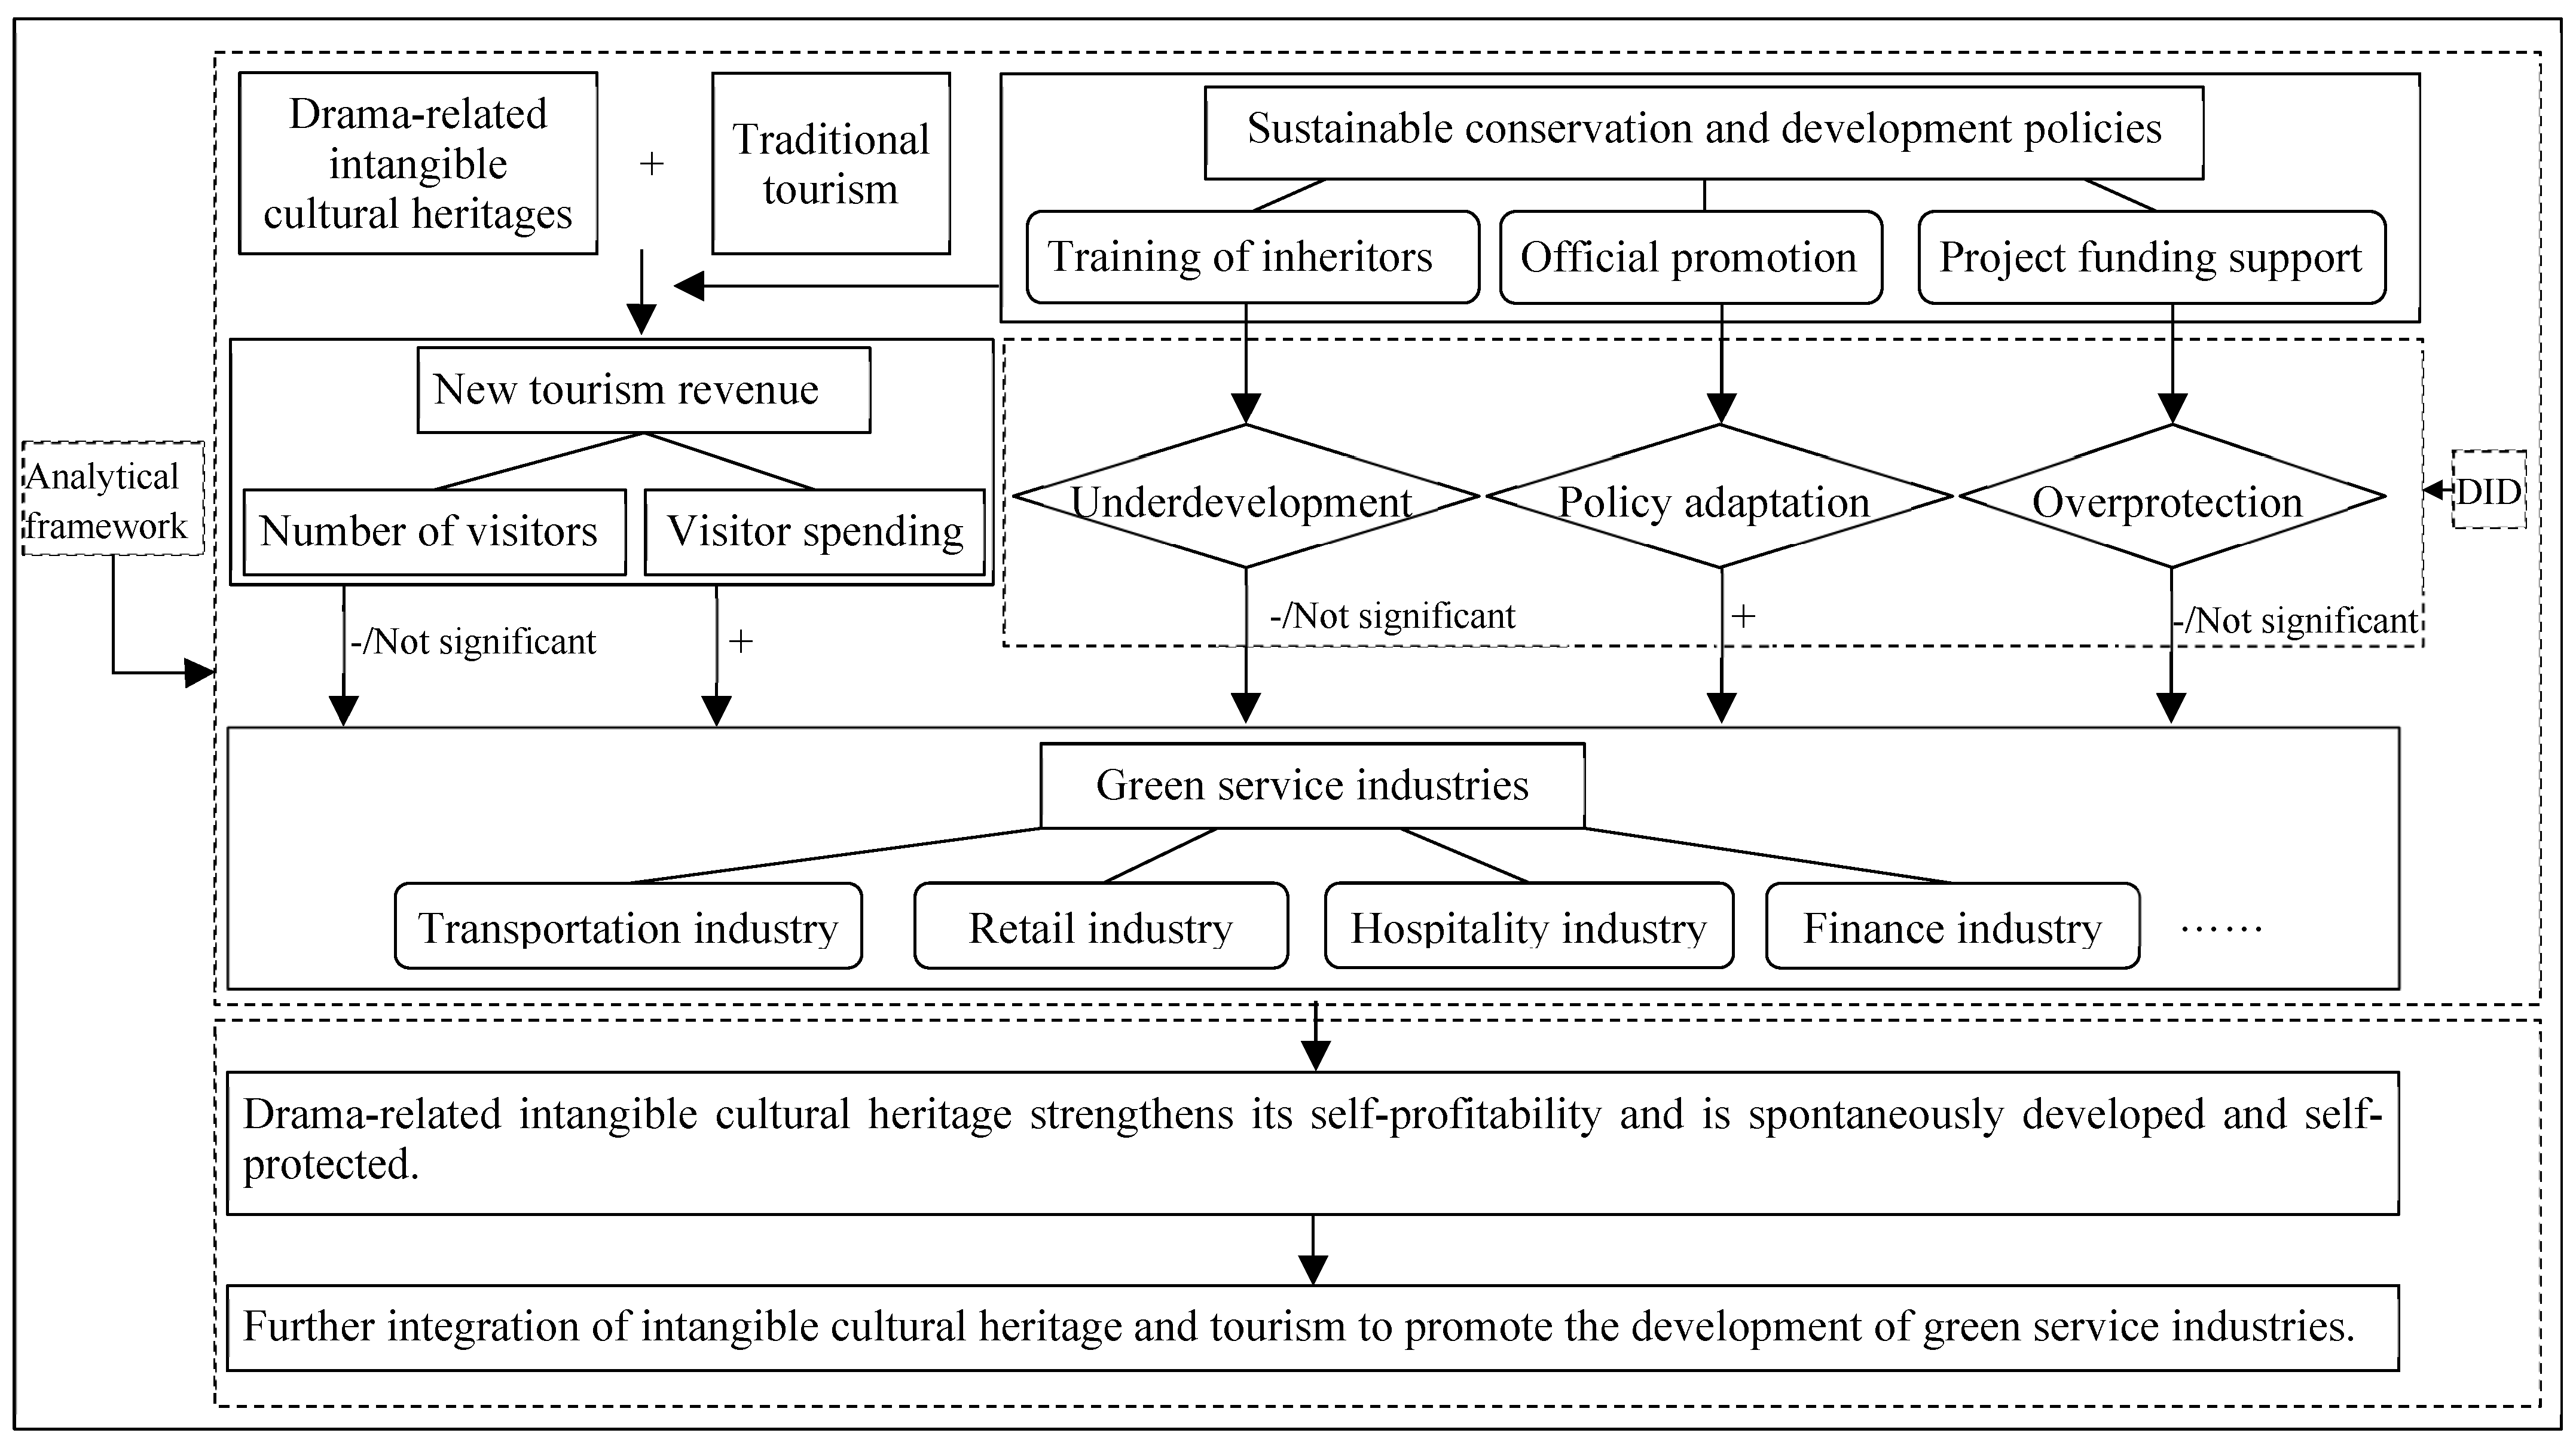
2. Theoretical Framework

The combination of drama-related intangible cultural heritage with tourism has a strong development value and can contribute to the income growth of some green service industries [17]. However, the role of some sustainable protection and development policies for intangible cultural heritage in the past in this combination is uncertain [16]. Sustainable policies for intangible cultural heritage items include both conservation and openness [16]. These policies make intangible cultural heritage sustainable through the training of inheritors of drama-related intangible cultural heritage projects, official government promotion, and financial support for the conservation and development process of these drama-related items [29,30]. If the right policies are in place, then “ICH + Tourism” can be promoted for the development of green service industries [19]. However, if the intangible cultural heritage is underdeveloped or over-protected, it will not play a role or even play a negative role [31,32].
The development of tourism will drive the development of other green sectors [33]. First, it will boost the development of the transportation industry [34,35]. Secondly, cultural products that incorporate the ethnicity, regional characteristics, and culture of intangible cultural heritage and other retail products necessary in the tourist life will be promoted, which then drives the retail industry [36]. Most of the tourists travel on multi-day trips, so the hotel industry will also grow with tourism [37]. In addition, there are more industries that will benefit, and these service industries are different from other industries in that they are service-oriented, pollution-free, and green [38]. Their development is in line with the goal of building an ecological civilization in China.
However, the service sector driven by tourism often does not generate as much GDP as industrial production and does not provide as many jobs as the industrial sector [39]. Therefore, it is worth discussing how to keep the green service sector at a reasonable share, and it is necessary to select the indicator of weight to be included in the empirical study. Absolutely, excessive tourism development can produce irreversible damage to intangible cultural heritages, and travel by airplane, car, and other means of transportation can produce carbon dioxide [40]. Therefore, the government and self-regulatory organizations should guide the development of ICH tourism with environmental regulations to make it greener and more sustainable.
The benign combination with tourism will lead to the enhancement of the self-profitability of drama-related intangible cultural heritage projects [1]. Thereafter, they will have more funds and they will develop and protect themselves spontaneously [41]. This is called “hematopoietic function”. The further development of intangible cultural heritage will stimulate a new round of its integration with tourism [42], thus promoting the green service sector even more. Obviously, they will enter a virtuous circle, which is what we expect. Figure 1 shows the visualization of the Theoretical Framework:

3. Materials and Research Design

3.1. Data Sources and Sampling Process

Macroeconomic data of provinces, municipalities, and autonomous regions are collected from China Statistical Yearbook. Tourism data are partly derived from the China Statistical Yearbook and partly from the statistical yearbooks of each province, municipality, and autonomous region. Intangible cultural heritage data are artificially based on the portal website of the Chinese Ministry of Culture and have always been counted one by one. The document on the sustainability of China’s national intangible cultural heritage of drama was officially released for the first time in 2006, and the last time it was released was in 2021. In addition, macroeconomic data and tourism data for China’s provinces, municipalities, and autonomous regions are currently only available until 2019. Therefore, in order to maintain consistency across variables over time, we collected data from 2000 to 2019. In other words, the time span is 2000–2019. For the selection of the observation sample, we chose 31 provinces, municipalities, and autonomous regions in mainland China (except Hong Kong, Macau, and Taiwan). In addition, missing data were excluded, i.e., missing data were not included in the regressions [43,44], because missing data were randomized, and it would not be reasonable to use the interpolation method of difference.

3.2. Election of Variables

3.2.1. Variables of the Green Economy

According to the analysis of the theoretical framework, the preservation and development of intangible cultural heritage of drama, especially in combination with tourism, can lead to further development of tourism [1,16,24]. The development of tourism will drive the development of transportation, catering and hotel industries, retail, cultural, and entertainment industries, which, although causing some carbon emissions to be produced, are relatively low in other pollutants compared to industrial production, which is relatively environmentally friendly and relatively sustainable [17,40,45]. At the same time, it happens that most of these industries belong to the tertiary sector. Therefore, we chose data from the tertiary sector as a variable to characterize the green economy.
The impact of the development of tourism on the green economy is reflected in several aspects, so we selected three dimensions of variables (as shown in Table 1). Regarding the scale dimension of the green economy, we selected the value added of the tertiary sector. Meanwhile, we used the growth rate of the tertiary sector to characterize the growth rate of the green economy. In addition, we used the share of the tertiary sector in the national economy of the whole region to characterize the status of the green economy in the region [46].

3.2.2. Variables of Tourism Development

Tourism, when combined with intangible cultural heritage of drama, shows very distinct regional and ethnic characteristics [12]. In addition, Chinese residents have a different preference for traditional Chinese drama-related culture than residents of other countries [47]. Therefore, the combination with drama-related intangible cultural heritage will have a different impact on these green package industries when combined with domestic tourism and tourism from international tourists [48]. As shown in Table 2, we selected tourism from domestic tourists and tourism from overseas tourists, respectively. In addition to this, we elected variables from two dimensions: number of tourists and tourism consumption.

3.2.3. Variables of Sustainable Policies for Intangible Cultural Heritage in Drama Category

In order to evaluate the effect of intangible cultural heritage of drama, this article uses the difference in difference method. First, we differentiate the observations. By manually counting the number of intangible cultural heritage in each region in the drama category, we sum the surviving intangible cultural heritage in each region up to the latest policy period separately, and the regions that are lower than the average of more than one observation are set as the control group, and the regions that are higher than the average are set as the treatment group. The control group takes the value of 0 and the treatment group takes the value of 1 (Equation (1)). Then, we differentially score the policy before and after its implementation in time. Considering the time lag of the policy’s effect [20], we set the year after the promulgation of the sustainable policy for China’s national drama-related intangible cultural heritage and the years after that to 1, and the year when the policy was promulgated and before to 0 (Equation (2)). In total, two sets of difference variables were set (Table 3).
P G i , t { 0 ,           x = 1 n A m o i , x x = 1 n A m o i , x ¯ 1 ,           x = 1 n A m o i , x > x = 1 n A m o i , x ¯
P T i , t { 0 ,           t y e a r 1 ,           t > y e a r
In Equations (1) and (2), “i” denotes region and “t” denotes time. PG denotes the difference variable between the treatment and control groups, and PT denotes the difference variable between before and after the policy was issued. “n” denotes the latest batch of national sustainable policies for intangible cultural heritage of drama in China issued up to year t. year denotes the year of issuance of a particular policy to be analyzed. Amo denotes the number of intangible cultural heritage announced in each batch of policies.

3.3. Measurement of Statistical Models

The given statistical model was used to approach the objectives of the study:
S G E i , t = α 0 + α 1 I S i , t + α 2 I V i , t + α 3 O S i , t + α 4 O V i , t + α 5 P G i , t + α 6 P T i , t + α 7 P G × P T i , t + α 7 X i , t + μ i , t + ε i , t
G G E i , t = α 0 + α 1 I S i , t + α 2 I V i , t + α 3 O S i , t + α 4 O V i , t + α 5 P G i , t + α 6 P T i , t + α 7 P G × P T i , t + α 7 X i , t + μ i , t + ε i , t
R G E i , t = α 0 + α 1 I S i , t + α 2 I V i , t + α 3 O S i , t + α 4 O V i , t + α 5 P G i , t + α 6 P T i , t + α 7 P G × P T i , t + α 7 X i , t + μ i , t + ε i , t
where “i” and “t” indicate region and year, respectively. More, IS denotes the total domestic tourism consumption of each region, IV denotes the number of tourists received within the country, OS denotes the total tourism consumption of foreign residents within the country, OV denotes the number of foreign tourists received, and X denotes the control variable. μ is the individual effect, and ε is the random error term, which is normally distributed.

4. Results and Discussion

4.1. Summary of Basic Statistics

The results in Table 4 show that the disparity between the scale of the tertiary sector and the share of the tertiary sector in the national economy is more obvious in each province, municipality, and autonomous regions of China. The minimum output value is 53.93, but the largest output value is 59,773.38. Similarly, the smallest share is 28.6, but the maximum can reach 83.5. This indicates that there are regions in China where the service sector has become the dominant industry, but there are still regions where the development of the service sector is very backward [49]. In addition to this, the differences in the number of tourists and tourist spending in tourism between regions are also very evident, which verifies the uneven development of tourism in China between provinces in the introduction part.
Through our analysis, we concluded that larger values should be logarithmized to smooth the data before regression. Moreover, a top and bottom 1% tailing process should be applied to all continuous variables, i.e., beyond the 1% and 99% quartiles, to make sense of the anomalous data [50]. Most notably, a cross term (PG × PT) is generated to determine the validity of the policy by looking primarily at the significance of the coefficient of that variable.

4.2. Country-Level Regression Results

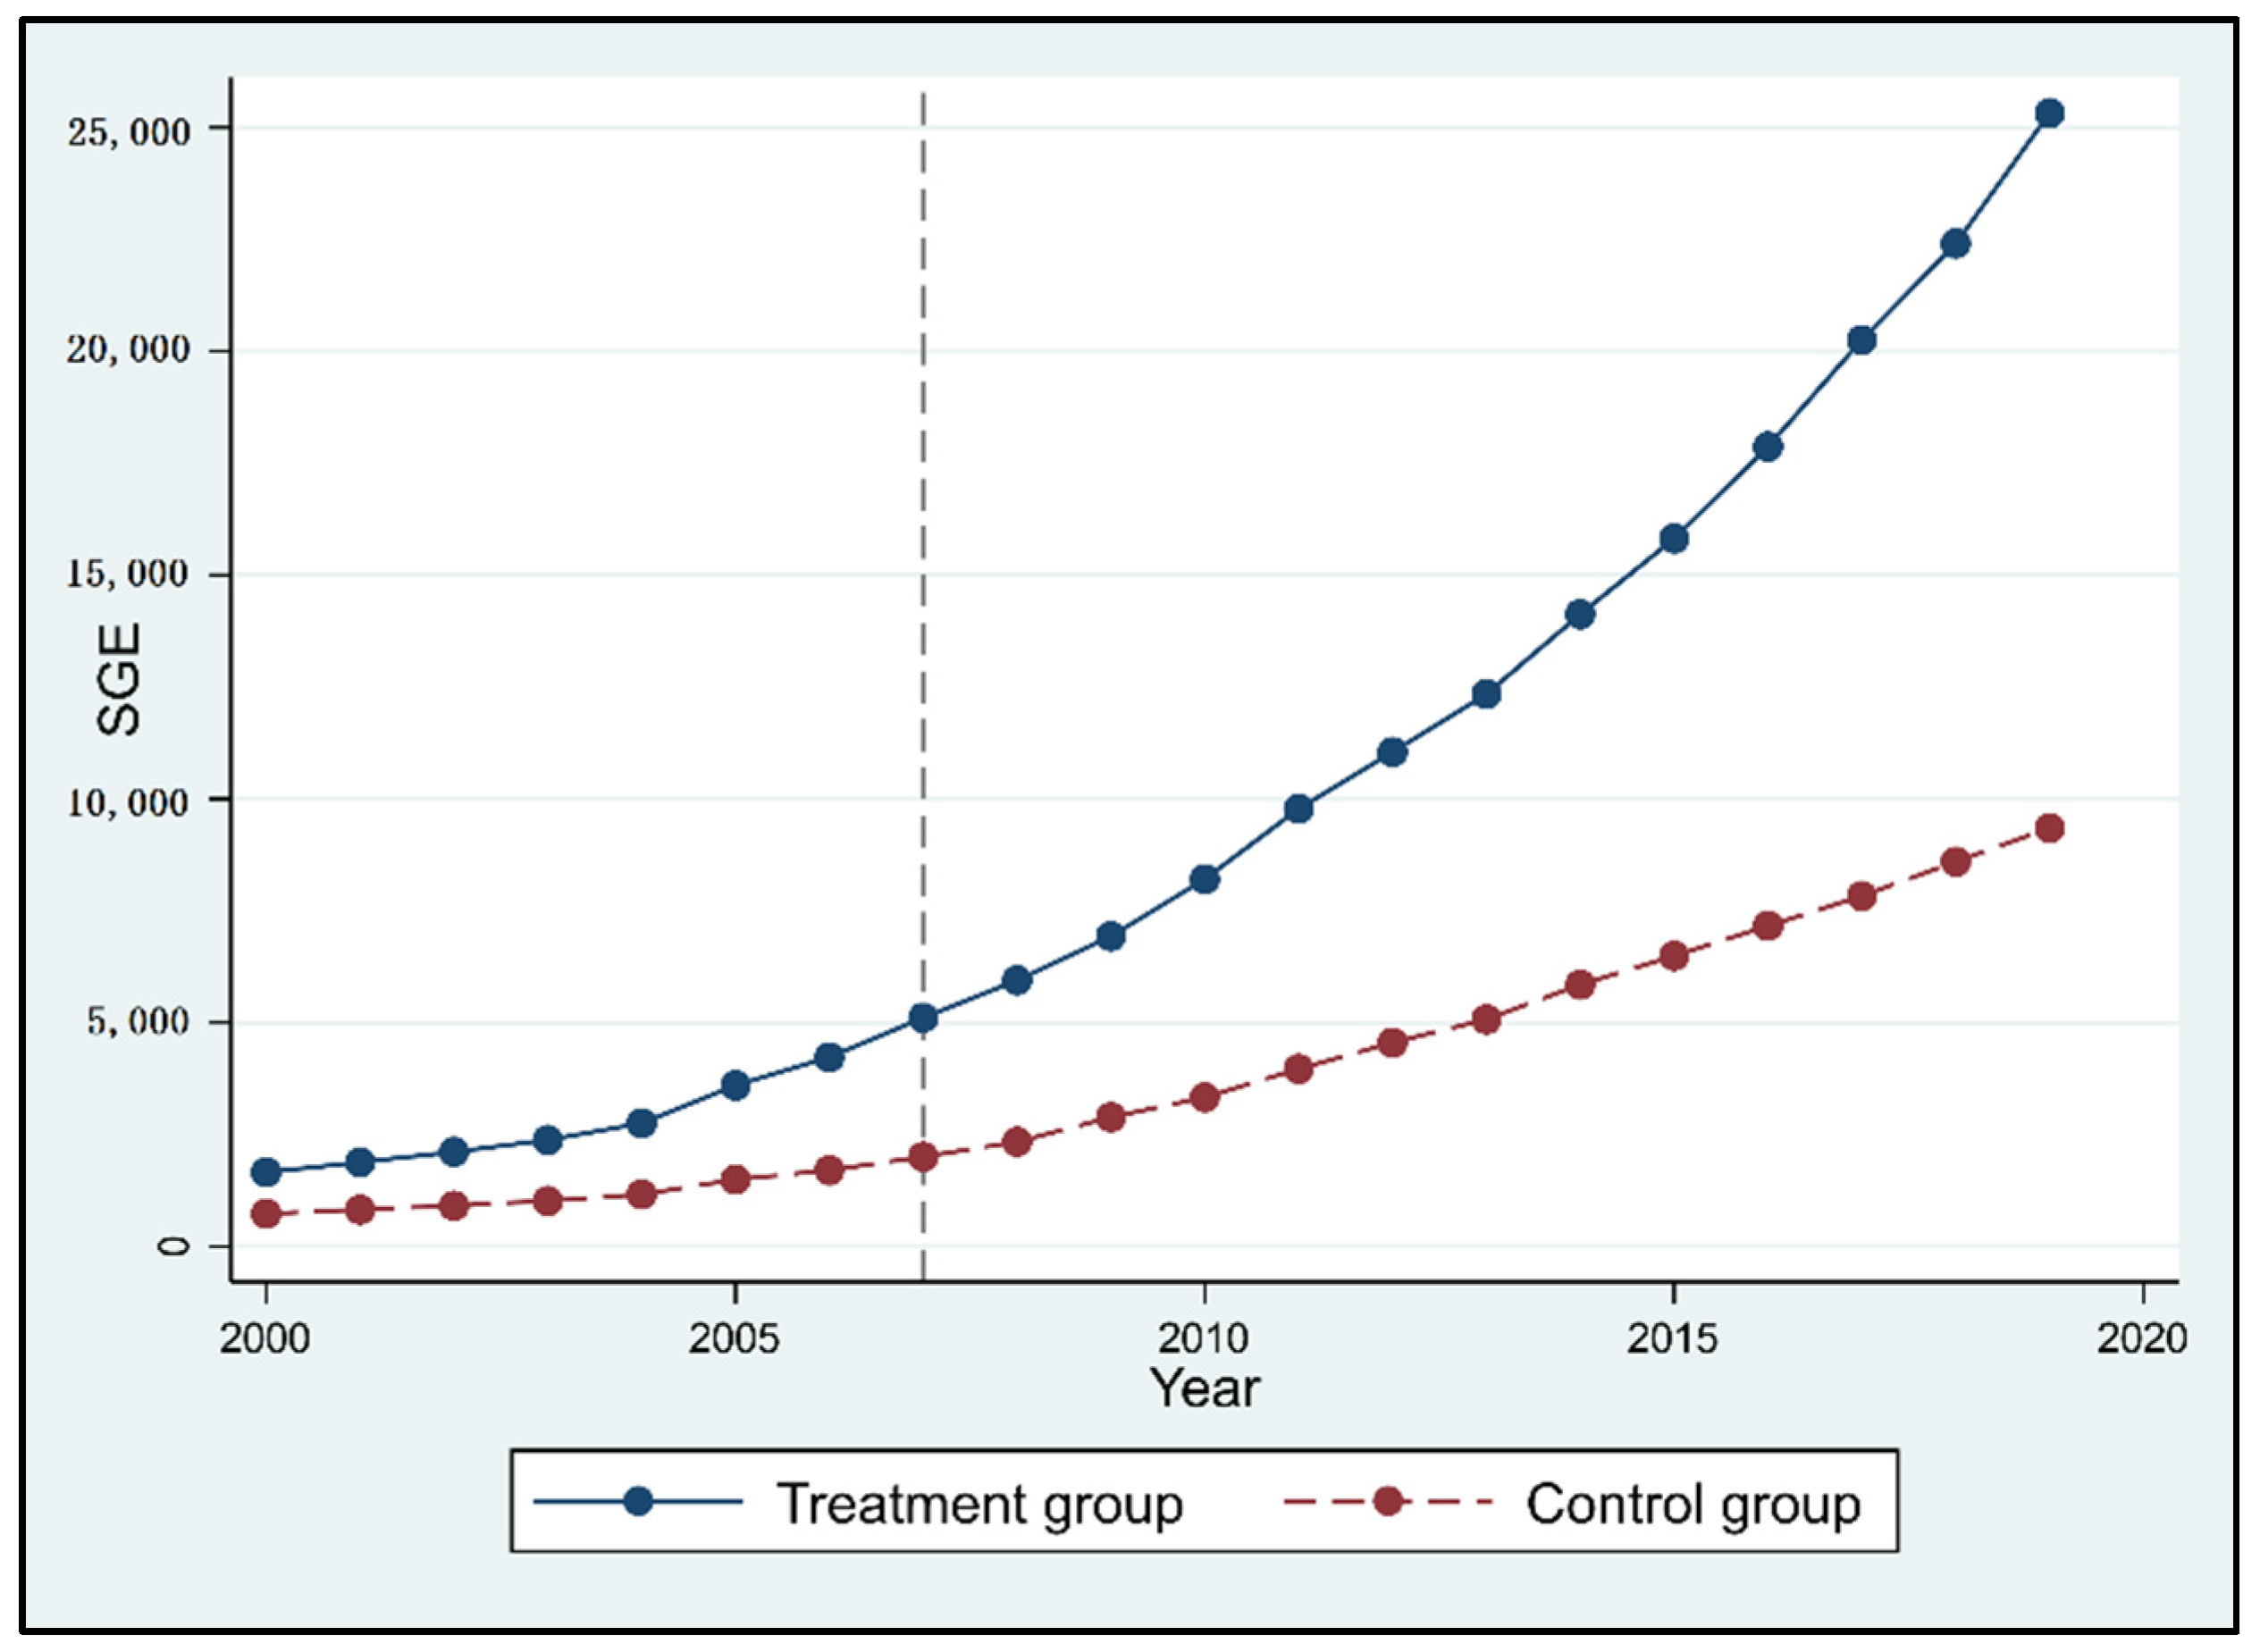
4.2.1. Parallel Trend Test

Before the formal regressions, a parallel trend test was conducted to determine whether there was a shock effect of the sustainability policy of drama-related intangible cultural heritage [51]. First, in terms of the size of the green service industry, it is evident that the magnitude of the expansion in size differs significantly between the treatment and control groups after the release of the policy (Figure 2). Second, in terms of growth rate and share, the relative size of the two groups changed after the policy shock (Figure 3 and Figure 4). This shows that the sustainable policy of drama-related intangible cultural heritage tourism development does have a policy shock on the green service industry [51].

4.2.2. Regression Results

First of all, all provinces, municipalities, and autonomous regions of China (including Hong Kong, Macao, and Taiwan) will be returned to China as a whole, and the results are shown in Table 5. At the 10% confidence level, the difference-in-difference interaction variable of policy has a positive effect on the green service industry. Not only does the sustainable development policy show a significant difference between the treatment group and the control group, i.e., the sustainable development policy is very effective in promoting the scale of green service industry in the treatment group, but it also shows a significant difference before and after the policy is enacted, i.e., the scale of green service industry is promoted after the policy is enacted. At the same time, it can increase the share of green service industry in the whole national economy at the 1% confidence level. Similarly, these sustainable policies show highly significant differences between the control and treatment groups, before and after enactment, and sustainable policies can promote their scale. However, the sustainable policy of drama intangible cultural heritage does not show a significant correlation with the growth rate of the green services sector. Through more detailed splitting, sustainable policies showed differences before and after enactment, but did not show significant differences between the treatment and control groups. Overall, at the national level as a whole, the sustainable intangible cultural heritage policy of drama has played a very effective role in promoting the scale and proportion of the green service industry. However, it did not provide an impetus to the growth rate of the green service industry, probably because the effectiveness of the policy was not shown to be sufficient in terms of durability [52].

4.3. Regression Results for the Three Regions

The eastern part of China is economically developed, and the service industry is developing very well, but the western region is underdeveloped. In addition, influenced by the concentration of ethnic minorities, China’s intangible cultural heritage has a large difference in distribution between the east and west. Therefore, we divide the observation targets into three regions, namely, the eastern, central, and western regions, to analyze the different performance of sustainable policies of intangible cultural heritage of drama within the three regions. At the same time, we analyze the impact of policy uncertainty and the spread and backwash effect caused by industrial agglomeration [53,54]. Table 6 shows the breakdown of the three groupings of observation targets.

4.3.1. Results for Eastern China

According to the results in Table 7, at 1% significance level, the sustainable policy of drama intangible cultural heritage has a very significant negative effect on the growth rate of the green service industry. In the treatment group, sustainable policies can promote the growth rate of the green service industry, but from the time the sustainable policies are enacted, they show a negative effect. The reason could be that the eastern region has a developed economy with a full range of industrial sectors and the pillar industry does not depend on tourism [49]. On the contrary, the eastern region needs to pay for the preservation and development of intangible cultural heritage [16]. It is also possible that the commercialization of intangible cultural heritage has failed to show the promotion of green industry because it has not formed an industrial agglomeration in the eastern region [53,54]. Meanwhile, sustainable policies for drama-related intangible cultural heritage have no significant effect on the size and growth rate of green services. It is worth mentioning that under the influence of these policies, inbound tourism by foreign residents promotes the growth of the service sector, but tourism by domestic residents plays a hindering role. This suggests that the development of tourism in the eastern region of China’s drama-related intangible cultural heritage is more attractive to foreign tourists [52]. In general, the development of the eastern region does not depend on tourism integrated with intangible cultural heritage, but rather the preservation and development of intangible cultural heritage increases the financial burden of the eastern region and has a negative effect on the growth of green services.

4.3.2. Results for Central China

Different from the eastern region, the policies in the central region gradually show a trend of promotion. According to Table 8, although the sustainable policies for drama intangible cultural heritage do not have a significant effect on the growth rate and share of green service industries, they have a positive contribution to the size of green service industries at the 5% confidence level. By dissection, these policies have a negative sway on the treatment group but show an overall positive effect with the interaction of the time difference variables of the policies. This suggests that sustainable policies are policy fit and supportive in a relatively incomplete industrial sector like the central region [55]. This may be due to the more developed industrial concentration of intangible cultural heritage in the central region compared to the eastern region, which has led to the gradual development of economies of scale in “ICH + tourism” in the central region [53,54]. This sustainable policy is appropriate for the development of the service sector in areas with such characteristics.

4.3.3. Results for Western China

Gradually, sustainable policies for drama-related intangible cultural heritage have shown a more significant contribution. From the eastern region to the central region, and then to the western region, the role of sustainable policies becomes more and more significant, and the role changes from negative to positive with increasing intensity. According to Table 9, the policy has a very significant positive effect on the growth rate and the share of green service industry at 1% confidence level, except that it has no significant effect on the size of green service industry, and the intensity of the effect on the share is higher. This is because the western region is underdeveloped economically and has a single industrial sector [7], but there are numerous ethnic minority settlements in the western region, and historically, these regions have developed unique gateway characteristics, and the sustainability policy of intangible cultural heritage of drama has fully exploited these ethnic characteristics. Intangible cultural heritage has formed an industrial cluster here with economies of scale. Ultimately, it promotes the development of the local service industry [53,54]. This shows that the sustainability policy of intangible cultural heritage implemented in China has a good development effect on regions with backward economy and a single industrial sector, but with distinct ethnic characteristics [48].

4.4. Individual Regression Results for Each Policy

In order to evaluate each policy more precisely, we selected different time periods and studied the effectiveness of each policy volume separately. There are five policies for the sustainable conservation and development of China’s national drama-related intangible cultural heritage, released in 2006, 2008, 2011, 2014, and 2020, but the official statistics are published up to 2019. Therefore, limited by the official data, we can only evaluate the effect of the first four policies. We divided the four periods separately and then did four DID analyses on the four periods. Figure 5 shows the division of the time periods.

4.4.1. Results for the First Policy

According to Table 10, the first published policy for the sustainable protection and development policy of drama intangible cultural heritage has a positive contribution to the share of the green service industry at the 1% significance level. However, the interaction term variable of the policy does not have a significant effect on the size and growth rate of the green service industry. In other words, the policy of intangible cultural heritage, which first hit the share of the industry, promotes the position of green service industry in the regional economy. This indicates that the policy at the beginning of the period, firstly, changes the industrial structure of the region, and the scale effect and persistence of the policy have not yet been shown during this period.

4.4.2. Results for the Second Policy

The results in Table 11 show that the sustainable policy of drama intangible cultural heritage has a significant negative effect on the size of the green service industry at the 1% level of significance. This means that from the first batch, none of the policies show scale benefits. Over time, the second batch of policies not only did not have scale benefits, but also inhibited the expansion of the scale of the green service industry. This suggests that the intensity of these policies has not been adapted to the development of the service industry, perhaps because of the underdevelopment of tourism for intangible cultural heritage, or because of excessive protection of intangible cultural heritage, which has led to an increase in funding noted [16]. However, while spending high costs, no income was generated [16]. However, at the 5% significance level, the development of domestic tourism changed from a negative to a positive effect on the green service industry. In other words, another difference between the second policy and the first policy is that the second policy started to make intangible cultural heritage tourism attractive to Chinese residents.

4.4.3. Results for the Third Policy

According to the regression results in Table 12, as a legacy of the first and second batches, the third batch of policies did not have a significant effect on the size, growth rate, and share of the green service industry. From the perspective of time, the first policy promoted the proportion of the service industry but did not show economies of scale. To the second policy’s inhibitory effect on the size, and then to the third, which was not a significant phenomenon. What is known is that the third sustainable policy of drama-related intangible cultural heritage is in a transitional phase. That is, it takes time for policy effectiveness to take hold and for economies of scale to develop as batch after batch accumulates. It is the accumulation of quantitative change that leads to qualitative change and ultimately promotes green service industries [37].

4.4.4. Results for the Fourth Policy

The following verifies the above analysis. In the fourth batch of policies, a qualitative change occurred. The sustainable policy for tourism development of drama-related intangible cultural heritage shows a significant promotion effect on the green service industry. According to Table 13, the sustainable policies have a significant contribution to the size and growth rate of the green service industry at 5% and 1% confidence levels, respectively. Moreover, the intensity of the promotion effect on the scale is greater than the intensity on the growth rate. This indicates that the scale benefit of intangible cultural heritage tourism development is revealed and is very beneficial. However, as the scale reaches a certain value, it becomes very difficult to increase the share of green service industries. Therefore, unsurprisingly, the fourth policy has a negative effect on the increase of the share of green service industries.

5. Conclusions and Implications

5.1. Main Conclusions

First of all, through the overall regression, we find that the sustainable drama-related intangible cultural heritage policies play a very effective role in promoting the size and share of the green service industry. However, it did not provide an impetus to the growth rate of the green service industry. First, the development of the tourism value of drama-related intangible cultural heritage has added new dynamism to the traditional tourism industry, leading to further development of tourism and the expansion of service industries such as transportation, hospitality, and retail on a larger scale. Second, the long-term implementation of the policy has a positive impact on the proportion of green service industries, which has optimized China’s industrial structure to a certain extent and led to an increase in the proportion of green service industries. Third, the policy has a negative effect on the growth rate of the green service industry. On the one hand, it may be because the increase of industry scale will be accompanied by the decrease of growth rate, so these policies will suppress the growth rate while promoting the scale [10]; on the other hand, it may be because the impact of these policies only focuses on the expansion of industry scale, while ignoring the sustainability of industrial growth [16].
What is more, we divided all the observations into three groups according to the basis of eastern, central, and western divisions, and obtained the following conclusions. First, there is a pattern in the spatial distribution: from the eastern region to the central region, and then to the western region, the role of sustainable policies becomes more and more significant, and the role changes from negative to positive and increases in intensity. Second, instead of promoting the development of green service industries, these policies show negative effects in regions with developed economies, high levels of economic openness, and complete industrial sectors, like the eastern coastal regions, due to the need to allocate funds to support the preservation and development of intangible cultural heritage. However, in regions with a single industrial sector and relatively closed external exchanges, but with outstanding ethnic characteristics, like the central and northwestern regions, these policies are positive. Third, in the eastern region, inbound foreign residents are a source of upgrading the green service industry because the eastern region has a higher level of infrastructure such as transportation and accommodation to attract foreign tourists. However, the central-eastern region relies mainly on tourism from its own residents. This means that regions with more prominent ethnic characteristics attract domestic tourists, which may be due to the value recognition and preference of local intangible cultural heritage by their residents [47]. It is of concern that the industrial agglomeration has created a certain degree of uncertainty for the policy of intangible cultural heritage tourism development. At the same time, there exists the phenomenon of the spread and backwash effect here, which also adds difficulties to the targeted implementation of the policy [53,54].
Finally, from the scale, growth rate and proportion of green service industry, this paper analyzes the effectiveness of the protection and development policies of sustainable tourism of drama-related intangible cultural heritage four times in turn. Three conclusions are obtained. First, in terms of scale effectiveness, the initial first and second batches of policies did not have scale effectiveness due to the lack of quantitative accumulation. At the same time, the protection and investment in intangible cultural heritage rather inhibited the scale of green service industry because the development had just started. After the transition of the third policy, the fourth policy showed significant scale benefits. Second, with the emergence of policy scale benefits, the policy also appears to have a significant contribution to the growth rate of the green service industry. To a certain extent, the promotion of the growth rate of the service industry is the sustainability of the policy, which means that the performance of the sustainability of the policy is based on a larger scale basis. Third, when the scale grows to a certain extent, the green service industry will tend to saturate, while the share of primary and secondary industries still occupies a large proportion in the economy due to the same time. Therefore, with the promotion of scale by policies, the proportion of the green service industry will be suppressed [56].

5.2. Implications

5.2.1. The Government Guides In-Depth Development and Promotes Green Development

The analysis proves that the sustainable policy of drama-related intangible cultural heritage tourism does have a significant contribution to the development of green service industries in the region. Firstly, intangible cultural heritage tourism promotes the development of the service industry while creating some very objective income itself, which is conducive to the redevelopment and self-protection of intangible cultural heritage, which reduces the pressure on fiscal expenditure. Secondly, the development of the green service industry can improve our past situation of relying on industrial production to drive GDP growth, which is more in line with the concept of green and sustainability and is conducive to the construction of China’s ecological civilization goals. Therefore, the Chinese government, as the official wind vane, should take the initiative to promote this process.

5.2.2. Revitalization of Rural Areas in Central and Western Regions According to Local Conditions

The sustainable policy of drama-related intangible cultural heritage realizes regional adaptability, especially in regions like central and western China where the level of economic development is lower, the industrial sector is more homogeneous, and the economy is less open, but the ethnic flavor and ethnic characteristics are outstanding. China and other similar regions in the world, such as India and other regions and countries in South Asia, should increase the development of the tourism potential of intangible cultural heritage in these regions, making this a new economic growth point. With this new power source to drive the revitalization of rural areas, improve the income of rural areas while preserving the original local natural ecology and ethnic characteristics.

5.2.3. Balance between Scale, Growth Rate and Share to Enhance the Sustainability of the Policy

At the beginning of the period, these sustainable policies will promote the growth rate and share of green service industry, but there is no very significant scale effect. However, with the accumulation of policies and a certain time lag, the policies exhibit economies of scale that in turn make the growth rate slow. When making policies and making decisions on the intensity of implementing policies, each region should determine and balance the relationship among the three according to the current situation of local industrial structure and the ideal growth rate. In addition, there is a positive impact caused by policy shocks, if we want not only to maintain the scale of the promoted green service industry so that it does not decrease and so that the growth rate is stable, but also to strengthen the policy life cycle and post-supervision.

Author Contributions

Supervision, X.Z. and E.E.; methodology, F.W.; software, F.W.; validation, E.E., F.W. and X.Z.; formal analysis, H.Z. and F.W.; investigation, F.W.; data curation, H.Z.; writing—original draft preparation, H.Z., E.E. and F.W.; writing—review and editing, X.Z., E.E. and F.W. All authors have read and agreed to the published version of the manuscript.

Funding

This research was funded by The Youth Project of Guizhou Province 2021 Philosophy and Social Science Planning National Studies Single Subject, grant number 21GZGX27 and this paper was funded by Chengdu University of Technology Social Science Foundation Youth Project, grant number, YJ2021-QN013.

Institutional Review Board Statement

Not applicable.

Informed Consent Statement

Not applicable.

Data Availability Statement

The data are not publicly available due to restrictions privacy.

Conflicts of Interest

The authors declare no conflict of interest.

References

  1. Edieser, D.S.; Sir, A.T. Tourism, heritage and cultural performance: Developing a modality of heritage tourism. Tour. Manag. Perspect. 2019, 31, 301–309. [Google Scholar]
  2. Jing, L.; Guangxin, S.; Mengshan, C.; Jiao, B.; Badamasi, S.M. Green environment and circular economy: A state-of-the-art analysis. Sustain. Energy Technol. Assess. 2022, 52, 102106. [Google Scholar]
  3. Wang, F.; Cai, W.; Elahi, E. Do Green Finance and Environmental Regulation Play a Crucial Role in the Reduction of CO2 Emissions? An Empirical Analysis of 126 Chinese Cities. Sustainability 2021, 13, 13014. [Google Scholar] [CrossRef]
  4. Li, X.; Gao, Y. Evaluation and Empirical Analysis on Tourism Development Value of Intangible Culture Heritagein Minority Areas. Guizhou Ethn. Stud. 2019, 40, 158–165. [Google Scholar]
  5. Ernest, B.A.; Valery, P.A.; Bismark, A. Green economy implementation in Ghana as a road map for a sustainable development drive: A review. Sci. Afr. 2021, 12, e00756. [Google Scholar]
  6. Ehsan, E.; Zainab, K.; Muhammad, Z.T.; Hongxia, Z.; Xing, L. Extreme weather events risk to crop-production and the adaptation of innovative management strategies to mitigate the risk: A retrospective survey of rural Punjab, Pakistan. Technovation 2021, 4, 102255. [Google Scholar]
  7. Zhang, X.-Y. Evaluation of Intangible Cultural Heritage Tourism Resources in Xinjiang Multiethnic Areas. Guizhou Ethn. Stud. 2018, 39, 152–157. [Google Scholar]
  8. Ouyang, H.; Dai, M.-L.; Wang, R.; Ma, X.-L. Review on the Research Progress of Intangible Cultural Heritage Tourism in China. Geogr. Geo-Inf. Sci. 2021, 37, 124–132. [Google Scholar]
  9. Dai, J.; Li, L. Intangible Cultural Heritage Tourism and Placemaking. Tour. Trib. 2019, 34, 3–5. [Google Scholar]
  10. Wang, W.; Yang, F. The Belt and Road Initiative and China’s Green Foreign Direct Investment. J. Renmin Univ. China 2019, 33, 10–22. [Google Scholar]
  11. Liguo, W. Causal analysis of conflict in tourism in rural China: The peasant perspective. Tour. Manag. Perspect. 2021, 39, 100863. [Google Scholar]
  12. Min, Z. Research on Tourism Development of Intangible Cultural Heritage in China—Review of “Principles and Cases of Tourism Development and Planning”. J. Guangdong Univ. Financ. Econ. 2022, 1, 1–2. [Google Scholar]
  13. José, M.M.M.; José, A.S.F. The effects of technological improvements in the train network on tourism sustainability. An approach focused on seasonality. Sustain. Technol. Entrep. 2022, 1, 100005. [Google Scholar]
  14. Brijesh, T. Soft-infrastructure in tourism development in developing countries. Ann. Tour. Res. 2012, 39, 1705–1710. [Google Scholar]
  15. Jameel, K.; Boopen, S. Transport infrastructure and tourism development. Ann. Tour. Res. 2007, 34, 1021–1032. [Google Scholar]
  16. Tianchen, D.; Xing, Z.; Juan, Y. Contradictory or aligned? The nexus between authenticity in heritage conservation and heritage tourism, and its impact on satisfaction. Habitat Int. 2021, 107, 102307. [Google Scholar]
  17. D’amato, D.; Korhonen, J. Integrating the green economy, circular economy and bioeconomy in a strategic sustainability framework. Ecol. Econ. 2021, 188, 107143. [Google Scholar] [CrossRef]
  18. Haleh, M.; Mohammad, M.; Neda, T.F. A study on tourists’ tendency towards intangible cultural heritage as an attraction (case study: Isfahan, Iran). City Cult. Soc. 2019, 17, 54–60. [Google Scholar]
  19. Zhaoyu, C.; Wantanee, S.; Brian, K. Constructing an intangible cultural heritage experiencescape: The case of the Feast of the Drunken Dragon (Macau). Tour. Manag. Perspect. 2020, 34, 100659. [Google Scholar]
  20. Nur, I.M.R.; Saniah, A.Z.; Syed, M.H.S.S. Between Tourism and Intangible Cultural Heritage. Procedia Soc. Behav. Sci. 2013, 85, 411–420. [Google Scholar]
  21. Chunyan, L.; Xueting, D.; Jiangfeng, L.; Liping, A.C. Analyzing government role in rural tourism development: An empirical investigation from China. J. Rural Stud. 2020, 79, 177–188. [Google Scholar]
  22. Ming, K.L.; Ming, L.; Chao, W.; Sir, Y.L. Circular economy to ensure production operational sustainability: A green-lean approach. Sustain. Prod. Consum. 2022, 30, 130–144. [Google Scholar]
  23. Michaela, D.; Michael, A.E.; Vaughn, S. Rationalized authenticity and the transnational spread of intangible cultural heritage. Poetics 2019, 75, 101332. [Google Scholar]
  24. Somenath, H.; Rajesh, S. Promoting intangible cultural heritage (ICH) tourism: Strategy for socioeconomic development of snake charmers (India) through geoeducation, geotourism and geoconservation. Int. J. Geoheritage Parks 2021, 9, 212–232. [Google Scholar]
  25. Claudia, M.; Donna, C. The construction of intangible cultural heritage: A Foucauldian critique. Ann. Tour. Res. 2021, 89, 103206. [Google Scholar]
  26. Howard L, H. Theatre in London and the inter-relationship with tourism. Tour. Manag. 1998, 19, 445–452. [Google Scholar]
  27. Neda, M.; Nancy, G.M.; Max, O.S. Community cultural development: Exploring the connections between collective art making, capacity building and sustainable community-based tourism. Ann. Tour. Res. 2022, 93, 103355. [Google Scholar]
  28. Xiaojuan, Y.; Honggang, X. Cultural heritage elements in tourism: A tier structure from a tripartite analytical framework. J. Destin. Mark. Manag. 2019, 13, 39–50. [Google Scholar]
  29. Siow-Kian, T.; Siow-Hooi, T.; Yon-Sin, K.; Shay-Wei, C. Sense of place and sustainability of intangible cultural heritage—The case of George Town and Melaka. Tour. Manag. 2018, 67, 376–387. [Google Scholar]
  30. Ke, X.; Yifei, L.; Xiaoxiao, M. An evaluation model to assess the communication effects of intangible cultural heritage. J. Cult. Herit. 2019, 40, 124–132. [Google Scholar]
  31. Amr, A.-A.; Jin-Soo, L.; Brian, K.; Heesup, H. Stolen history: Community concern towards looting of cultural heritage and its tourism implications. Tour. Manag. 2021, 87, 104349. [Google Scholar]
  32. María, J.R.-O.; Pedro, M.G.-V.; Bernardo, D.L.G.-V.; Américo, H.-P.; Ángela, Y.A.-S. Innovation capability and pioneering orientation in Peru’s cultural heritage tourism destinations: Conflicting environmental effects. J. Hosp. Tour. Manag. 2021, 48, 441–450. [Google Scholar]
  33. Sulaman, M.; Yanchun, P.; Mujtaba, H.A.; Muhammad, U.; Siyuan, C. Industrial structure, energy intensity and environmental efficiency across developed and developing economies: The intermediary role of primary, secondary and tertiary industry. Energy 2022, 247, 123576. [Google Scholar]
  34. Mahboobeh, K.; Seyed, R.D.; Khaled, S. Factors affecting the behavioral intention of tourists on the use of bike sharing in tourism areas. Res. Transp. Bus. Manag. 2021, 100742. [Google Scholar]
  35. Pere, S.-S.; Augusto, V.-D. Drivers of airport scheduled traffic in European winter tourism areas: Infrastructure, accessibility, competition and catchment area. J. Air Transp. Manag. 2019, 81, 101723. [Google Scholar]
  36. Shamsa, K.; Muhammad, I.R.; Abdul, H.P.; Adnan, P.; Minglun, R. Road and transport infrastructure development and community support for tourism: The role of perceived benefits, and community satisfaction. Tour. Manag. 2020, 77, 104014. [Google Scholar]
  37. Tao, L.; Qiuyun, L.; Jiaming, L. The spatial mobility of rural tourism workforce: A case study from the micro analytical perspective. Habitat Int. 2021, 110, 102322. [Google Scholar]
  38. Danyun, S.; Mengyao, X.; Qiyu, Z.; Ehsan, E.; Yi, Z.; Huiming, Z. The impact of public appeals on the performance of environmental governance in China: A perspective of provincial panel data. J. Clean. Prod. 2019, 231, 290–296. [Google Scholar]
  39. Lourdes, M.-M.; Ángela, T.; María, C.C. Exploring the association between circular economy strategies and green jobs in European companies. J. Environ. Manag. 2021, 297, 113437. [Google Scholar]
  40. Lenzen, M.; Sun, Y.Y.; Faturay, F.; Ting, Y.P.; Geschke, A.; Malik, A. The carbon footprint of global tourism. Nat. Clim. Chang. 2018, 8, 522–528. [Google Scholar] [CrossRef]
  41. Patricia, A.S.; Walter, F.K.; Monika, M.D.; Yumiko, L.J. Social, cultural and spatial imaginaries in rural tourism transitions. J. Rural Stud. 2021, 87, 243–253. [Google Scholar]
  42. Pang, Y. Study on the impact of international cooperation on rural intangible cultural heritage tourism based on SWOT analysis. Agric. Econ. 2020, 12, 135–136. [Google Scholar]
  43. Benhong, P.; Yu, T.; Ehsan, E.; Guo, W. Extended Producer Responsibility and corporate performance: Effects of environmental regulation and environmental strategy. J. Environ. Manag. 2018, 218, 181–189. [Google Scholar]
  44. Benhong, P.; Hong, C.; Ehsan, E.; Guo, W. Study on the spatial differentiation of environmental governance performance of Yangtze river urban agglomeration in Jiangsu province of China. Land Use Policy 2020, 99, 105063. [Google Scholar]
  45. Benhong, P.; Yue, L.; Ehsan, E.; Guo, W. Dynamic evolution of ecological carrying capacity based on the ecological footprint theory: A case study of Jiangsu province. Ecol. Indic. 2019, 99, 19–26. [Google Scholar]
  46. Yaping, L.; Farah, S.; Wajahat, A.; Tafazal, K. Does tourism development, energy consumption, trade openness and economic growth matters for ecological footprint: Testing the Environmental Kuznets Curve and pollution haven hypothesis for Pakistan. Energy 2022, 245, 123208. [Google Scholar]
  47. Lingxu, Z.; Geoffrey, W.; Dapeng, Z.; Xiaoyun, C. Tourism and the (re)making of rural places: The cases of two Chinese villages. Tour. Manag. Perspect. 2021, 40, 100910. [Google Scholar]
  48. Gulnara, M.; Jianing, M.; Jaffar, A.; Shahid, M.; Riaqa, M.; Arash, Z. New Silk Road infrastructure opportunities in developing tourism environment for residents better quality of life. Glob. Ecol. Conserv. 2020, 24, e01194. [Google Scholar]
  49. Fushuai, W.; Ruichao, X.; Wenxia, C. Research on the Impact of Financial Development on TFP—DEA-Malmquist Index and Hansen Threshold Model Based on Panel Data of Shandong Province, China. J. Financ. Res. 2020, 2, 71–79. [Google Scholar] [CrossRef]
  50. Xuan, Z.; Benhong, P.; Ehsan, E.; Chaoyu, Z.; Anxia, W. Optimization of Chinese coal-fired power plants for cleaner production using Bayesian network. J. Clean. Prod. 2020, 273, 122837. [Google Scholar]
  51. Deng, R.; Zhang, A.; Chen, M. Impact and Spatial Spillover Effect of Low-carbon Pilot Policy on Ecological Efficiency—Empirical Analysis Based on SDID. World Surv. Res. 2022, 01, 38–47. [Google Scholar]
  52. Chunliu, G.; Li, C. Tourism-driven rural spatial restructuring in the metropolitan fringe: An empirical observation. Land Use Policy 2020, 95, 104609. [Google Scholar]
  53. Jiangfeng, Y.; Qunchao, W.; Ruida, L.; Zhu, Y.; Dujuan, H. How do R&D agglomeration and economic policy uncertainty affect the innovative performance of Chinese high-tech industry? Technol. Soc. 2022, 69, 101957. [Google Scholar]
  54. Xiaoyang, L.; Zhaohua, L.; Yingdong, H.; Guoying, Z.; Lin, Z. The coupling coordination degree between urbanization and air environment in the Beijing(Jing)-Tianjin(Jin)-Hebei(Ji) urban agglomeration. Ecol. Indic. 2022, 137, 108787. [Google Scholar]
  55. Jun, Y.; Ruxin, Y.; Ming-Hsiang, C.; Ching-Hui (Joan), S.; Yin, Z.; Jianchao, X. Effects of rural revitalization on rural tourism. J. Hosp. Tour. Manag. 2021, 47, 35–45. [Google Scholar]
  56. Qin, W.; Li, Y.; Zhonggang, Y. Research on development of digital finance in improving efficiency of tourism resource allocation. Resour. Environ. Sustain. 2022, 8, 100054. [Google Scholar]
Figure 1. Theoretical Framework.
Sustainability 14 05380 g001
Figure 2. Policy shocks to the size of the green services sector.
Sustainability 14 05380 g002
Figure 3. Policy shocks to the growth rate of green services.
Sustainability 14 05380 g003
Figure 4. Policy shocks to the share of green services.
Sustainability 14 05380 g004
Figure 5. The division of time periods for the analysis of the four batches of policies.
Sustainability 14 05380 g005
Table 1. Variables of the green economy.
DimensionVariableUnit
SizeValue added of tertiary industryBillion yuan
GrowthTertiary industry growth ratePrevious year = 100
RatioValue added of tertiary industry/GDP%
Table 2. Variables of tourism development.
DimensionVariableUnit
DomesticNumber of peopleNumber of domestic visitorsMillion people
ConsumptionConsumption of domestic touristsBillion yuan
OutboundNumber of peopleNumber of foreign touristsMillion people
ConsumptionConsumption of foreign touristsMillion dollars
Table 3. Variables of sustainable policies for drama-related intangible cultural heritage.
Before Policy EnactmentAfter Policy Enactment
Control group(0, 0)(0, 1)
Processing group(1, 0)(1, 1)
Table 4. Summary of basic statistics.
VariableSamplesAverageStandard DeviationMinimumMaximum
SGE6206682.2578393.88753.9359,773.38
GGE620110.74092.397935102.5122
RGE62042.750079.06585728.683.5
IS5752062.4843081.9370.07840,251.3
IV613145,884.2264,495.2162,052,131
OS53422,588.547,625.377.2629,972
OV595295.497848.43870.210,512.91
Table 5. Country-level regression results.
Dependent Variables:Equation (3)Equation (4)Equation (5)
lnSGElnGGElnRGE
lnIS0.0016 (0.16)−0.0019 (−1.61)0.0084 (1.51)
lnIV−0.0058 (−0.84)0.0003 (0.36)0.0011 (0.29)
lnOS−0.0194 (−1.46)0.0014 (0.84)−0.0078 (−1.02)
lnOV0.0180 (1.41)0.0012 (0.75)−0.0218 *** (−3.01)
PG2.7689 *** (32.61)0.0107 (1.03)0.6164 *** (12.78)
PT2.6061 *** (45.95)−0.0371 *** (−5.34)0.3457 *** (10.73)
PG × PT0.0433 * (1.84)−0.0020 (−0.70)0.0564 *** (4.23)
Constant4.9420 *** (51.02)4.6901 *** (394.76)3.6280 *** (65.95)
Observations474474474
R-squared0.9930.5880.895
* and *** indicate the significance of parameters at 10% and 1%, respectively. t-values are given in parentheses.
Table 6. Selection of regions within different regional subgroups in China.
RegionProvinces, Municipalities and Autonomous Regions
EastBeijing, Tianjin, Hebei, Liaoning, Shanghai, Jiangsu, Zhejiang, Fujian, Shandong, Guangdong, Guangxi, Hainan
CenterShanxi (whose provincial capital is Taiyuan), Neimenggu, Jilin, Heilongjiang, Anhui, Jiangxi, Henan, Hubei, Hunan
WestSichuan, Guizhou, Yunnan, Xizang, Shanxi (whose provincial capital is Xian), Gansu, Ningxia, Qinghai, Xinjiang
Table 7. Results for eastern China.
Dependent Variables:Equation (3)Equation (4)Equation (5)
lnSGElnGGElnRGE
lnIS−0.0024 (−0.37)−0.0006 (−0.79)0.0023 (0.68)
lnIV−0.0156 ** (−2.49)−0.0015 ** (−2.00)0.0047 (1.49)
lnOS−0.0263 (−1.20)0.0070 ** (2.58)0.0048 (0.44)
lnOV0.0081 (0.40)−0.0017 (−0.70)−0.0094 (−0.93)
PG2.3858 *** (45.93)0.0107 * (1.67)0.4241 *** (16.24)
PT2.7176 *** (39.20)−0.0169 * (−1.97)0.3246 *** (9.31)
PG × PT−0.0152 (−0.38)−0.0304 *** (−6.22)0.0143 (0.72)
Constant5.5847 *** (45.88)4.6693 *** (310.91)3.6700 *** (59.98)
Observations171171171
R-squared0.9950.7590.966
*, **, and *** indicate the significance of parameters at 10%, 5%, and 1%, respectively. t-values are given in parentheses.
Table 8. Results for central China.
Dependent Variables:Equation (3)Equation (4)Equation (5)
lnSGElnGGElnRGE
lnIS0.0119 (0.46)−0.0128 ** (−2.24)0.0062 (0.34)
lnIV0.0492 (1.25)−0.0033 (−0.38)−0.1470 *** (−5.30)
lnOS−0.0117 (−1.15)−0.0000 (−0.00)−0.0169 ** (−2.35)
lnOV0.0335 (1.14)0.0053 (0.83)0.0216 (1.05)
PG−0.0983 ** (−2.56)−0.0012 (−0.14)0.0423 (1.57)
PT2.4573 *** (15.60)0.0232 (0.67)0.8103 *** (7.31)
PG × PT0.0886 ** (2.06)−0.0012 (−0.12)0.0393 (1.30)
Constant6.1697 *** (18.39)4.7816 *** (64.53)4.7377 *** (20.05)
Observations767676
R-squared0.9950.5280.935
** and *** indicate the significance of parameters at 5% and 1%, respectively. t-values are given in parentheses.
Table 9. Results for western China.
Dependent Variables:Equation (3)Equation (4)Equation (5)
lnSGElnGGElnRGE
lnIS0.0471 (1.50)−0.0035 (−0.89)0.0189 (1.03)
lnIV−0.0503 (−1.27)−0.0027 (−0.55)−0.0755 *** (−3.25)
lnOS−0.0601 * (−1.80)0.0018 (0.43)−0.0351 * (−1.80)
lnOV0.1030 ** (2.40)0.0049 (0.92)0.0278 (1.11)
PG−0.3748 *** (−7.11)−0.0168 ** (−2.58)−0.1022 *** (−3.31)
PT2.7165 *** (20.84)−0.0453 *** (−2.80)0.4245 *** (5.57)
PG × PT−0.0232 (−0.63)0.0143 *** (3.12)0.1001 *** (4.64)
Constant6.8112 *** (19.69)4.7464 *** (110.77)4.3669 *** (21.59)
Observations194194194
R-squared0.9930.6050.822
*, **, and *** indicate the significance of parameters at 10%, 5%, and 1%, respectively. t-values are given in parentheses.
Table 10. Results for the first policy.
Dependent Variables:Equation (3)Equation (4)Equation (5)
lnSGElnGGElnRGE
lnIS0.0010 (0.16)−0.0002 (−0.16)0.0004 (0.13)
lnIV0.0079 (0.33)0.0056 (1.46)−0.0387 *** (−3.03)
lnOS−0.0520 * (−1.70)−0.0051 (−1.04)−0.0212 (−1.28)
lnOV0.0350 (1.48)0.0006 (0.15)0.0116 (0.91)
PG2.7109 *** (15.55)0.0021 (0.08)0.8275 *** (8.81)
PT1.2084 *** (27.09)0.0070 (0.97)0.0690 *** (2.87)
PG × PT0.0378 (1.34)−0.0058 (−1.29)0.0402 *** (2.65)
Constant4.9761 *** (20.43)4.6955 *** (119.76)3.8943 *** (29.69)
Observations226226226
R-squared0.9950.5300.929
* and *** indicate the significance of parameters at 10% and 1%, respectively. t-values are given in parentheses.
Table 11. Results for the second policy.
Dependent Variables:Equation (3)Equation (4)Equation (5)
lnSGElnGGElnRGE
lnIS0.0168 (0.37)0.0216 ** (2.18)0.0255(0.75)
lnIV−0.0084 (−1.18)−0.0014 (−0.92)0.0076 (1.41)
lnOS−0.0524 * (−1.79)−0.0155 ** (−2.42)−0.0170 (−0.77)
lnOV0.0391 (1.37)-0.0047 (−0.75)−0.0179 (−0.84)
PG2.7868 *** (33.94)0.0089 (0.50)0.6188 *** (10.01)
PT0.7162 *** (21.36)−0.0266 *** (−3.63)−0.0101 (−0.40)
PG × PT−0.0630 *** (−2.68)−0.0032 (−0.62)0.0180 (1.02)
Constant6.2619 *** (40.23)4.7487 *** (139.42)3.6610 *** (31.24)
Observations133133133
R-squared0.9980.6130.956
*, **, and *** indicate the significance of parameters at 10%, 5%, and 1%, respectively. t-values are given in parentheses.
Table 12. Results for the third policy.
Dependent Variables:Equation (3)Equation (4)Equation (5)
lnSGElnGGElnRGE
lnIS0.0123 (0.37)0.0113 (1.32)0.0305 (1.13)
lnIV0.0084 (0.28)0.0079 (1.00)−0.0416 * (−1.67)
lnOS0.0069 (0.85)−0.0043 ** (−2.03)0.0059 (0.88)
lnOV−0.0210 (−0.78)−0.0125 * (−1.77)0.0119 (0.54)
PG2.6835 *** (37.52)−0.0110 (−0.59)0.6680 *** (11.33)
PT0.6962 *** (21.85)−0.0399 *** (−4.78)0.0366 (1.39)
PG × PT−0.0013 (−0.08)0.0025 (0.59)0.0163 (1.21)
Constant6.2467 *** (37.40)4.6385 *** (106.00)3.8345 *** (27.84)
Observations141141141
R-squared0.9990.6810.975
*, **, and *** indicate the significance of parameters at 10%, 5%, and 1%, respectively. t-values are given in parentheses.
Table 13. Results for the fourth policy.
Dependent Variables:Equation (3)Equation (4)Equation (5)
lnSGElnGGElnRGE
lnIS0.0798 * (1.91)0.0046 (1.00)0.0207 (0.77)
lnIV0.0065 (0.45)0.0002 (0.09)−0.0082 (−0.88)
lnOS−0.0090 (−0.56)−0.0017 (−0.93)0.0024 (0.23)
lnOV0.0118 (0.50)0.0020 (0.77)−0.0236 (−1.56)
PG1.5035 *** (11.53)−0.0398 *** (−2.75)0.6420 *** (7.62)
PT0.5995 *** (10.41)−0.0360 *** (−5.62)0.2557 *** (6.87)
PG × PT0.0680 ** (2.32)0.0111 *** (3.42)−0.0551 *** (−2.91)
Constant7.2867 *** (28.37)4.6910 *** (164.39)3.6855 *** (22.20)
Observations169169169
R-squared0.9940.7050.927
*, **, and *** indicate the significance of parameters at 10%, 5%, and 1%, respectively. t-values are given in parentheses.
Publisher’s Note: MDPI stays neutral with regard to jurisdictional claims in published maps and institutional affiliations.

