Article

Reducing GHG Emissions and Improving Cost Effectiveness via Energy Efficiency Enhancements: A Case Study in a Biscuit Industry

by
Valentina Stojceska
1,2,*,
Nicholas Parker
1 and
Savvas A. Tassou
1,2
1
Department of Mechanical and Aerospace Engineering, College of Engineering, Design and Physical Sciences, Brunel University London, Uxbridge UB8 3PH, Middlesex, UK
2
Centre for Sustainable Energy in Food Chains, Institute of Energy Futures, Brunel University London, Uxbridge UB8 3PH, Middlesex, UK
*
Author to whom correspondence should be addressed.
Sustainability 2022, 14(1), 69; https://doi.org/10.3390/su14010069
Submission received: 9 November 2021 / Revised: 13 December 2021 / Accepted: 14 December 2021 / Published: 22 December 2021
(This article belongs to the Section Energy Sustainability)

Abstract

:
As the new climate change driven regulations are brought into the force and energy prices and sustainability awareness increased, many companies are looking for the most efficient way to reduce their energy consumption and greenhouse gas (GHG) emissions. In this context, the food industry as one of the main energy consumers within the industry sector plays a significant role. This paper analyses the current energy consumption in a biscuit manufacturing company and considers a number of possible solutions for the energy efficiency improvements. The company uses modern and automated production processes and has signed a Climate Change Agreement. The experimental part involves identification of the energy users, as well as analysis of the energy bills, operation times, production schedule and on-site measurements of energy consumption. The opportunities for energy efficiency improvements, GHG emissions and costs reduction are investigated and additional information about the investments and payback period of the proposed improvements discussed. A number of opportunities for improvement are identified within the production area with a potential savings of 23%, which corresponds to EUR 40,534.00 and 190 tCO2, annually. It was found that the significant savings could be achieved by better managing the production lines and reducing operational hours from equipment, with no impact on productivity and no capital investment required. Further savings can be achieved through technical improvements requiring capital investments. All those improvements and savings make a significant contribution in accomplishing environmental targets set out by the FDF1 agreement.

1. Introduction

The agro-food and drink industry in the EU is the second leading manufacturing sector, responsible for 23% of global resource use, 28% of GHG emissions and 1.8% of the EU‘s water use [1,2]. The food supply chain in the UK contributes 20–30% to those emissions with outputs of 152Mt CO2 - 253Mt CO2 [3], at an estimated annual cost of GBP 1.5 billion [4]. This impact on the environment could be reduced with the implementation of various measurements and policy options, such as valorisation of food processing waste, water recovery, improvement of energy efficiency, sourcing of the local ingredients or using biodegradable packaging [5,6]. An investigation on the environmental profile of the biscuits supply chain showed that the main environmental hotspots arose from ingredients production and transportation activities [7]. The environmental performances could be improved by recycling a higher amount of packaging materials, sourcing local ingredients, enhancing energy efficiency or using more energy efficient and smart technologies [7,8,9,10].
Around 57% of the primary energy inputs into the whole industry are lost before reaching intended processing activities [11]. From 2004 to 2017, energy consumption has risen substantially, much more than production [12]. Estimates from several studies indicated that energy savings of approximately 20% to 30% could be achieved by applying procedural and behavioural changes with no capital investments needed [11]. Industrial energy consumption can be further cost-effectively reduced by 10% to 20% through well-structured energy management programs that combine energy conservation technologies, operation and management practices, and good housekeeping [11,12]. Furthermore, it was found that the integration of heat and renewable energy technologies could reduce GHG emissions by 5000 tCO2/year in brewing companies [13] while implementation of different configurations of cogeneration systems based on the electrical and thermal energy profiles reduced energy consumption by 40% in an olive factory [14]. The energy consumption and GHG emissions in food supply chain could be reduced with “refrigeration and HVAC systems integration, heat recovery and amplification using heat pumps, demand-side management, system diagnostics and local CHP generation and trigeneration” [9].
A number of studies used data envelopment analyses to optimise energy use in the production of peanuts [15], watermelons [16] and nectarines [17]. It was found that a maximum 76.62% of the energy use and 55.43% GHG emissions could be reduced if the present farms were converted into optimum farms, which includes appropriate use of chemical fertilisers and standard machinery. Similar trends were seen in fattening farms, resulting in energy savings of 53% from the feed intake and 31% from fossil fuels, as well as GHG emissions reduction of 47% [18].
In terms of energy intensity, baking production is the second largest energy consumer in the food industry following sugar production [19]. It produces about 2.5 million t/y of baking products and is responsible for consuming approximately 2000 GWh of energy and generating 570,000 tCO2 [20]. The main contributor to GHG emissions is the baking process followed by space heating, electrical services and transportation, and cooling conveyors [10,20]. Baking ovens are responsible for most of the energy usage, accounting for up to 70% of the electricity use due to heat loss through the oven walls [21]. Products like biscuits, breads and rolls require more energy than cakes and pies due to the longer baking time [10].
A number of studies dealt with the improvement of energy efficiency of baking ovens and found that up to 10% savings could be achieved by better optimization of the ovens and an additional 5% by re-designing the ovens with optimum heat transfer coefficients [22,23], which translates into a 2% reduction in specific energy. Another way to achieve energy saving and GHG emission reductions are the use of renewable technologies (solar, wind and biogases) or combined heat and power (CHP) systems that could generate approximately 64,900 MW/h of electricity and reduce GHG emissions by 15,415 tCO2. Furthermore, replacing high energy intensive processes and rehydration technologies with more efficient solutions, e.g., the use of microwave and heat pumps, could be also considered [9,13,24].
An additional pressure on the food industry to reduce GHG emissions are the governmental regulations and legislations for the clean environmental policies. The EU ETS, whose third phase began in January 2013, has put into force the 2020 Climate and Energy Package, targeting reduction of the UK’s GHG emissions below 1900 levels to at least 35% by the year 2020. This was brought further by implementing the “2030 European Climate and Energy Framework”, which doubled the GHG reduction to 40% while increasing energy from renewables and improving energy efficiency to at least 27% [25]. On the national level, the UK government introduced the Climate Change Act with the aim to reduce the UK’s GHG emissions by at least 80% from 1990 baseline by 2050 and provided a system of carbon budgeting and financial incentives to produce less waste and increase recycling. The Climate Change Umbrella Agreement is a voluntary agreement between the Environmental Agency in the UK and the food and drink association, referred to as FDF1, that influenced the food industry to seek even more sustainable approaches and exempt the energy from the Climate Change Levy discount via energy bills [26]. Although there are many policies and schemes to promote the reduction of energy consumption and carbon emissions like implementation of the energy management programs and new energy efficient technologies, there are still many obstacles that the food industry is facing nowadays. In the most cases production processes require different types of energy for electrical, thermal and cooling systems, leaving aside the possibility of energy integration of cogeneration and trigeneration systems which normally achieve increased overall efficiency, lower generation costs and carbon emissions. The implementation of such systems must be carefully studied based on each organisation’s electrical, heating and cooling demand profile, and could achieve great results if well dimensioned and operated.
To the authors’ knowledge there is a very little evidence and data in the literature about improving energy efficiency using case studies, therefore the main objective of this study was to improve energy efficiency of a baking biscuit company with implementation of a number of measures for energy saving. The data related to energy users, consumption, monthly energy bills, production and operation time were collected, and reduction of GHG emissions and costs of the energy proposed recommendations were calculated. This was carried out by analysing the company’s production process, identifying main energy users and critically evaluating the energy consumption, energy costs of the equipment and installation involved in production process.

2. Methodology

2.1. Case Study

The study was carried out in a baking biscuit company located in northern England. The company operates on 120h/w, uses modern and automated production process ([7] and has signed a Climate Change Umbrella Agreement for the Food and Drink sector (FDF1) with a commitment to reduce energy consumption and GHG emissions by approximately 25% to 2022 [26]. The company has four production lines, of which two are frequently used (Line 1 and Line 4). Both lines contain similar types of equipment, as presented in Figure 1. The lighting system of the factory is mainly composed of 400 W High Intensity Discharge Metal Halide (HID MH) lamps, which demonstrate considerable electricity consumption.

2.2. Research Design

The experimental part involves identification of the energy users, collection and analysis of the monthly energy bills, machinery operation time, production schedule and on-site measurement of energy (E) consumption of all the equipment involved in the production process using a high-quality power meter FLUKE 435 II Power Quality Analyser (Fluke UK Ltd., Norwich, UK. E was calculated using the following equation [7]):
E—energy consumption (kWh);
AP—active power (kW); oph = operating hours (h);
LF—load factor
All the results were collated using Microsoft Excel and energy consumption was evaluated. The energy costs of the energy consumption/reduction and CO2 emissions were calculated using energy cost rates published by the Department of Energy and Climate Change [4] and CO2 factors published by the Department for Environment, Food & Rural Affairs [27]. A number of improvements to reduce energy consumption were proposed. They were based on the maintained illuminance requirements following activities performed in each area and using values specified by CIBSE Lighting Guide [28] and SLL Code for Lighting [29,30]. The potential savings cost of implementation, investments and payback period were calculated.

3. Results and Discussion

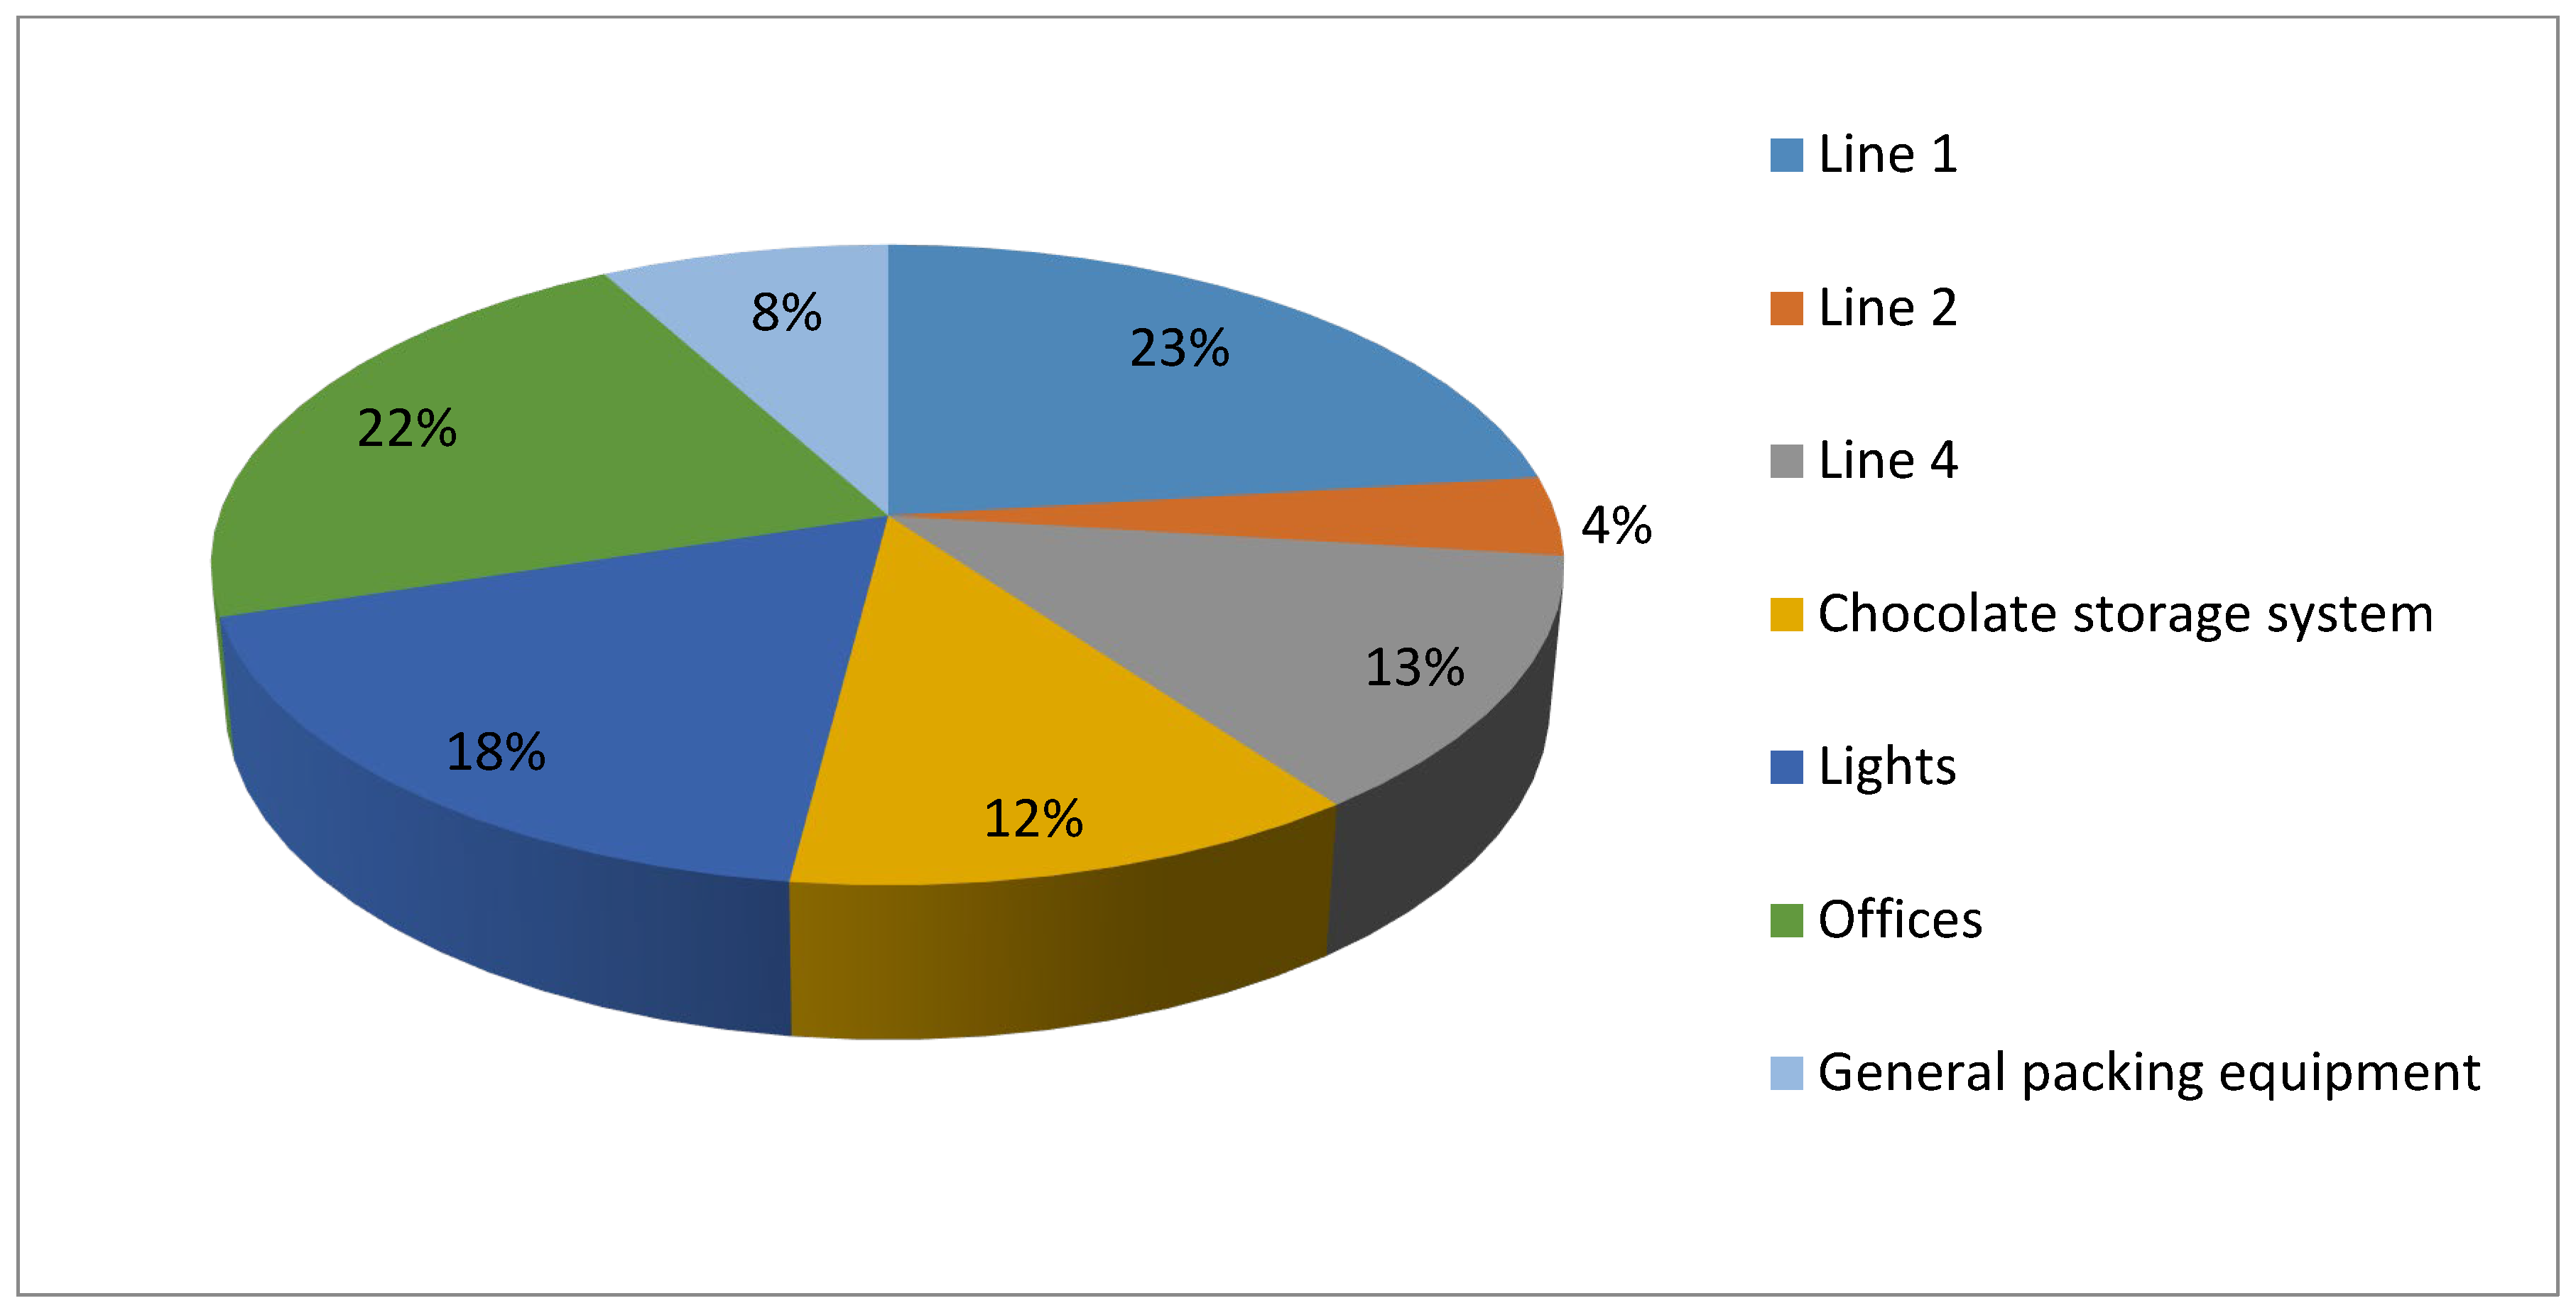
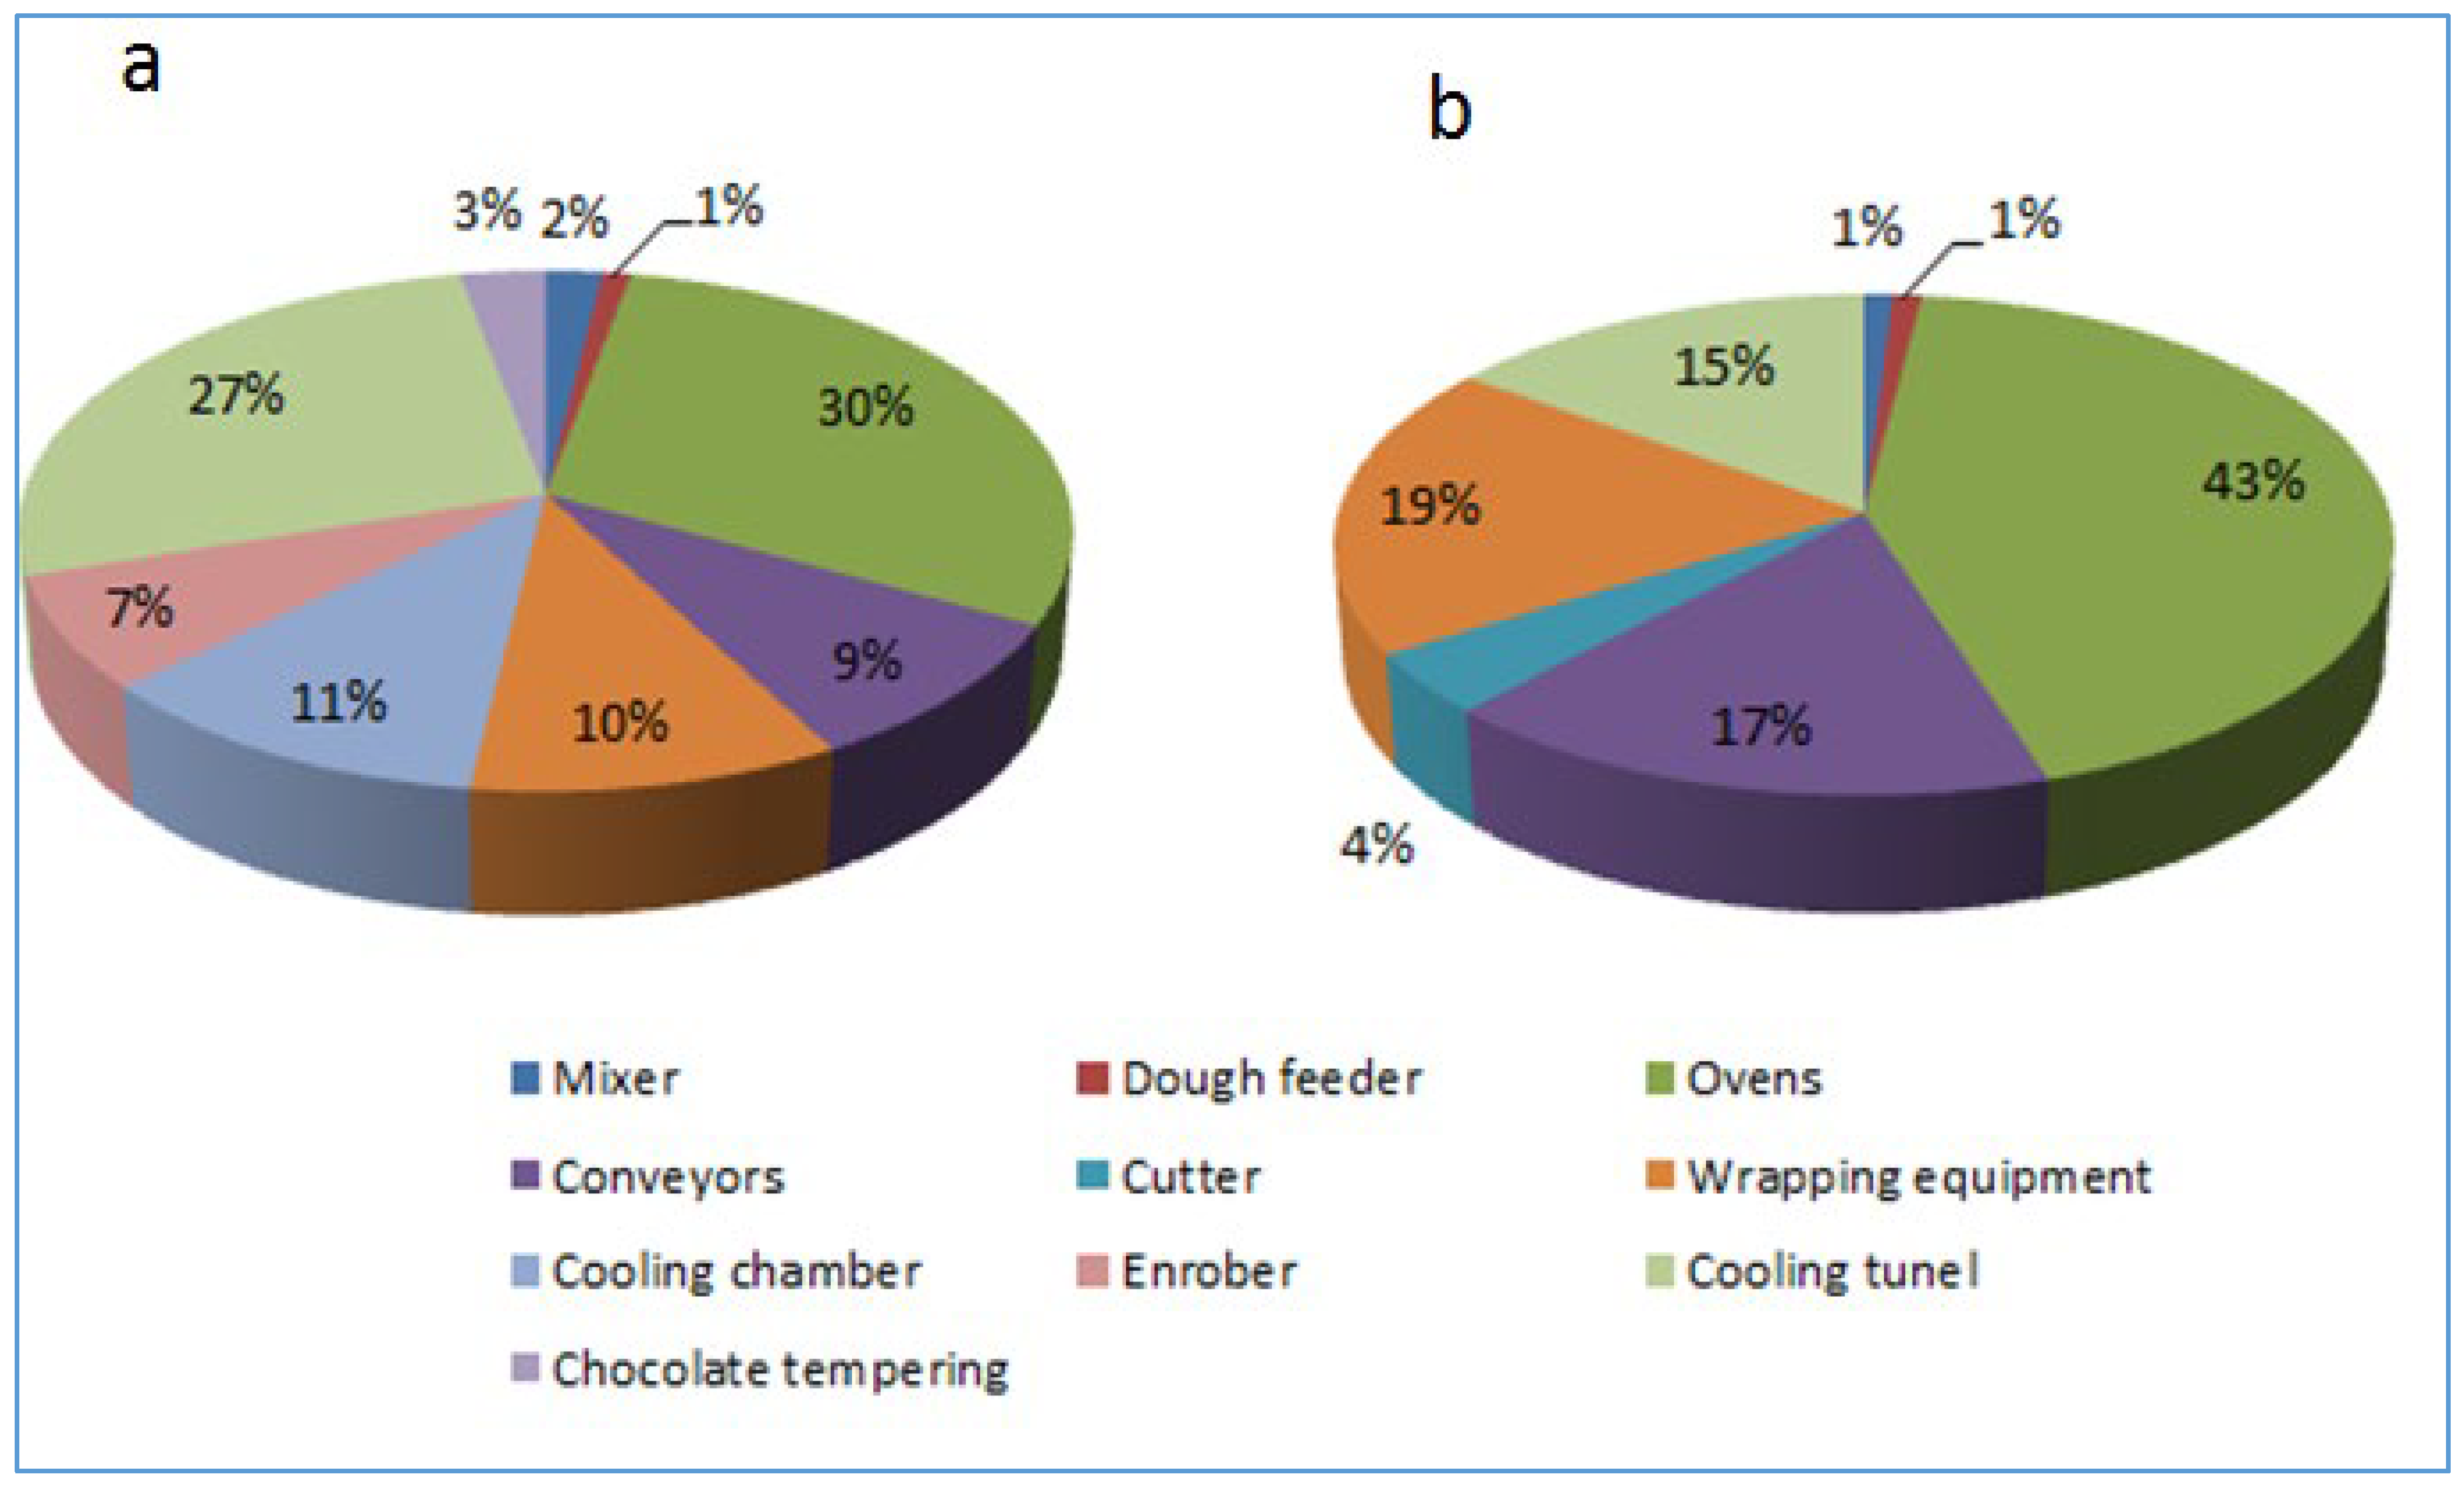
The overall energy consumption of the company is presented in Figure 2. It can be seen that 55% of the energy consumption comes from the production lines, chocolate storage systems and general packaging area while 45% to lights and offices. Figure 3 presents the energy breakdown of Line 1 and Line 4. It can be seen that the ovens are the most energy consuming appliances followed by conveyors, cooling tunnels, wrapping equipment, mixers, cutters and dough feeders. They account for 30%–43% of the overall energy use, which is in line with a number of studies previously reporting that ovens are the major contributors to inefficiency with higher energy consumption and CO2 emissions [10,20,21,22]. A number of improvements were considered to optimize their performances such as adjusting the baking temperature, turning off the ovens when not in use, good housekeeping including regular cleaning intervals, increased inspections, regular maintenance, oven insulation and utilisation of heat recovery [19,21,22,31]. Apart from the heat recovery, all mentioned measures have a very low implementation costs or an immediate return. The ovens used in this study are gas fired while the electrical load comes from electrical motors that run the single metallic conveyor, the combustion air fans and the convection fans. It has been reported that electric ovens are more energy efficient than direct-fired natural gas ovens, which generate large amounts of heat from the exhaust gases [10]. Depending on the type of operation, energy efficiency could be improved with optimization of the ovens [10,22] or use of the control systems in the ovens to lower the speed of the motor [21]. Another way of improving energy efficiency is to replace the existing electric motors with modern high efficiency motors. For instance, the electric motor that drives the metallic conveyor belt from the ovens was accessible and their identification plate stated an efficiency of 70.6%, which is low compared to modern motors with efficiencies of around 80% for the same size range. Applying this efficiency difference to the entire ovens load could result in 11.8% energy use reduction, which translates into 13 MWh savings annually. However, this type of improvements may not be technically feasible because the motors fitted inside the ovens may have special sizes and fittings.
Operational improvements represent reducing the operational hours from the equipment, maintaining productivity, and minimizing energy usage and consumption with no investment required. Holding equipment that do not require long pre-heating on reserve could save about 387 KWH energy [32]. This approach was applied to the cooling conveyor, hoist and depanner as they need only 5s to get ready and could save about 155 KWh energy over seven days [32]. The successful implementation of this type of improvement depends on training of the operation team, time management and cleaning periods of the production process. It could be applied to all production lines and other sections involved in the production process. Table 1 presents the recommended operational improvements of Line 1 and Line 4 in terms of turning off the equipment between productions, reducing the cleaning period and how the cooling system is used. It can be seen that the energy saving impacts on the total consumption varies from 0.4% to 6.8% and carbon reduction from 3.48 to 56.7t CO2. As a result, the projected cost savings over 20 years varies from EUR 21,304.00 to EUR 347,208.00 and carbon reduction from 21.1t CO2 to 429t CO2.
The technical improvements needing equipment modernization or replacement and investments are required. The new system design and investments were assessed on available data and a preliminary economic analysis was performed. It was identified that the best technical opportunities were based on modification of the actual lighting system, which can be more efficient or even redesigned to reduce the level of illumination while keeping it at appropriate levels. The new types of lamps have to be more efficient than the existing HID MH (~80 lm/W) and have a higher CRI value. Low pressure sodium (LPS) and high pressure sodium (HPS) could not be used due to their low CRI values (~20 Ra) which narrowed the choices to fluorescent and LED lamps. T8 fluorescent tubes are the most commonly used for the industrial applications, but their efficiency is very close to HID MH lamps. T5 high efficiency fluorescent tubes present higher efficacy values, averaging 95 lm/W for main manufacturers, and even above 100 lm/W on some specific models; therefore they were considered as a good option. Current LED replacement lamps have an average efficacy of 110 lm/W, and complete LED solutions can achieve higher efficacy values, but due to the light distribution properties and price may not always a best solution [31]. It was reported that LED lamps could save between 50% and 55% of energy with a considerable reduction of GHG emissions [33].
Based on the available technology and the actual system configuration the following three options were explored: (i) Installation of a completely new system with high efficiency fluorescent T5 technology; (ii) installation of a completely new system with LED technology; and (iii) resizing of the actual HID MH system to meet the required maintained illuminance values. Table 2 presents the summary of the projected technical improvements for complete redesign. It can be seen that total energy savings varied from 86.4 MWh to 159 MWh per year, resulting in cost savings and carbon reduction for the base year from EUR 9424.80 to EUR 16,255.40 and 43.5 tCO2 to 80 tCO2, respectively. Comparing the operational improvements presented in Table 1 and redesign improvement in Table 2, it can be seen that the most of the energy savings are provided by resizing of the lighting systems. In a study of hazelnut production, the highest energy savings of 24.8% were achieved with the electricity energy input which resulted with GHG emissions reduction of 35.5% [34]. Another approach for reducing GHG emissions is developing integration scenarios that involve heat transfer between different entities like a residential building, supermarket, confectionary, bakery plant or brewery [35]. This resulted in a 76% reduction of electricity and 76% of natural gas, which could lead to a decrease of GHG emissions by at least 14%.
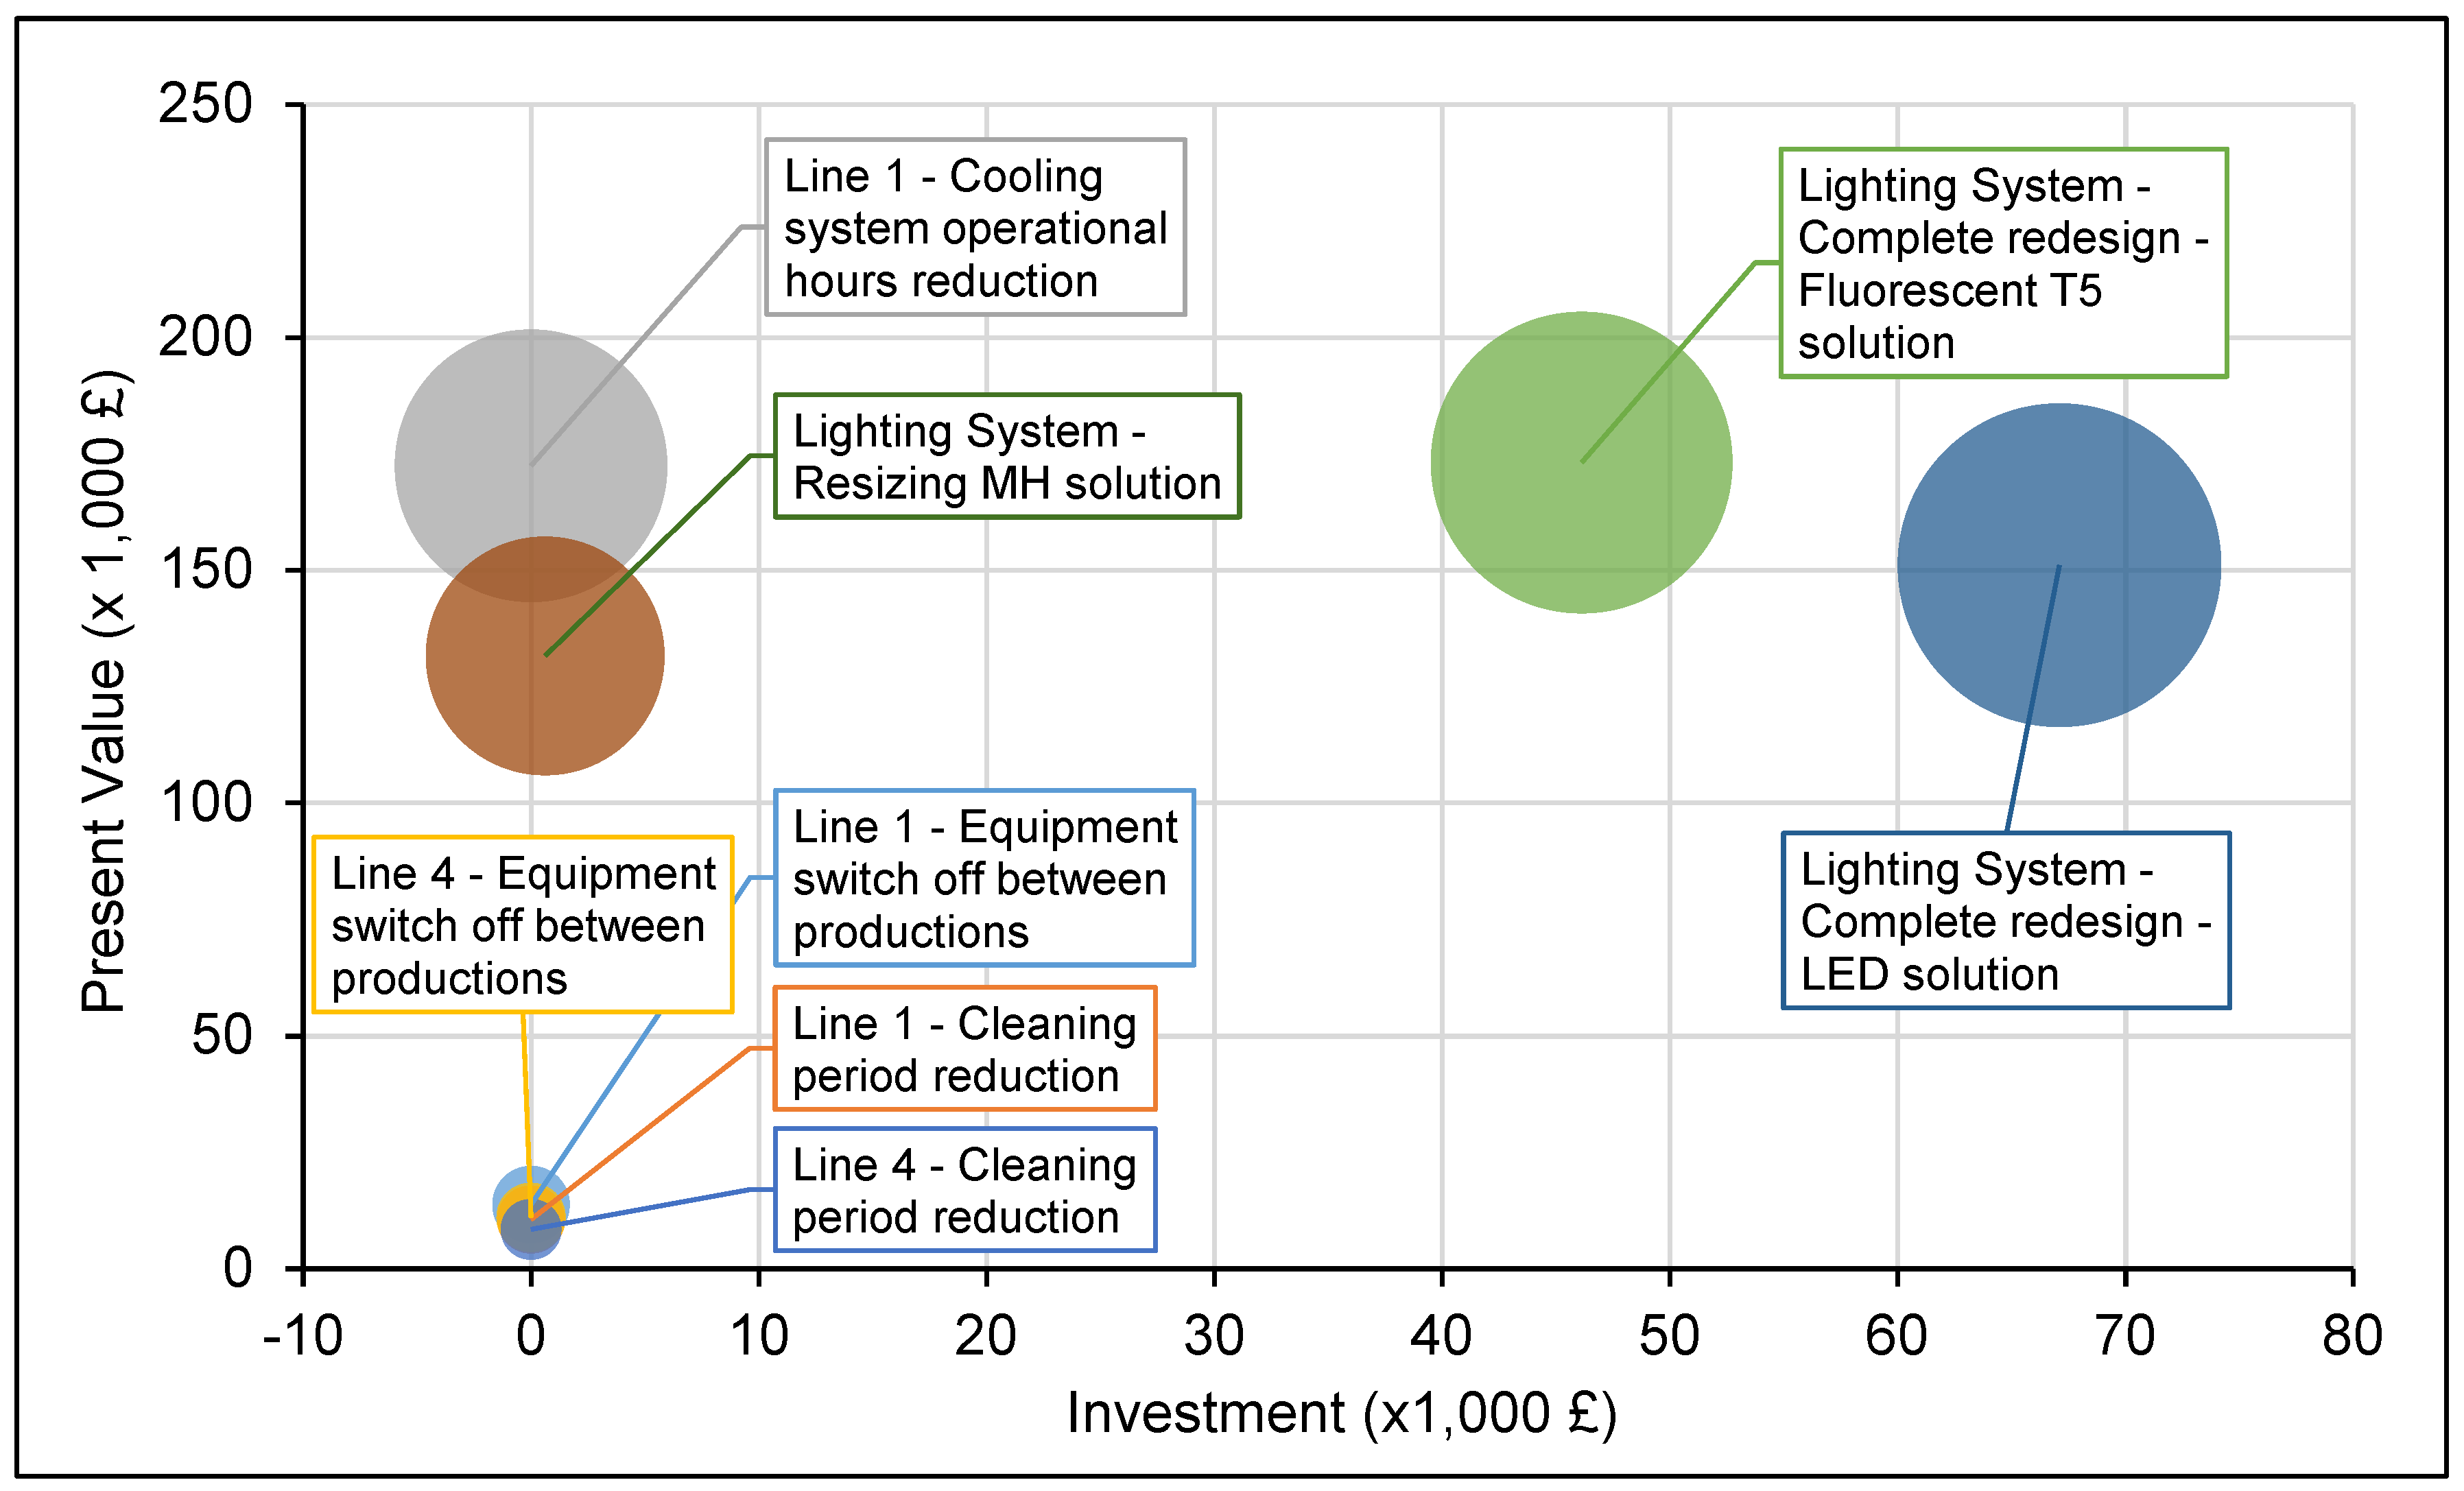
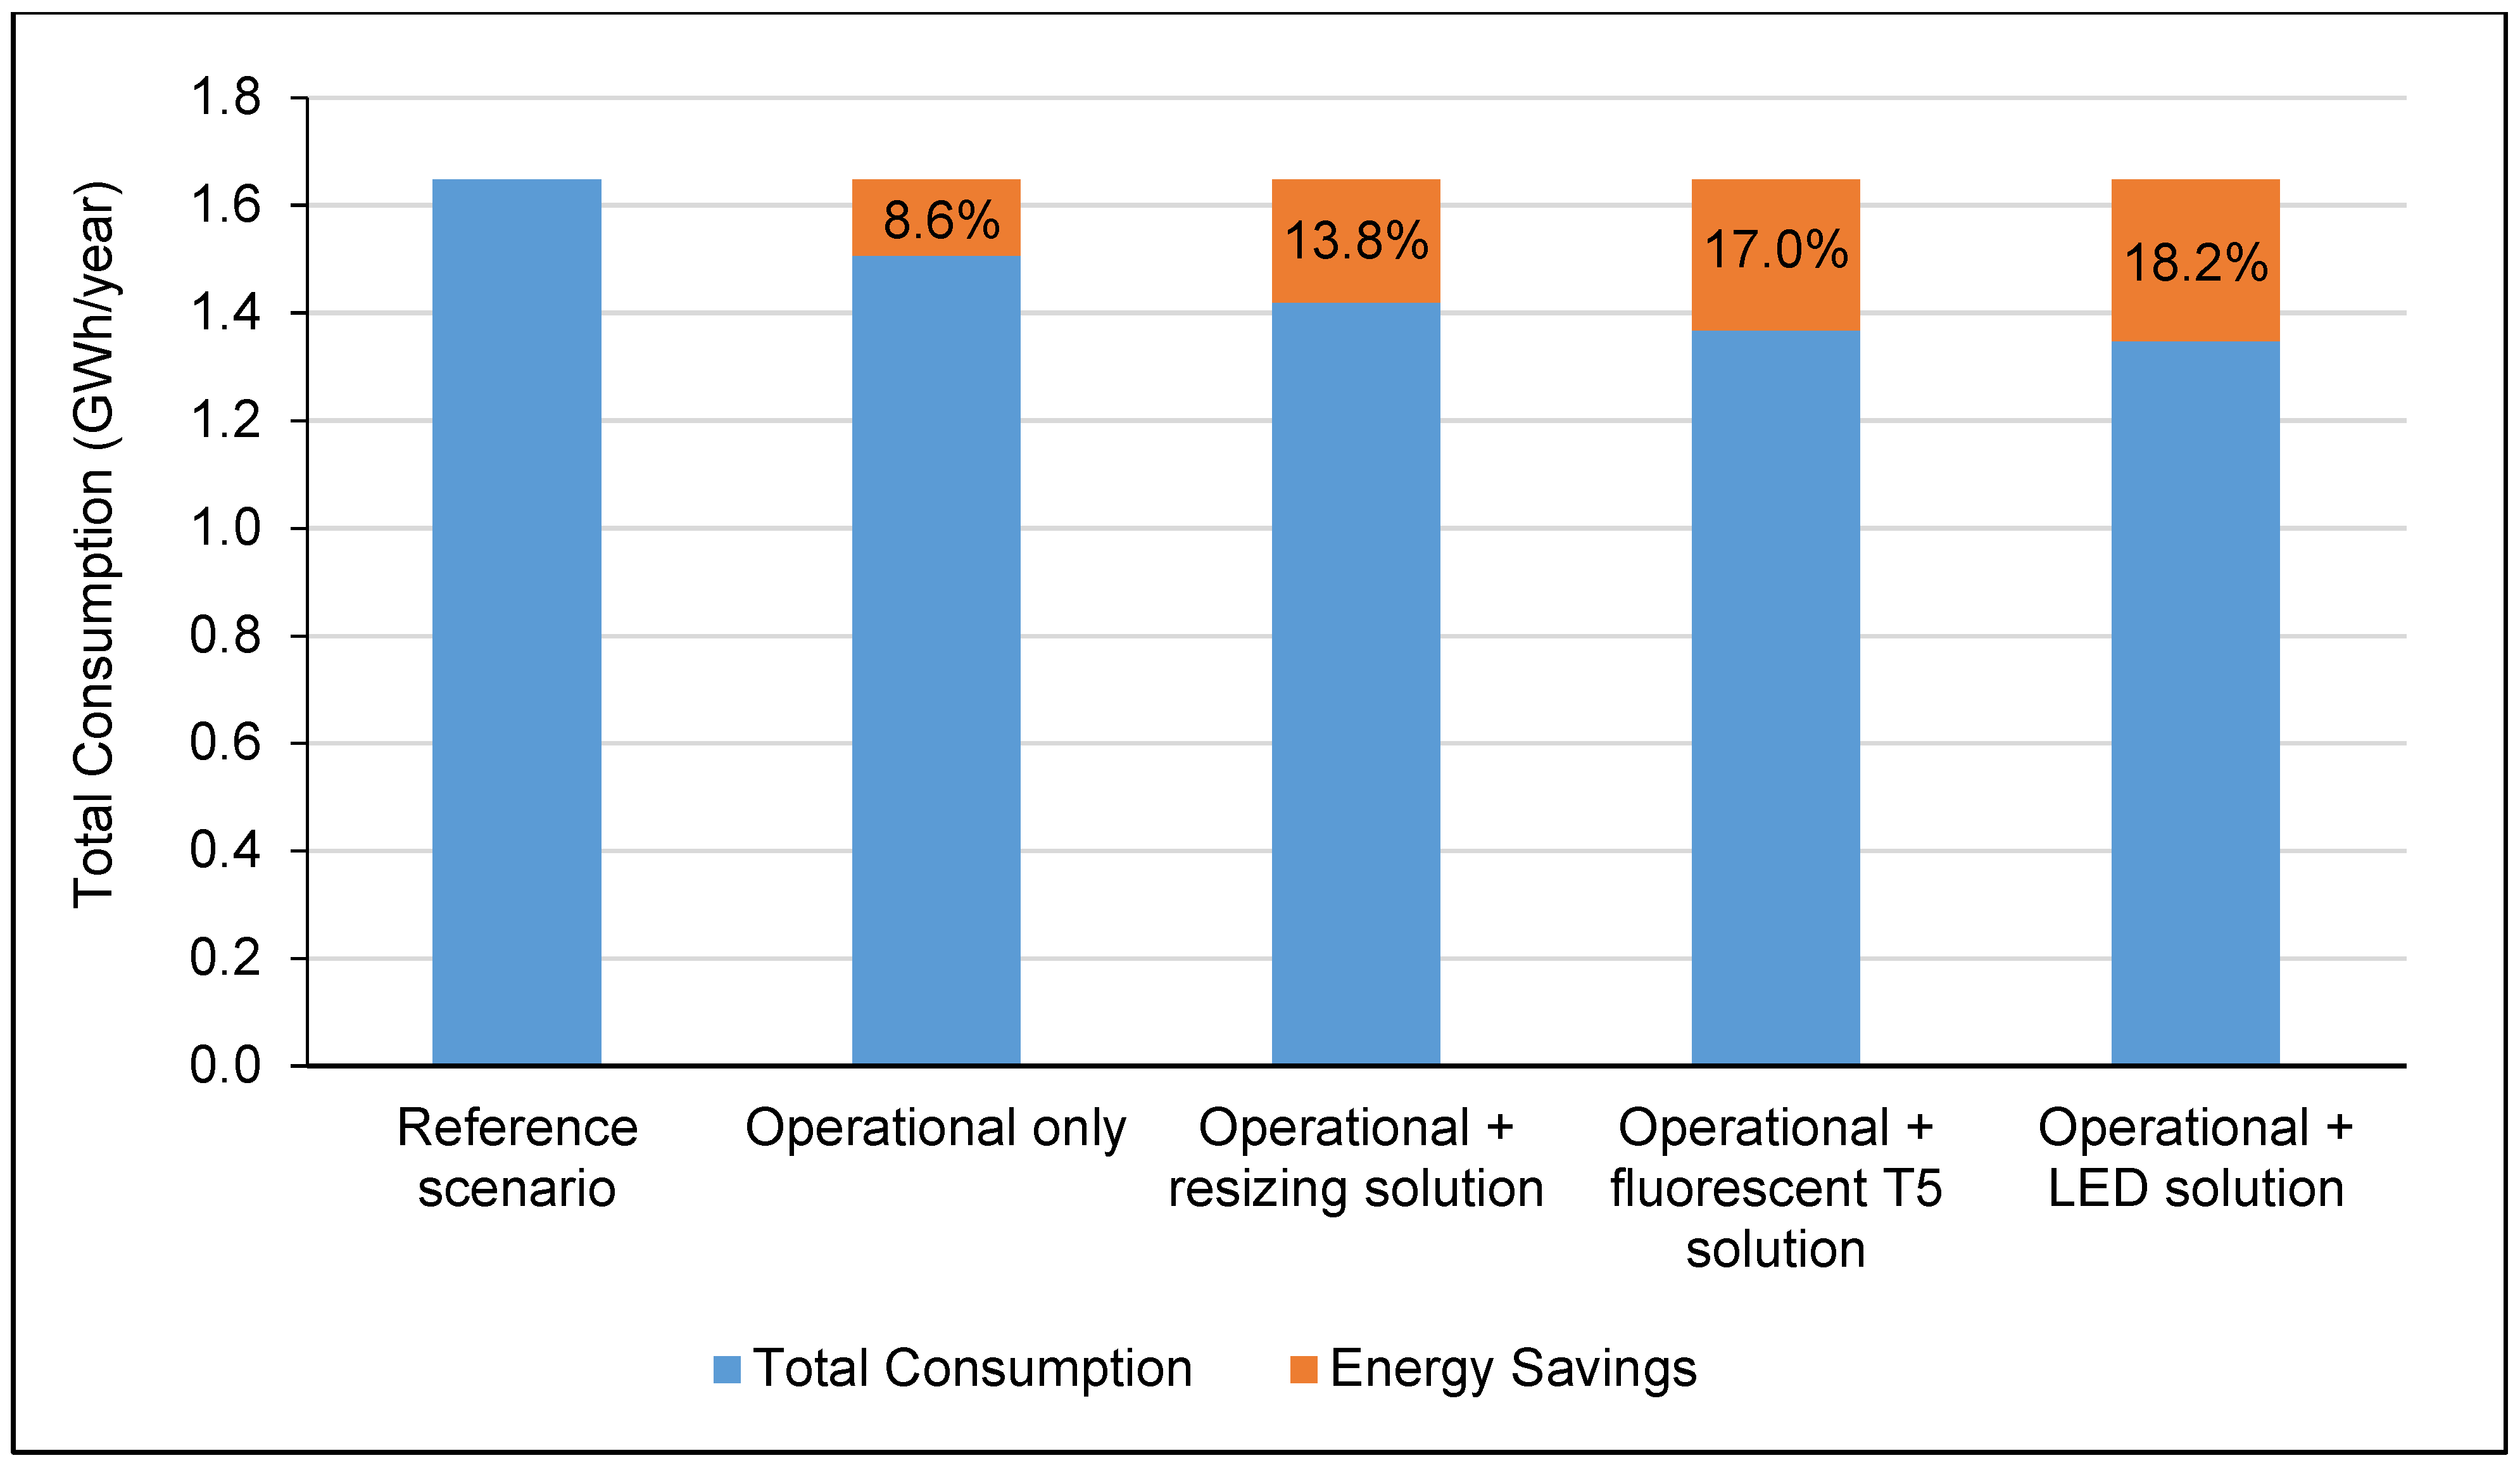
Figure 4 presents a comparison chart of the main parameters considered for the decision-making process and recommended improvements: implementation cost, present value and carbon emission savings. The implementation cost is given in the X-axis, the present value in the Y-axis and the carbon savings are represented by the diameter of the circle. As the three parameters are separately presented, they can be easily compared or even replaced by other parameters if they are more relevant for the decision makers. Considering the implementation cost as the most important parameter, the best improvements obtained in this study are the ones close to zero on the X-axis. In this case, the best option would be the resizing solution. If the cost saving is the most important parameter, the fluorescent T5 solution should be implemented, while for carbon reduction the LED solution with the larger diameter would be better. What kind of scenario is implemented will depend on the capital that company is willing to invest on technical improvements and environmental targets set up by the FDF1 agreement. In addition, all the operational improvements are independent and could be implemented separately or all together, while the proposed technical improvements are not independent as they contain different solutions. Therefore, the four possible scenarios of improvements presented in Figure 5 include: operational improvements only or operational improvements in combination with one of the technical improvements.
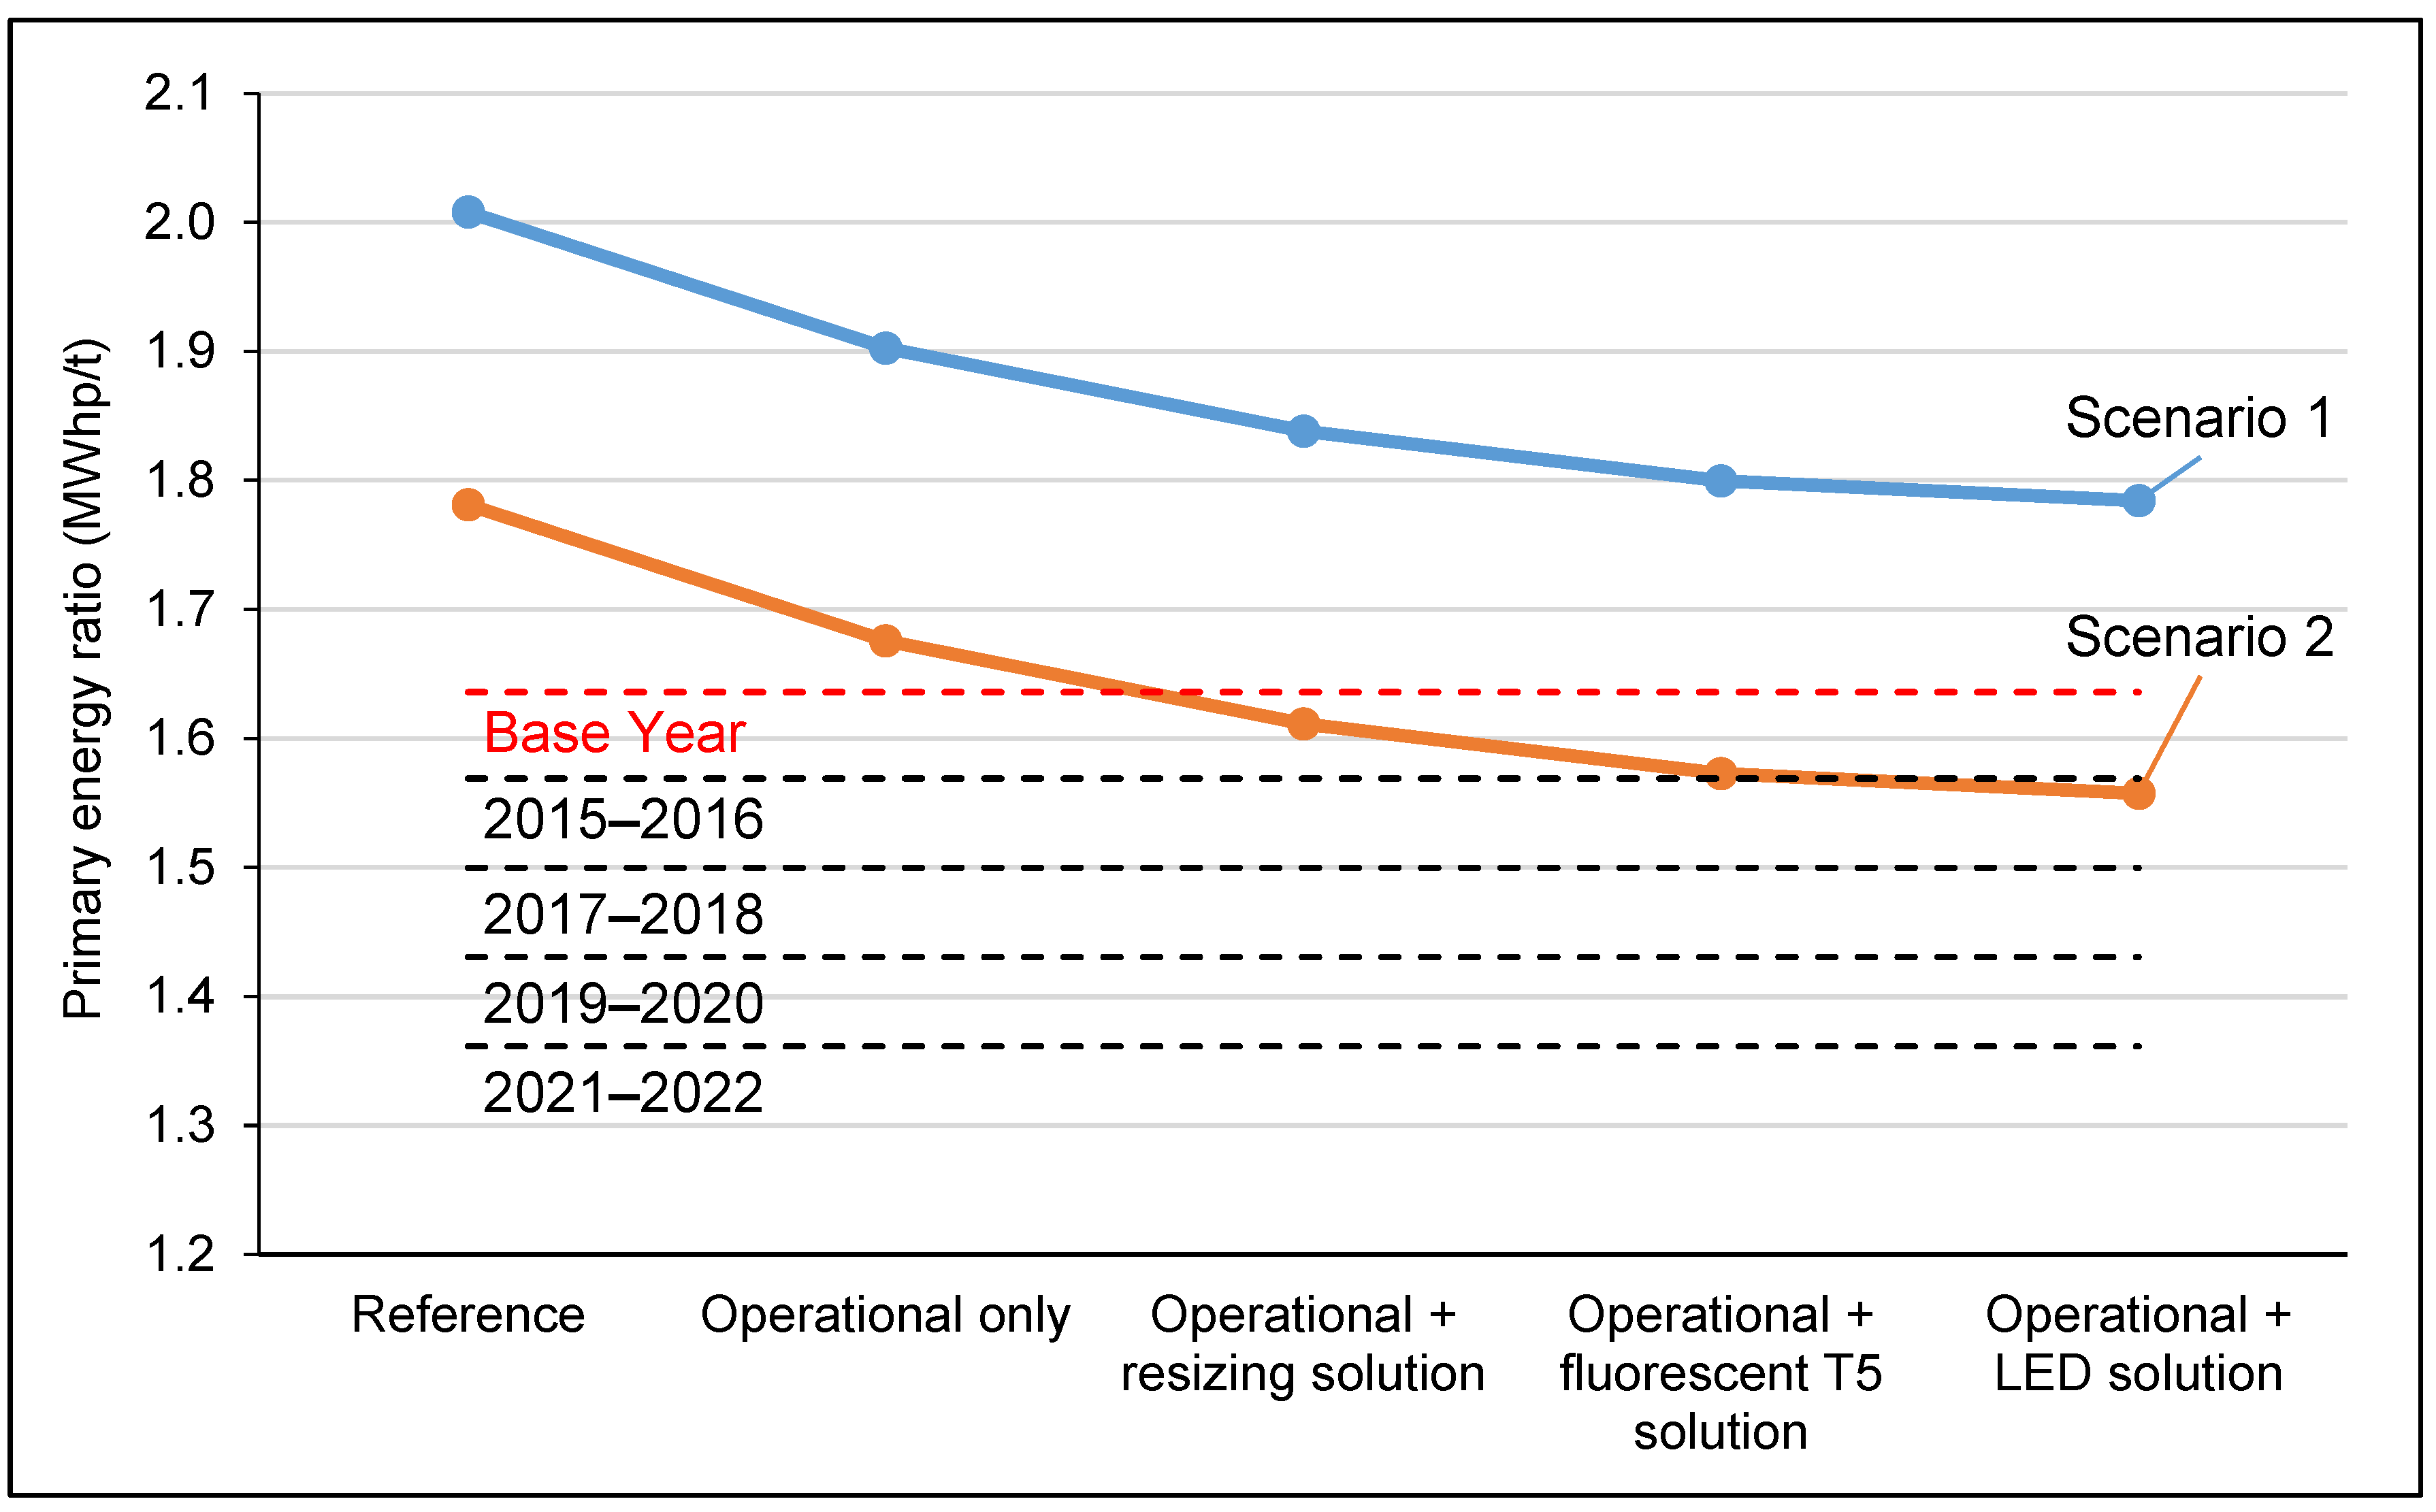
The reduction targets were calculated based on the ratio between primary energy consumption and total production (kWh/tonne) and compared to the base year over a 12-month period [26]. The primary energy consumption is the sum of the natural gas and electrical energy consumption, both converted to the primary energy using CCA technical annex conversion values [36]. The analysis showed that there was a significant variation in both electricity and natural gas ratios, which was partly related to the variation in production. More importantly, the natural gas ratio was consistently above the base year ratio, which has a great impact on the primary energy ratio. For instance, 2014 was taken as a reference year for this study; if the assumption of the natural gas ratio was made for the base year, then the variation of primary energy ratio would have been 8.9% instead of 23%. In order to estimate the impact of the proposed improvements towards reaching FDF1 targets, two different scenarios were created: (i) impact of the improvements on the actual situation, considering 2014 natural gas and electricity ratios, and (ii) impact of improvements removing natural gas variation, considering base year natural gas ratio and 2014 electricity ratio.
The two scenarios are presented in Figure 6, together with base year and FDF1 targets. From Scenario 1, it can be seen that the proposed improvements can reduce the electricity ratio by 7.4% compared to the base year value but they are not enough to reduce the primary energy ratio to the FDF1 targets. In order to achieve that, an electricity ratio reduction of 42% must be achieved, which is much higher than the proposed improvements. From Scenario 2, it can be seen that a 23% reduction in electricity use corresponds to all improvement opportunities identified in the production area. This scenario reinforces the importance of assessing the natural gas consumption in order to improve the overall energy efficiency and meet FDF1 targets.
From the proposed improvements, the analyses indicated that the company will most likely have to implement all the operational and technical improvements recommended in this study in order to meet FDF1 targets.

4. Conclusions

This study analysed the energy consumption of the biscuit manufacturing company, identified main energy users and proposed operational and technical improvements for enhancing overall energy efficiency and reducing GHG emissions. The experimental part included identification of the energy users, analysing monthly energy bills and operation time, as well as measurement of the energy consumption. The energy consumption and CO2 emissions were calculated and a number of options for improving sustainability were proposed. The energy use analyses identified potential savings relative to the total energy use of 23% by implementing operational and technical improvements, representing EUR 40,534.14 and 190 tCO2 annually. A total of 8.6% savings can be achieved with operational improvements and better managing of the production lines, which does not require any investment, representing EUR 15,500.00 and 70 tCO2 annually. The best technical improvements were obtained by redesigning the lighting system using LED technology, with the maximum savings of 9.6% representing EUR 17,287.00 and 80 tCO2 annually. The environmental targets set out by the FDF1 agreement could be achieved if all the operational and technical improvements identified in this study are implemented. The limitation of this study includes limited access to some of the energy data related to the production process. However, further work should include development of optimization model for energy efficiency improvement that will consider type of energy used, temperature requirements and energy consumption of each piece of equipment and transportation units involved in the production process.

Author Contributions

V.S. designed and review the paper, N.P. conducted measurements and wrote some of the sections and S.T. provided an advice. All authors have read and agreed to the published version of the manuscript.

Funding

This research was funded by Innovate, UK, project number 9484.

Institutional Review Board Statement

Not applicable.

Informed Consent Statement

Not applicable.

Data Availability Statement

Not applicable.

Conflicts of Interest

The authors declare no conflict of interest.

Abbreviations

%percentage
CO2Carbon Dioxide
CRIColour Rendering Index
DECCDepartment of Energy & Climate Change
Eenergy
EUEuropean Union
EU Emissions Trading SystemEU ETS
FDFFood and Drink Federation
GHGGreen House Gas
GWgigawatt
hhour
HID MHhigh intensity discharge and metal halide
LEDLight-emitting diode
Lmlumens
MtMegatonnes
MWMegawatt
RaRendering Score
ttonne
WWatt
wweek
yyear

References

  1. European Environmental Agency (EEA). Sectoral Greenhouse Gas Emissions by IPCC Sector. 2016. Available online: https://www.eea.europa.eu/data-and-maps/daviz/change-of-co2-eq-emissions-2#tab-dashboard-01 (accessed on 1 December 2021).
  2. Garnett, T. Where are the best opportunities for reducing greenhouse gas emissions in the food system (including the food chain)? Food Policy 2011, 36, S23–S32. [Google Scholar] [CrossRef]
  3. WWF. Emissions from UK Food Industry Far Higher than Believed. 2017. Available online: https://www.wwf.org.uk/updates/emissions-uk-food-industry-far-higher-believed (accessed on 1 December 2021).
  4. DECC-Department of Energy and Climate Change. Updated Energy and Emissions Projections; Statistics; The National Archive: London, UK, 2014. [Google Scholar]
  5. Dorward, L.J. Where are the best opportunities for reducing greenhouse gas emissions in the food system (including the food chain)? A comment. Food Policy 2012, 37, 463–466. [Google Scholar] [CrossRef]
  6. Garnett, T. Three perspectives on sustainable food security: Efficiency, demand restraint, food system transformation. What role for life cycle assessment? J. Clean. Prod. 2014, 73, 10–18. [Google Scholar] [CrossRef]
  7. Noya, L.I.; Vasilaki, V.; Stojceska, V.; González-García, S.; Kleynhans, C.; Tassou, S.; Moreira, M.T.; Katsou, E. An environmental evaluation of food supply chain using life cycle assessment: A case study on gluten free biscuit products. J. Clean. Prod. 2018, 170, 451–461. [Google Scholar] [CrossRef]
  8. Wang, L. Energy efficiency technologies for sustainable food processing. Energy Effic. 2014, 7, 791–810. [Google Scholar] [CrossRef]
  9. Tassou, S.; Kolokotroni, M.; Gowreesunker, B.; Stojceska, V.; Azapagic, A.; Fryer, P.; Bakalis, S. Energy demand and reduction opportunities in the UK food chain. Proc. Inst. Civ. Eng. Energy 2015, 167, 162–170. [Google Scholar] [CrossRef]
  10. Ladha-Sabura, A.; Bakalis, S.; Peter, J.; Fryer, P.; Lopez-Quiroga, E. Review Mapping energy consumption in food manufacturing. Trends Food Sci. Technol. 2019, 86, 270–280. [Google Scholar] [CrossRef]
  11. Fischer, J.R.; Blackman, J.E.; Finnell, J.A. Industry and energy: Challenges and opportunities. Eng. Technol. A Sustain. World 2007, 4, 8–9. [Google Scholar]
  12. Muller, D.C.A.; Marechal, F.M.A.; Wolewinski, T.; Roux, P.J. An energy management method for the food industry. Appl. Therm. Eng. 2007, 27, 2677–2686. [Google Scholar] [CrossRef]
  13. Muster-Slawitsch, B.; Weiss, W.; Schnitzer, H.; Brunner, C. The green brewery concept-Energy efficiency and the use of renewable energy sources in breweries. Appl. Therm. Eng. 2011, 31, 2123–2134. [Google Scholar] [CrossRef] [Green Version]
  14. Celma, A.R.; Blázquez, F.C.; López-Rodríguez, F. Feasibility analysis of CHP in an olive processing industry. J. Clean. Prod. 2013, 42, 52–57. [Google Scholar] [CrossRef]
  15. Hosseinzadeh-Bandbafha, H.; Nabavi-Pelesaraei, A.; Khanali, M.; Ghahderijani MChau, K.W. Application of data envelopment analysis approach for optimization of energy use and reduction of greenhouse gas emission in peanut production of Iran. J. Clean. Prod. 2018, 172, 1327–1335. [Google Scholar] [CrossRef]
  16. Nabavi-Pelesaraei, A.; Abdi, R.; Rafiee, S.; Bagheri, I. Determination of efficient and inefficient units for watermelon production-a case study: Guilan province of Iran. J. Saudi Soc. Agric. Sci. 2016, 15, 162–170. [Google Scholar] [CrossRef] [Green Version]
  17. Qasemi-Kordkheili, P.; Nabavi-Pelesaraei, A. Optimization of energy required and potential of greenhouse gas emissions reductions for nectarine production using data envelopment analysis approach. Int. J. Energy Environ. 2014, 5, 207–218. [Google Scholar]
  18. FeHosseinzadeh-Bandbafha, H.; Safarzadeh, D.; Ahmadi, E.; Nabavi-Pelesaraei AHosseinzadeh-Bandbafha, E. Applying data envelopment analysis to evaluation of energy efficiency and decreasing of greenhouse gas emissions of fattening farms. Energy 2017, 120, 652–662. [Google Scholar] [CrossRef]
  19. Meyers, S.; Schmitt, B.; Chester-Jones MSturm, B. Energy efficiency, carbon emissions, and measures towards their improvement in the food and beverage sector for six European countries. Energy 2016, 104, 266–283. [Google Scholar] [CrossRef]
  20. Carbon Trust. Industrial Energy Efficiency Accelerator. Guide to the Industrial Bakery Sector. 2016. Available online: www.carbontrust.com (accessed on 1 December 2021).
  21. Therkelsen, P.; Masanet EWorrell, E. Energy efficiency opportunities in the U.S. commercial baking industry. J. Food Eng. 2014, 130, 14–22. [Google Scholar] [CrossRef]
  22. Khatir, Z.; Paton, J.; Thompson, H.; Kapur, N.; Toropov, V. Optimisation of the energy efficiency of bread-baking ovens using a combined experimental and computational approach. Appl. Energy 2013, 112, 918–927. [Google Scholar] [CrossRef]
  23. Paton, J.; Khatir, Z.; Thompson, H.; Kapur, N.; Toropov, V. Thermal energy management in the bread baking industry using a system modelling approach. Appl. Therm. Eng. 2013, 53, 340–347. [Google Scholar] [CrossRef]
  24. Dora, M.; Gellynck, X. House of lean for food processing SMEs. Trends Food Sci. Technol. 2015, 44, 272–281. [Google Scholar] [CrossRef]
  25. European Commission. 2020 Climate & Energy Package. 2017. Available online: https://ec.europa.eu/clima/eu-action/climate-strategies-targets/2020-climate-energy-package_en#:~:text=The%202020%20package%20is%20a%20set%20of%20laws,1990%20levels%29%2020%25%20of%20EU%20energy%20from%20renewables (accessed on 1 December 2021).
  26. Environment Agency. Umbrella Climate Change Agreement for the Food and Drink Sector; Agreement; The Government Digital Service: London, UK, 2013. [Google Scholar]
  27. DEFRA-Department for Environment, Food & Rural Afairs. Guidelines to Defra/DECC’s GHG Conversion Factors for Company Reporting; Guideline; AEA: London, UK, 2012. [Google Scholar]
  28. The Society of Light and Lighting. Lighting Guide 1: The Industrial Environment; Guideline; CIBSE: London, UK, 2012. [Google Scholar]
  29. The Society of Light and Lighting. The SLL Lighting Handbook; Handbook; CIBSE: London, UK, 2009. [Google Scholar]
  30. The Society of Light and Lighting. The SLL Code for Lighting; Code; IBSE: London, UK, 2012. [Google Scholar]
  31. Kannan, R.; Boie, W. Energy management practices in SME—Case study of a bakery in Germany. Energy Convers. Manag. 2003, 44, 945–959. [Google Scholar] [CrossRef]
  32. Wang, Y.; Li, K.; Gan, S.; Cameron, C. Analysis of energy saving potentials in intelligent manufacturing: A case study of bakery plants. Energy 2019, 172, 477–486. [Google Scholar] [CrossRef]
  33. De Almeida, A.; Santos, B.; Paolo, B.; Quicheron, M. Solid state lighting review–Potential and challenges in Europe. Renew. Sustain. Energy Rev. 2014, 34, 30–48. [Google Scholar] [CrossRef]
  34. Sabzevari, A.; Nabavi-Pelesaraei, A. Prognostication of total greenhouse gas emissions and economic indices for hazelnut production in Guilan province, Iran. J. Biodivers. Environ. Sci. 2015, 6, 132–140. [Google Scholar]
  35. Ruonan, Li.; Mahalec, V. Greenhouse gas emissions reduction by cross-sector integration of energy systems: Optimal sizing of integrated entities. Energy Convers. Manag. 2021, 248, 114788. [Google Scholar]
  36. DECC-Department of Energy and Climate Change. Climate Change Agreements: 2013 Technical Annex; DECC-Department of Energy and Climate Change: London, UK, 2013; p. 10. [Google Scholar]
Figure 1. Equipment layout of Production line 1. (A—dough feeder, B—cutter, C—oven, D—cooling chamber, E—enrober, F—a chocolate tempering machine, G—chocolate storage system, H—cooling tunnel, I—packaging area, J—metal check, K—final packing.
Sustainability 14 00069 g001
Figure 2. Energy breakdown of the company.
Sustainability 14 00069 g002
Figure 3. Energy breakdown of Line 1 (a) and Line 4 (b).
Sustainability 14 00069 g003
Figure 4. Proposed alternatives for energy efficiency improvements.
Sustainability 14 00069 g004
Figure 5. Different improvement scenarios.
Sustainability 14 00069 g005
Figure 6. Proposed scenarios for FDF1 targets.
Sustainability 14 00069 g006
Table 1. Projected operational improvements for Line 1 (a) and Line 4 (b) including cost saving and carbon reduction.
(a)
ParameterEquipment Switched Off between ProductionsCleaning Period ReductionCooling System Operational Hours Reduction
Energy Savings (MWh/y)9.0 6.9 112.7
Energy Savings Impact on Total Consumption (%)0.500.406.80
Cost Savings (base year) (EUR)990.00750.0012,320.00
Cost Savings (projected 20 years) (EUR)27,762.0021,304.00347,208.00
Present energy value (EUR)16,431.0012,606.00205,465.00
Carbon reduction (base year) (tCO2)4.54 3.48 56.7
Carbon reduction (projected 20 years) (tCO2)34.3 26.3 429
(b)
ParameterEquipment Switched off between ProductionsCleaning Period Reduction
Energy Savings (MWh/y)7.2 5.5
Energy Savings Impact on Total Consumption (%)0.40.3
Cost Savings (base year) (EUR)786.40607.07
Cost Savings (projected 20 years) (EUR)222,209.0017,040.00
Present energy value (EUR)13,142.0010,080.00
Carbon reduction (base year) (tCO2)3.63 2.79
Carbon reduction (projected 20 years) (tCO2)27.4 21.1
Table 2. Summary of the complete redesign improvements (Fluorescent T5 solution and LED solution) and resizing of the existing system (LED solution).
Technical DetailsComplete RedesignResizing of the Existing System
Fluorescent T5 SolutionLED SolutionLED Solution
Distributed annual failure rate (%)12821
Life expectancy (h)25,00040,00015,000
Investment (EUR)48,932.879,843.05737.80
Fixtures (enclosed, 2 tubes) (EUR)34,718.2540,430.250
T5 tube (35 W, highly efficient, 1500 mm) (EUR)2314.5521,562.80737.80
Others (design, cables, control system, installation) (EUR)17,85017,8500
Operational Costs (average) (EUR)821.104188.801237.60
Annual maintenance cost (EUR)289.171677.90595
25,000 h replacement cost (EUR)1157.5010,781.401356.60
Energy Savings (MWh/y)138.1159.086.4
Energy Savings Impact on Total Consumption (%)8.409.605.20
Cost Savings (base year) (EUR)15,362.9016,255.409424.80
Cost Savings (projected 20 years) (EUR)436,289.70427,055.30265,834.10
Present Value (EUR) 206,012.80179,797.10156,615.90
Internal Rate of Return (%)45.2029.501380
Payback Period (years)3.34.5 <1.0
Carbon Savings (base year) (tCO2)69.580.043.5
Carbon Savings (projected 20 years) (tCO2)525605329
Publisher’s Note: MDPI stays neutral with regard to jurisdictional claims in published maps and institutional affiliations.