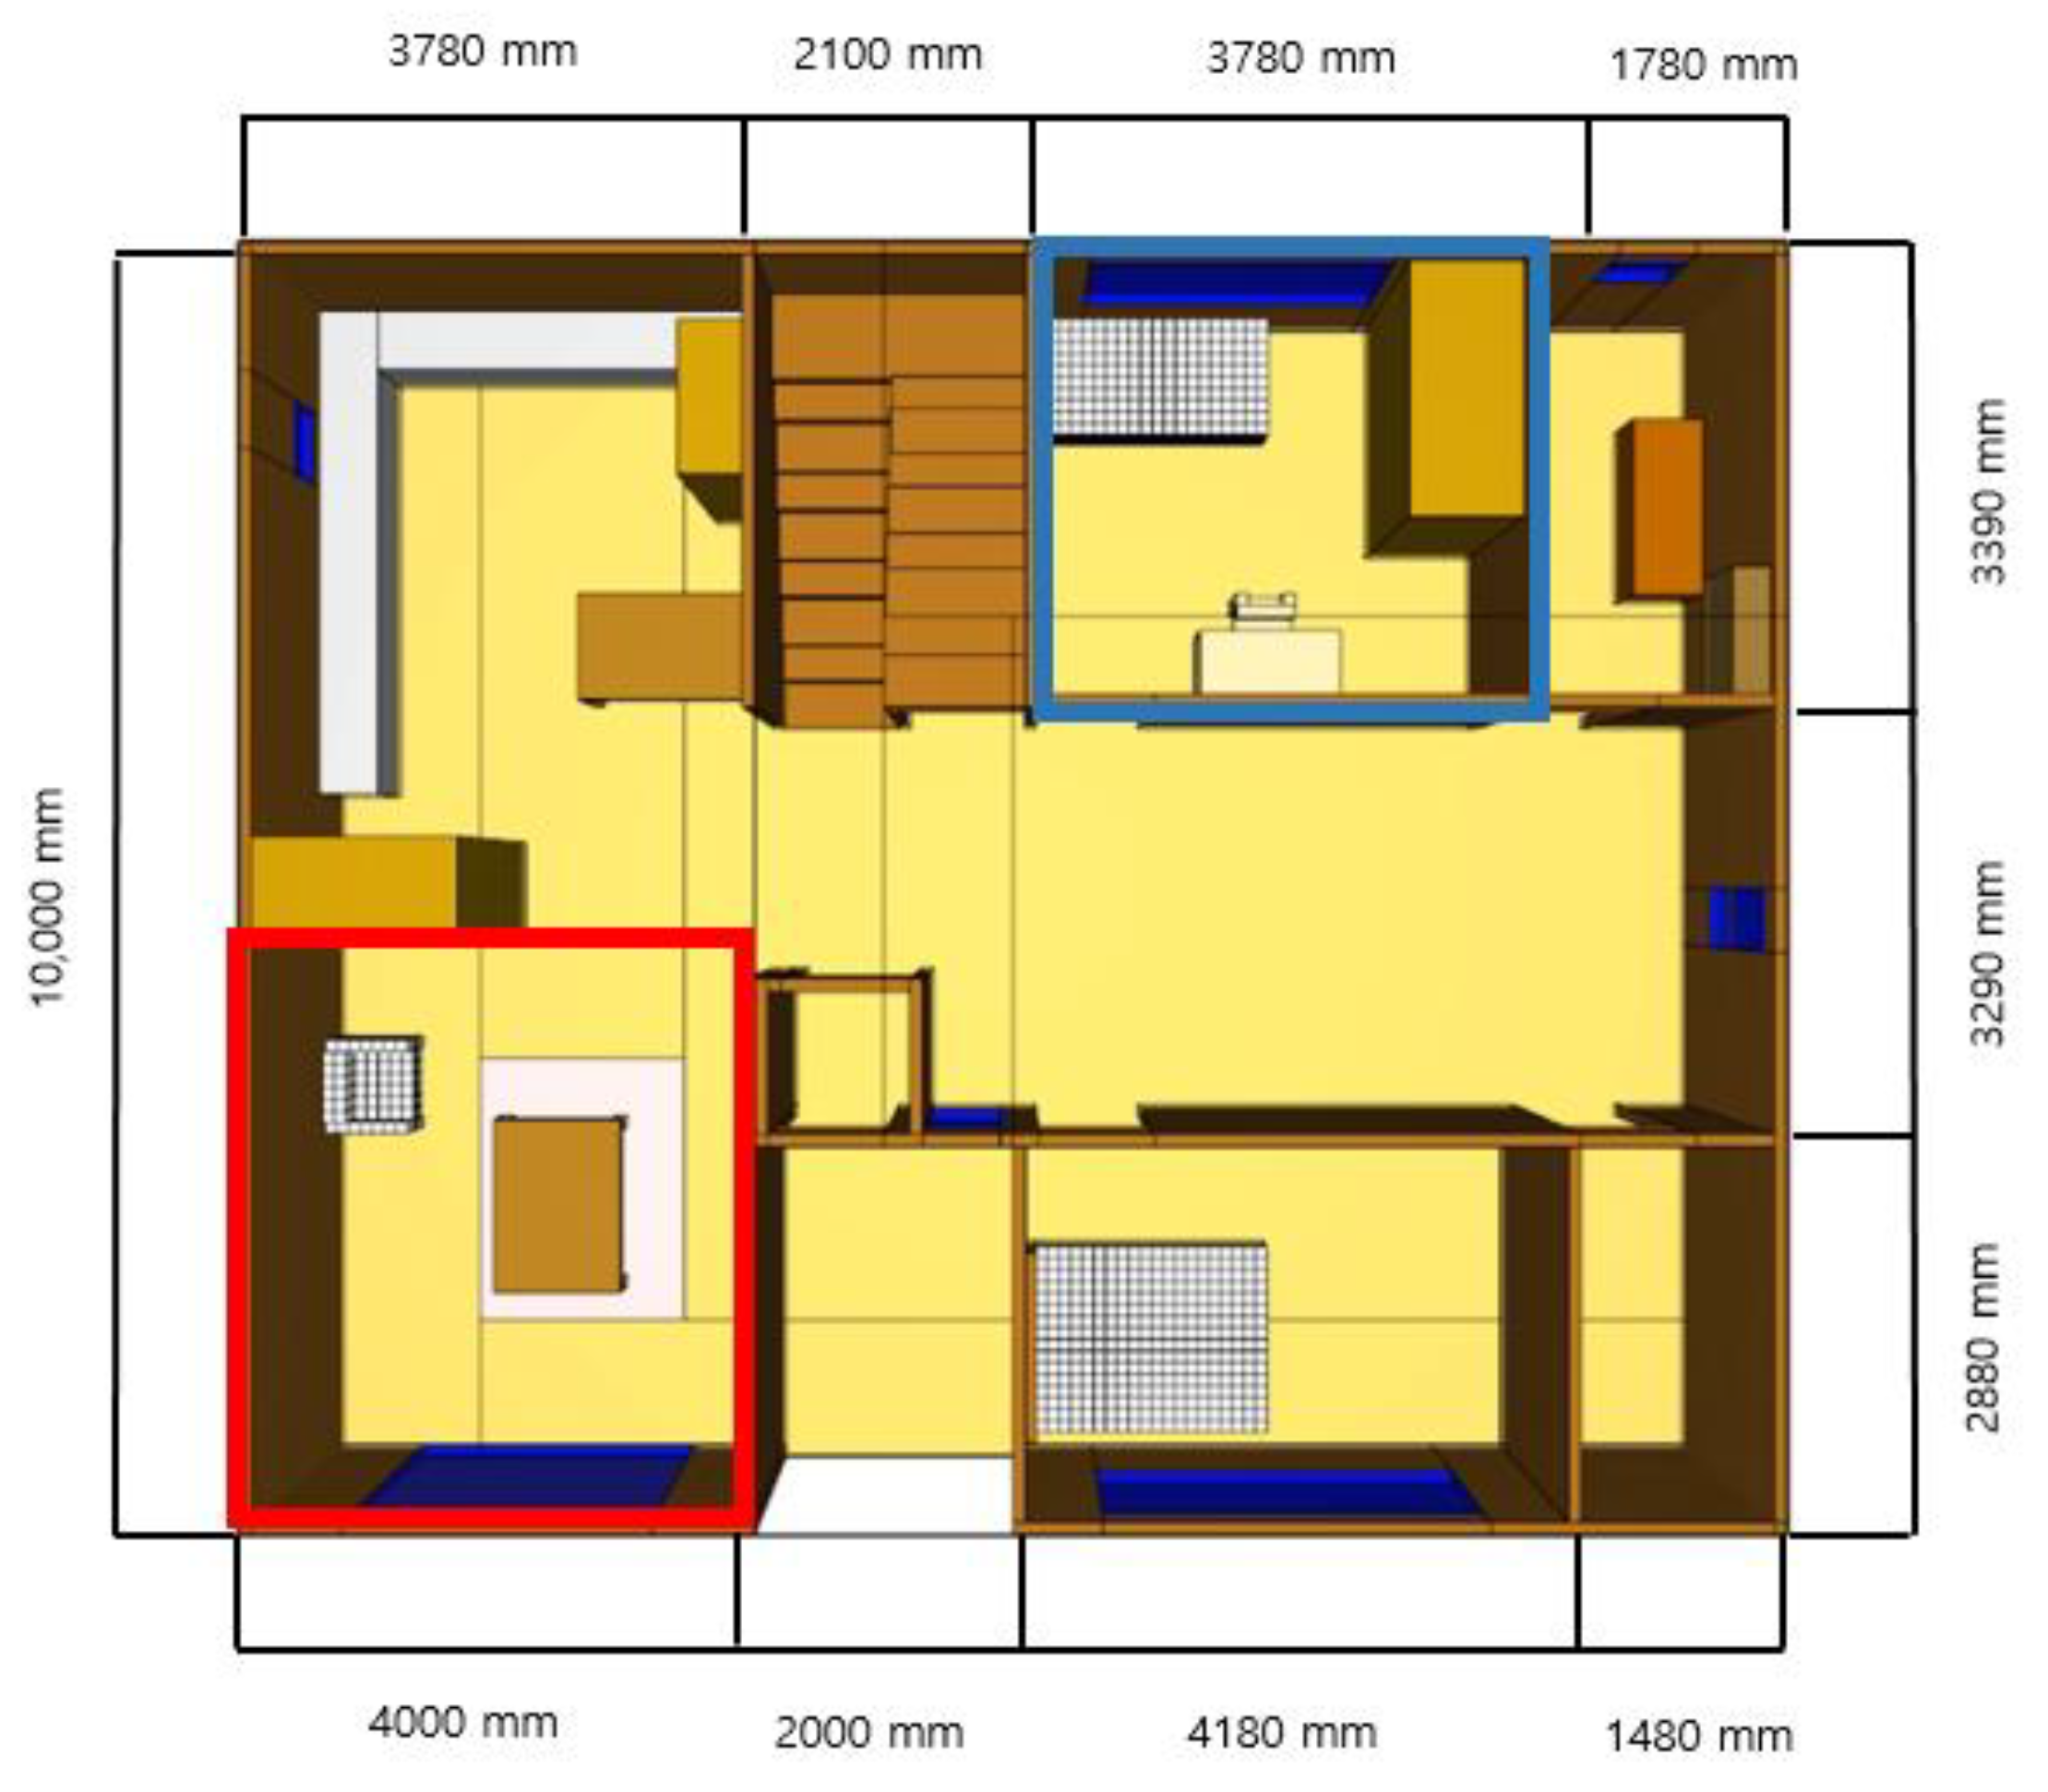
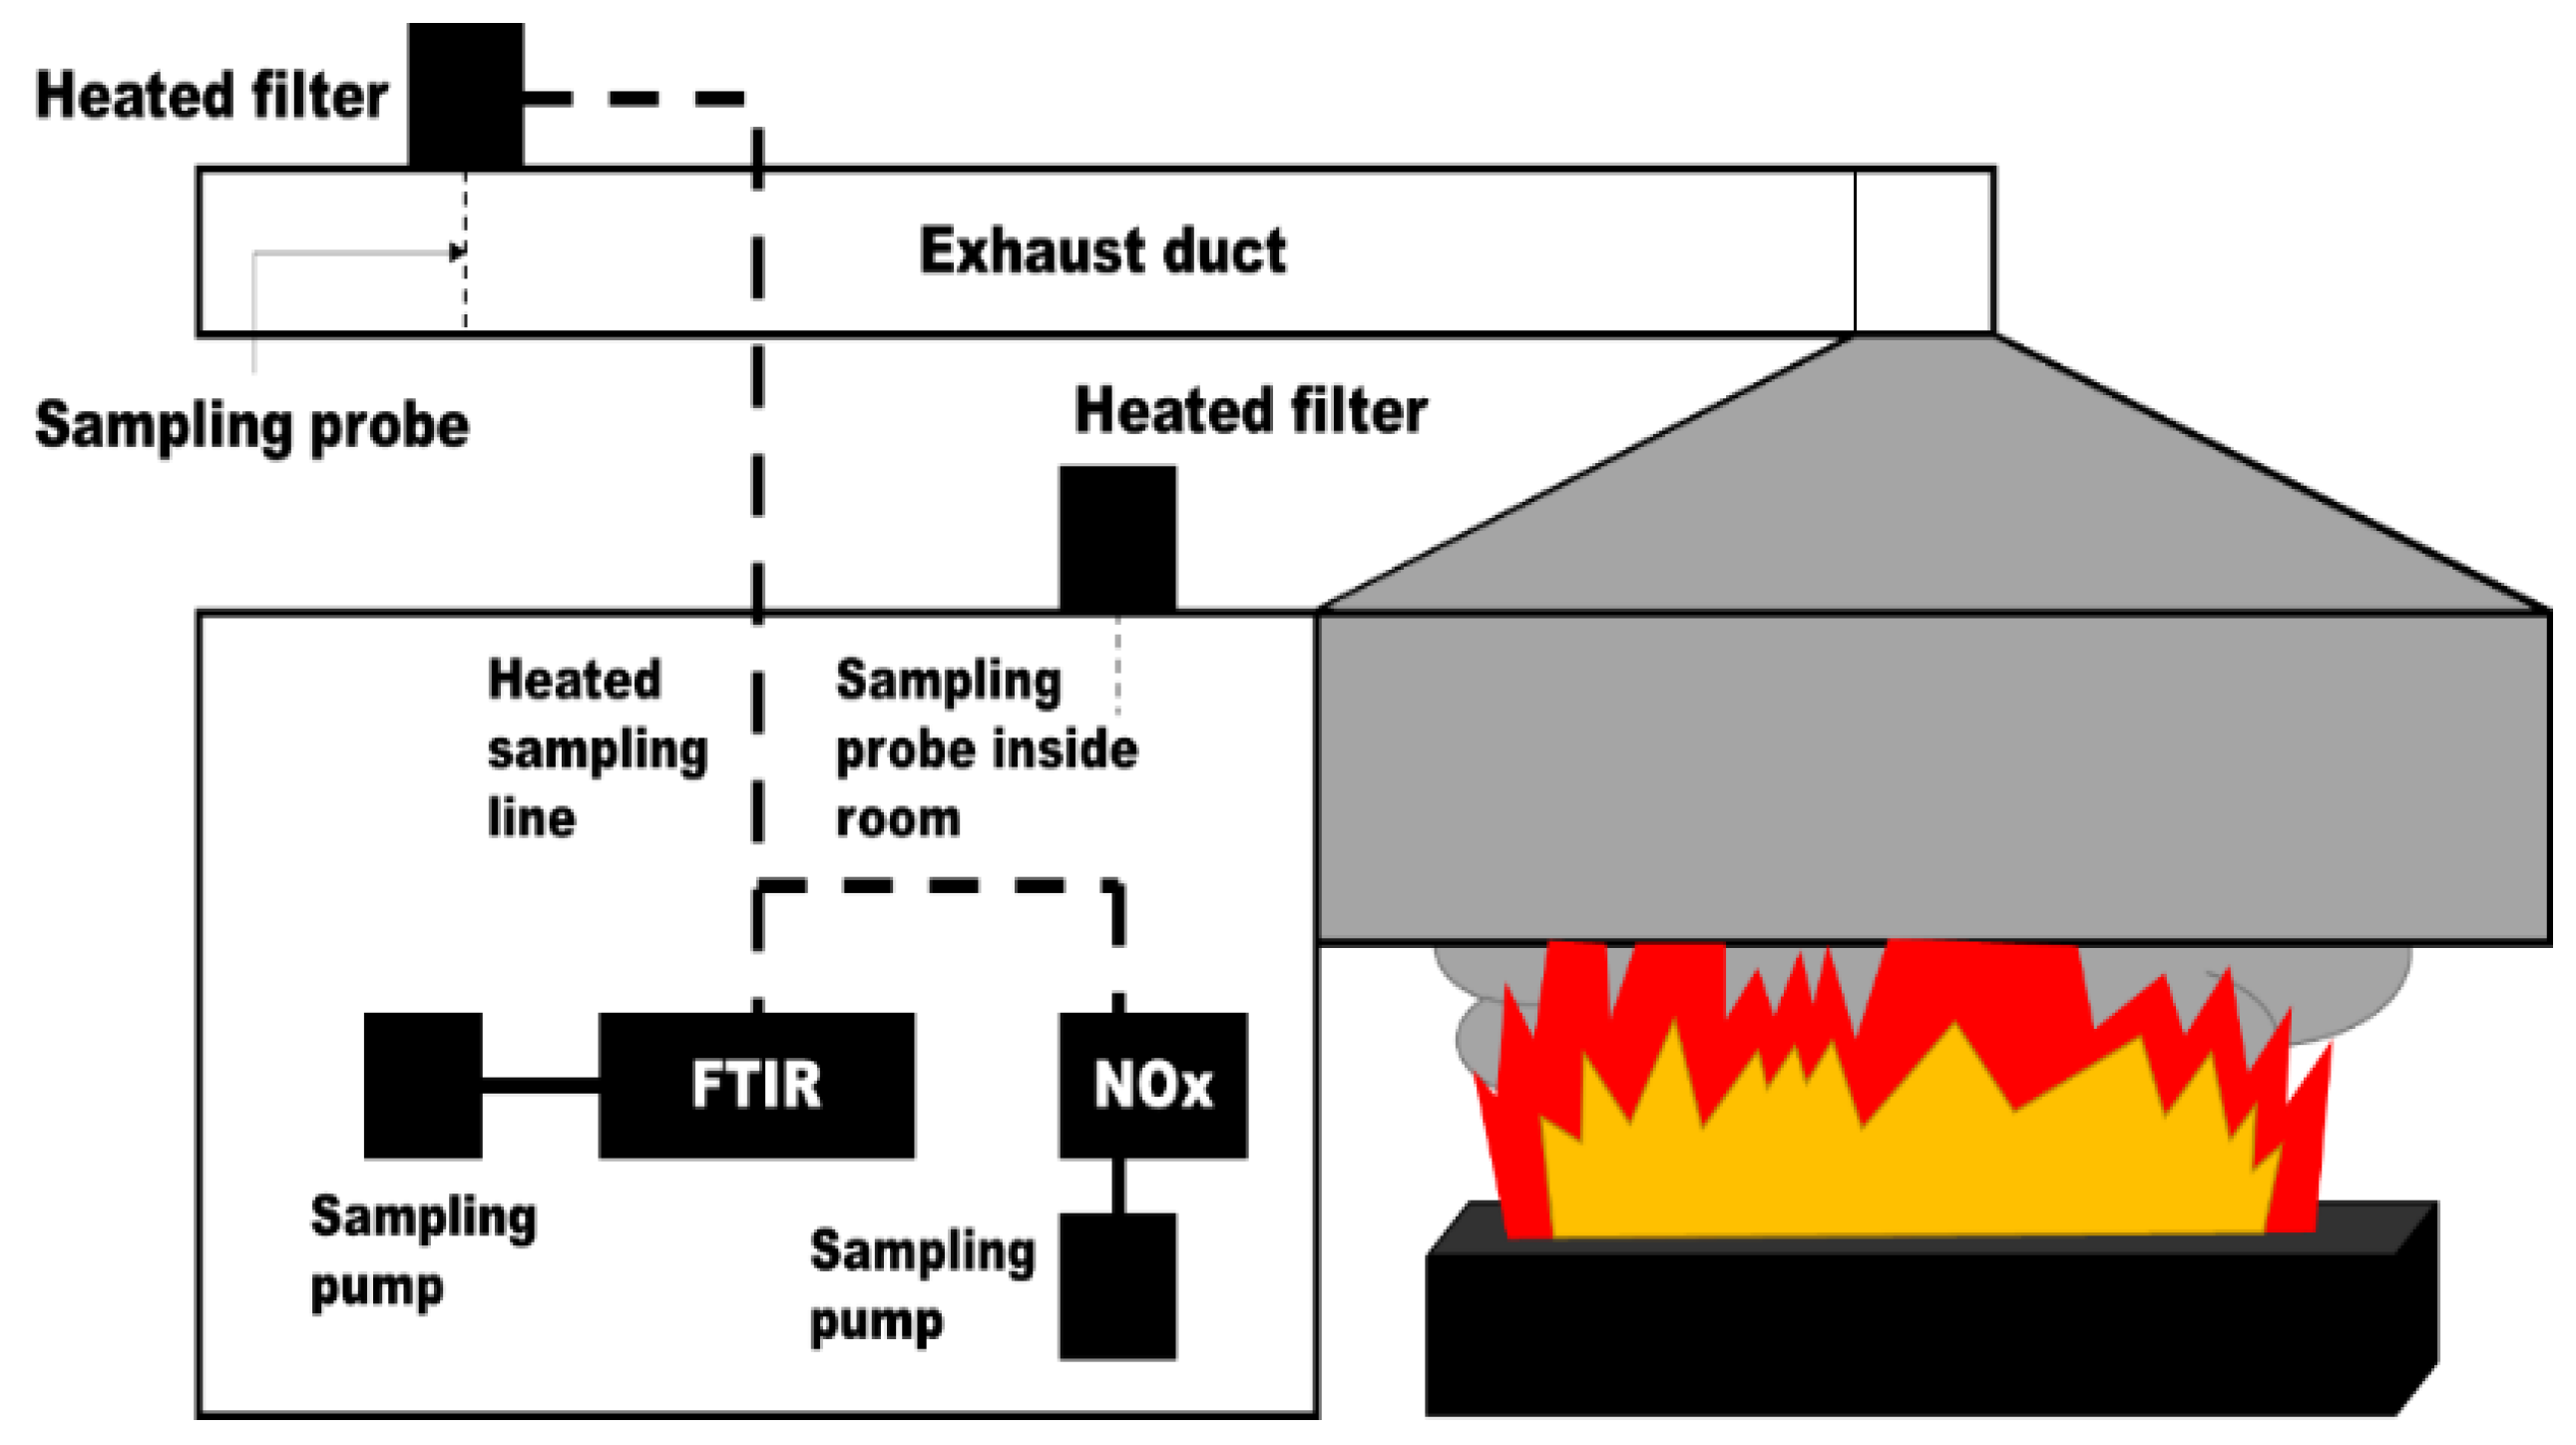
Figure 1.
Furniture calorimeter conceptual diagram.
Figure 1.
Furniture calorimeter conceptual diagram.
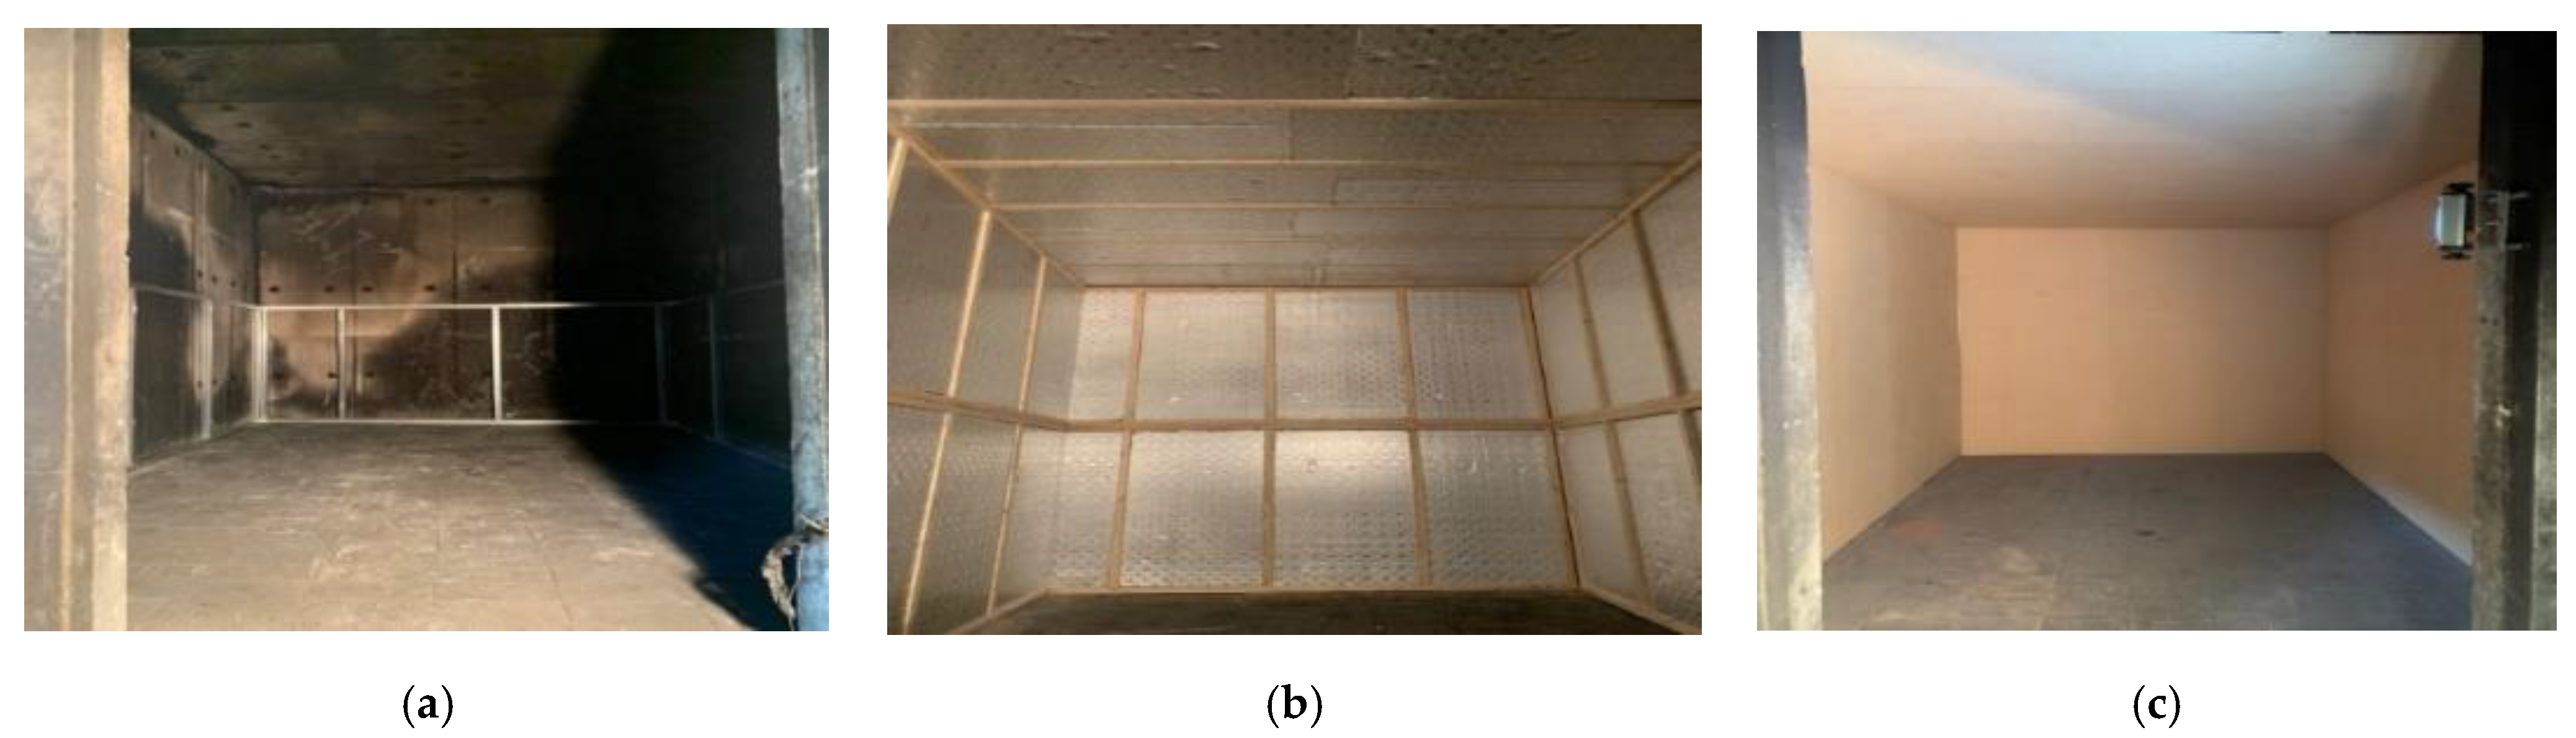
Figure 2.
Interior finish of test room: (a) Without finish; (b) Insulation; (c) Plywood finish.
Figure 2.
Interior finish of test room: (a) Without finish; (b) Insulation; (c) Plywood finish.
Figure 3.
FDS modeling of the fire development towards flashover.
Figure 3.
FDS modeling of the fire development towards flashover.
Figure 4.
HRR of desk and chair.
Figure 4.
HRR of desk and chair.
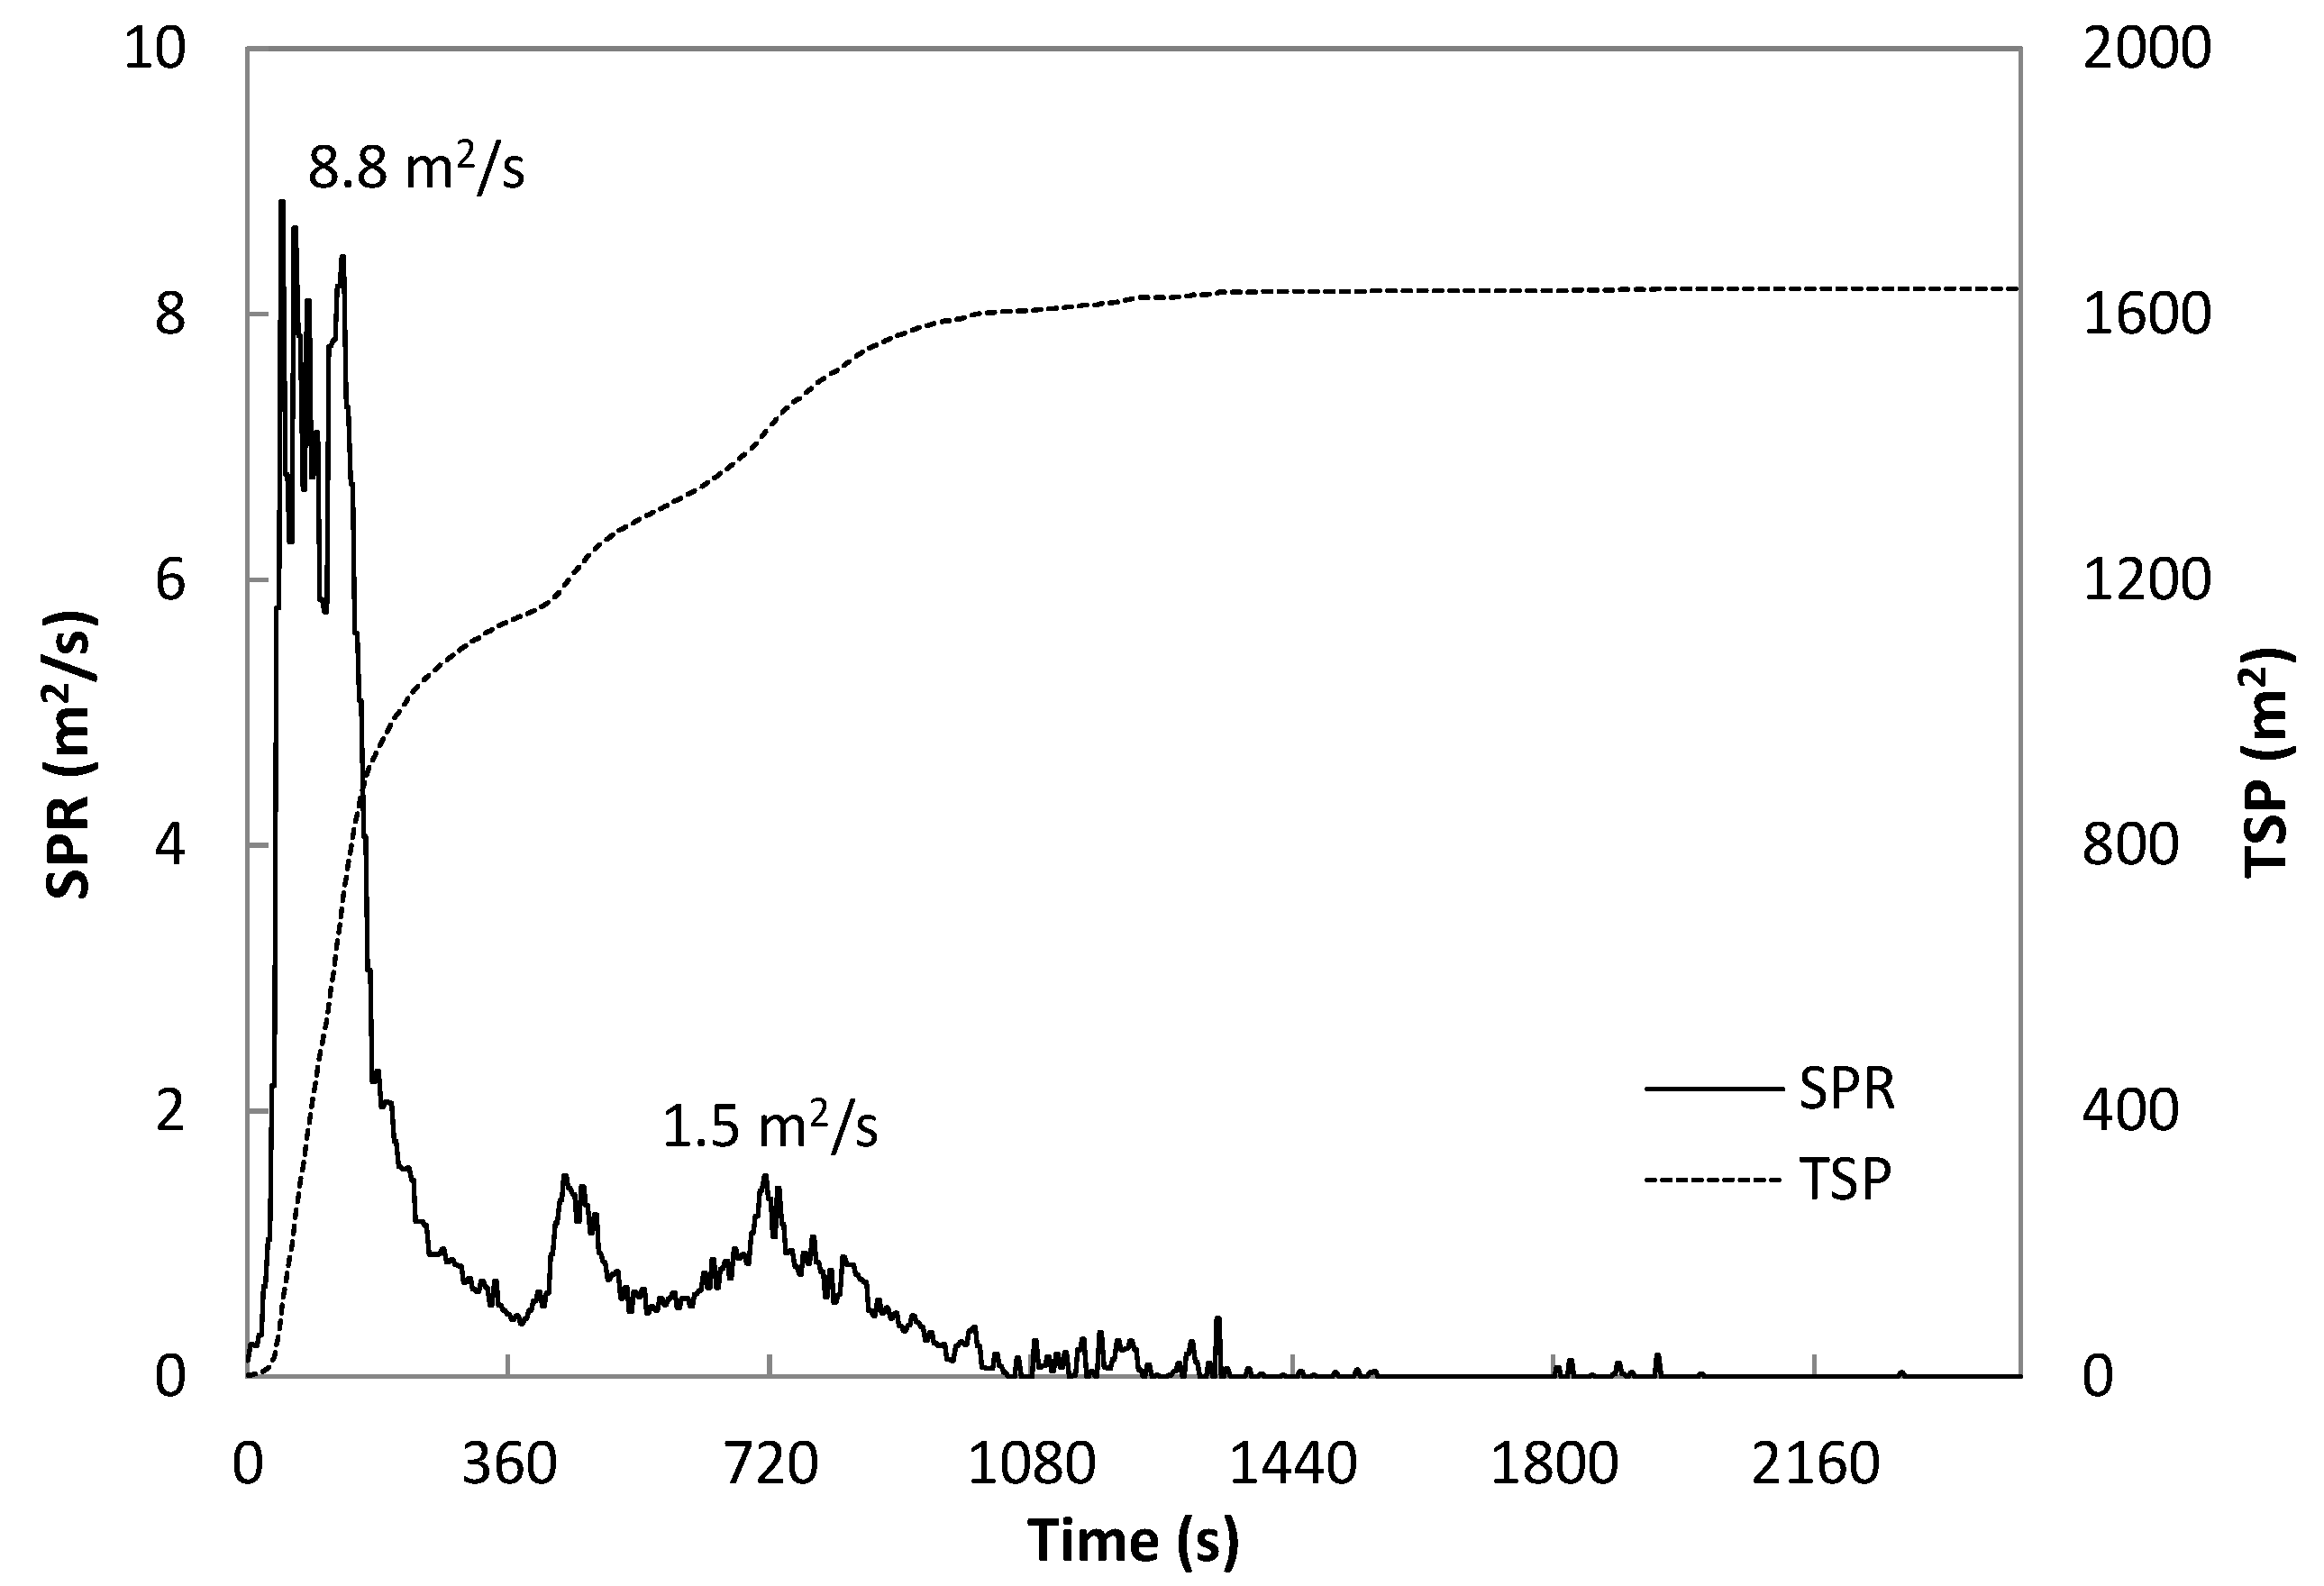
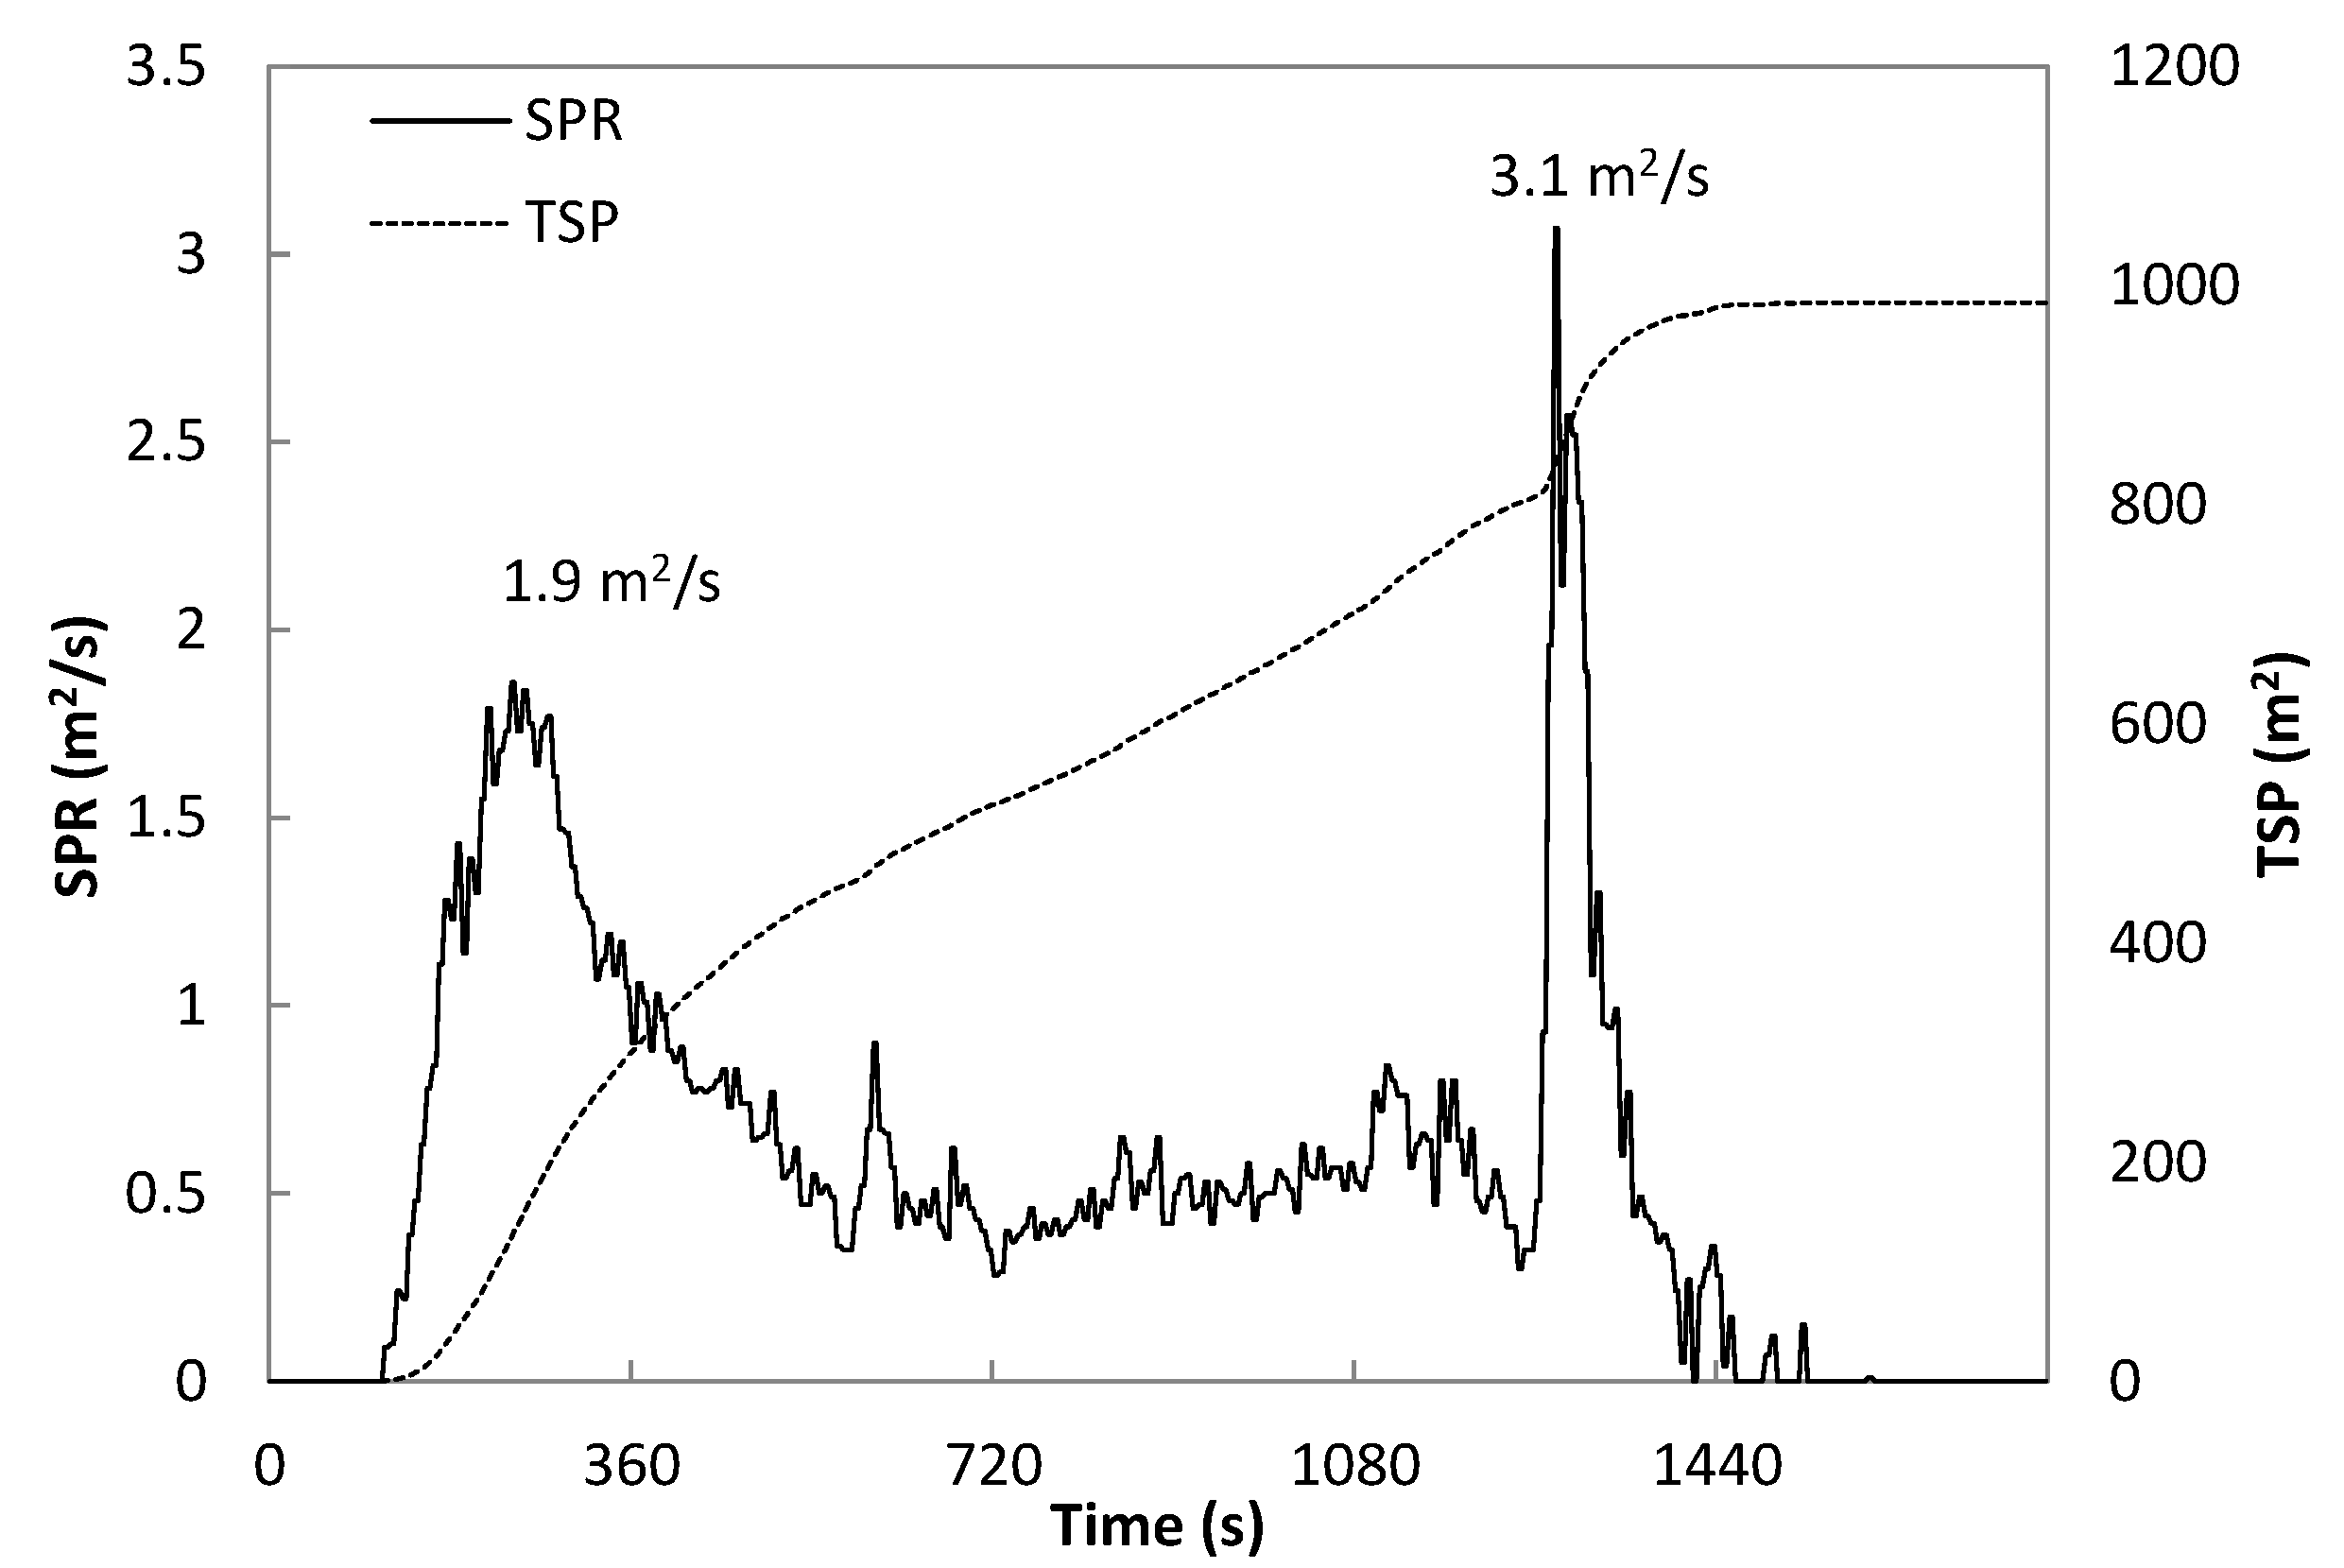
Figure 5.
SPR of desk and chair.
Figure 5.
SPR of desk and chair.
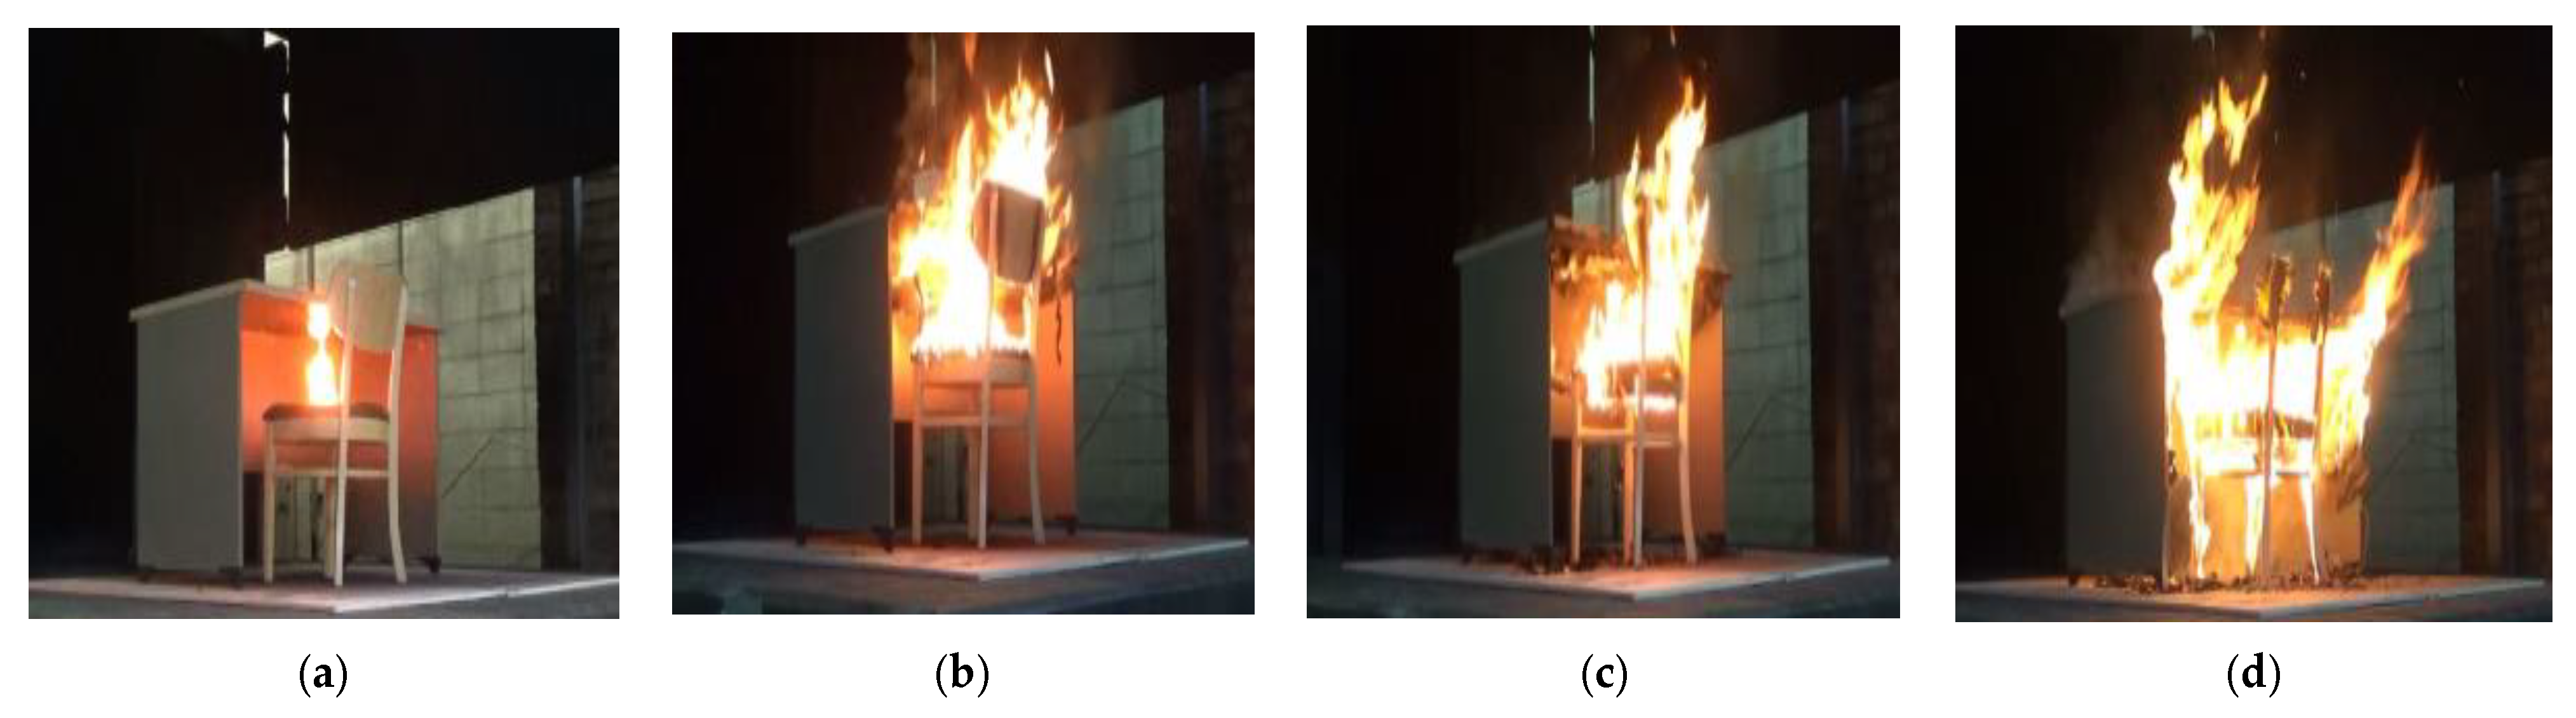
Figure 6.
Combustion of desk and chair: (a) Ignition; (b) 240 s; (c) 720 s; (d) 840 s.
Figure 6.
Combustion of desk and chair: (a) Ignition; (b) 240 s; (c) 720 s; (d) 840 s.
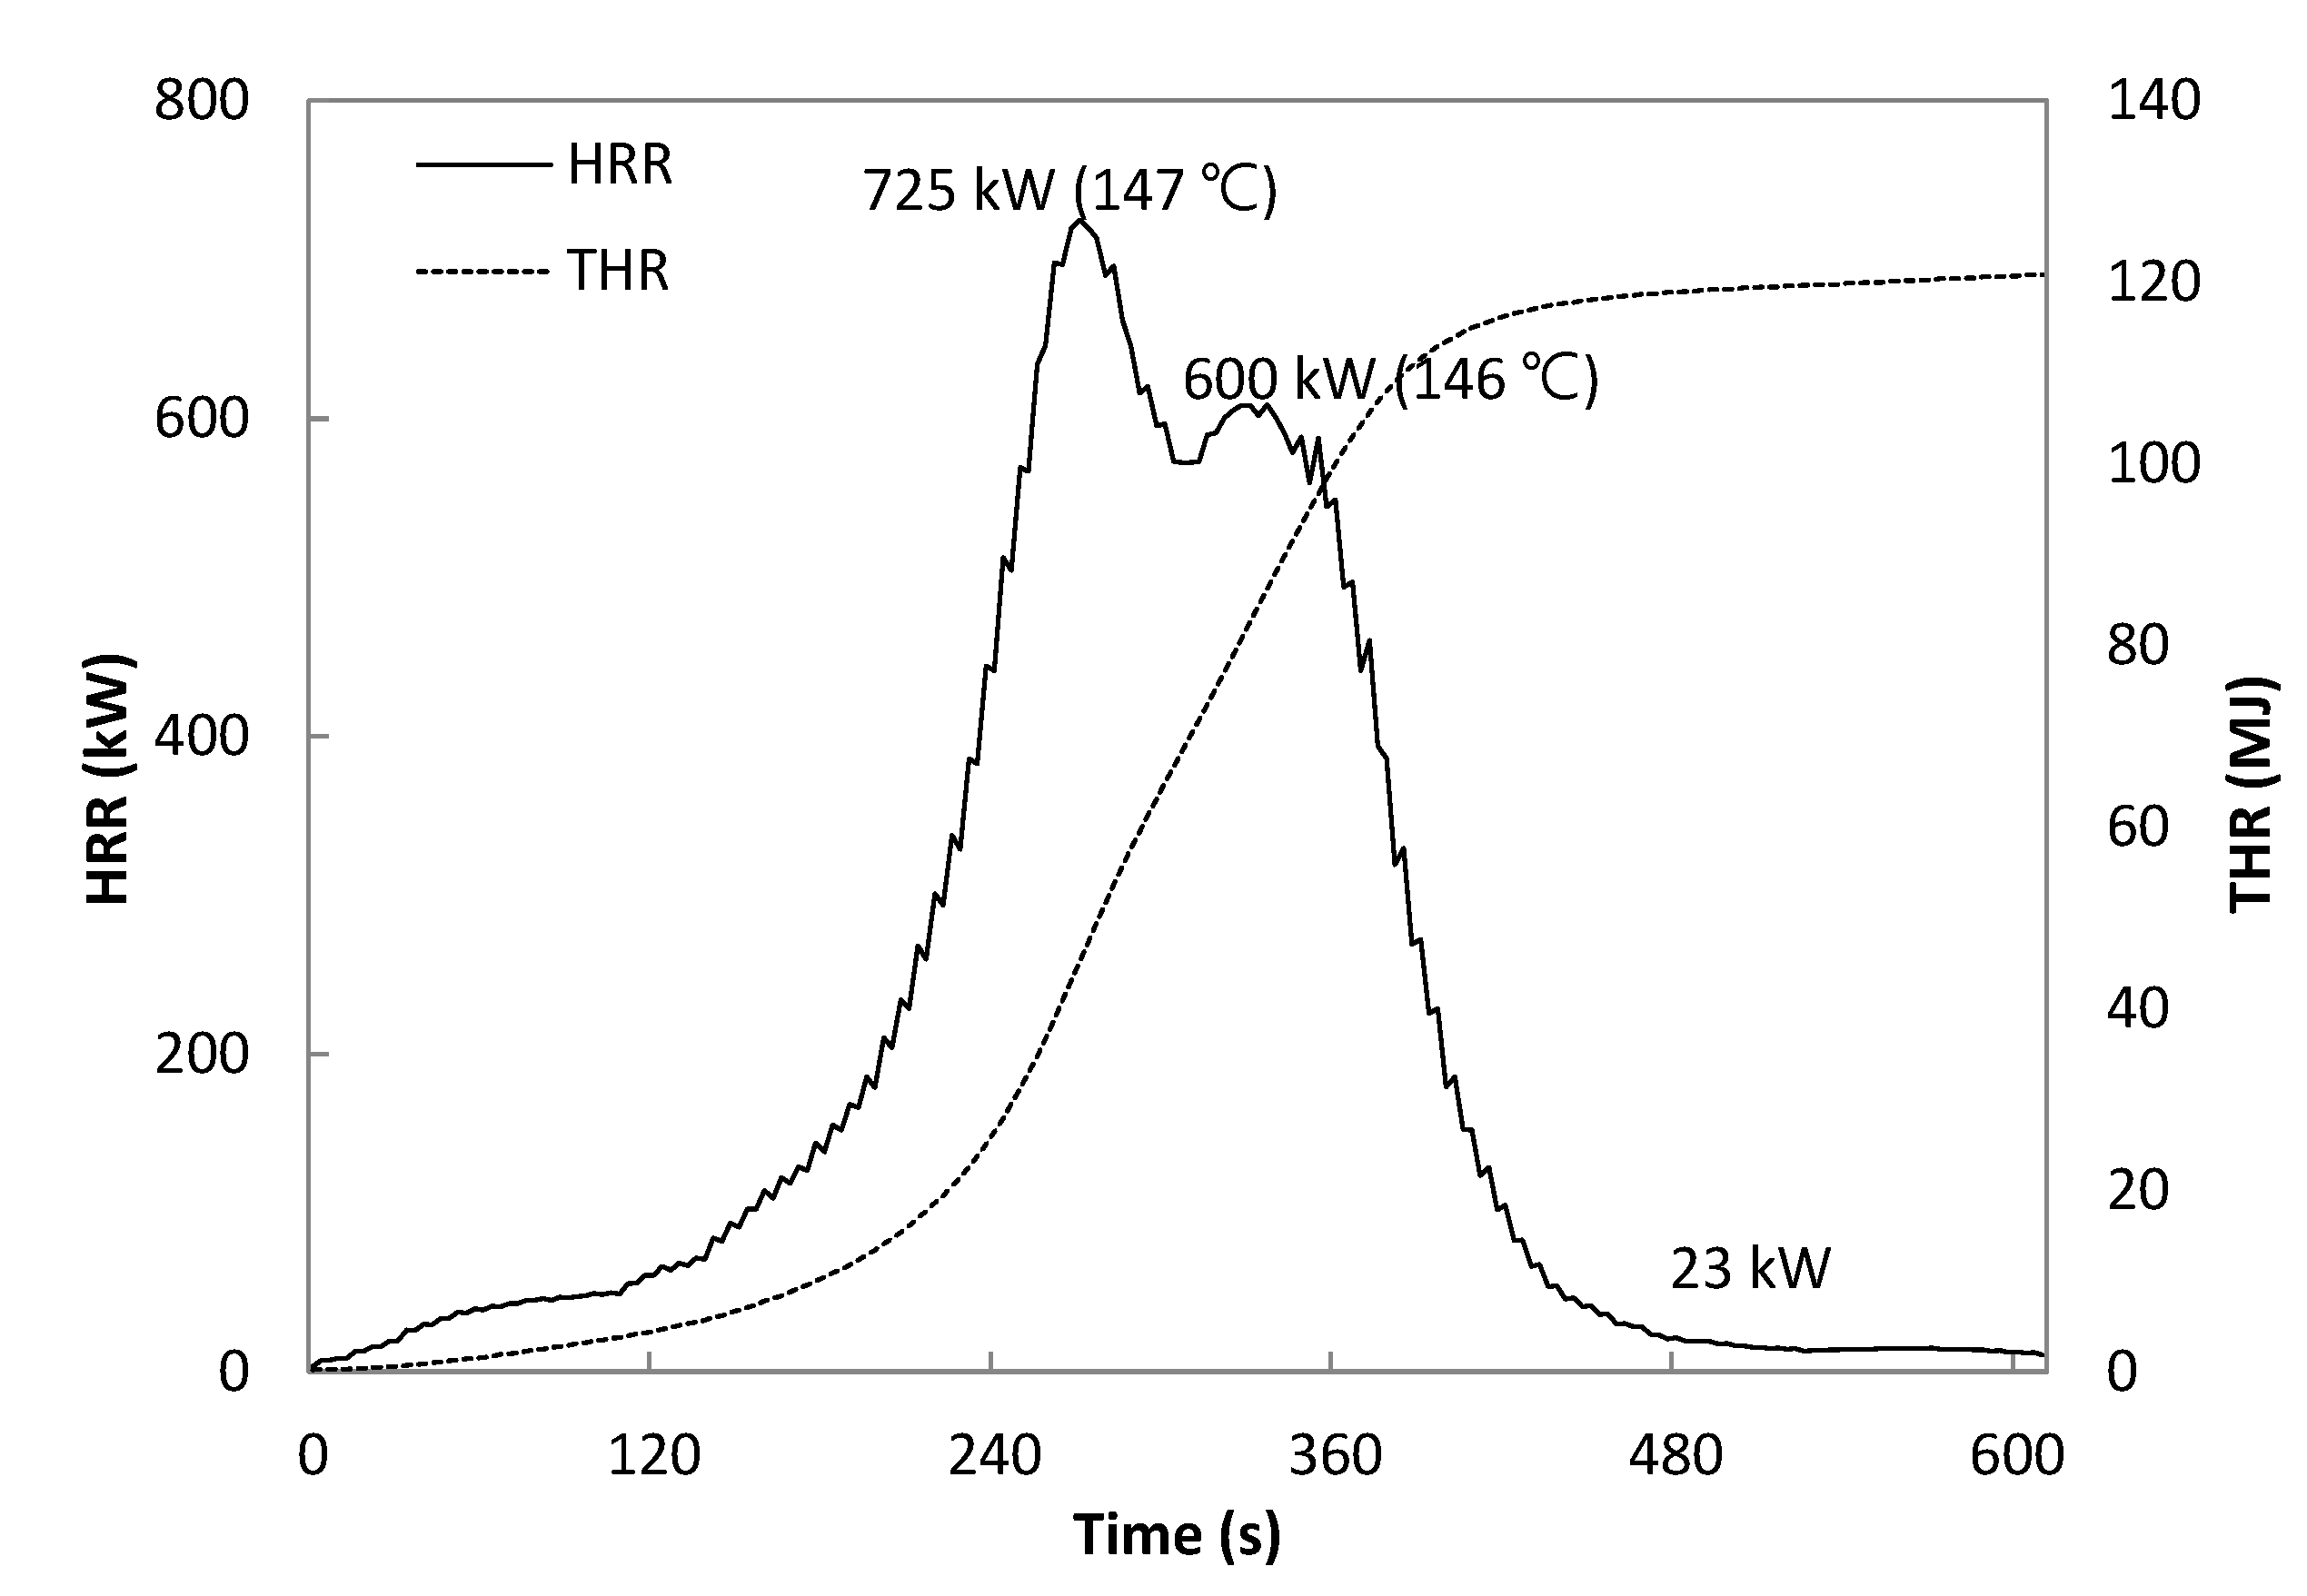
Figure 7.
HRR of mattress and electric pad.
Figure 7.
HRR of mattress and electric pad.
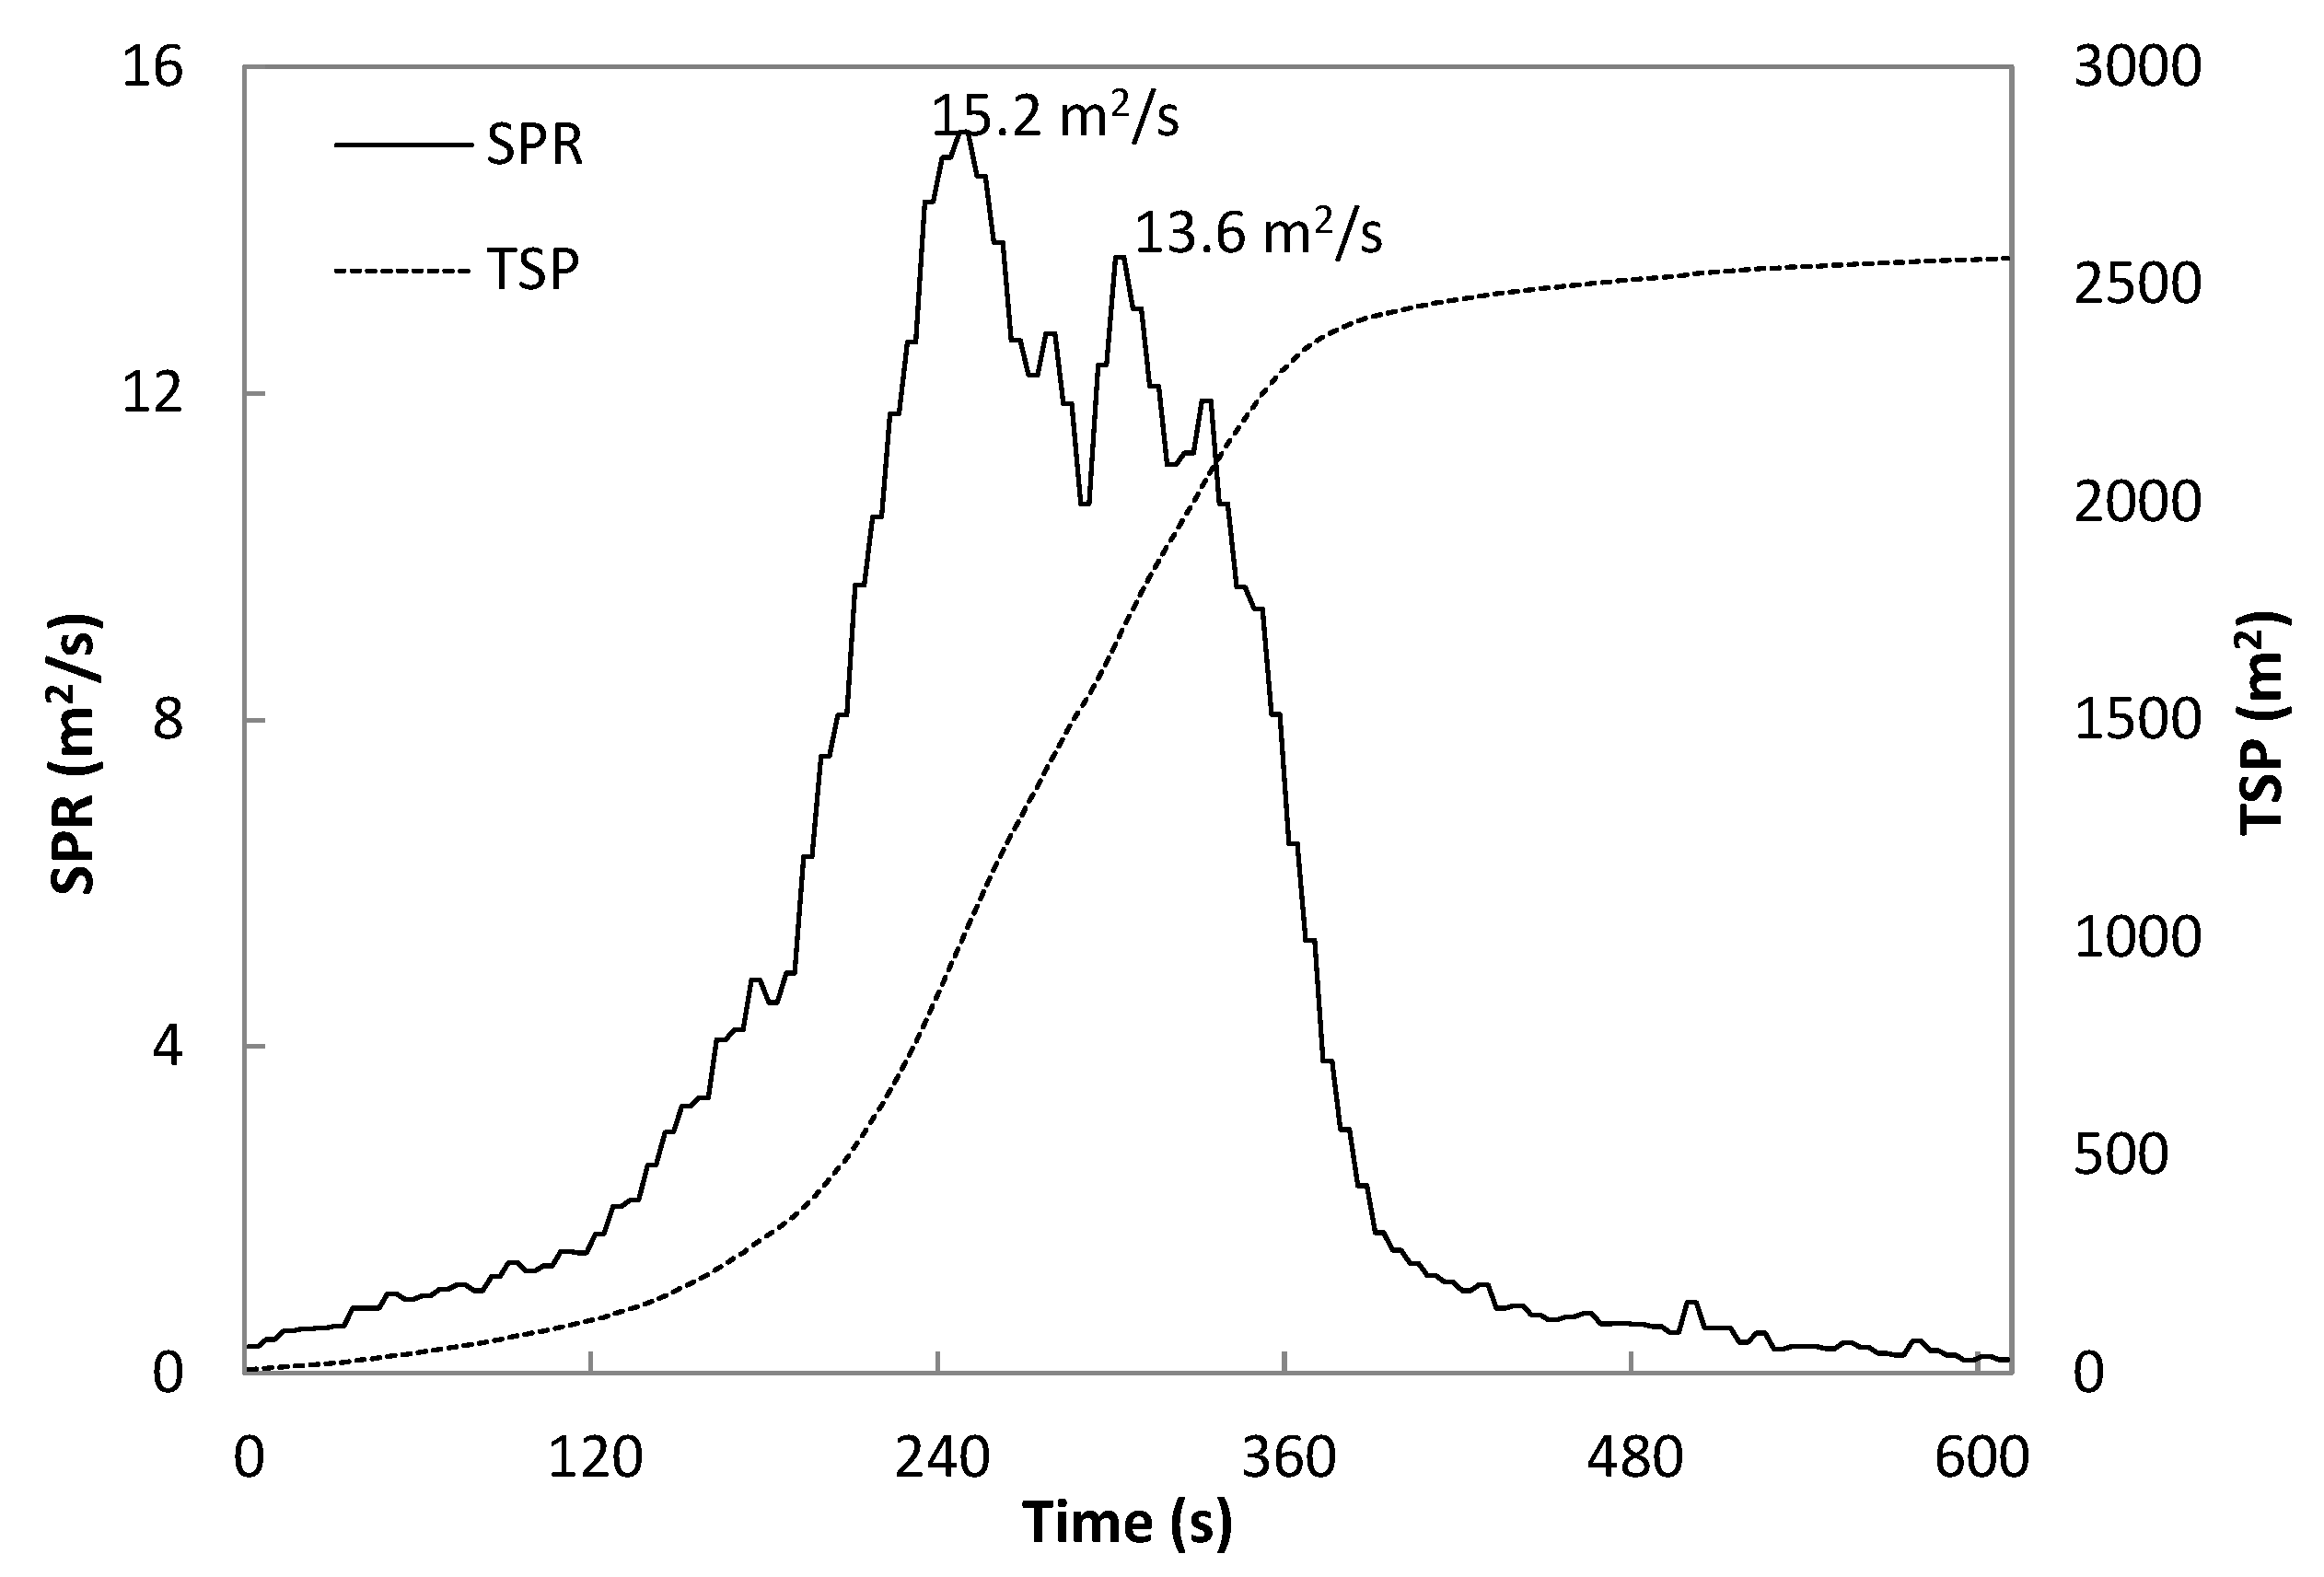
Figure 8.
SPR of mattress and electric pad.
Figure 8.
SPR of mattress and electric pad.
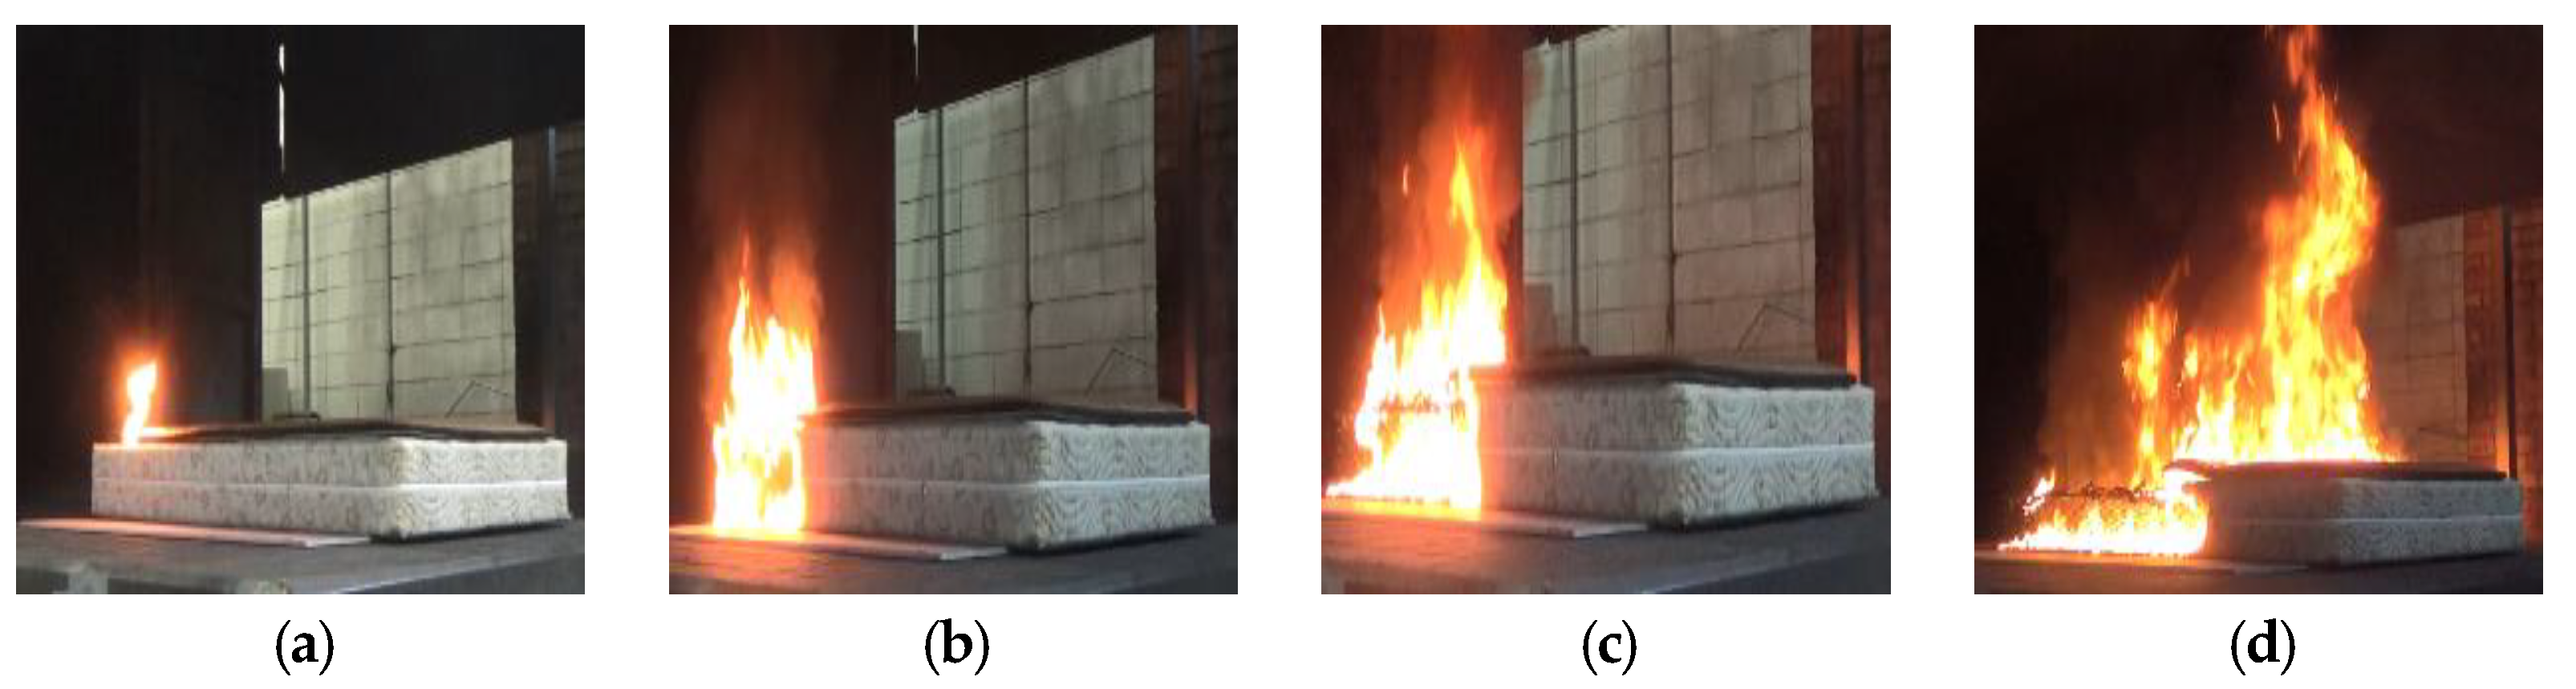
Figure 9.
Combustion of mattress and electric pad: (a) Ignition; (b) 240 s; (c) 720 s; (d) 840 s.
Figure 9.
Combustion of mattress and electric pad: (a) Ignition; (b) 240 s; (c) 720 s; (d) 840 s.
Figure 12.
Combustion of sofa: (a) Ignition; (b) 120 s; (c) 240 s; (d) 360 s.
Figure 12.
Combustion of sofa: (a) Ignition; (b) 120 s; (c) 240 s; (d) 360 s.
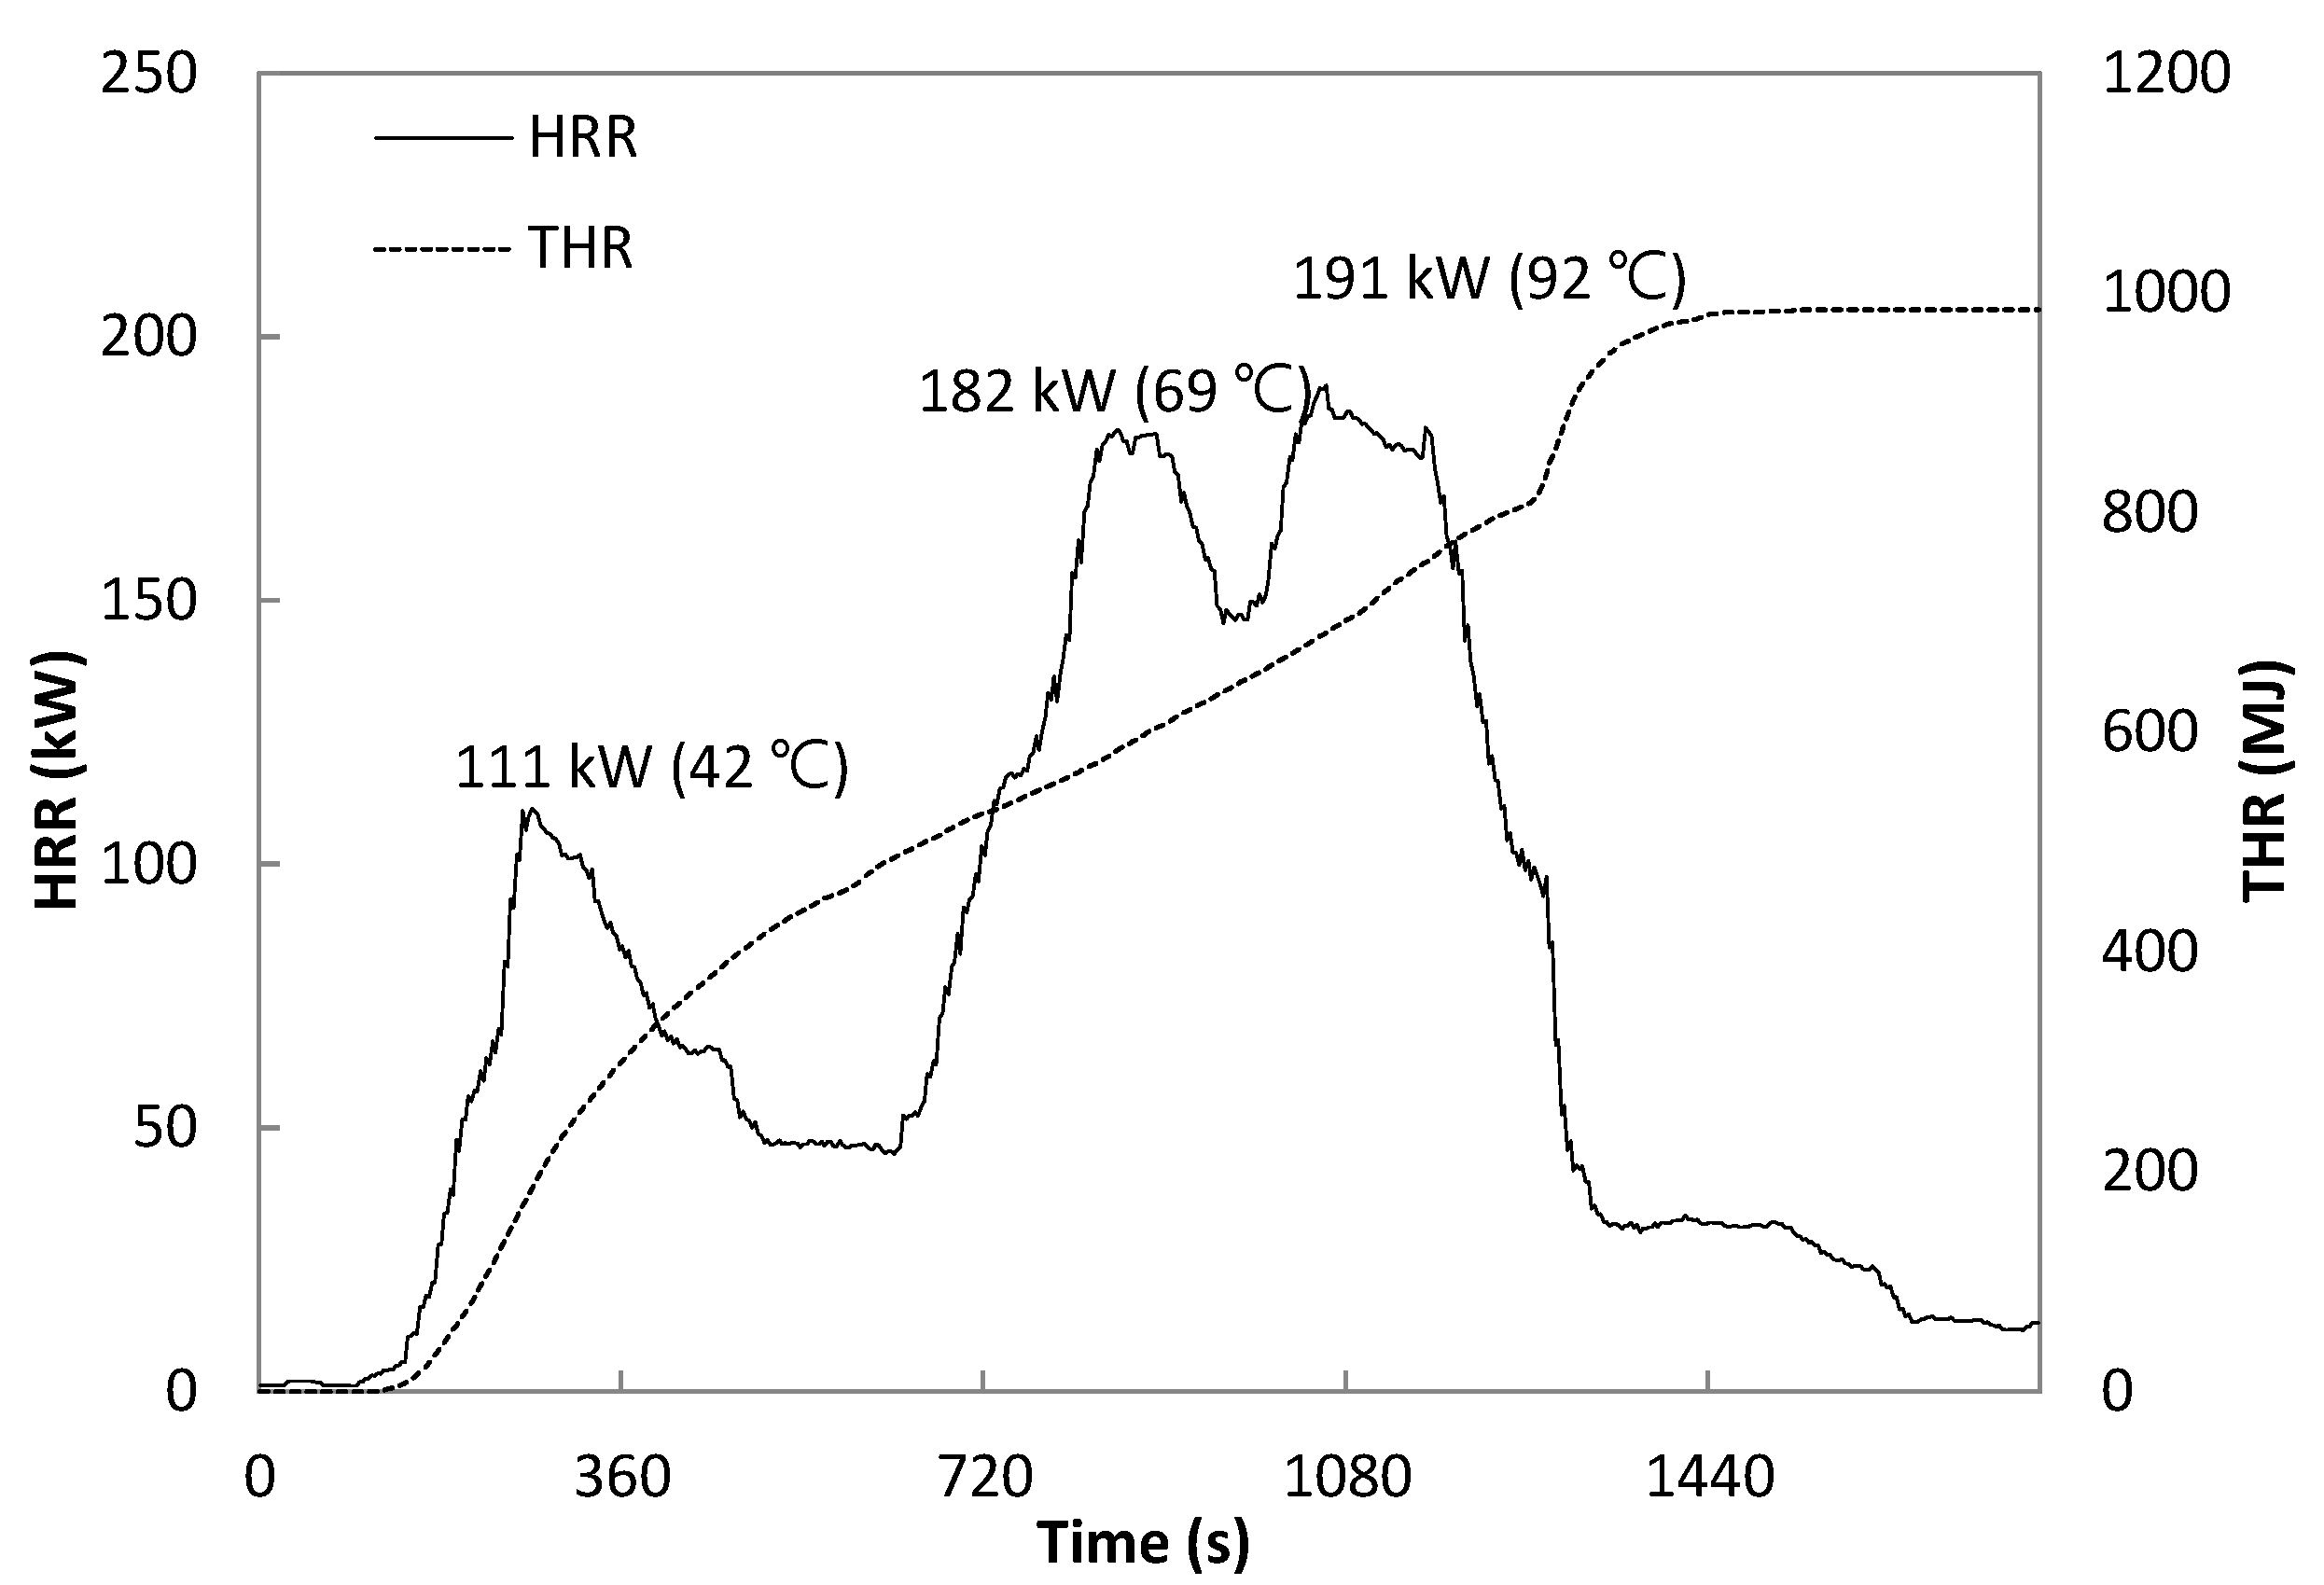
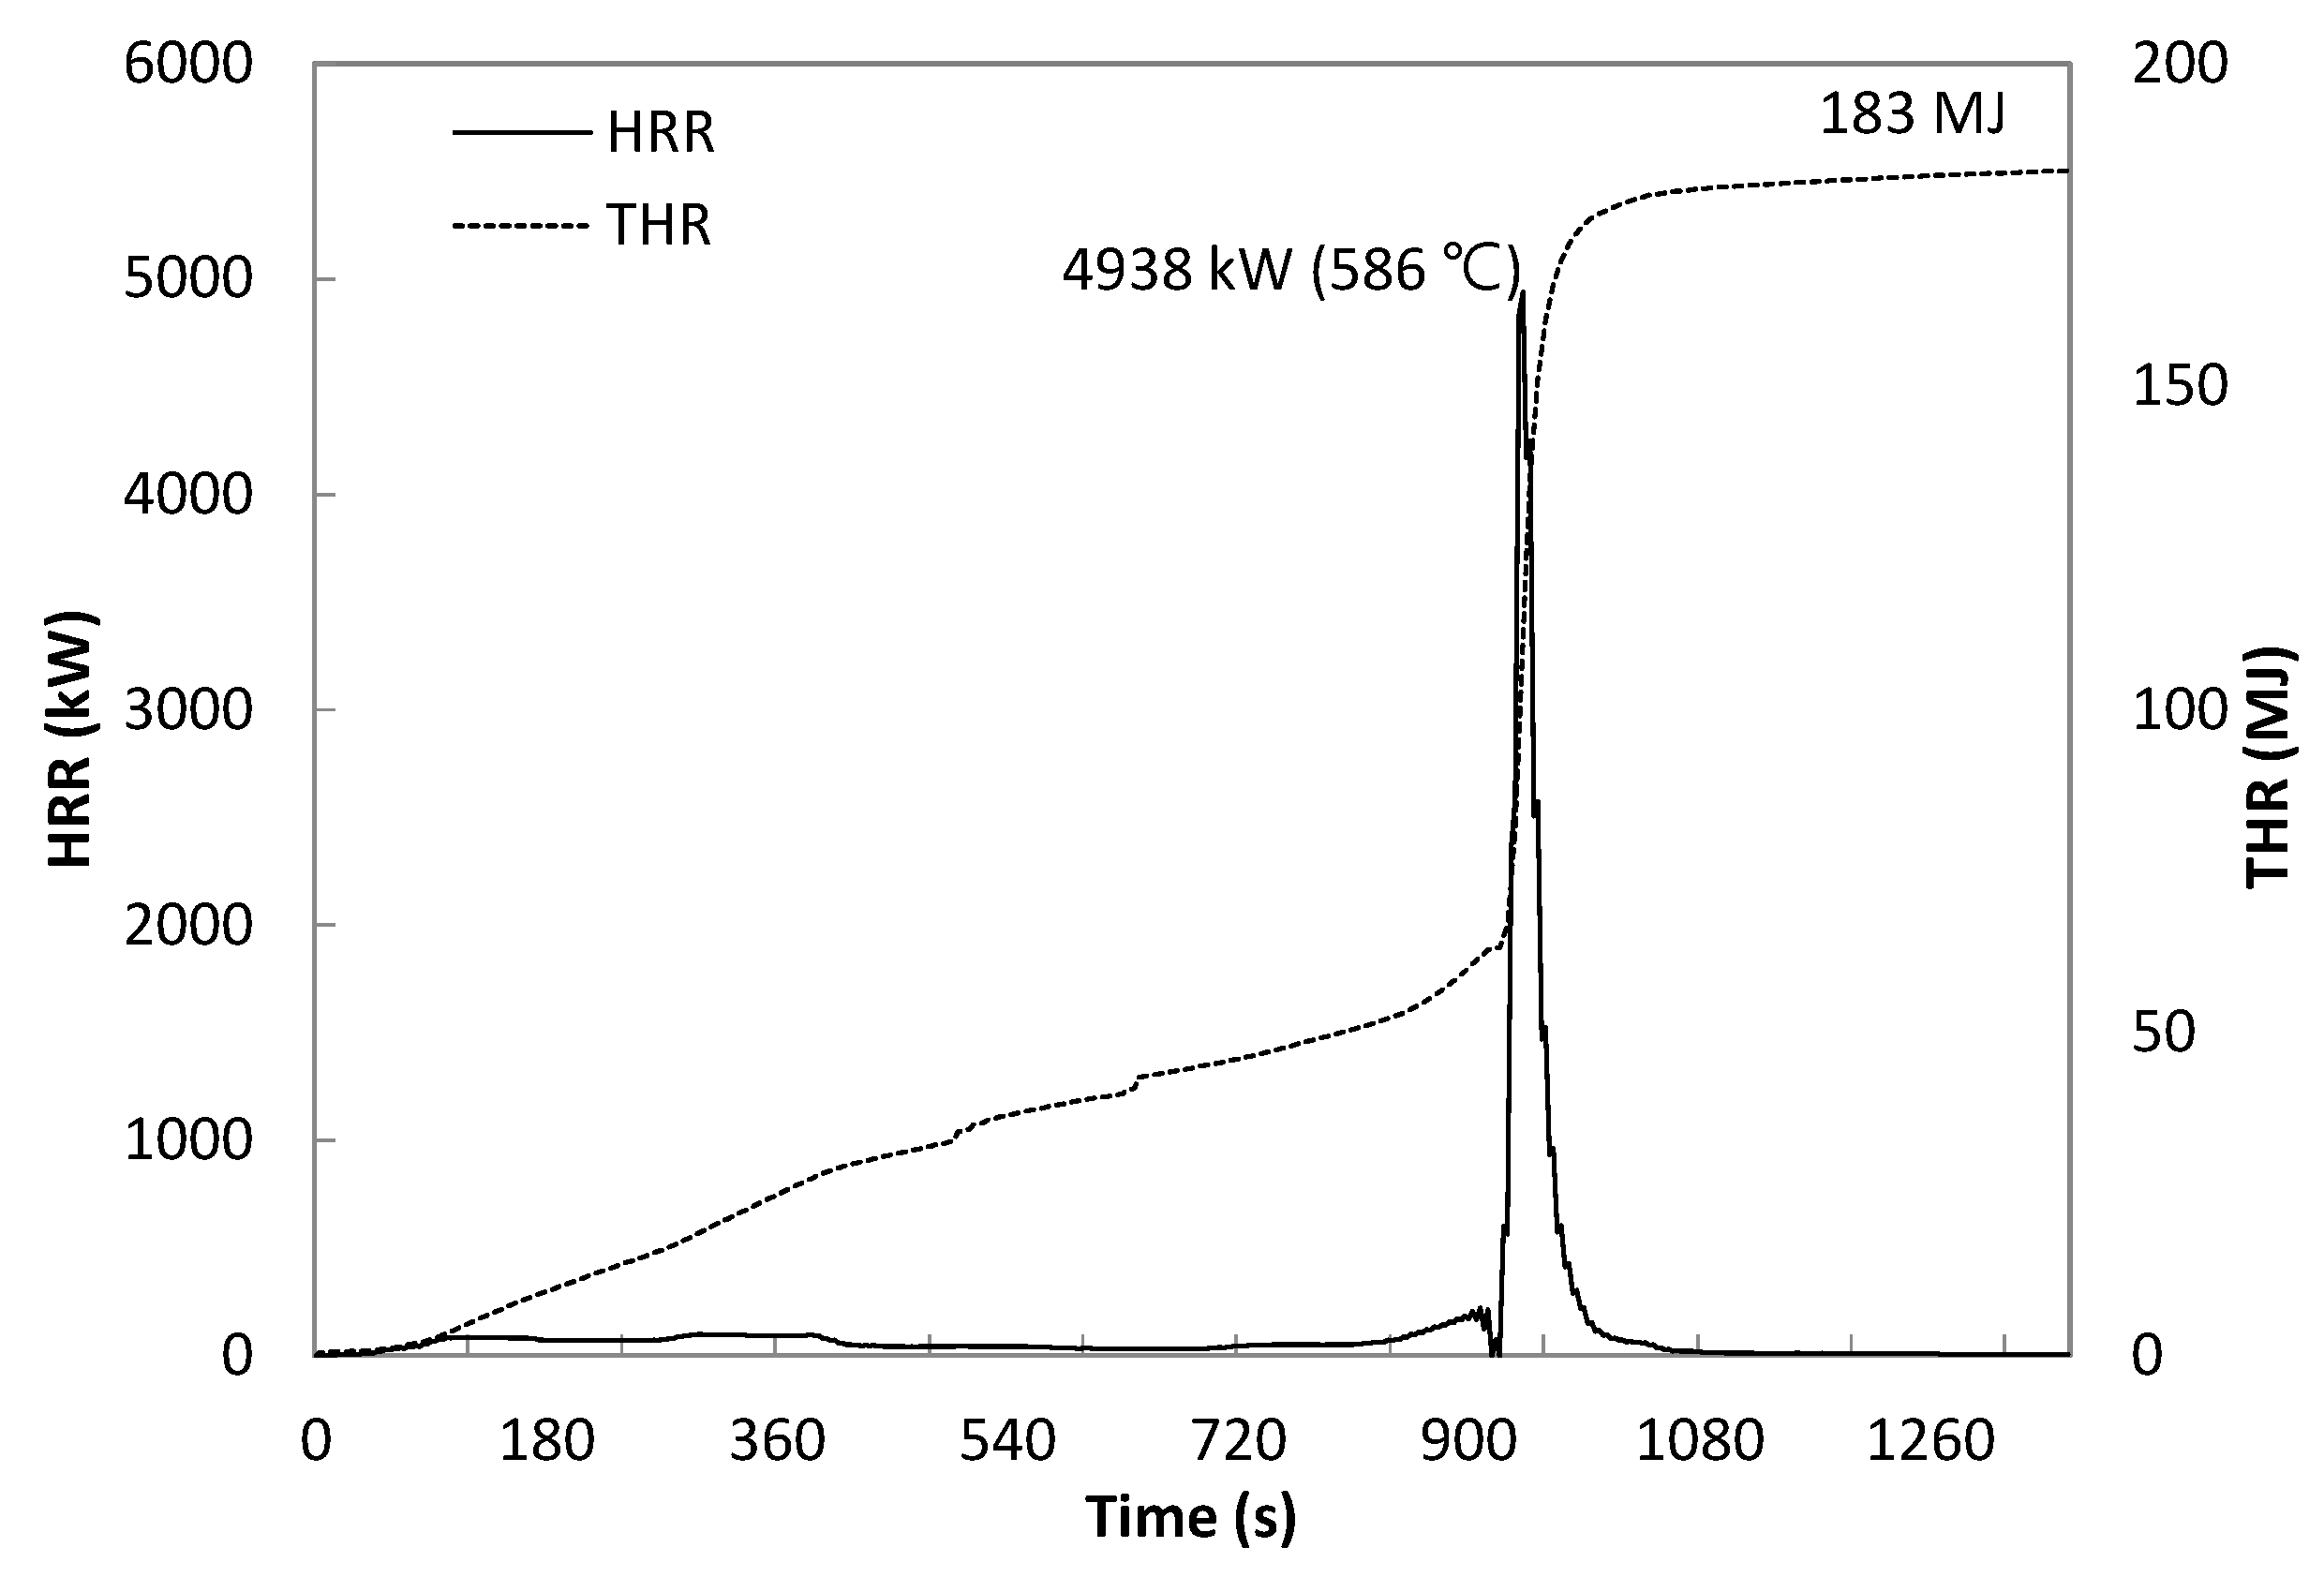
Figure 13.
HRR in compartment fire experiment with desk and chair.
Figure 13.
HRR in compartment fire experiment with desk and chair.
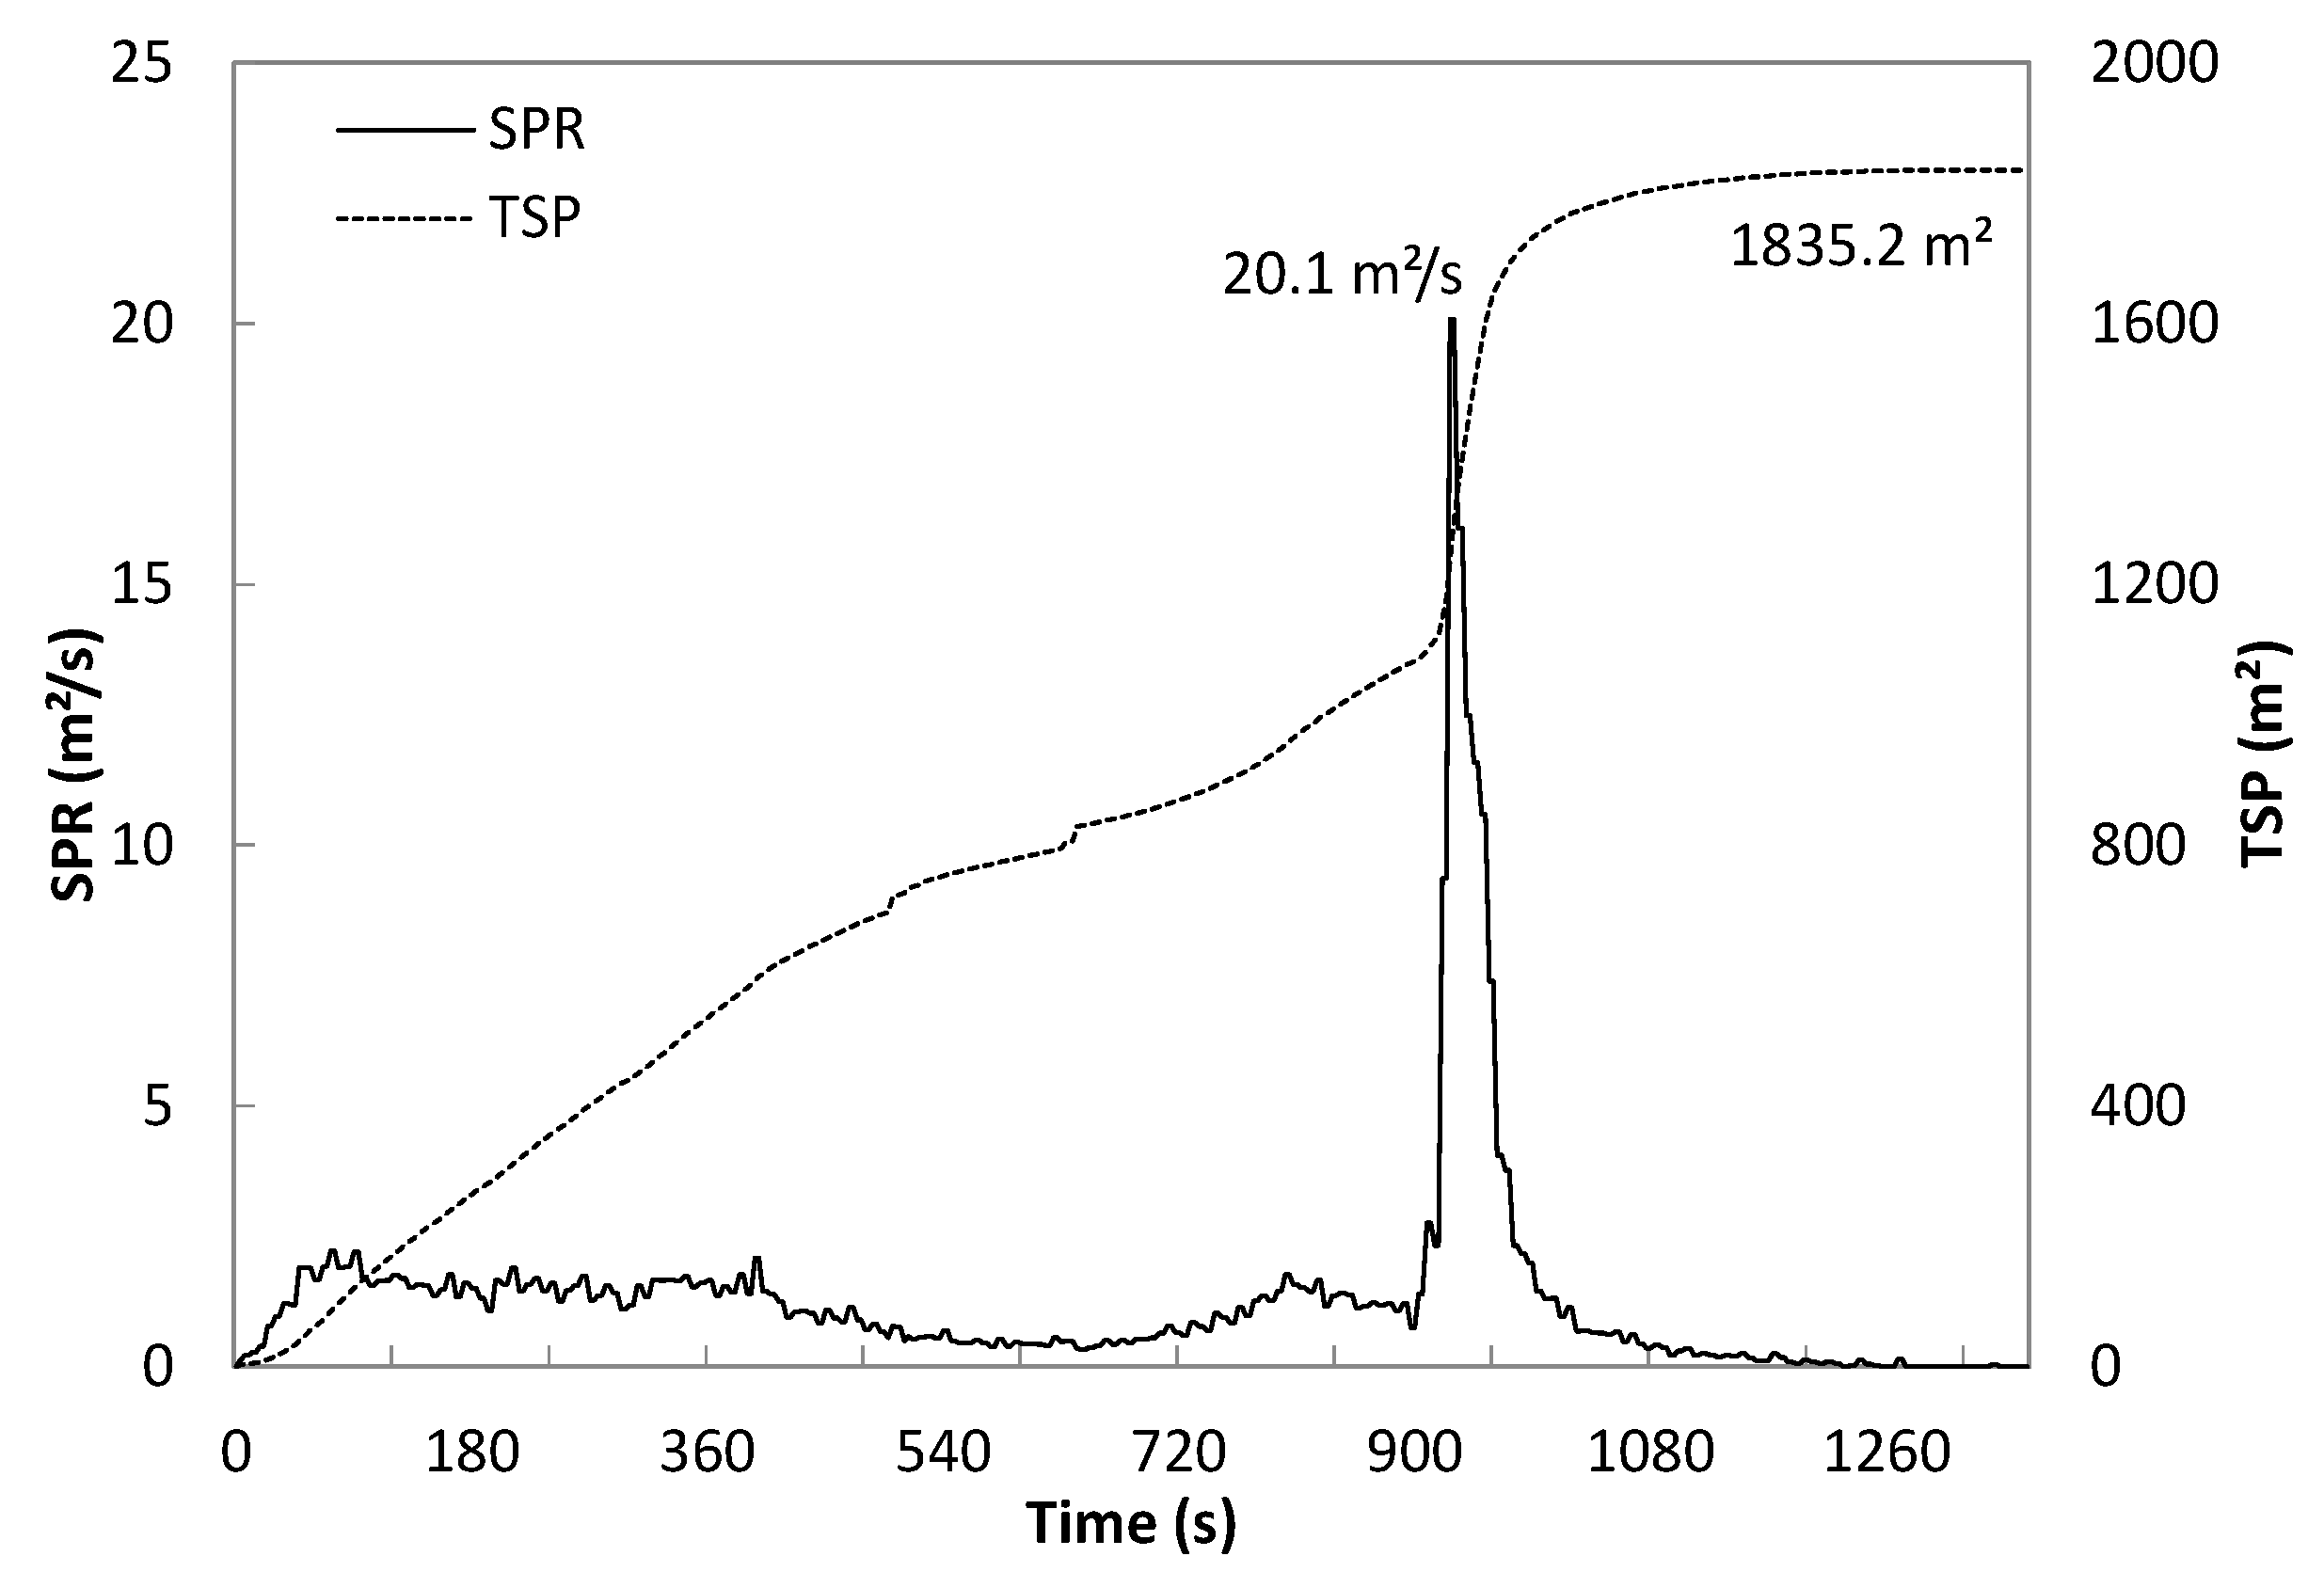
Figure 14.
SPR in compartment fire experiment with desk and chair.
Figure 14.
SPR in compartment fire experiment with desk and chair.
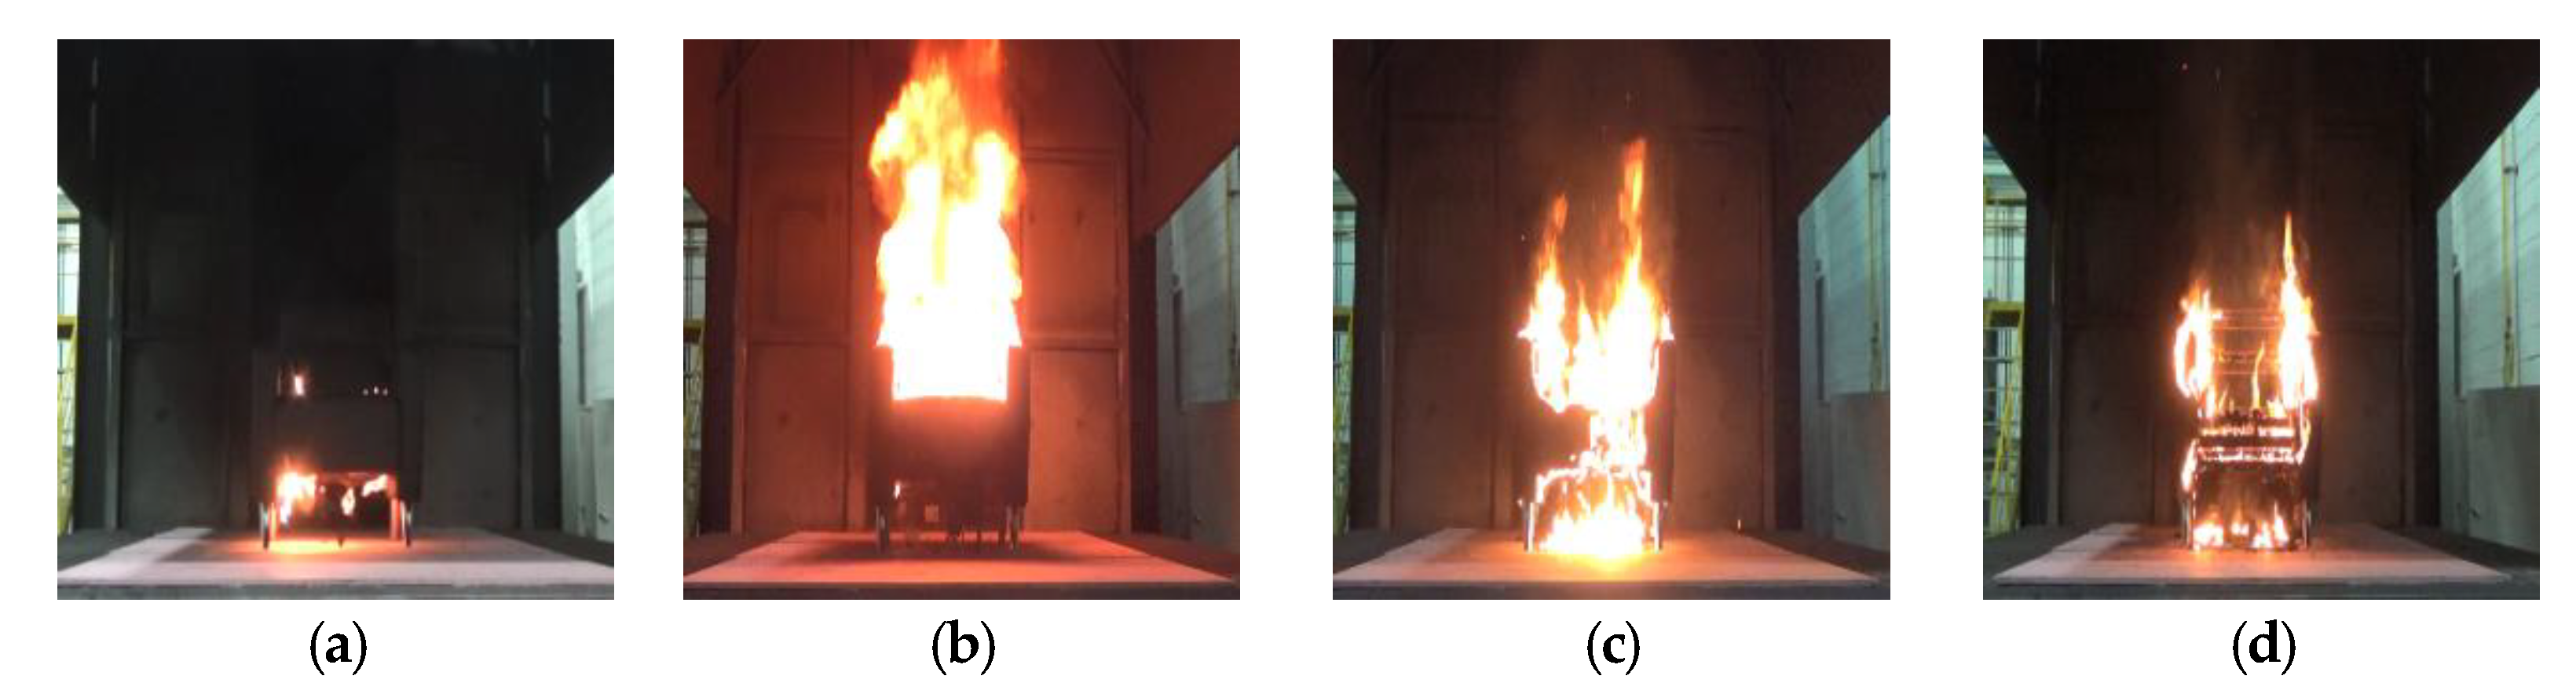
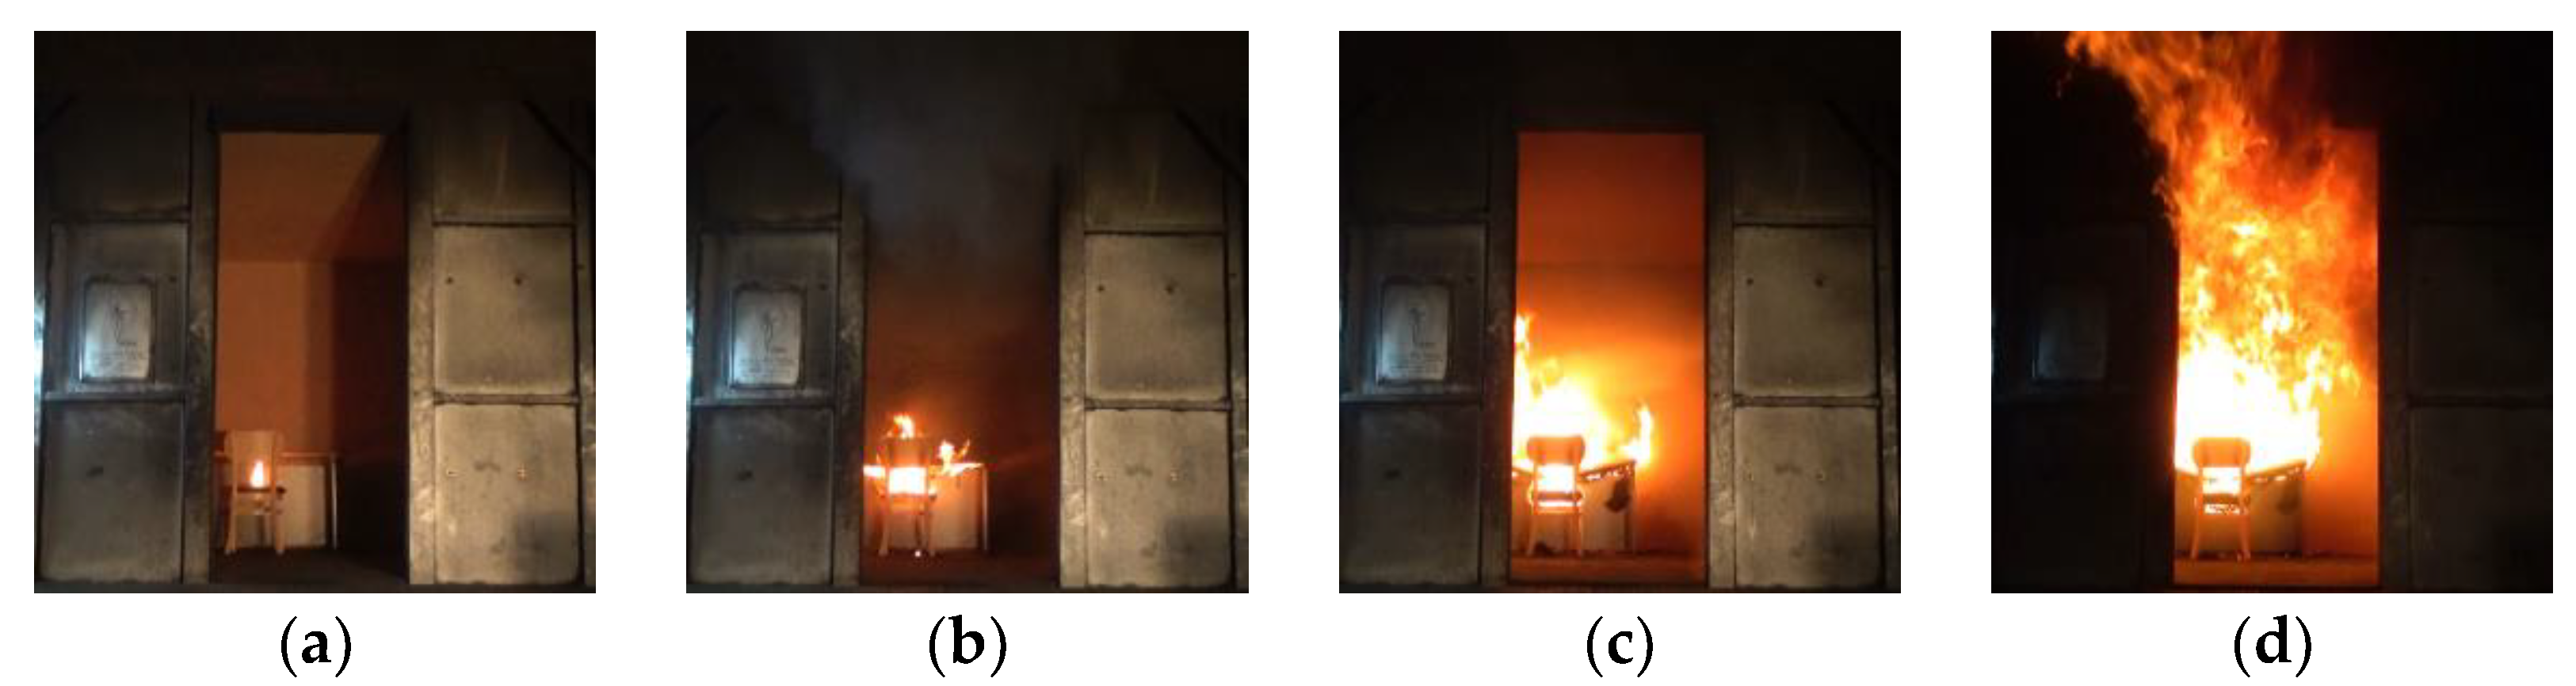
Figure 15.
Fire aspect of test room with desk and chair: (a) Ignition; (b) 400 s; (c) 940 s; (d) 960 s.
Figure 15.
Fire aspect of test room with desk and chair: (a) Ignition; (b) 400 s; (c) 940 s; (d) 960 s.
Figure 16.
HRR of mattress and electric pad.
Figure 16.
HRR of mattress and electric pad.
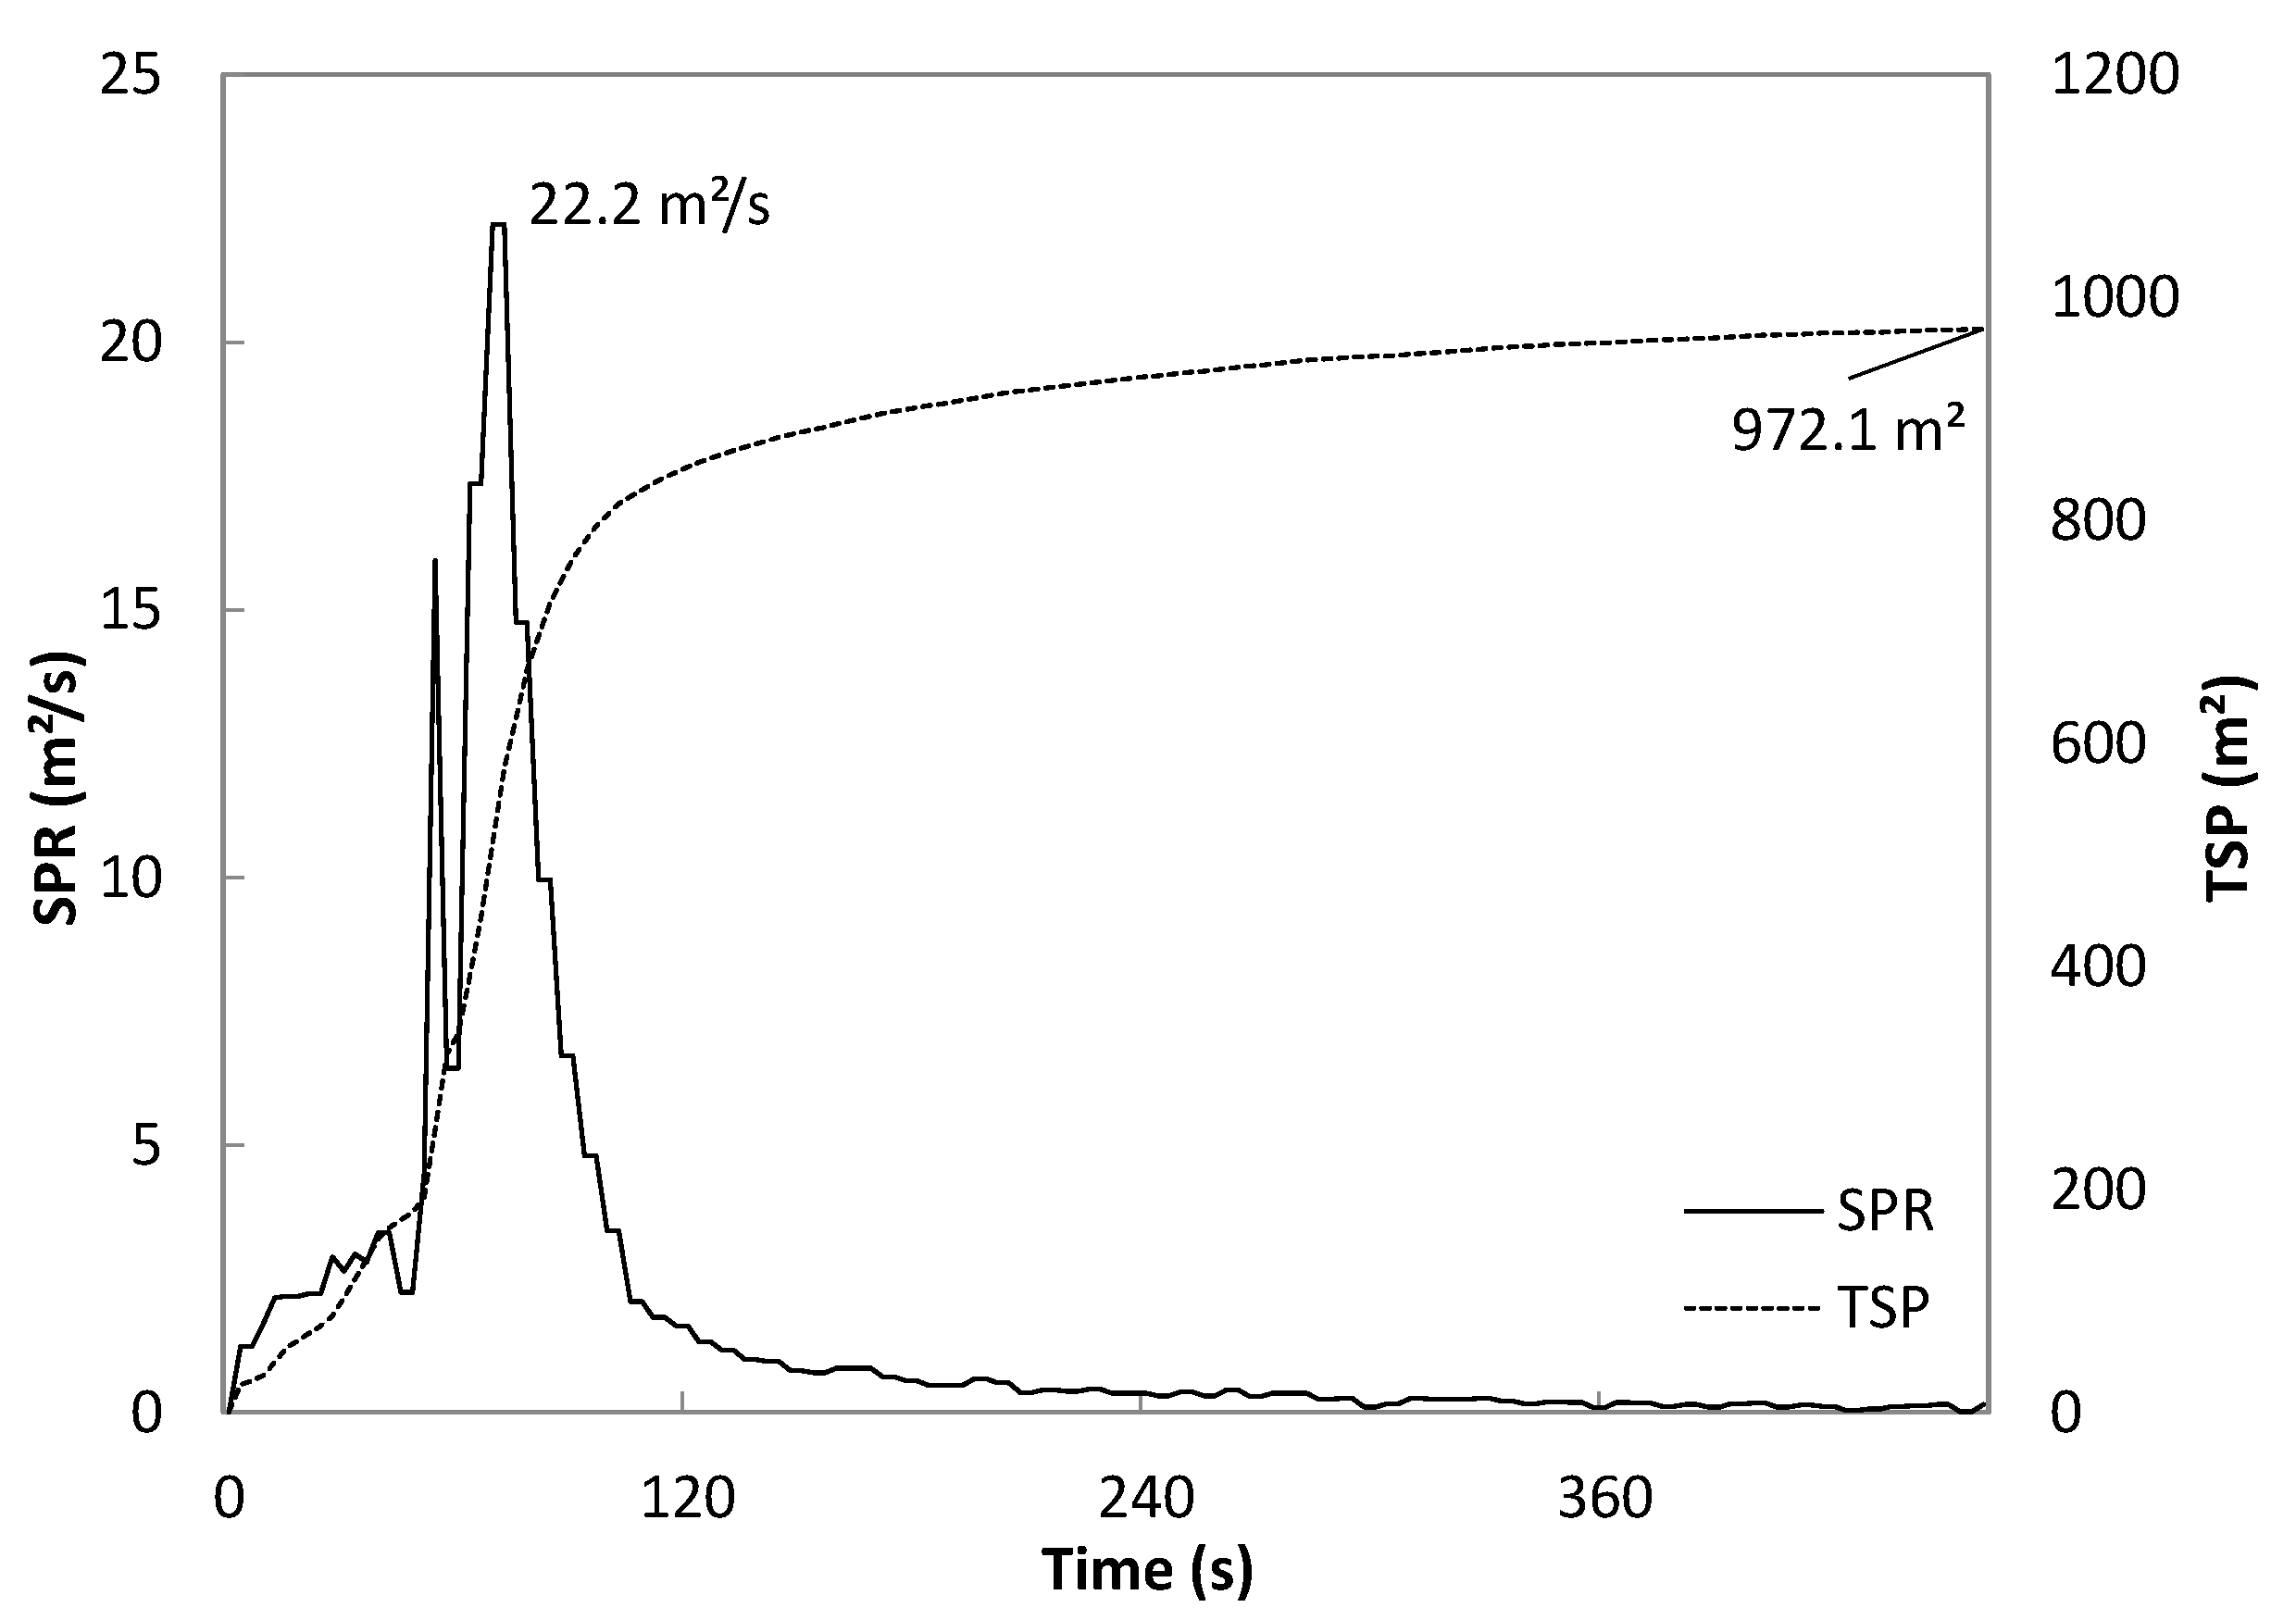
Figure 17.
SPR of mattress and electric pad.
Figure 17.
SPR of mattress and electric pad.
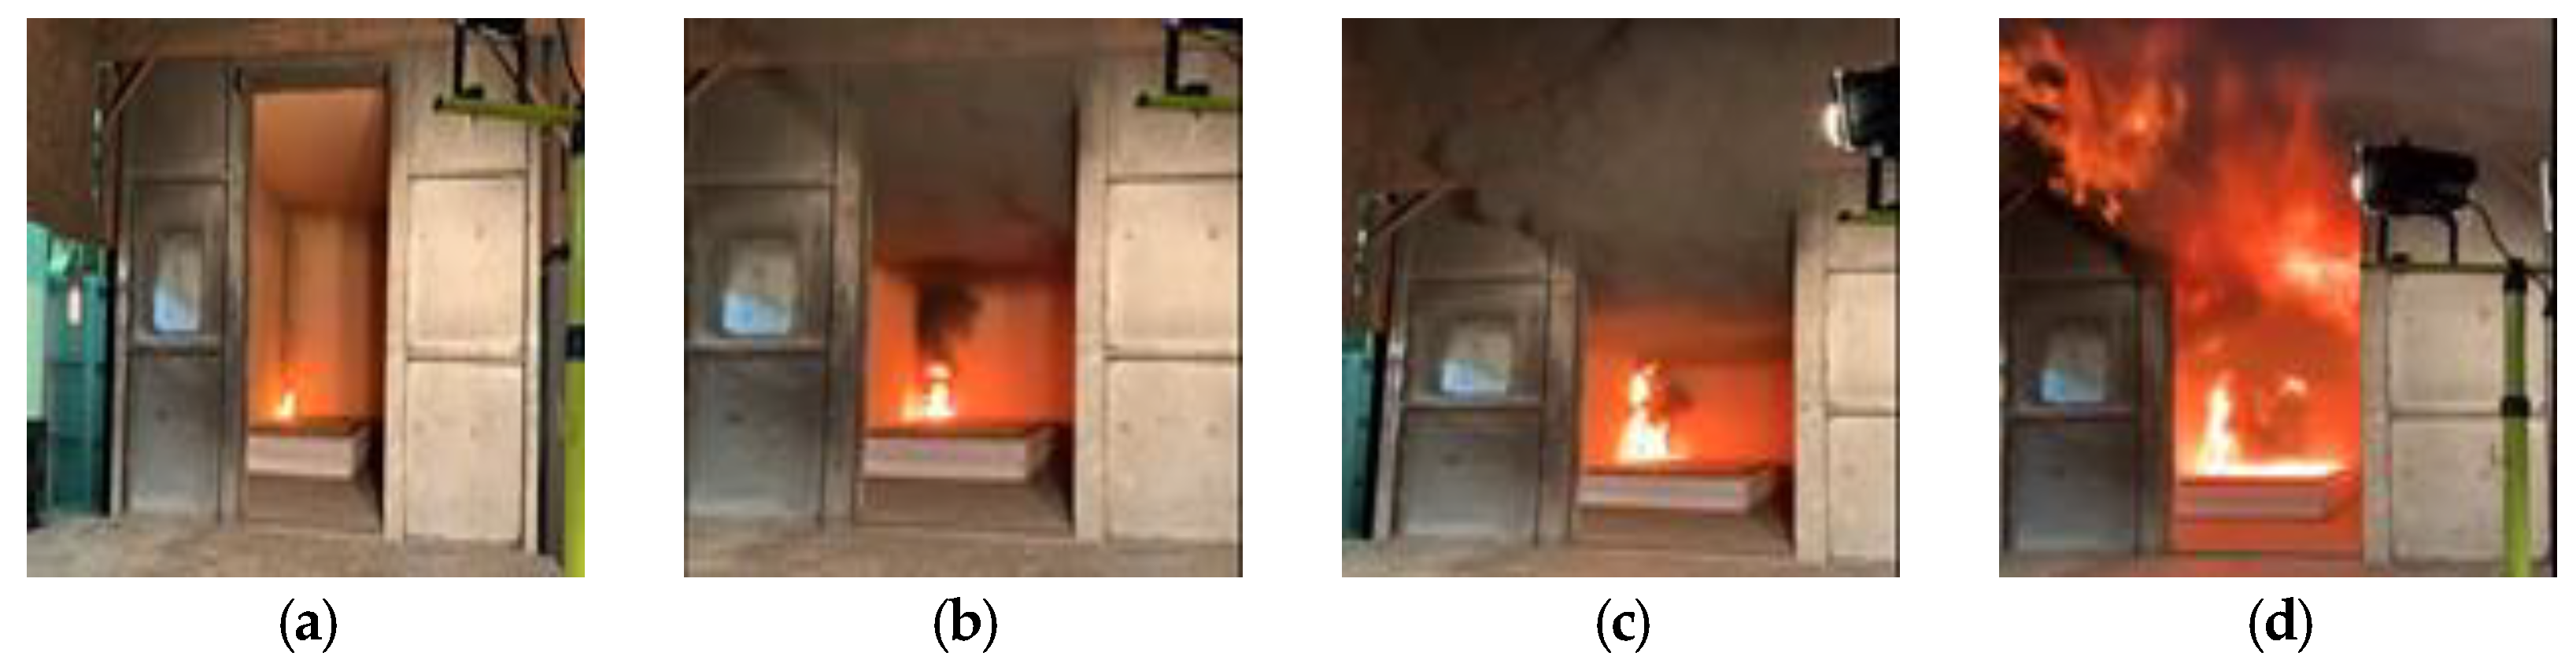
Figure 18.
Fire aspect of test room with desk and chair: (a) Ignition; (b) 80 s; (c) 100 s; (d) 120 s.
Figure 18.
Fire aspect of test room with desk and chair: (a) Ignition; (b) 80 s; (c) 100 s; (d) 120 s.
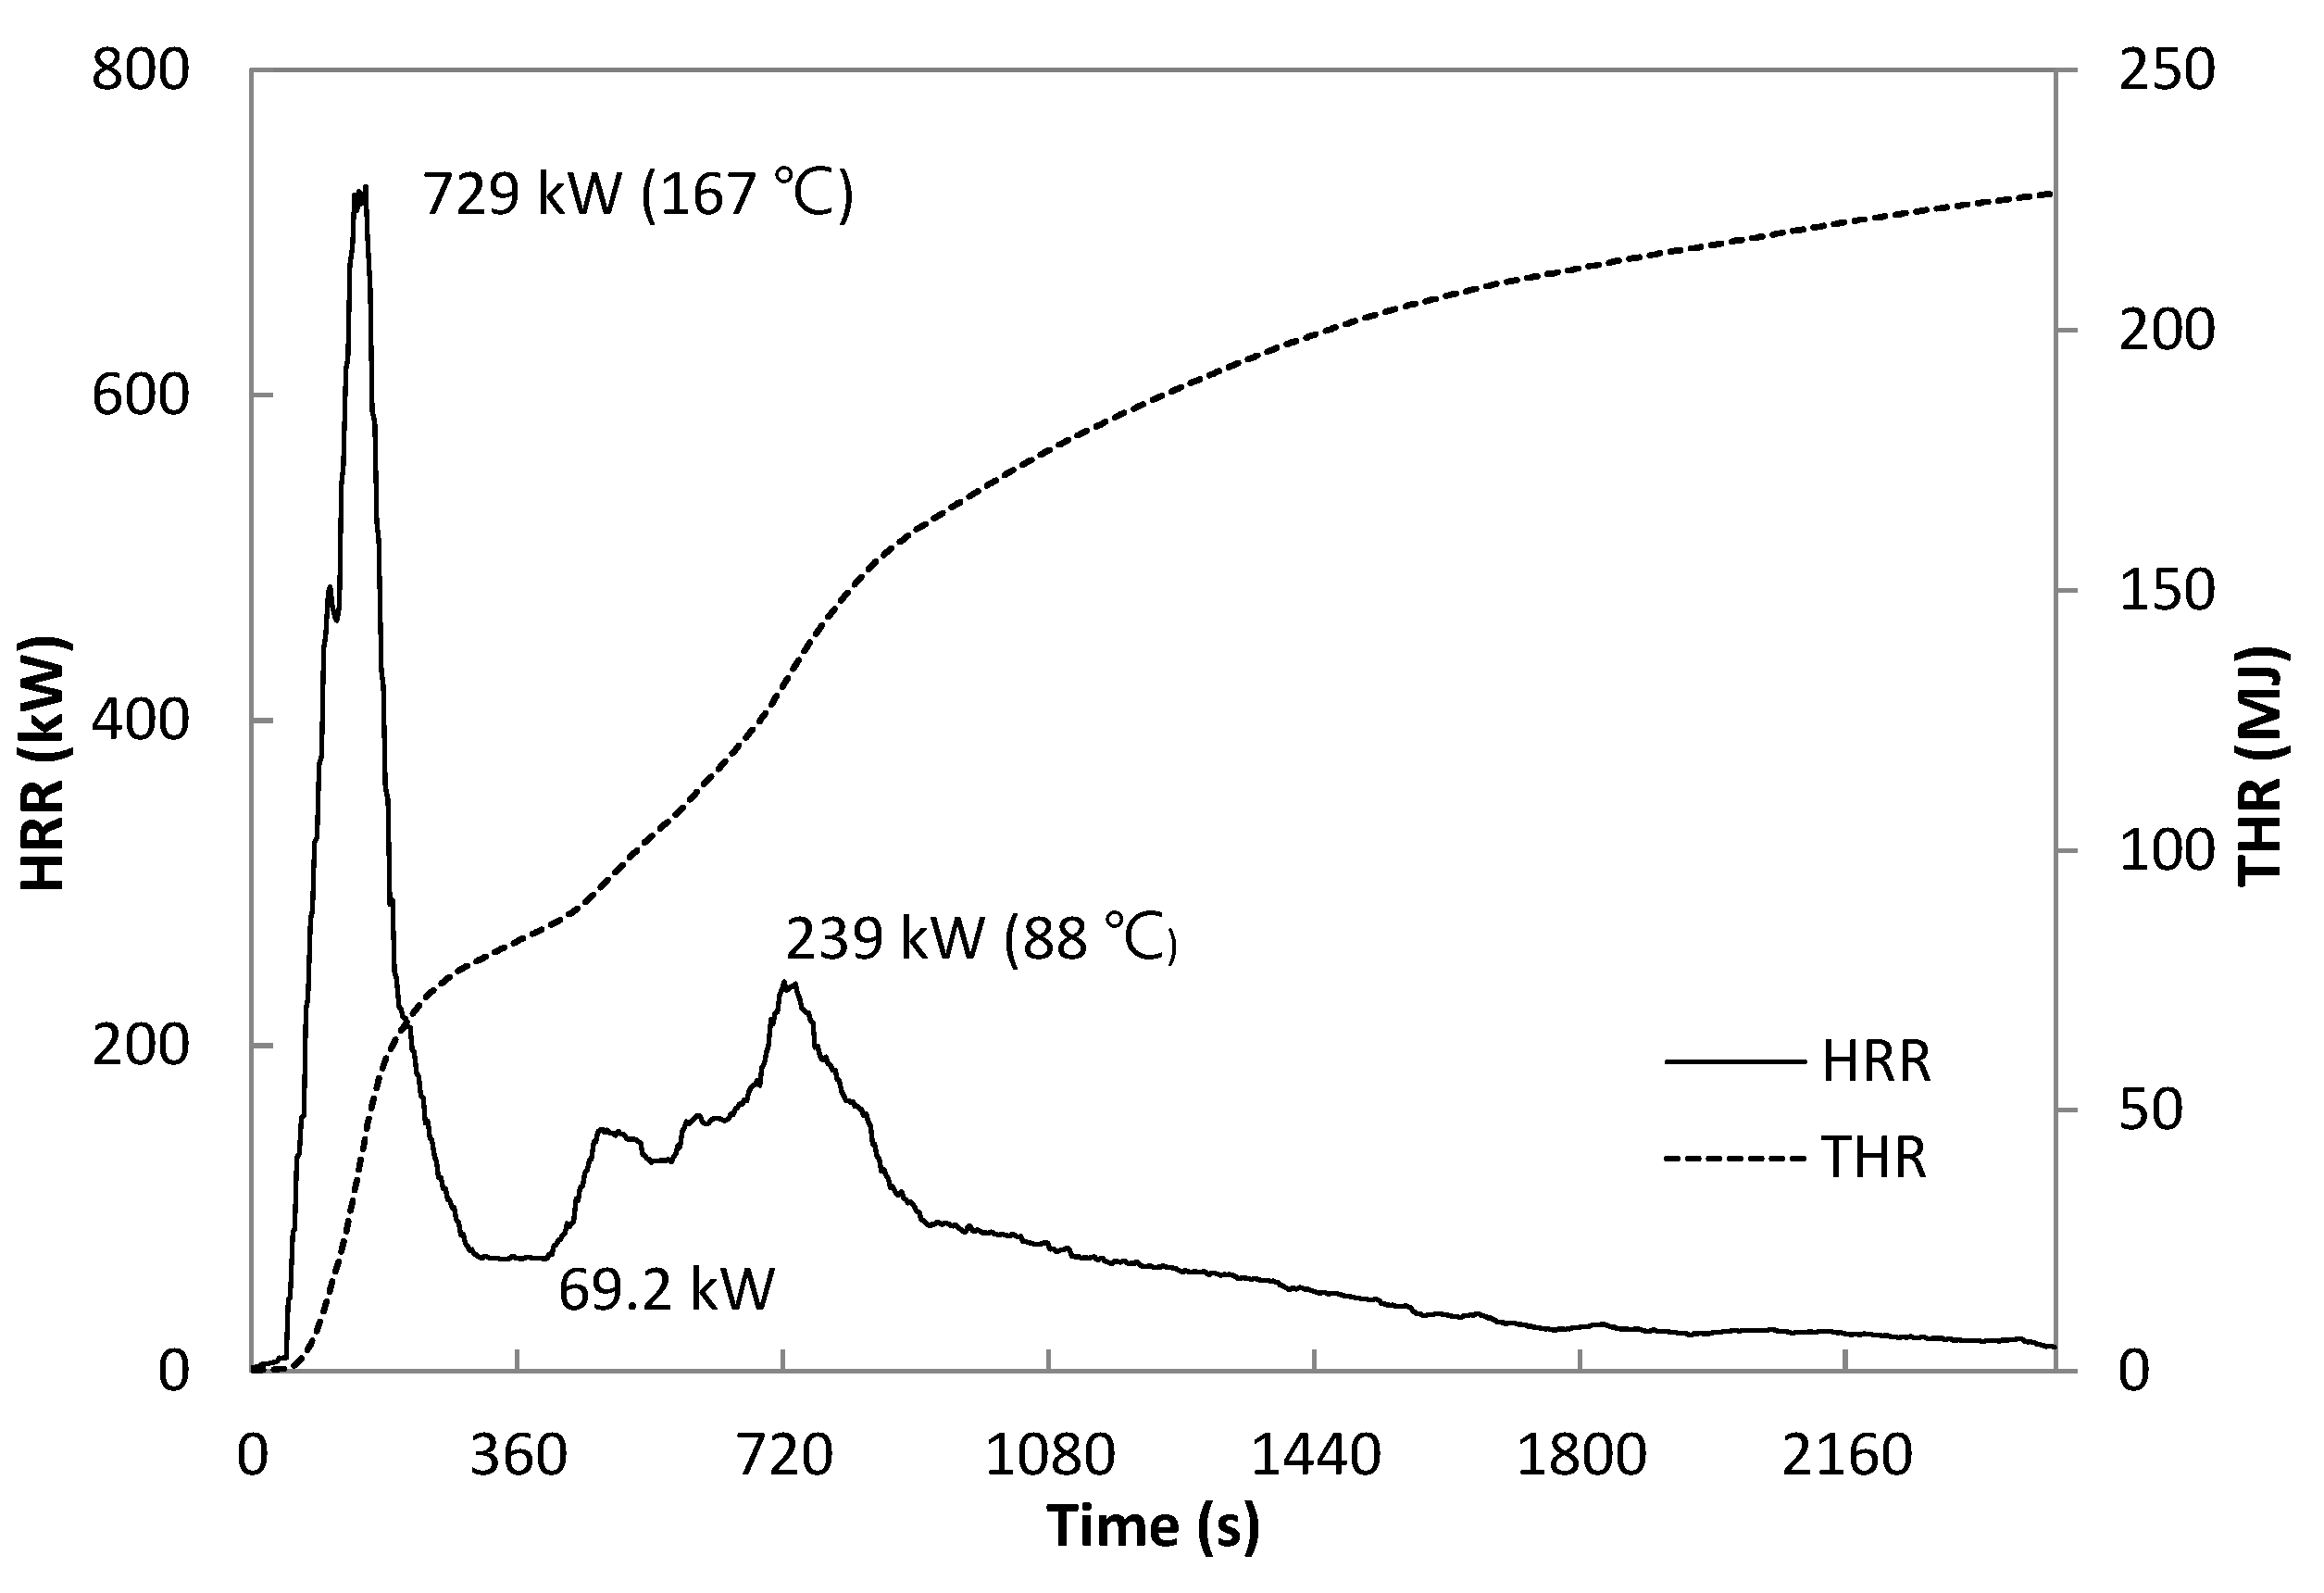
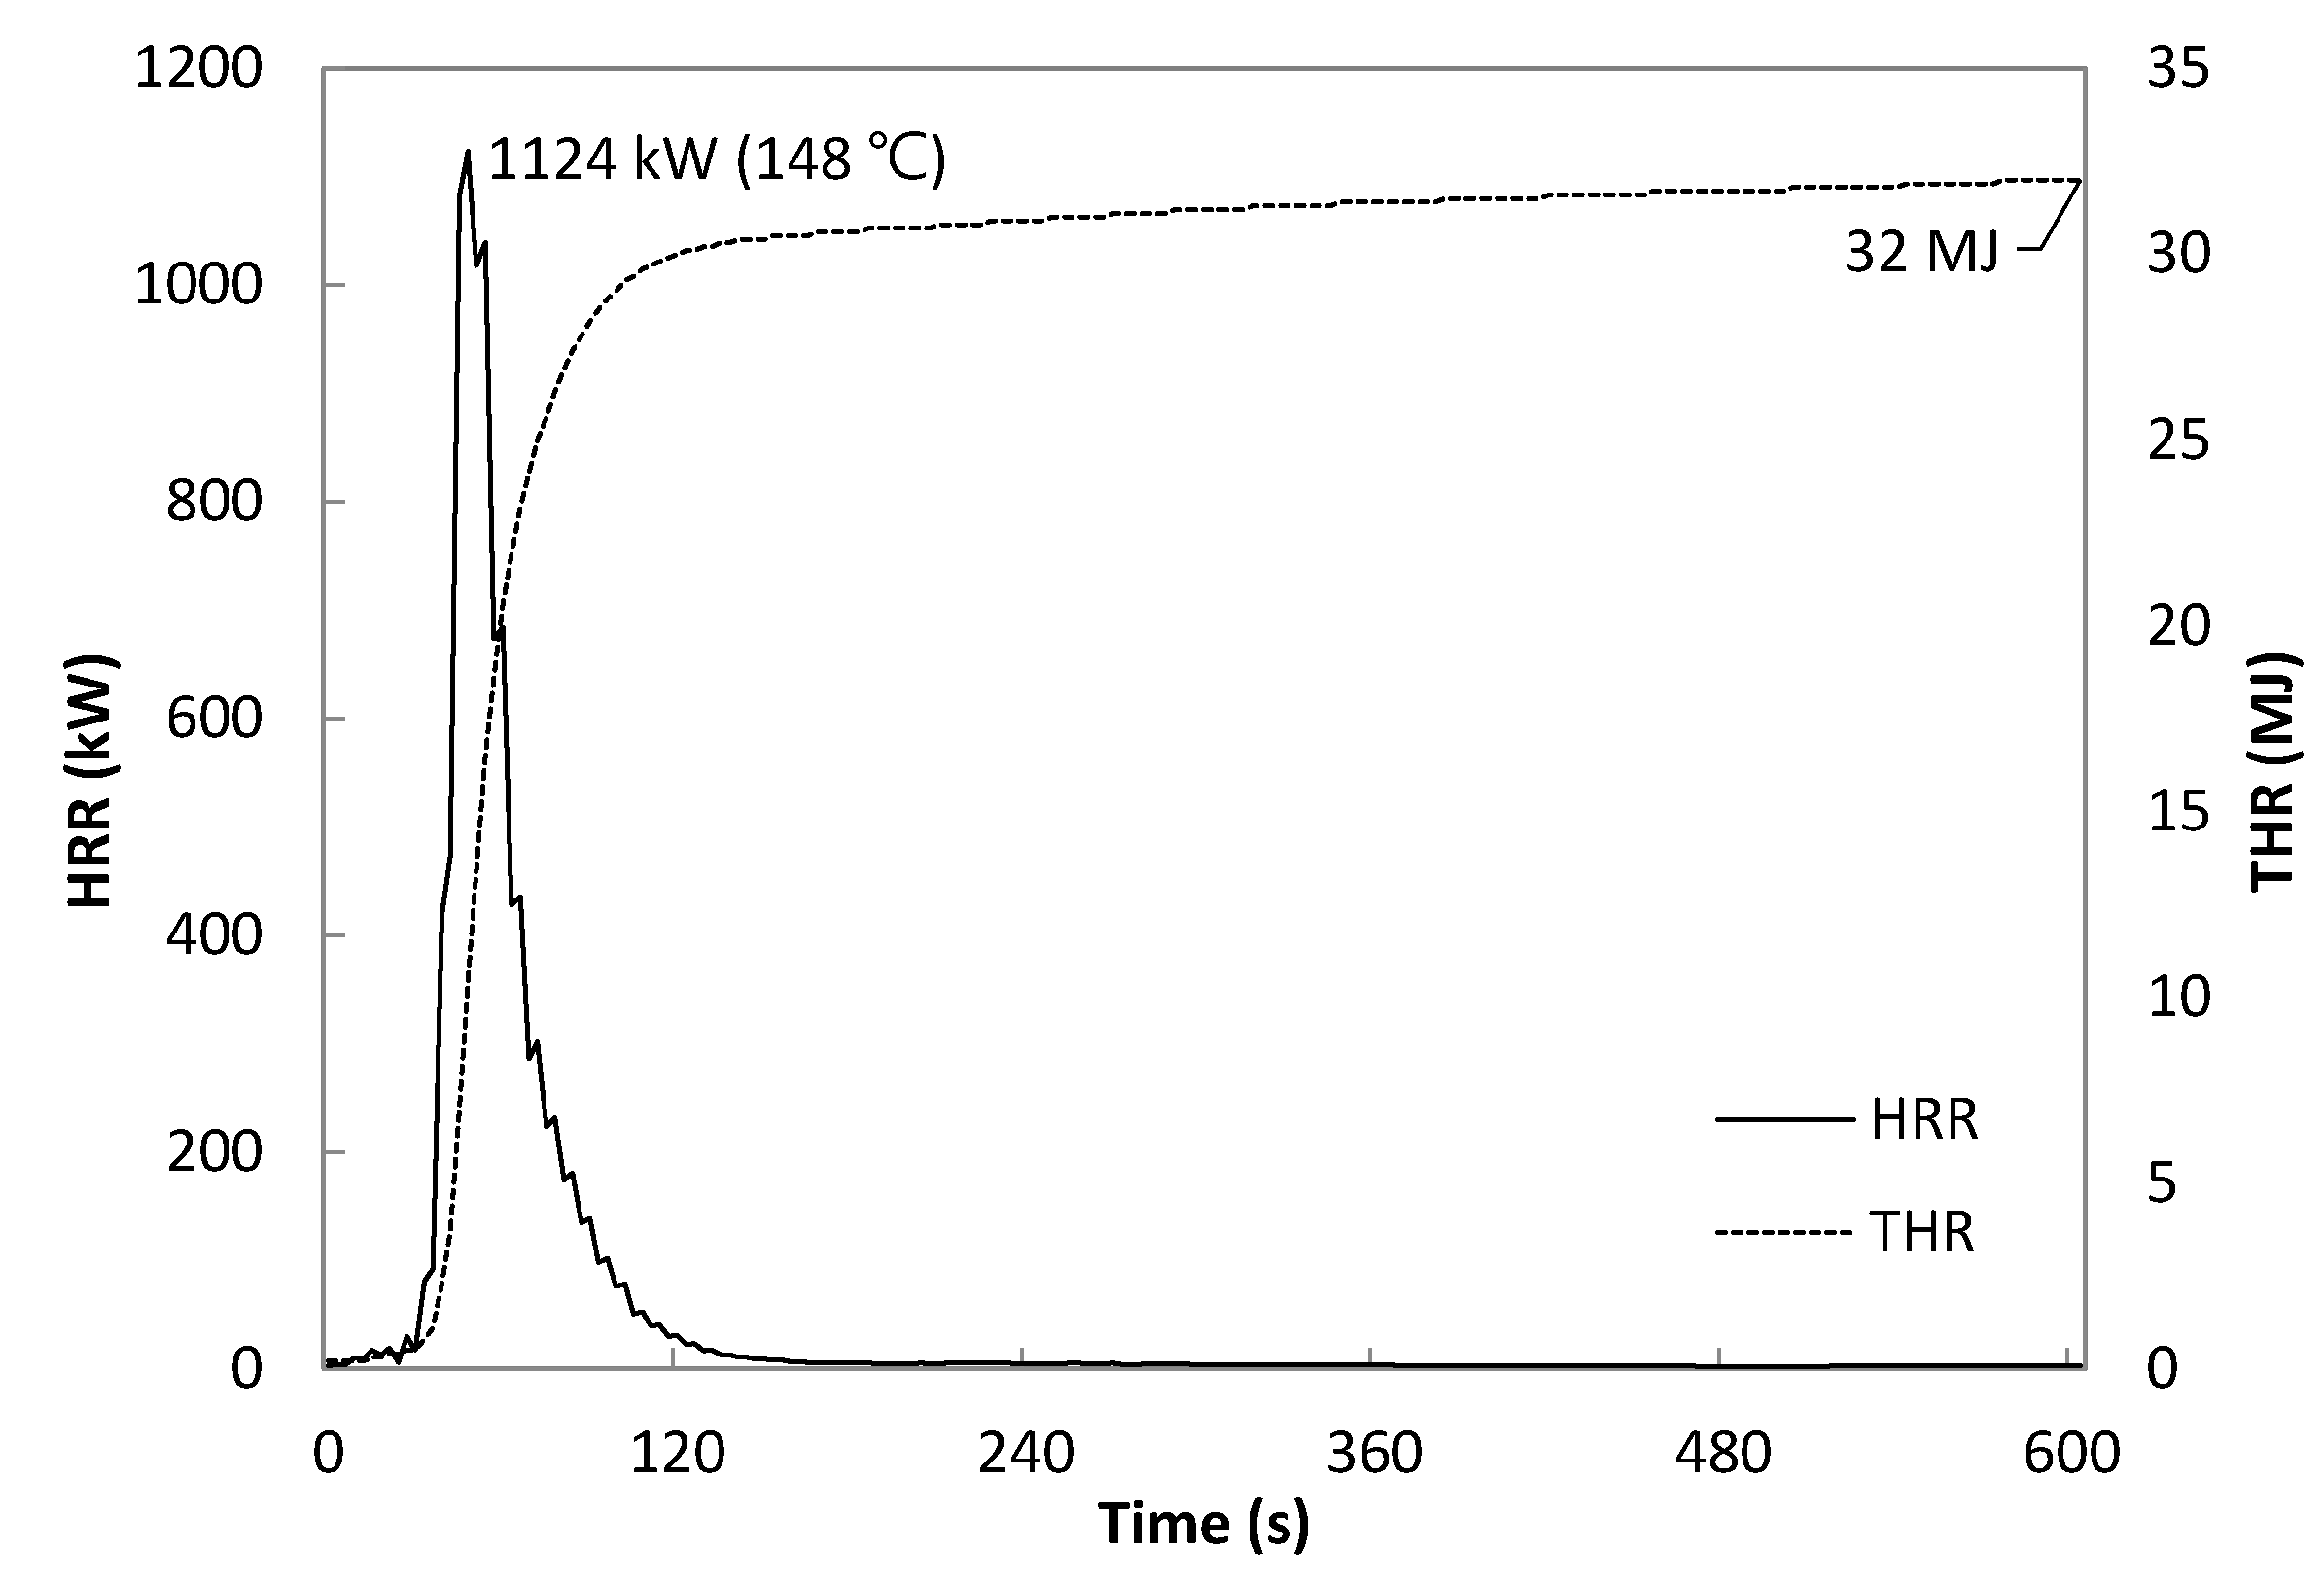
Figure 19.
HRR of sofa in test room.
Figure 19.
HRR of sofa in test room.
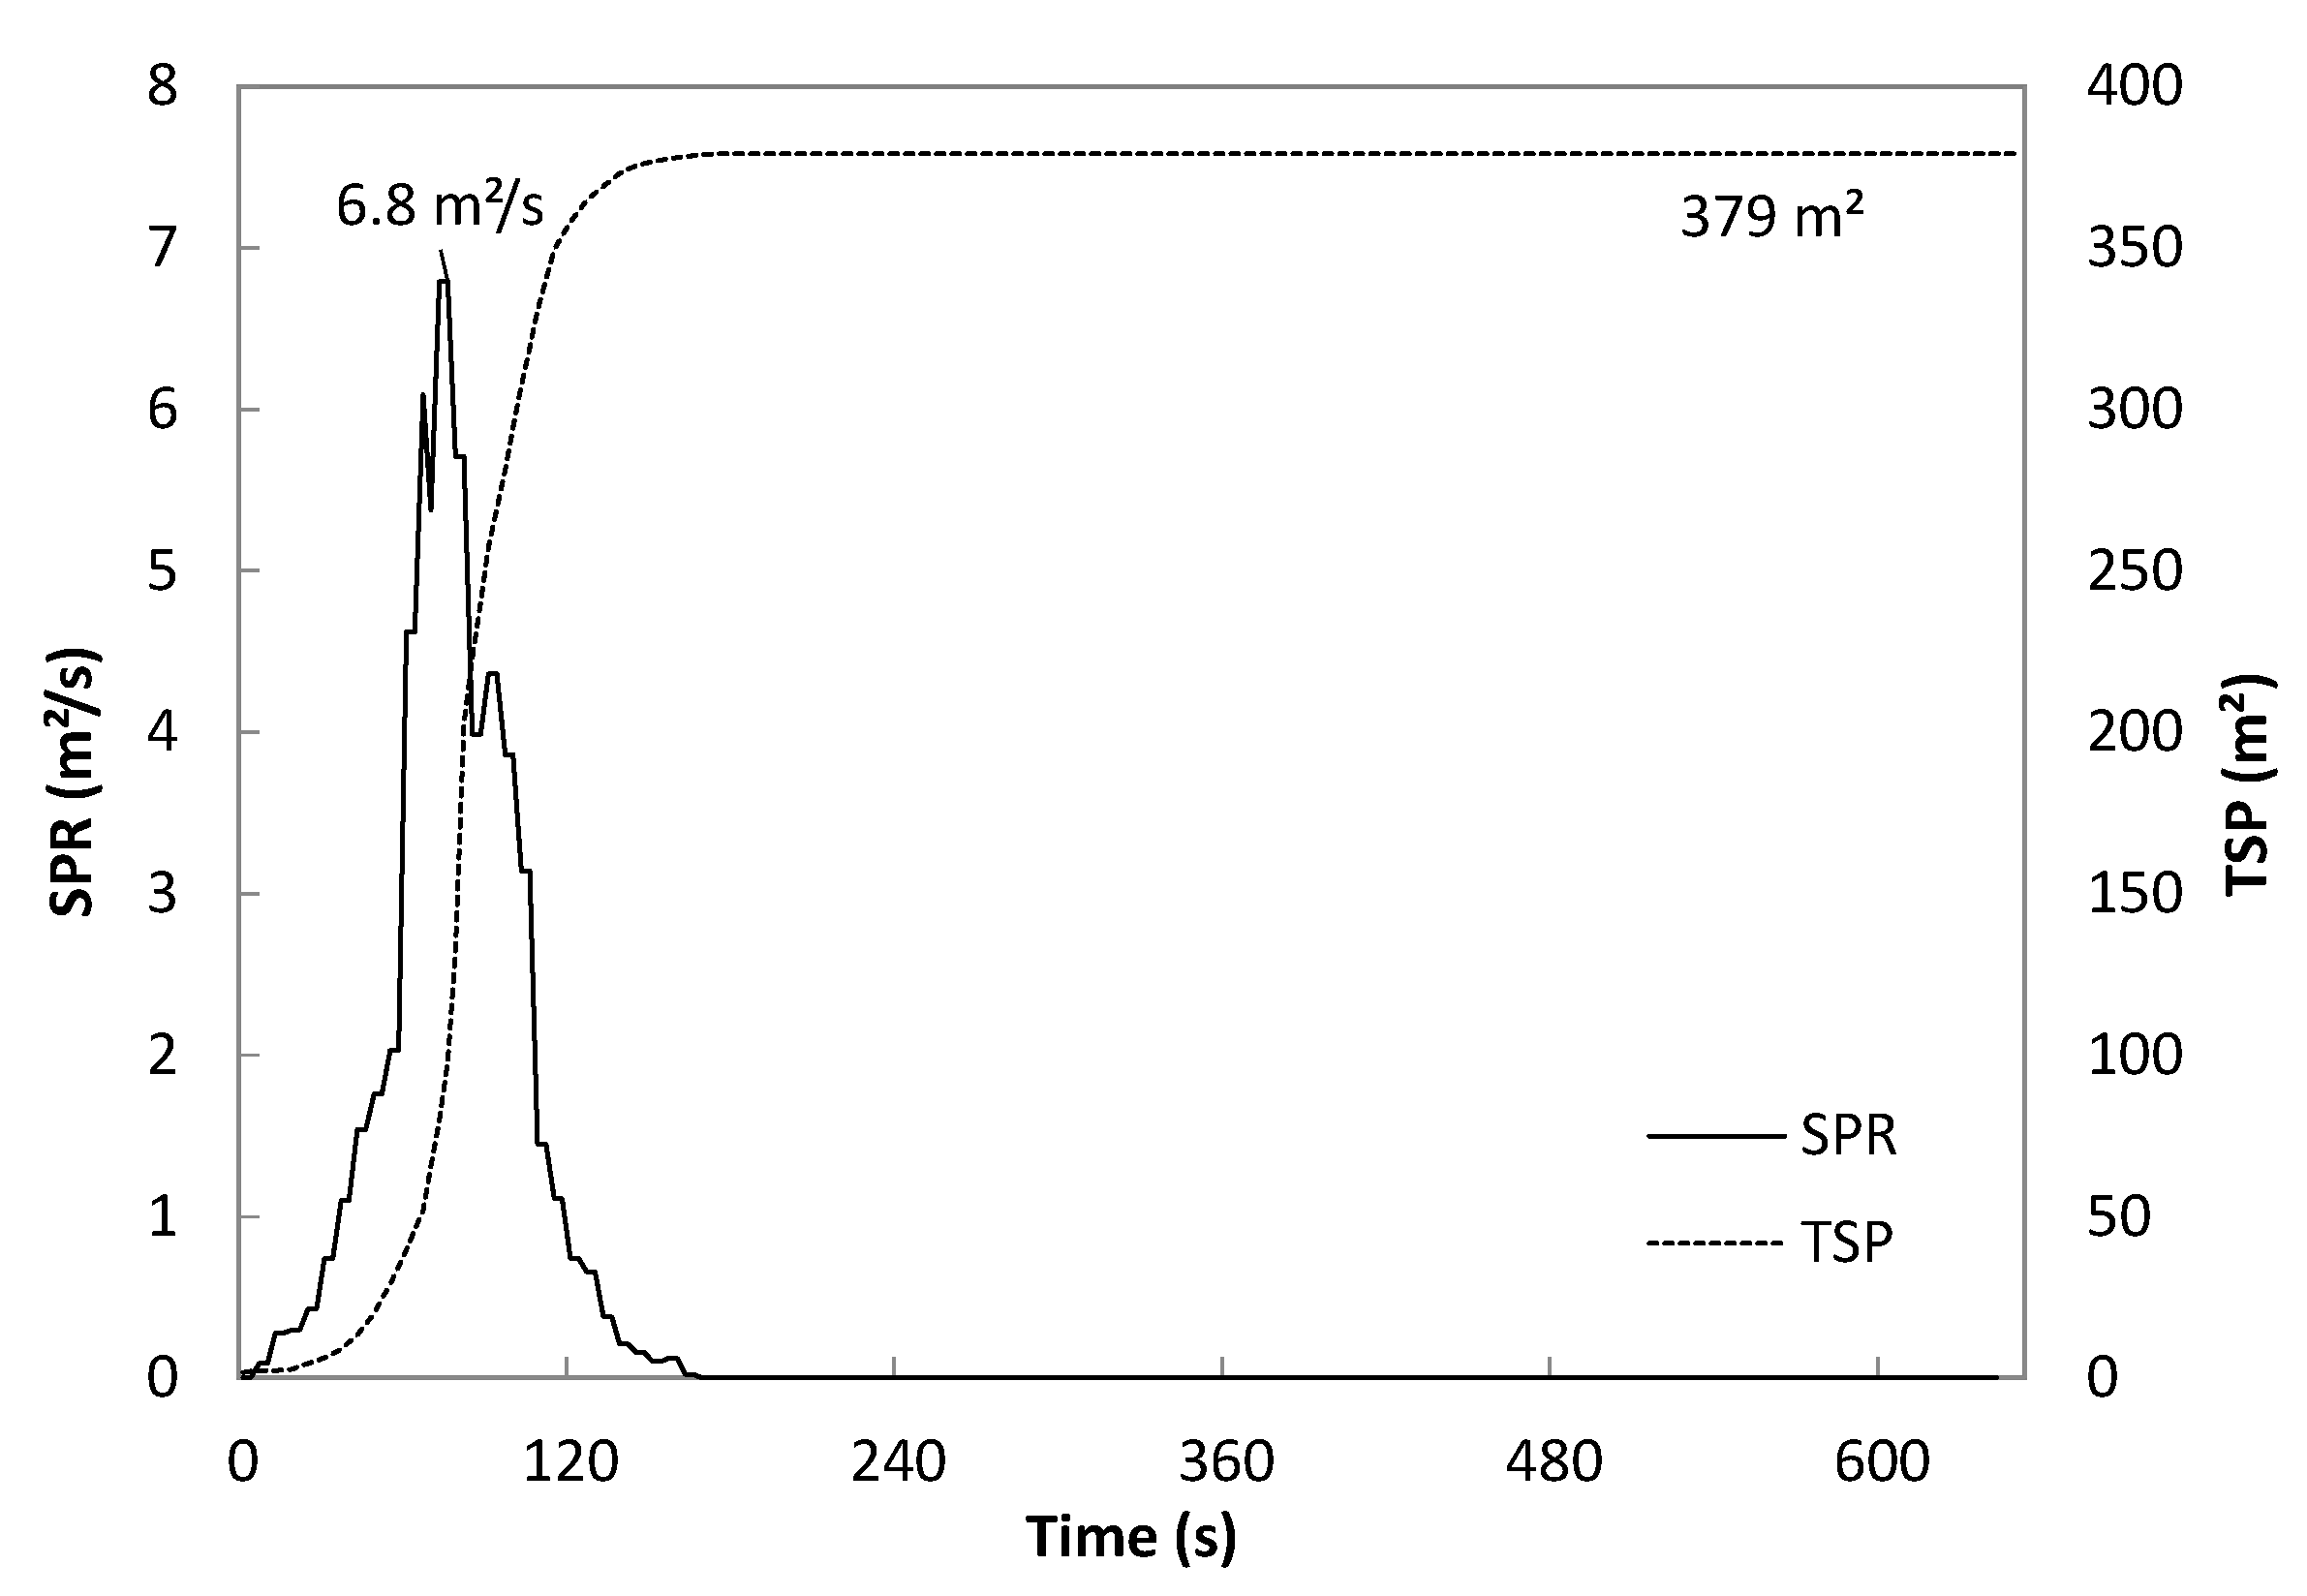
Figure 20.
SPR of sofa in test room.
Figure 20.
SPR of sofa in test room.
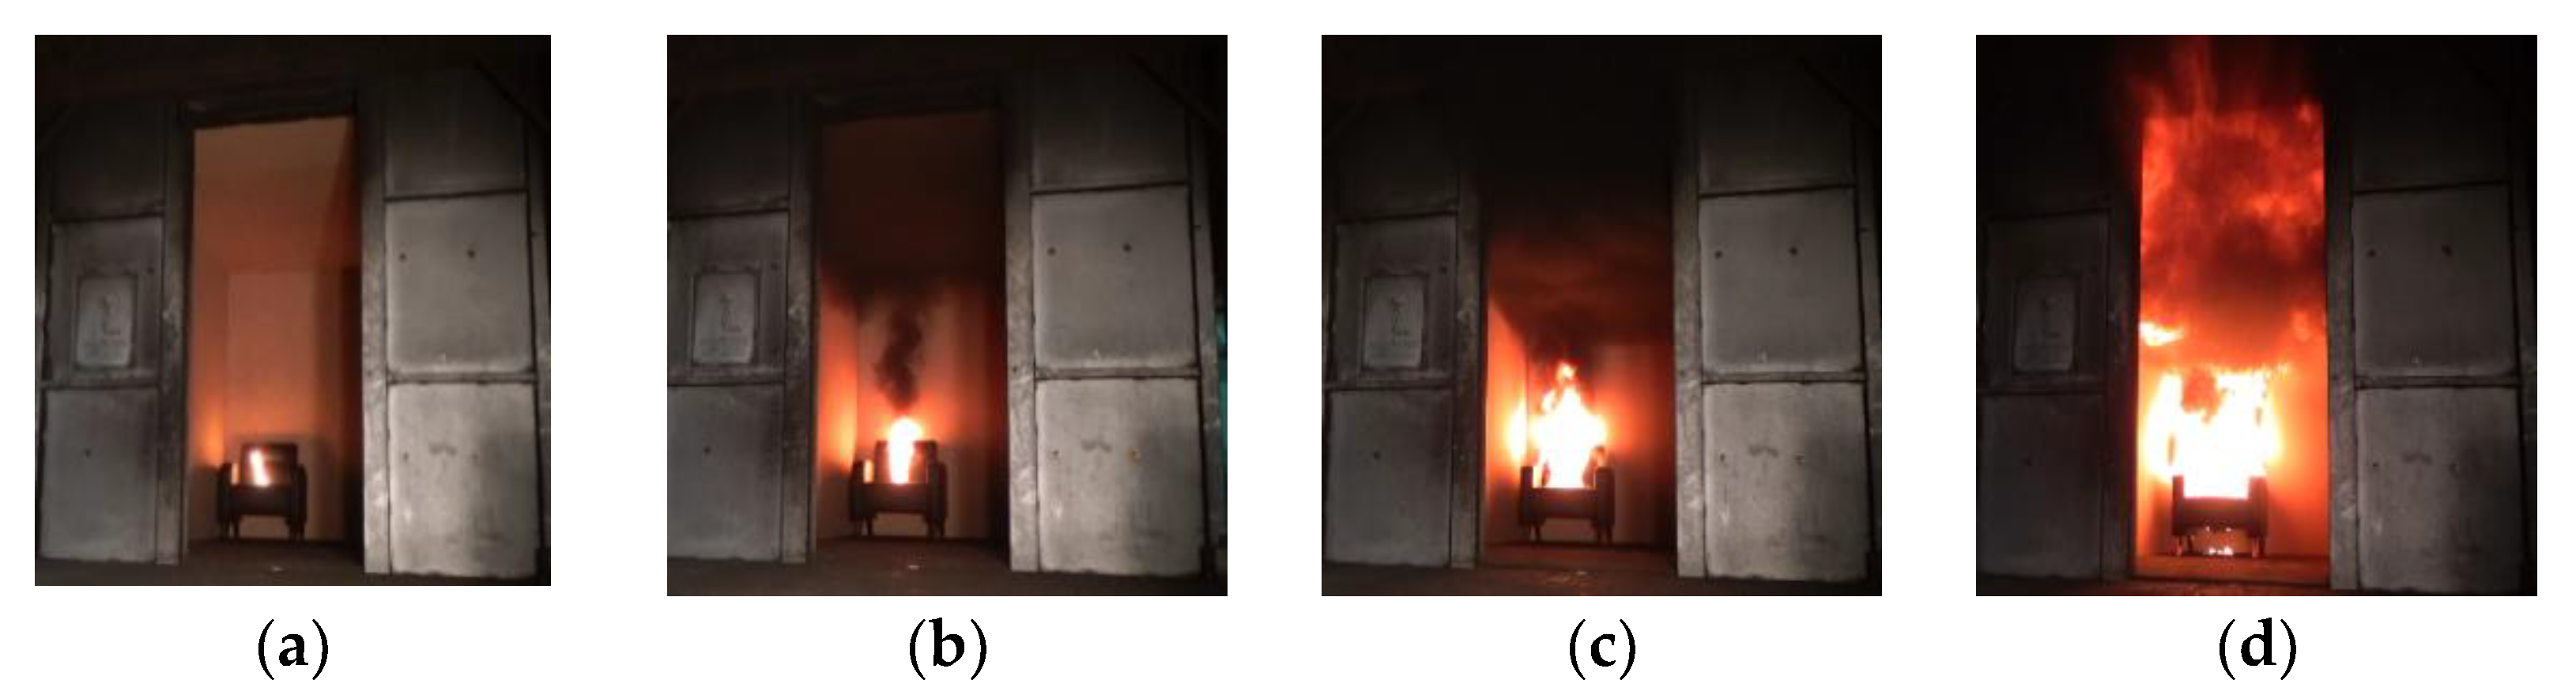
Figure 21.
Fire aspect of test room with sofa: (a) Ignition; (b) 60 s; (c) 150 s; (d) 160 s.
Figure 21.
Fire aspect of test room with sofa: (a) Ignition; (b) 60 s; (c) 150 s; (d) 160 s.
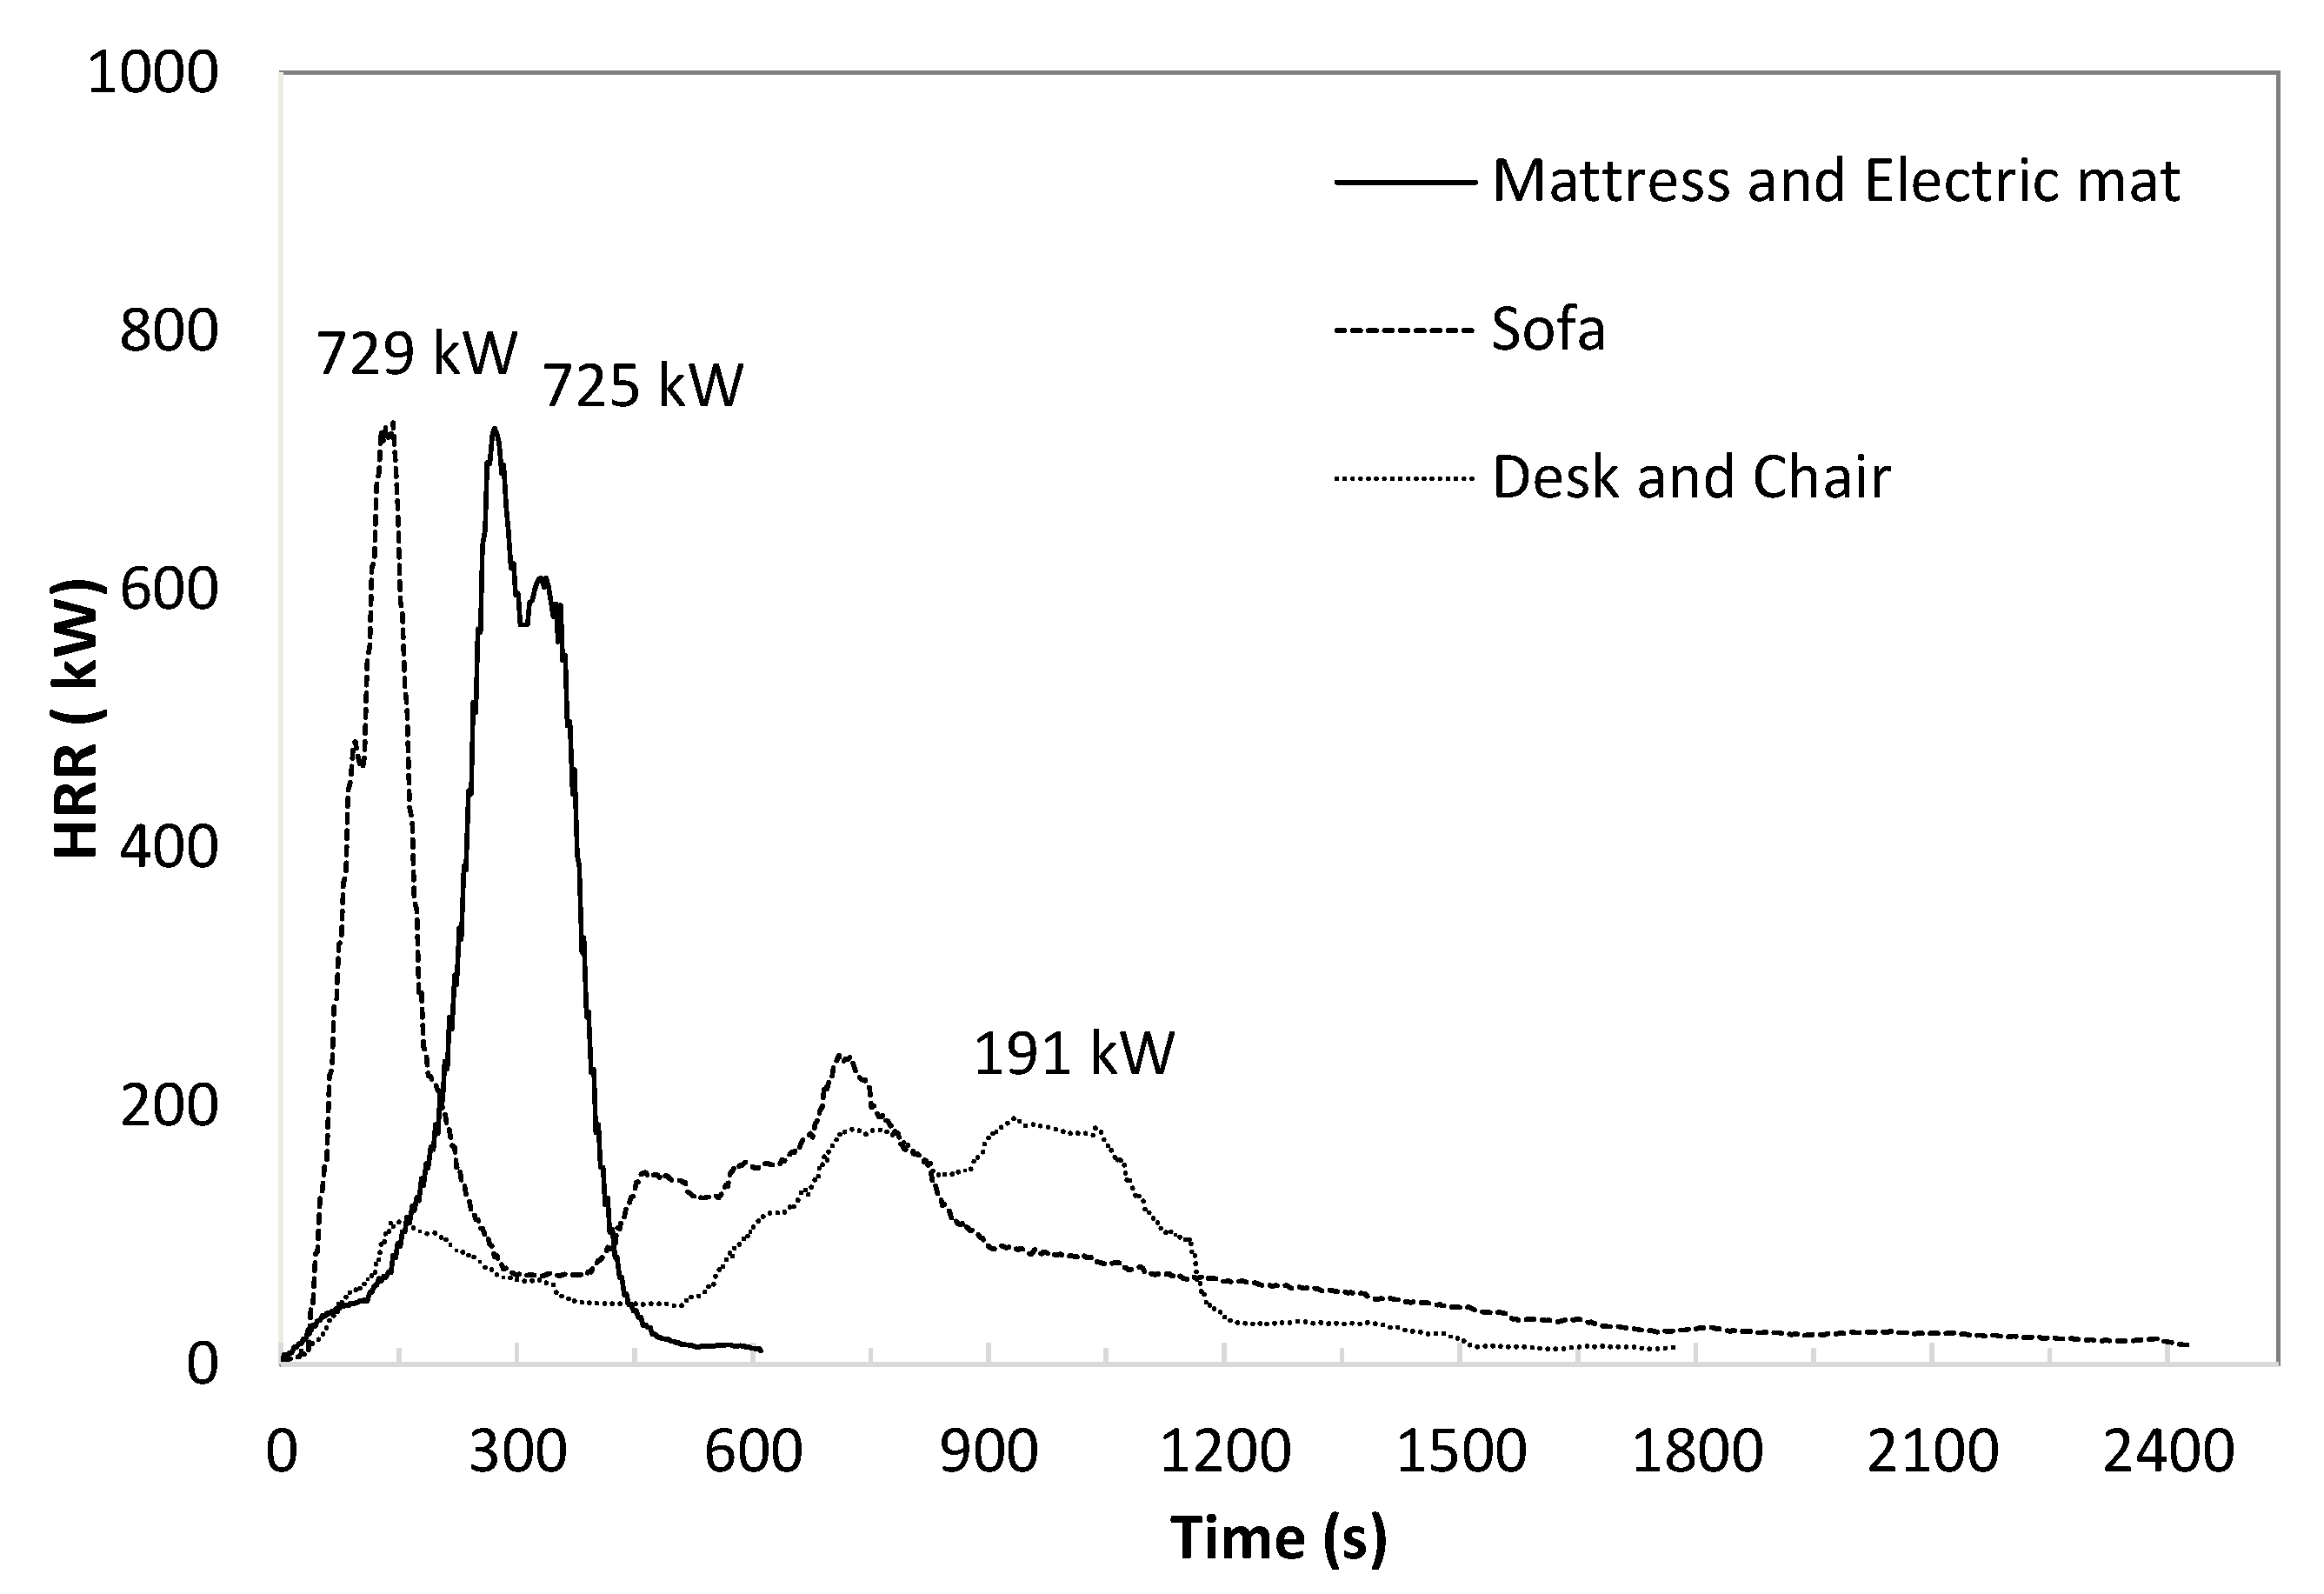
Figure 22.
HRR in combustible materials tests.
Figure 22.
HRR in combustible materials tests.
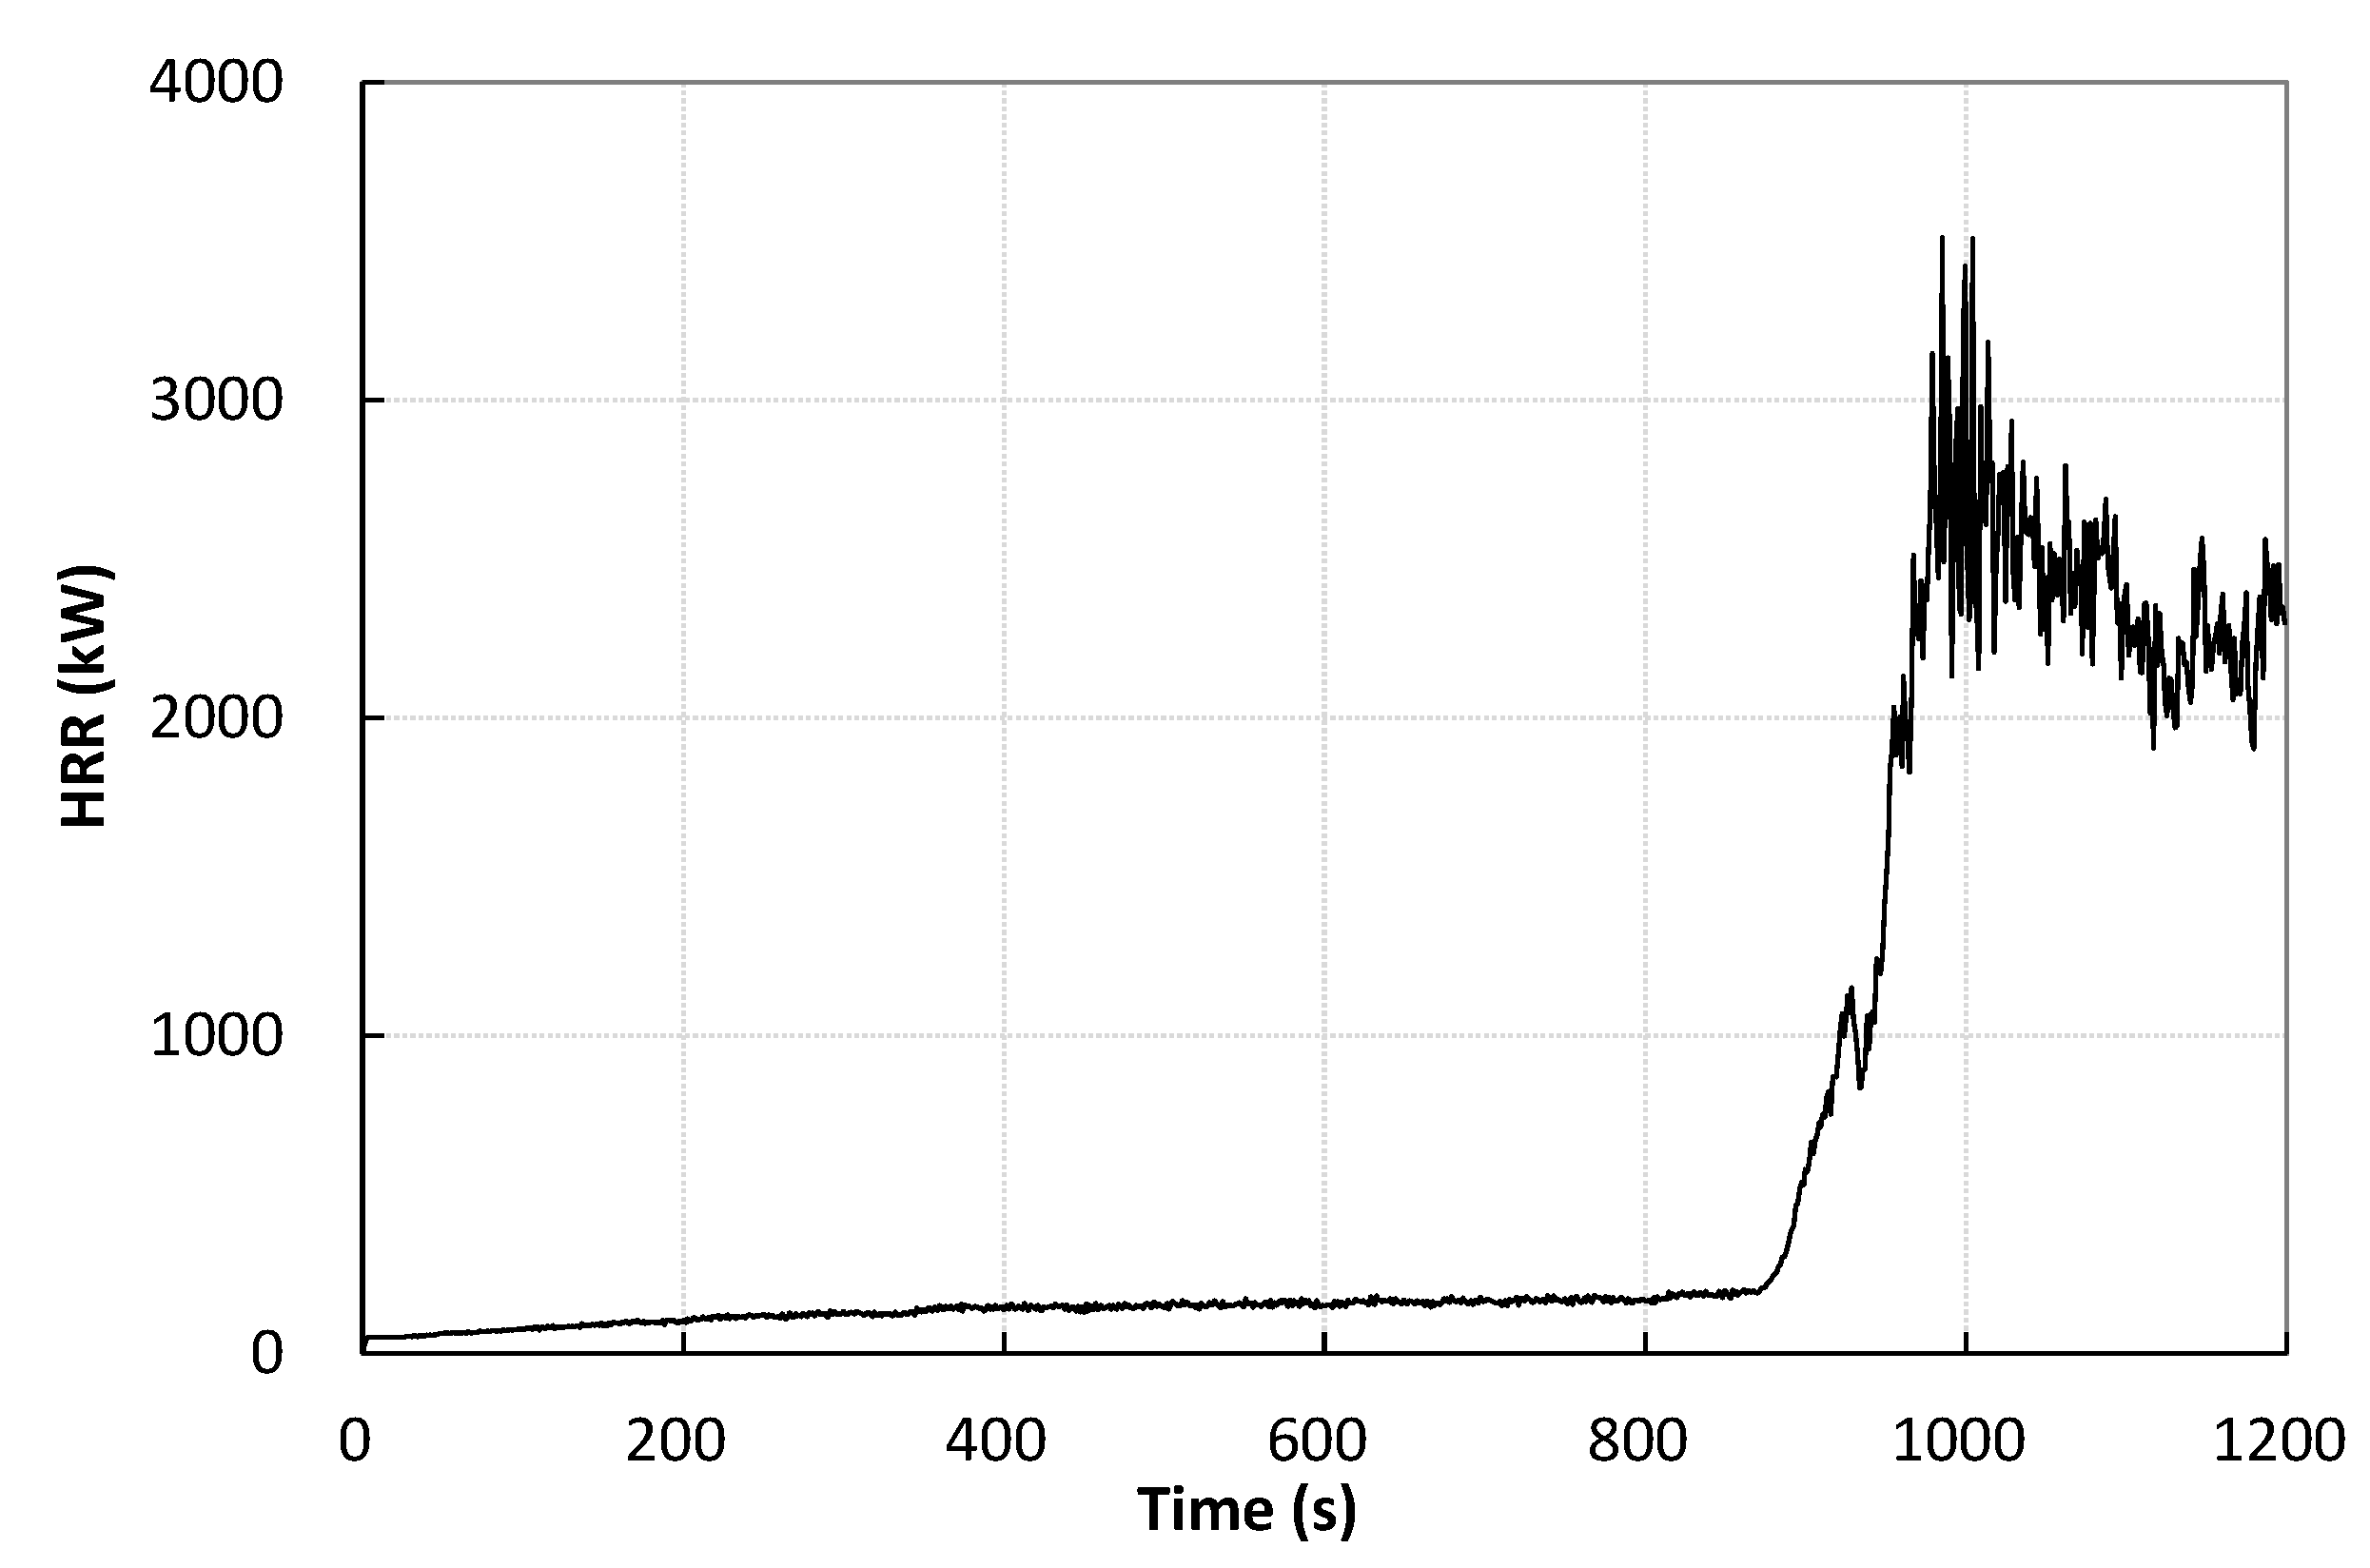
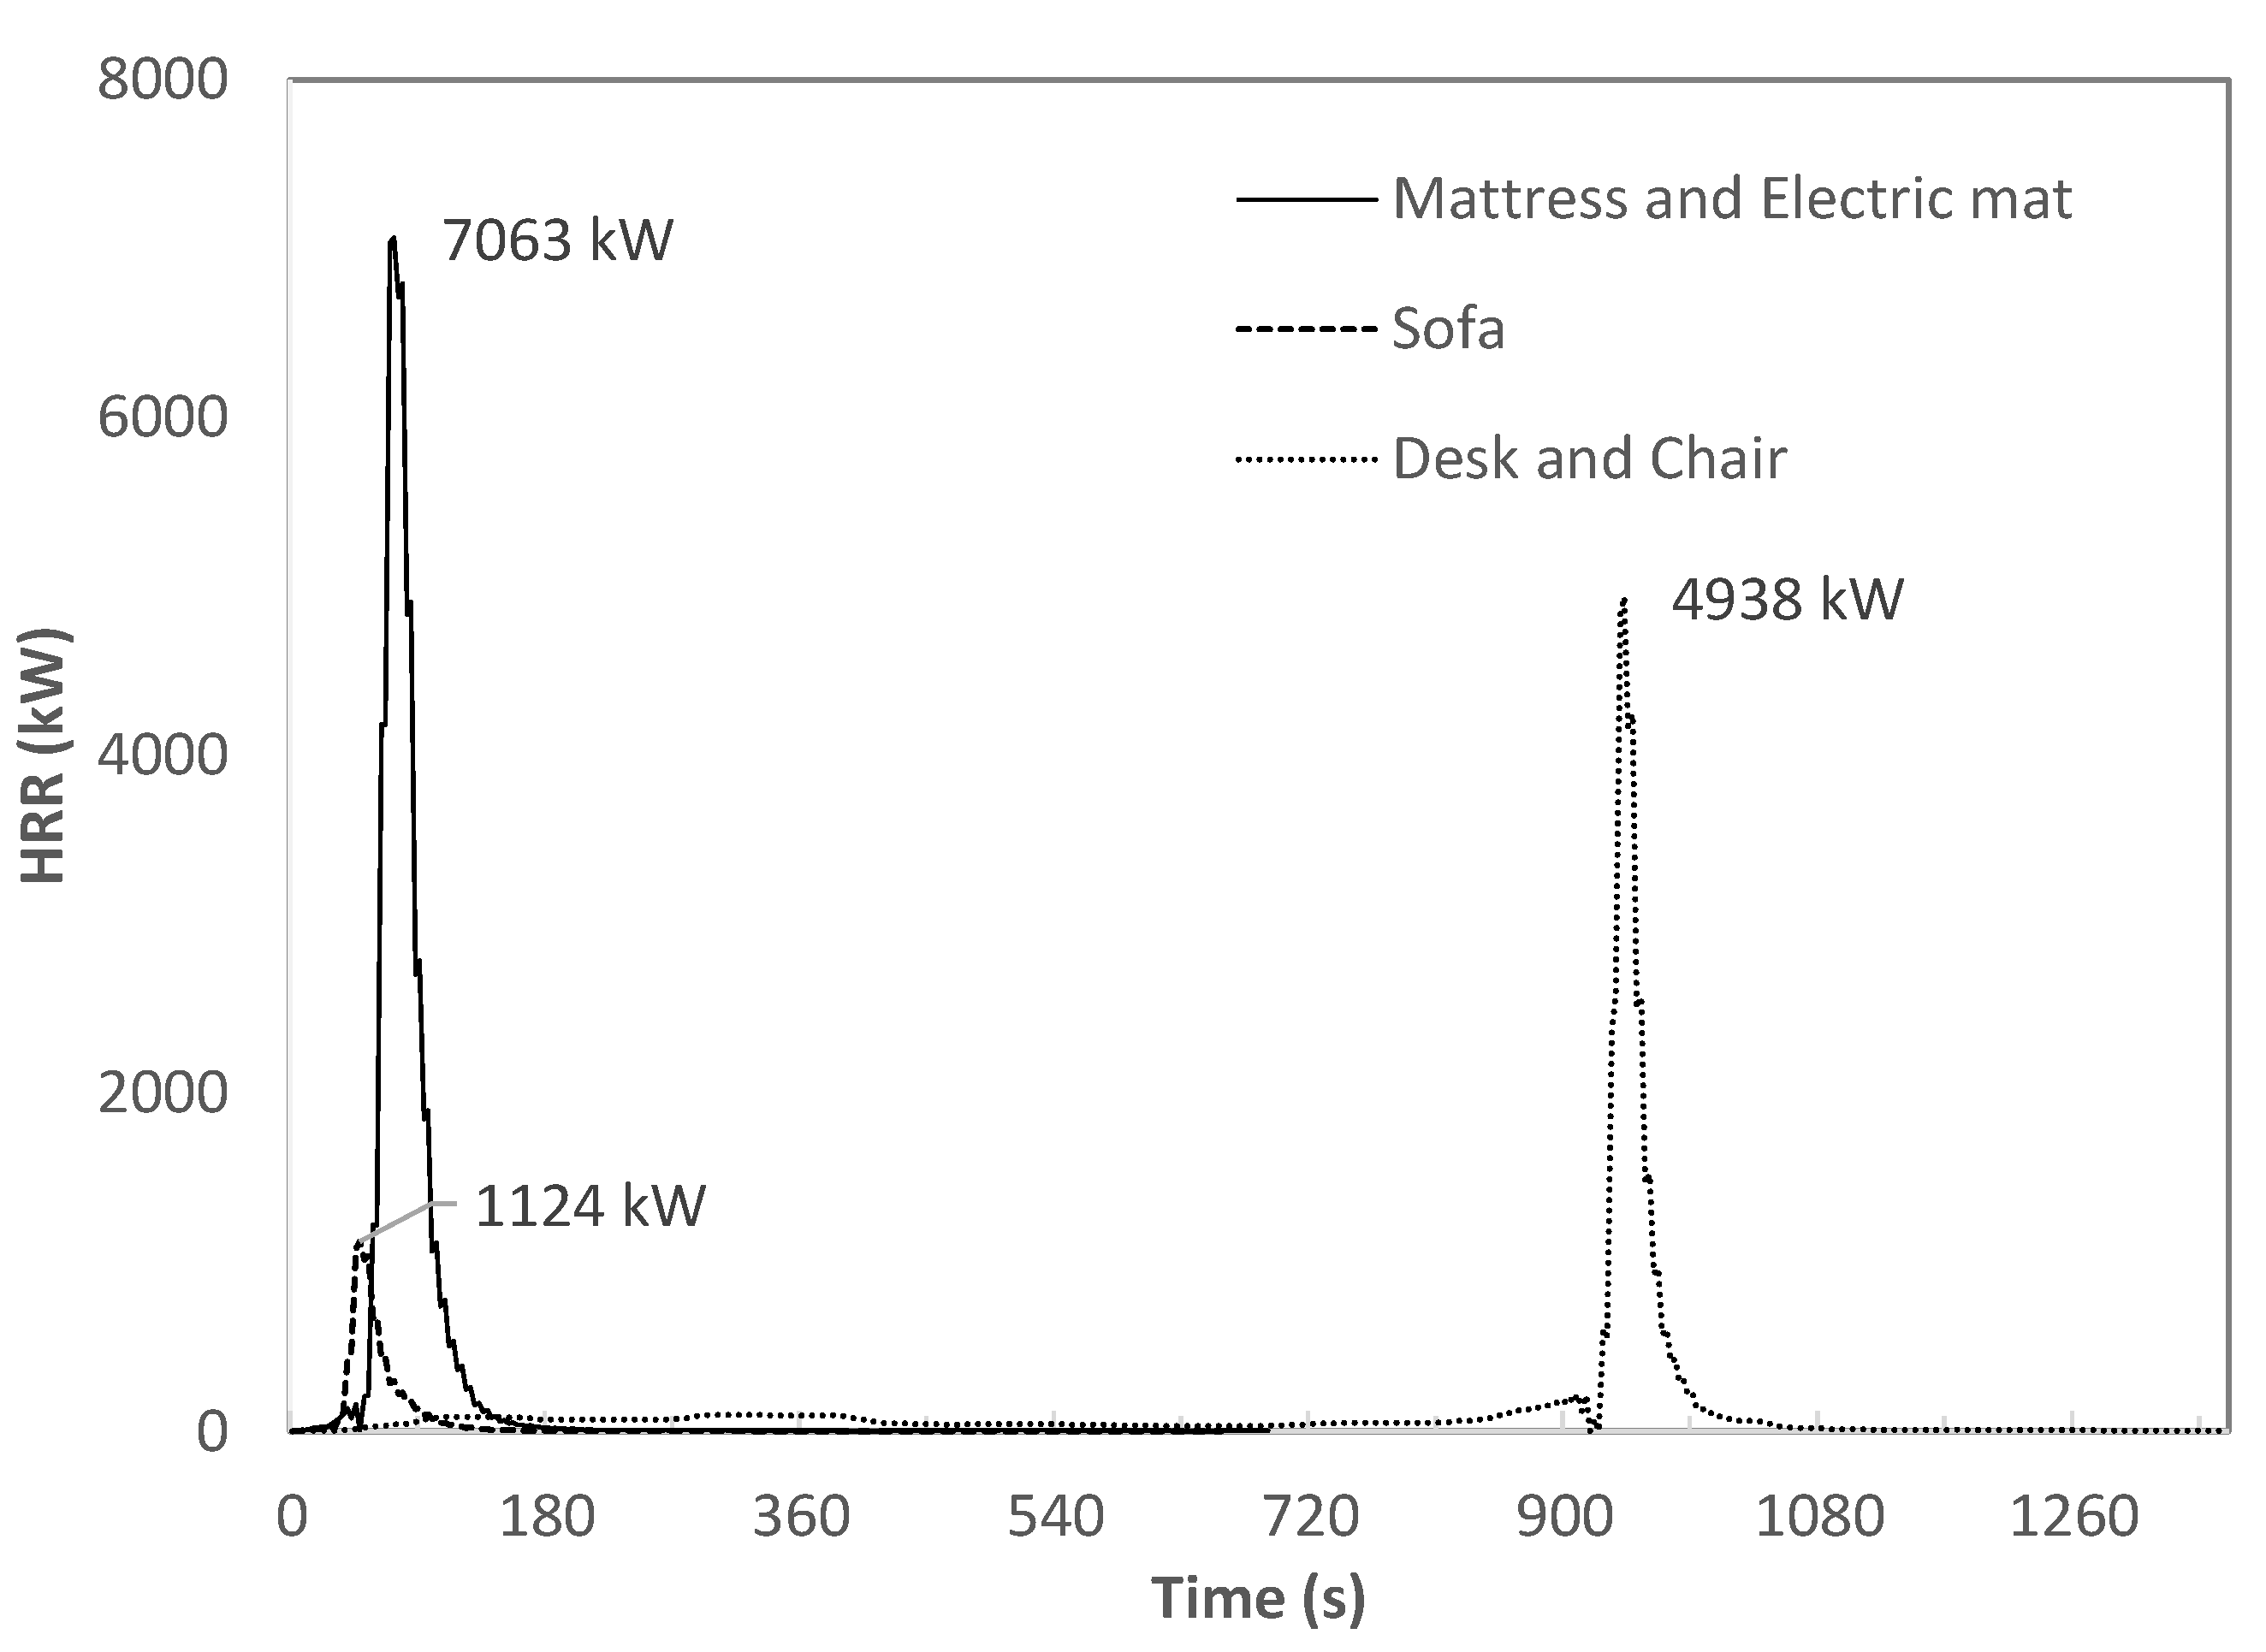
Figure 23.
HRR in the compartment fire experiments.
Figure 23.
HRR in the compartment fire experiments.
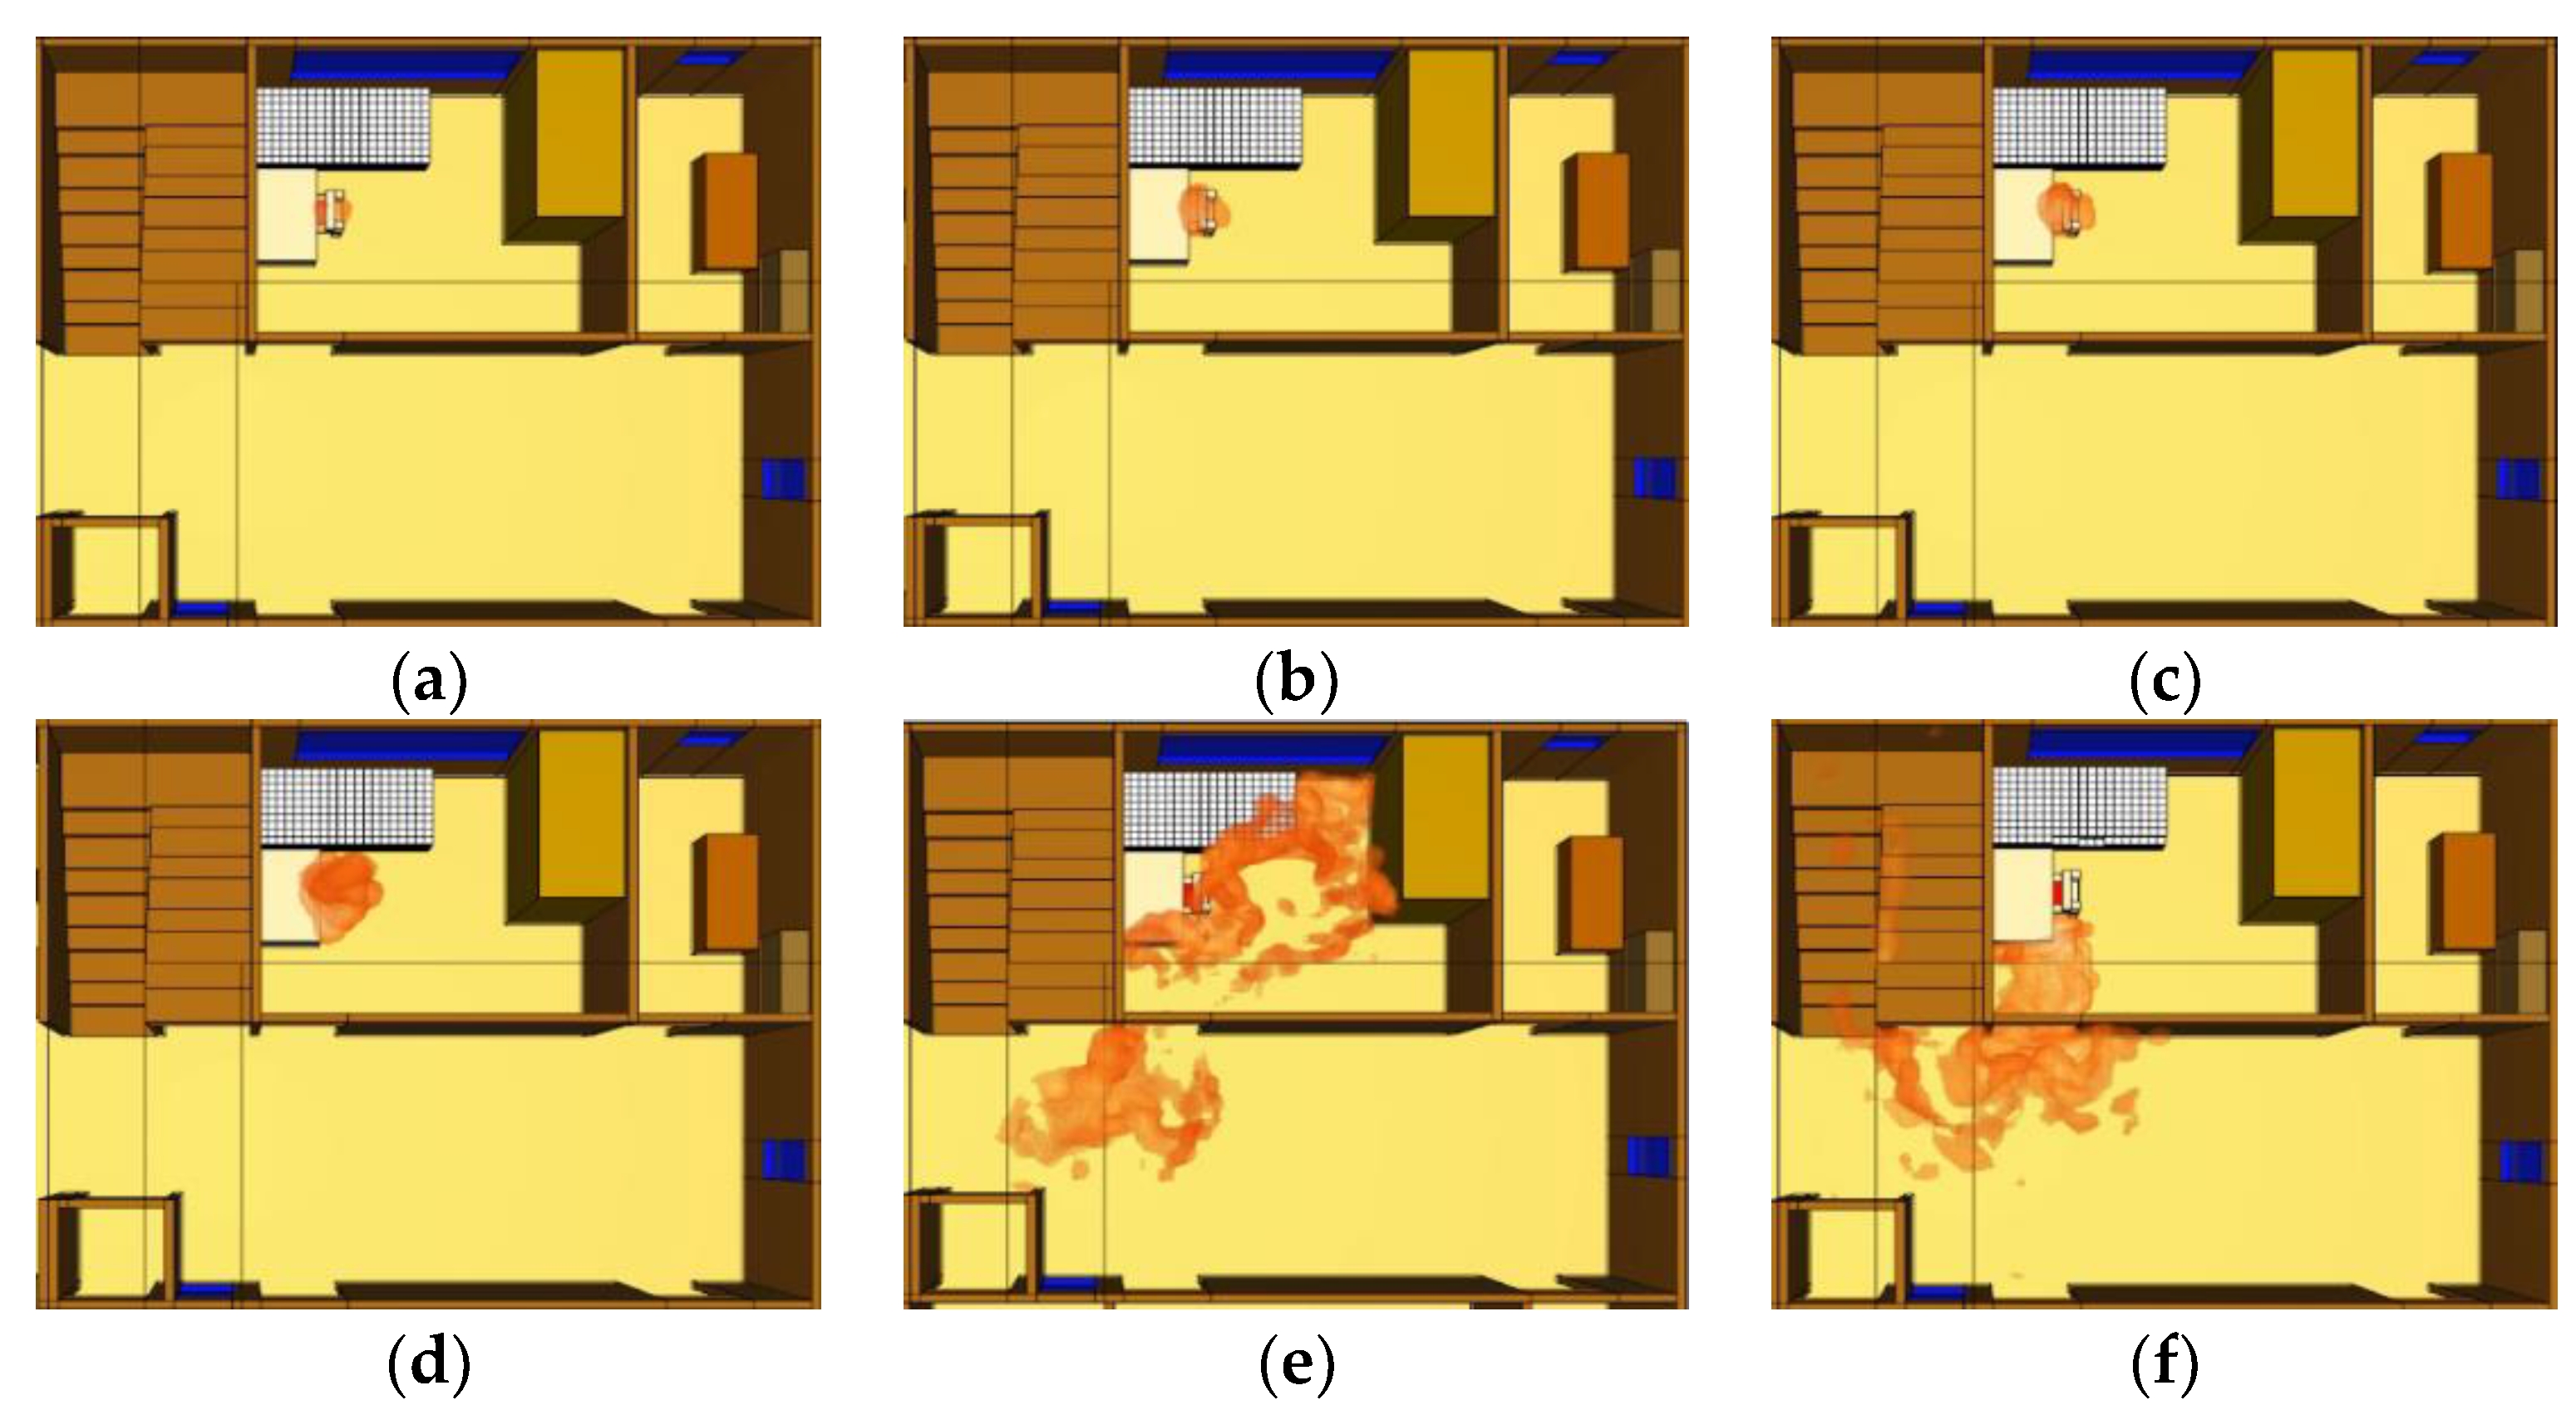
Figure 24.
Fire behavior over time until flashover (desk and chair): (a) Ignition; (b) 400 s; (c) 800 s; (d) 900 s; (e) 1000 s; (f) 1100 s.
Figure 24.
Fire behavior over time until flashover (desk and chair): (a) Ignition; (b) 400 s; (c) 800 s; (d) 900 s; (e) 1000 s; (f) 1100 s.
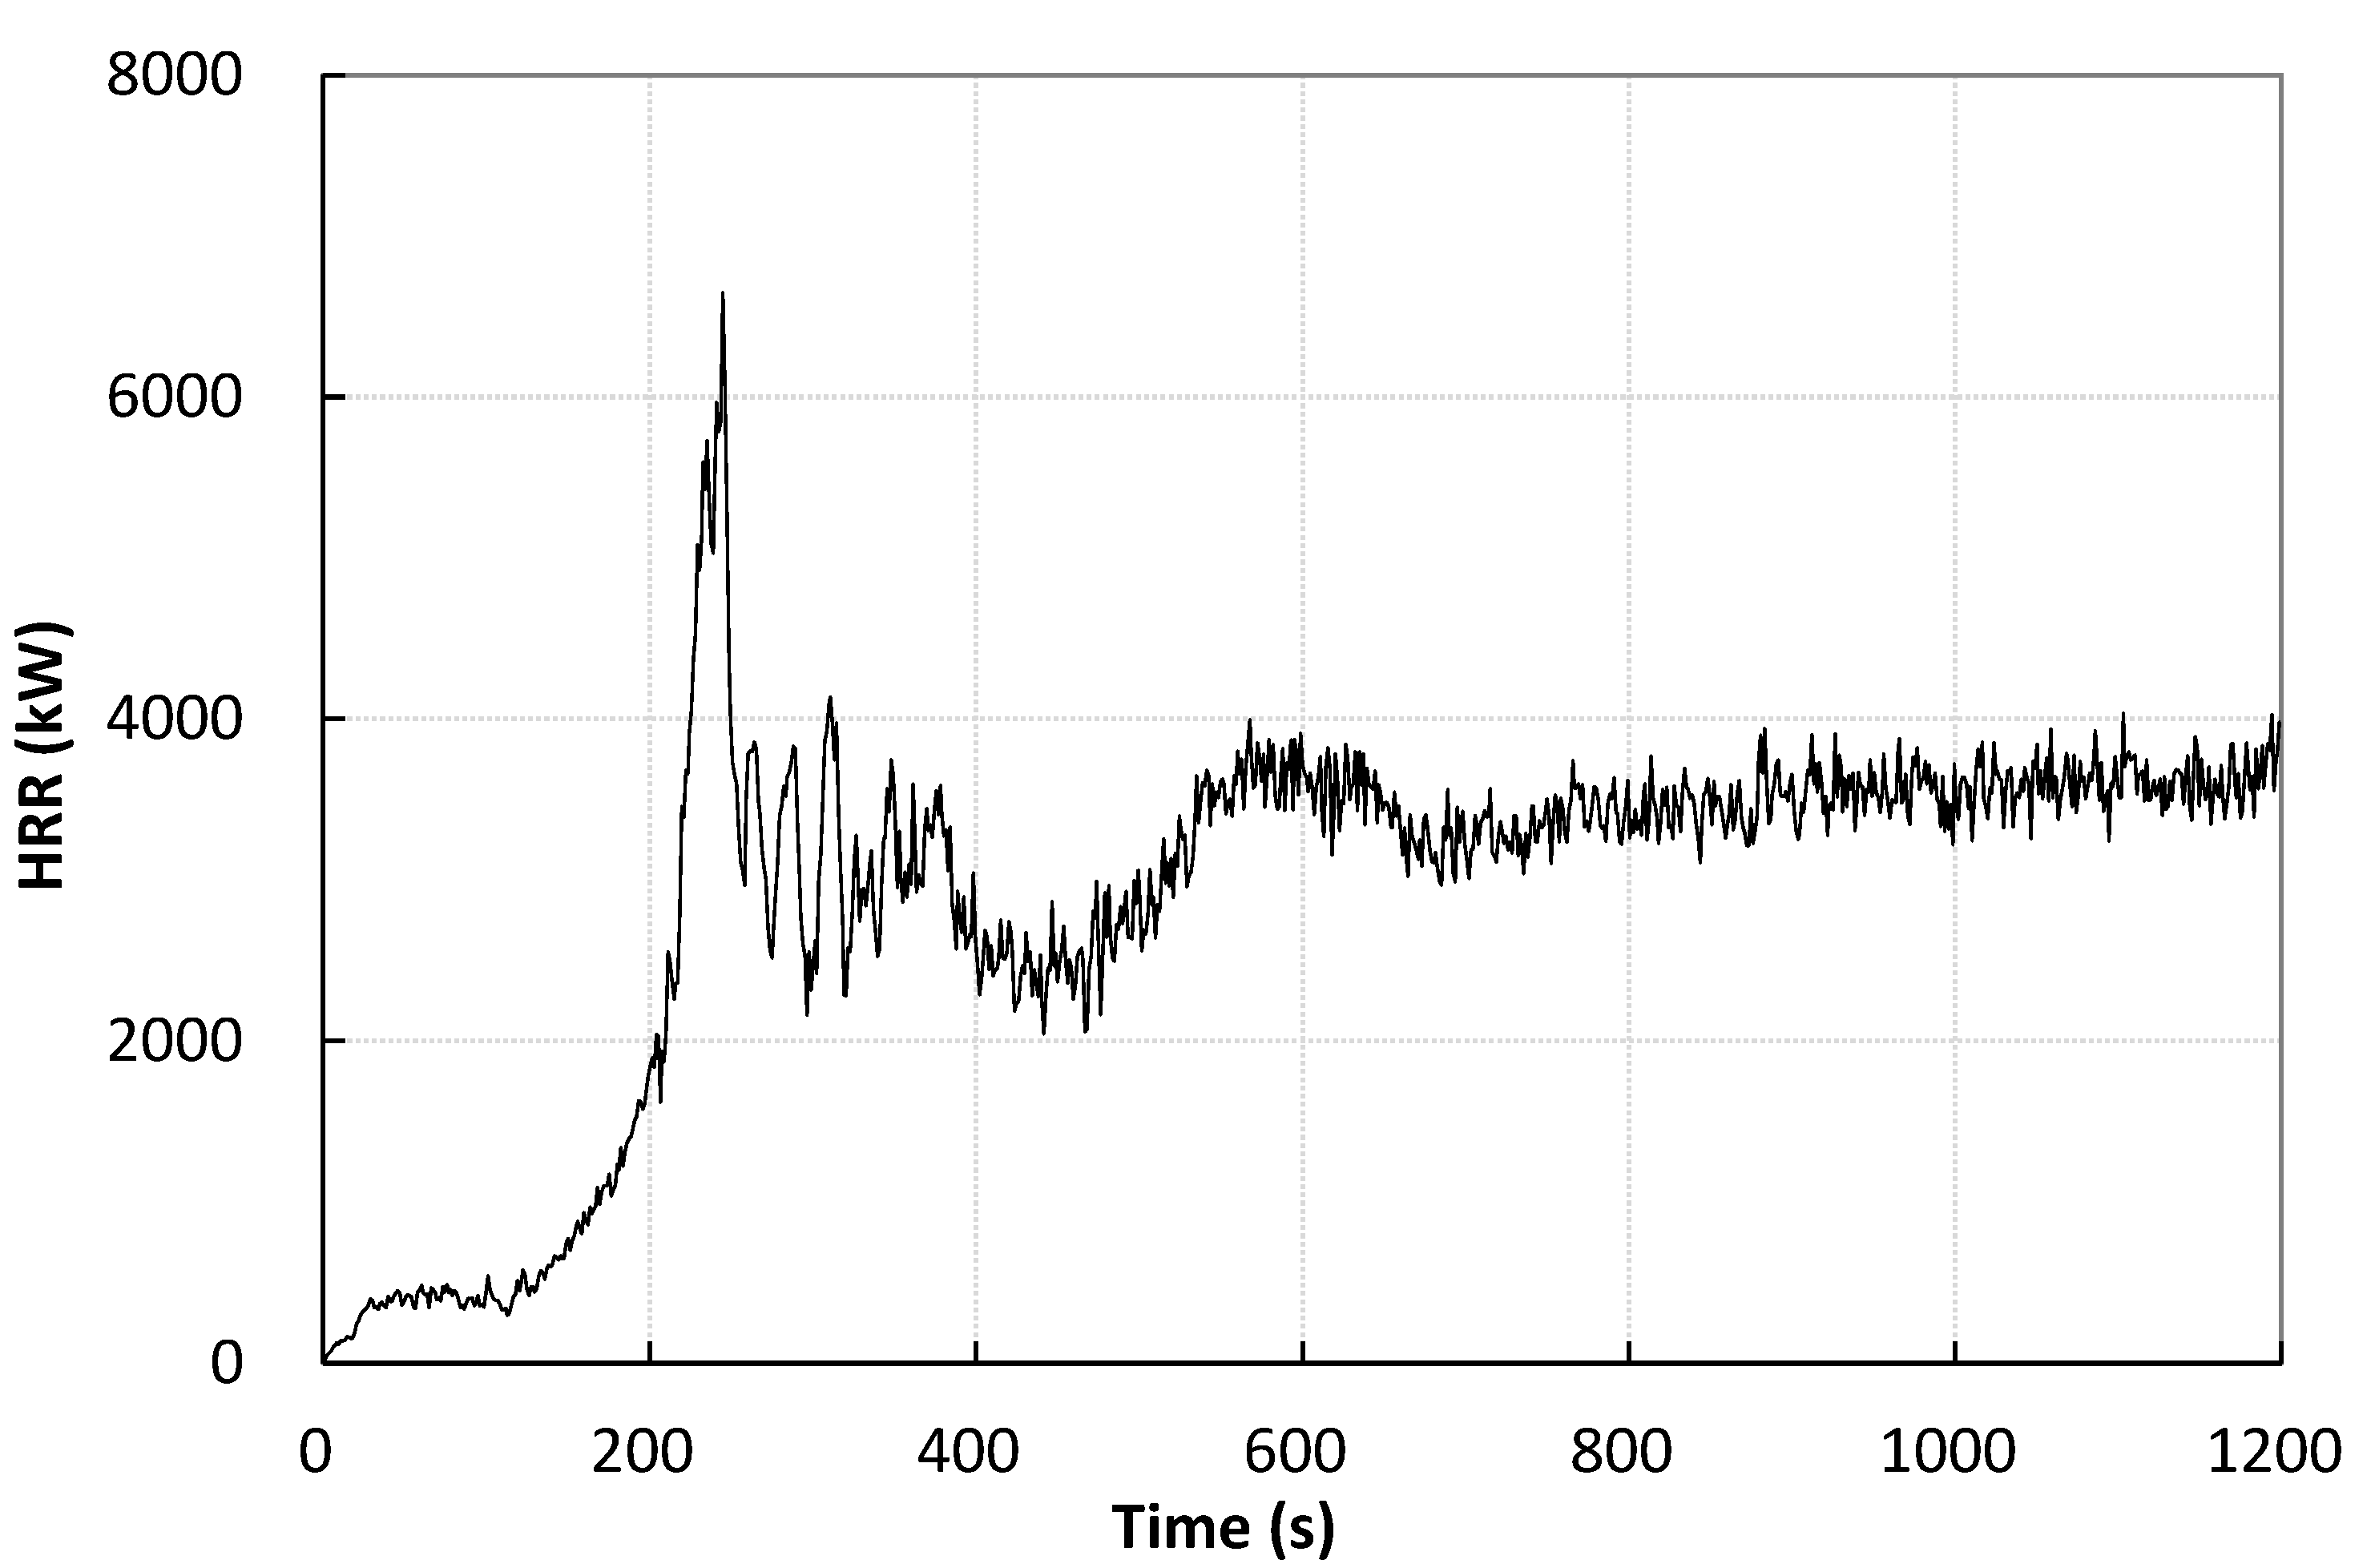
Figure 25.
HRR of desk and chair in FDS.
Figure 25.
HRR of desk and chair in FDS.
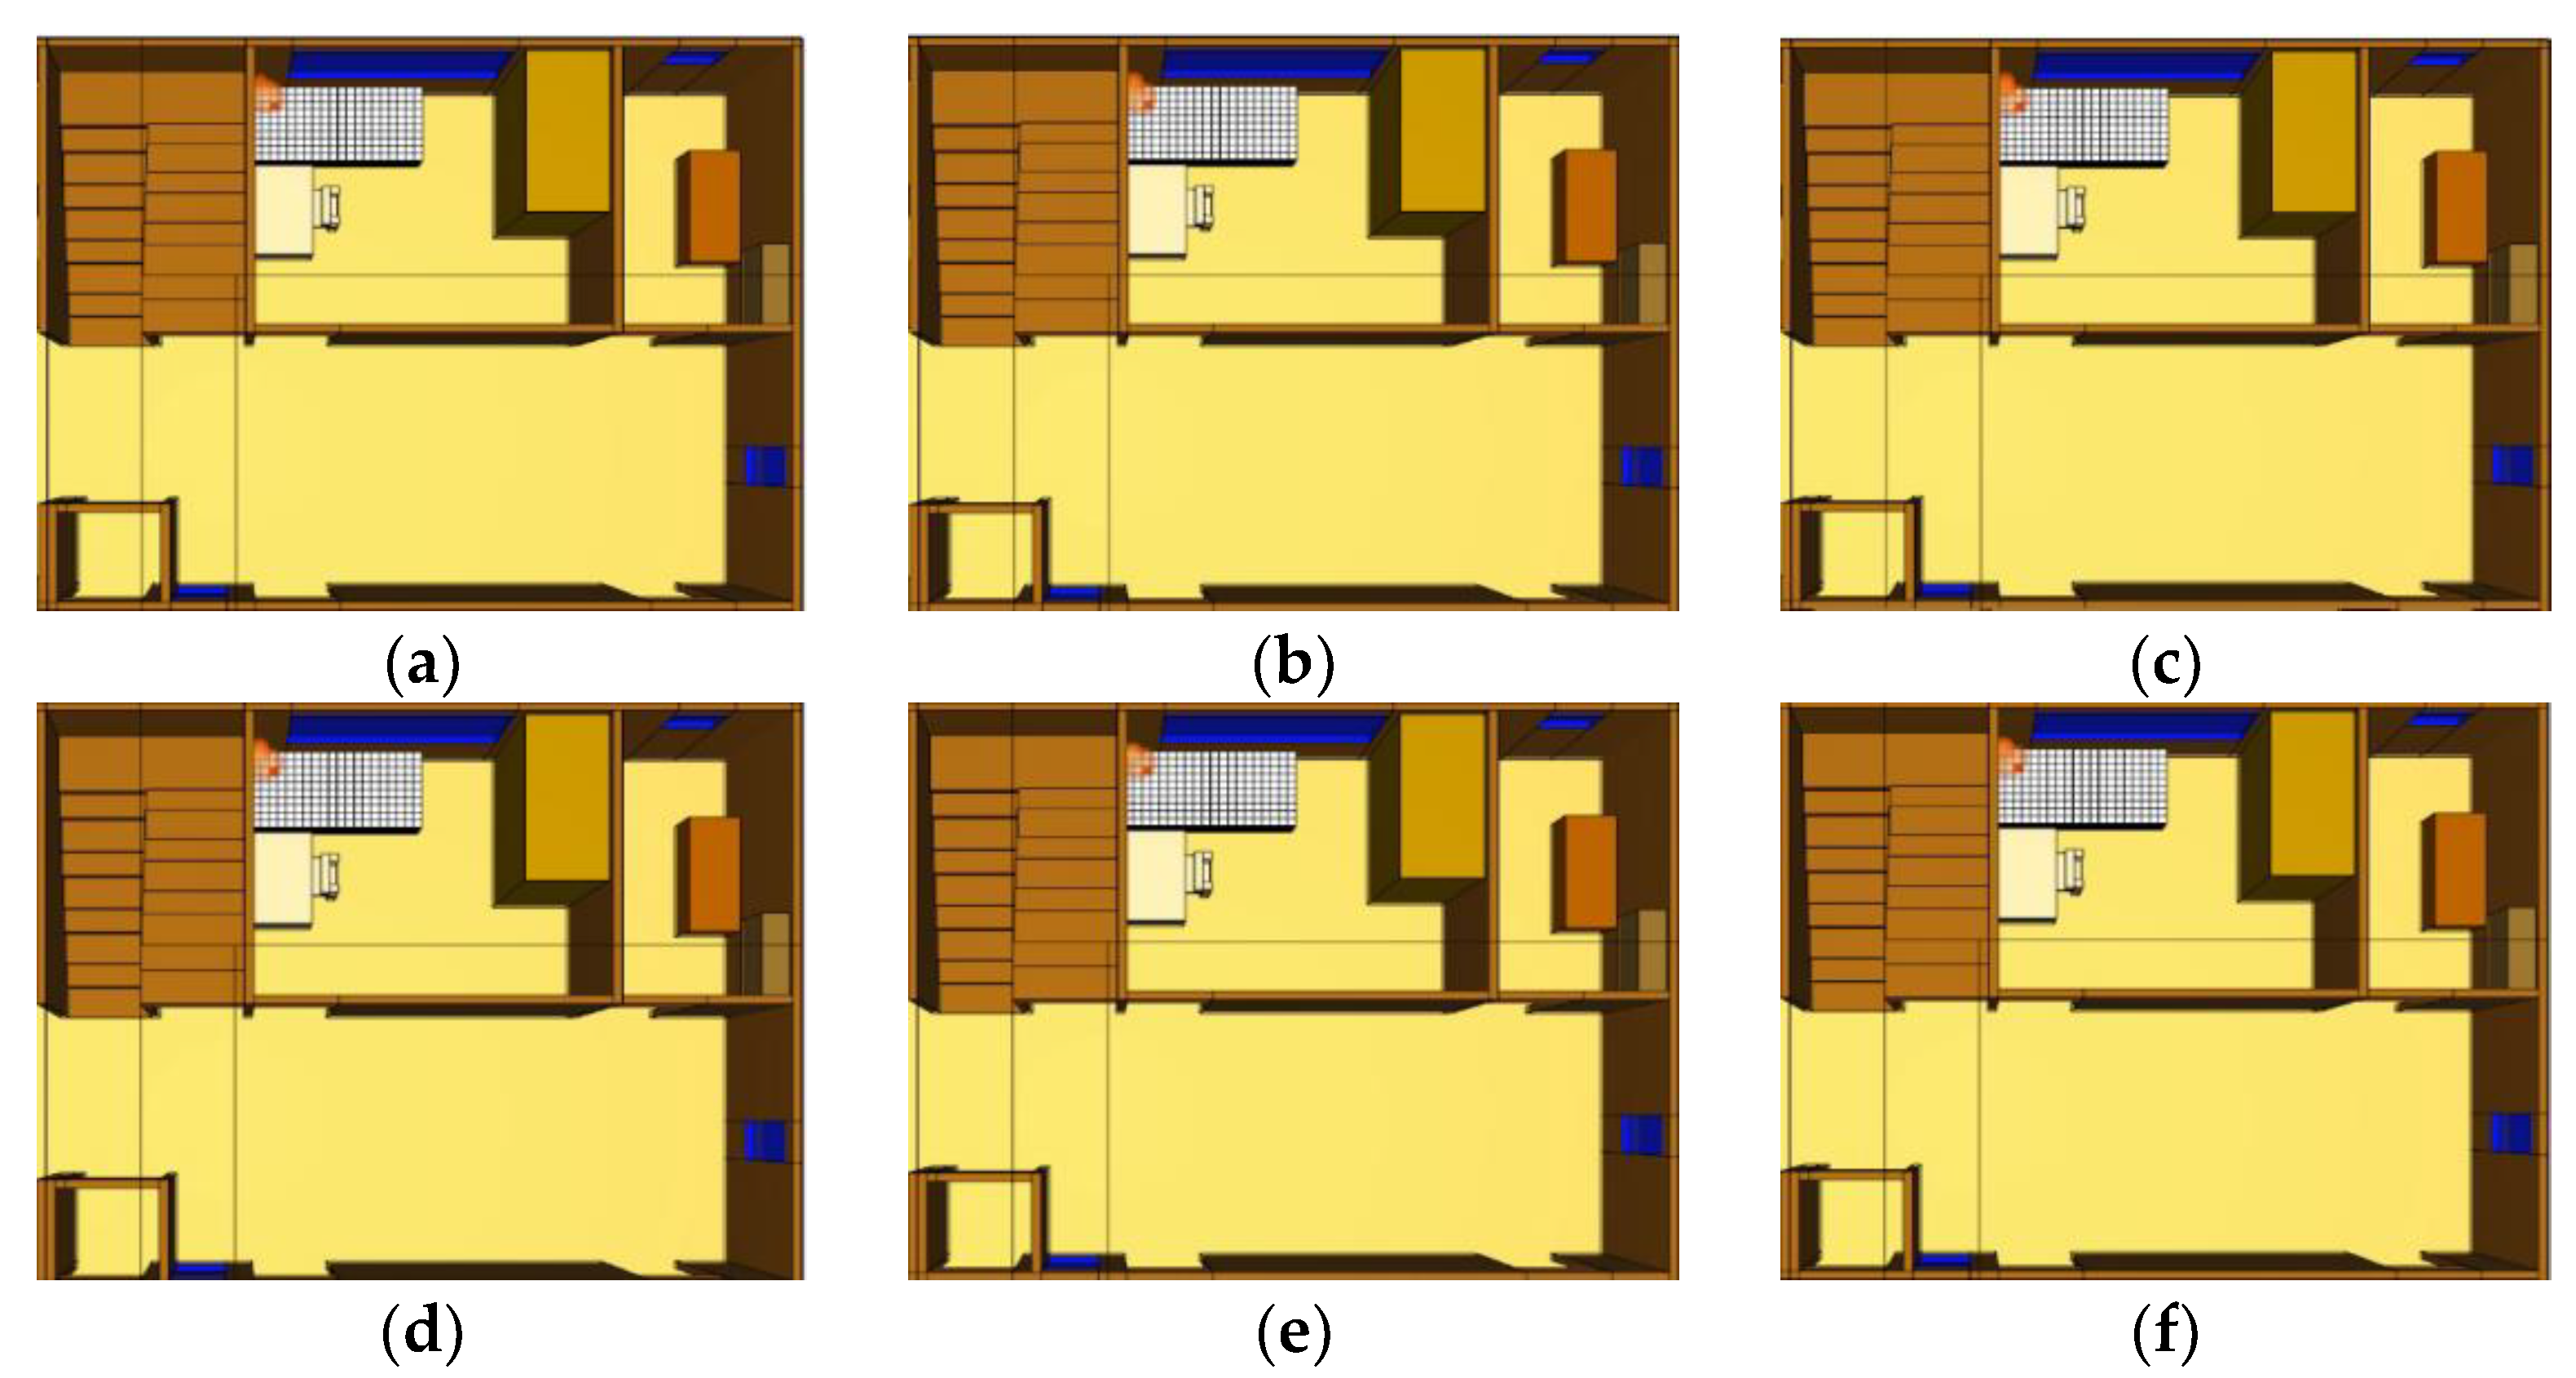
Figure 26.
Fire behavior over time until flashover (mattress and electric pad): (a) Ignition; (b) 200 s; (c) 400 s; (d) 600 s; (e) 8000 s; (f) 1000 s.
Figure 26.
Fire behavior over time until flashover (mattress and electric pad): (a) Ignition; (b) 200 s; (c) 400 s; (d) 600 s; (e) 8000 s; (f) 1000 s.
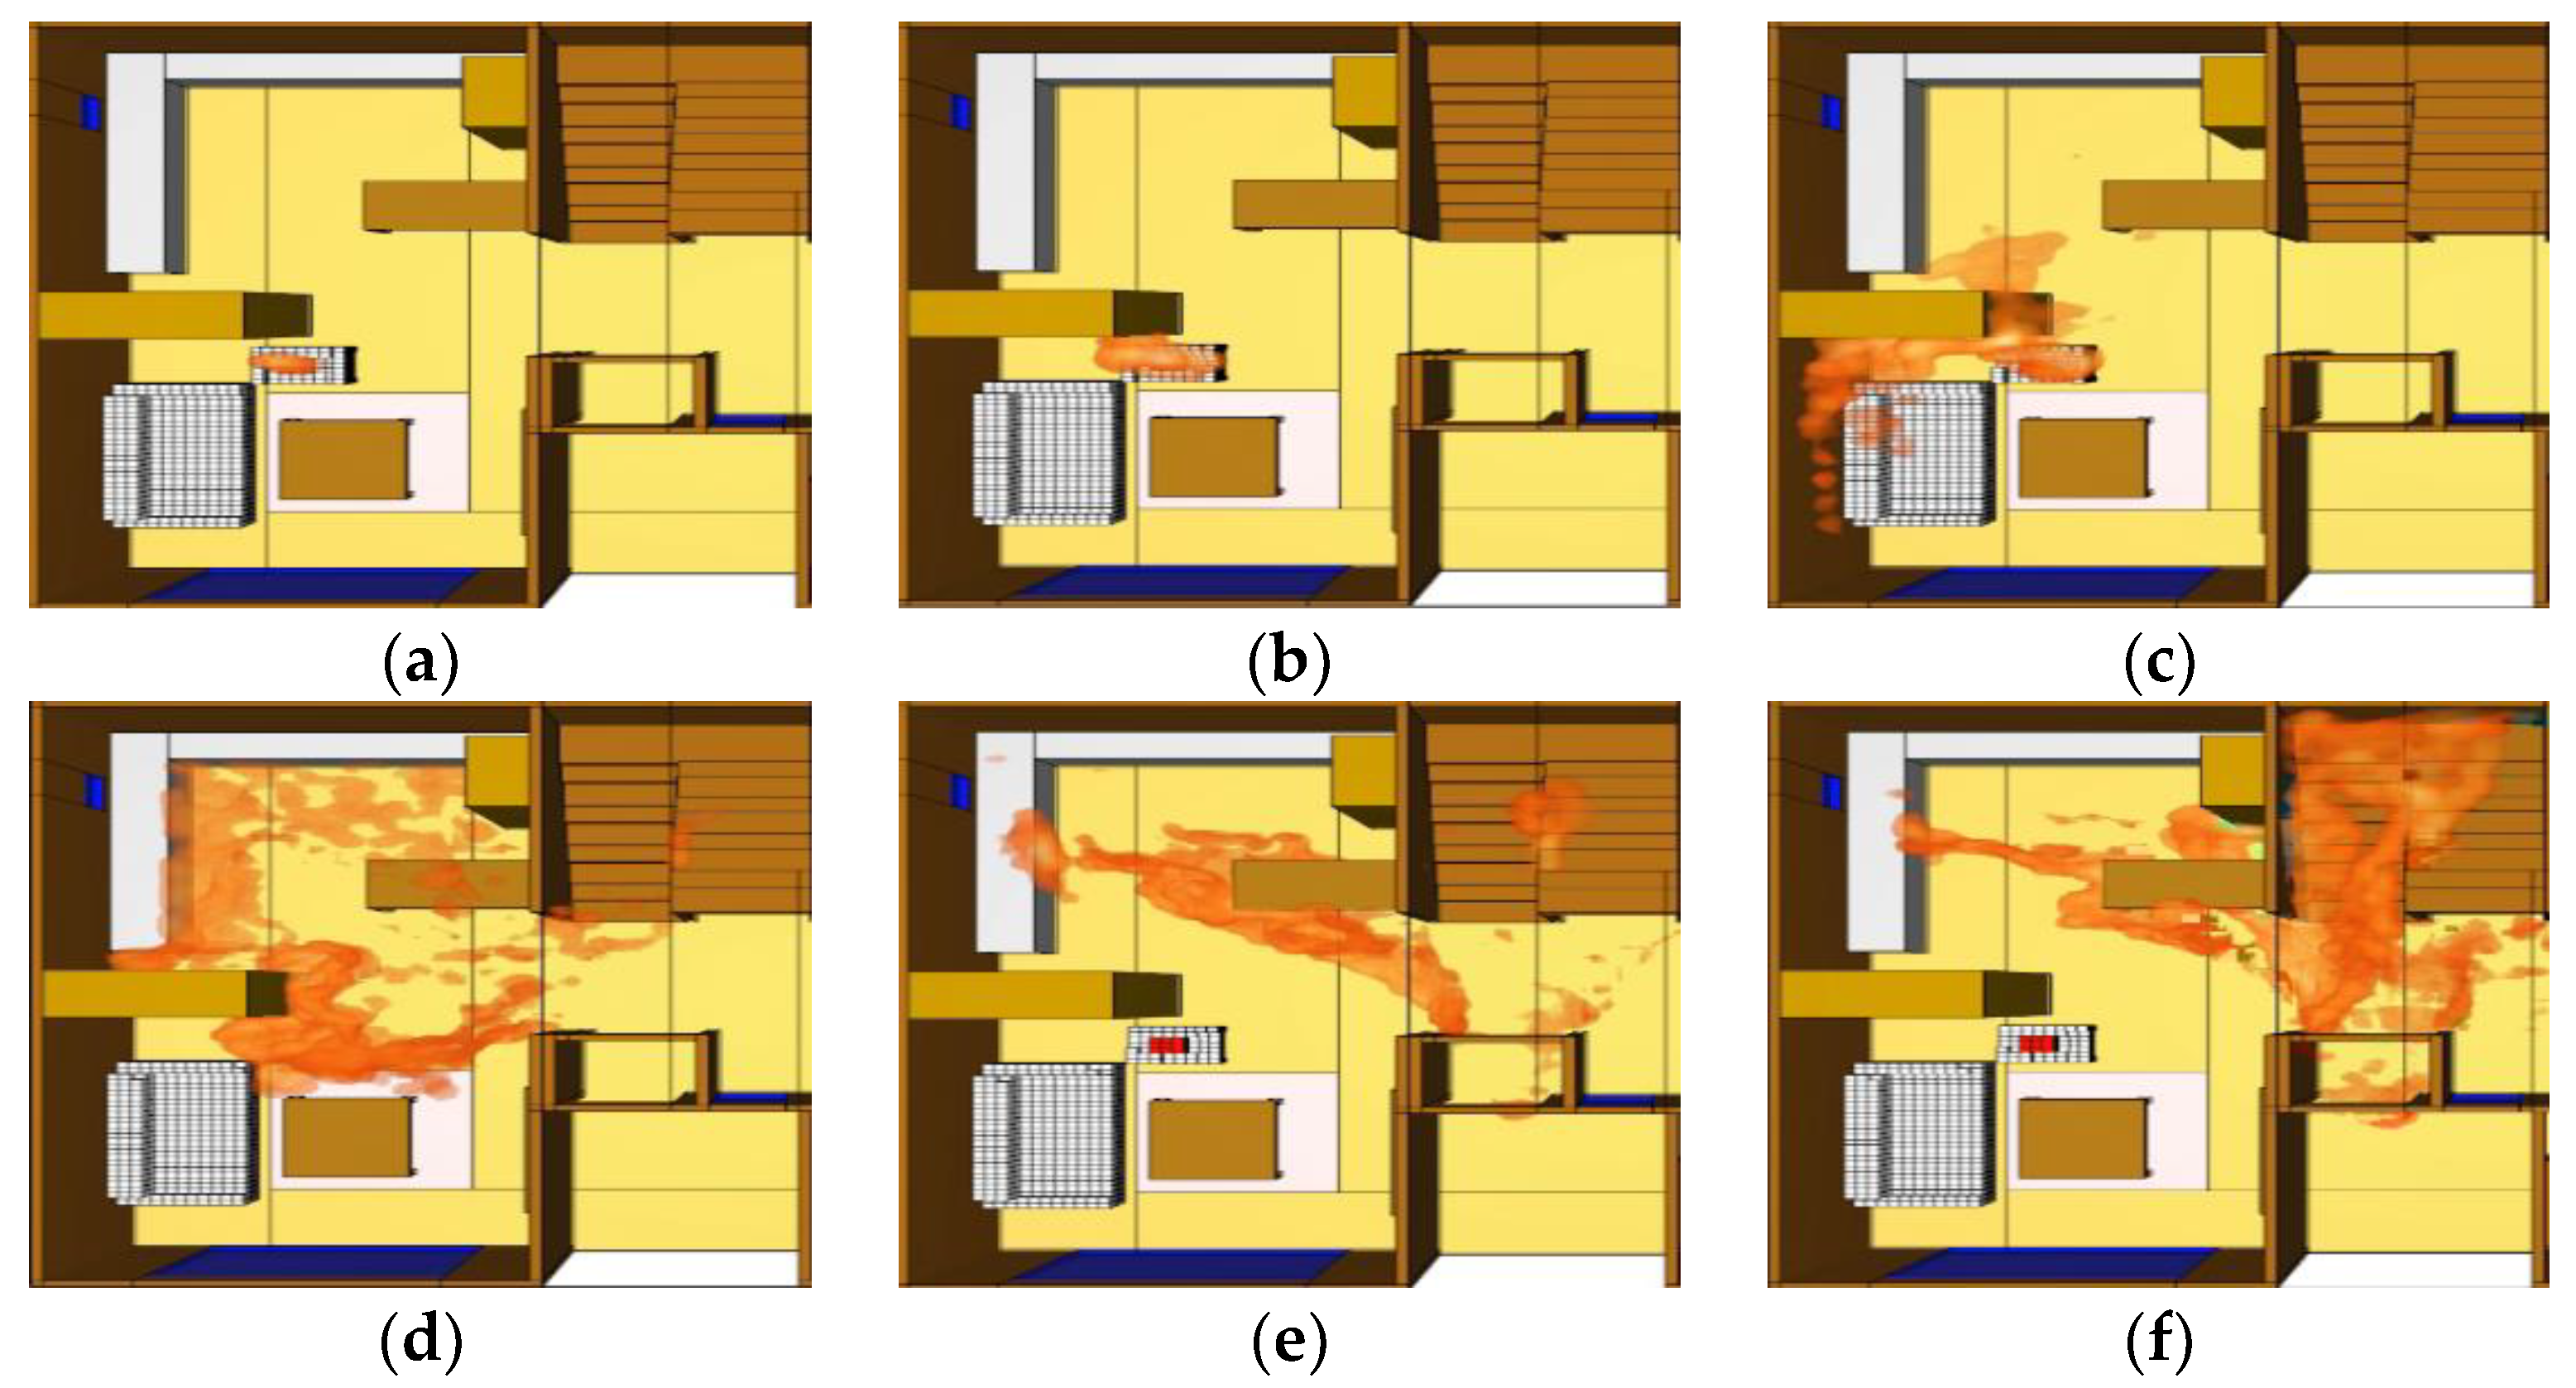
Figure 27.
Fire behavior over time until flashover (sofa): (a) Ignition; (b) 100 s; (c) 200 s; (d) 300 s; (e) 400 s; (f) 500 s.
Figure 27.
Fire behavior over time until flashover (sofa): (a) Ignition; (b) 100 s; (c) 200 s; (d) 300 s; (e) 400 s; (f) 500 s.
Figure 28.
HRR of sofa in FDS.
Figure 28.
HRR of sofa in FDS.
Table 1.
Domestic and overseas training content.
Table 1.
Domestic and overseas training content.
| Type | Content | Providers (Source) |
|---|
| South Korea | Fire Incident Commander Training Simulator | UCF-IST |
| Incident Command and Control Simulation | National Fire Academy |
| Emergency 5 | Monte Cristo Multimedia |
| Fire Department 3 | Sixteen Tons Entertainment |
| USA | Command Training Simulation | Adams Group |
| Integrated Command Training Simulation | Korea Soft Space Inc. |
| Disaster Field Team Unit Tactical Simulation | MaxOn Soft |
| XVR | XVR Simulation |
Table 2.
Selection of representative fire types.
Table 2.
Selection of representative fire types.
| Type | Selection Facilities | Response Rate | Combustible Materials |
|---|
| 1 | Factory facilities | 100% | HVAC system, electric heater, welding cutter |
| 2 | Terminal Facilities | 93.5% | Boxes, trash cans, construction materials |
| 3 | Medical facility | 80.6% | AC system, dryers, refrigerators |
| 4 | Warehouse | 80.6% | Sandwich panels, Styrofoam, waste paper |
| 5 | Accommodation facilities | 80.6% | Bed, mattress, wardrobe, TV, drawers, closet, sofa, storage closet |
| 6 | Apartment house | 87.1% |
| 7 | Single house | 74.2% |
Table 3.
Specifications of combustible materials 1.
Table 3.
Specifications of combustible materials 1.
| Type | Materials | Mass (kg) | W × L × H (mm) |
|---|
| Table | PB, MDF | 40 | 1200 × 700 × 720 |
| Chair | Wood, PU | 8 | 420 × 480 × 820 |
| Mattress | Fabric, Sponge | 34 | 1000 × 2000 × 250 |
| Electric Pad | Leatherette | 4 | 980 × 1900 |
| Sofa | PVC, Sponge | 11.5 | 710 × 760 × 770 |
Table 4.
Properties of combustible materials.
Table 4.
Properties of combustible materials.
| | MDF | Foam | Gypsum | Carpet |
|---|
| Conductivity (W/m⋅K) | 0.30 | 0.05 | 0.48 | 0.16 |
| Specific heat (kJ/kg·K) | 1.70 | 1.0 | 0.84 | 2.0 |
| Density (kg/m3) | 750 | 40 | 1440 | 750 |
| Reference Temperature (°C) | 280 | 300 | - | 290 |
| Heat of reaction (kJ/mol) | 800 | 800 | - | 22,300 |
| Heat of combustion (kJ) | 30,000 | 30,000 | - | 2000 |
| Ignition Temperature °C) | 330 | 390 | - | 390 |
| HRRPUA (kW/m2) | 250 | 280 | - | 280 |
Table 5.
Average, peak, and total HRR and SPR of desk and chair.
Table 5.
Average, peak, and total HRR and SPR of desk and chair.
| Type | HRR | Temperature | SPR |
|---|
| Average | 78 kW | 41 °C | 0.6 m2/s |
| Peak | 191 kW | 191 °C | 3.1 m2/s |
| Total | 138 MJ | - | 984.6 m2 |
Table 6.
Average, peak, and total HRR and SPR of mattress and electric pad.
Table 6.
Average, peak, and total HRR and SPR of mattress and electric pad.
| Type | HRR | Temperature | SPR |
|---|
| Average | 164 kW | 65 °C | 3.5 m2/s |
| Peak | 725 kW | 152 °C | 15.2 m2/s |
| Total | 121 MJ | - | 2260 m2 |
Table 7.
Average, peak, and total HRR and SPR of sofa.
Table 7.
Average, peak, and total HRR and SPR of sofa.
| Type | HRR | Temperature | SPR |
|---|
| Average | 89 kW | 42 °C | 0.6 m2/s |
| Peak | 728 kW | 170 °C | 8.9 m2/s |
| Total | 226 MJ | - | 1638.3 m2 |
Table 8.
Average, peak, and total HRR and SPR of desk and chair.
Table 8.
Average, peak, and total HRR and SPR of desk and chair.
| Type | HRR | Temperature | SPR |
|---|
| Average | 121 kW | 38 °C | 1.2 m2/s |
| Peak | 4938 kW | 586 °C | 20.1 m2/s |
| Total | 183 MJ | - | 1835.3 m2 |
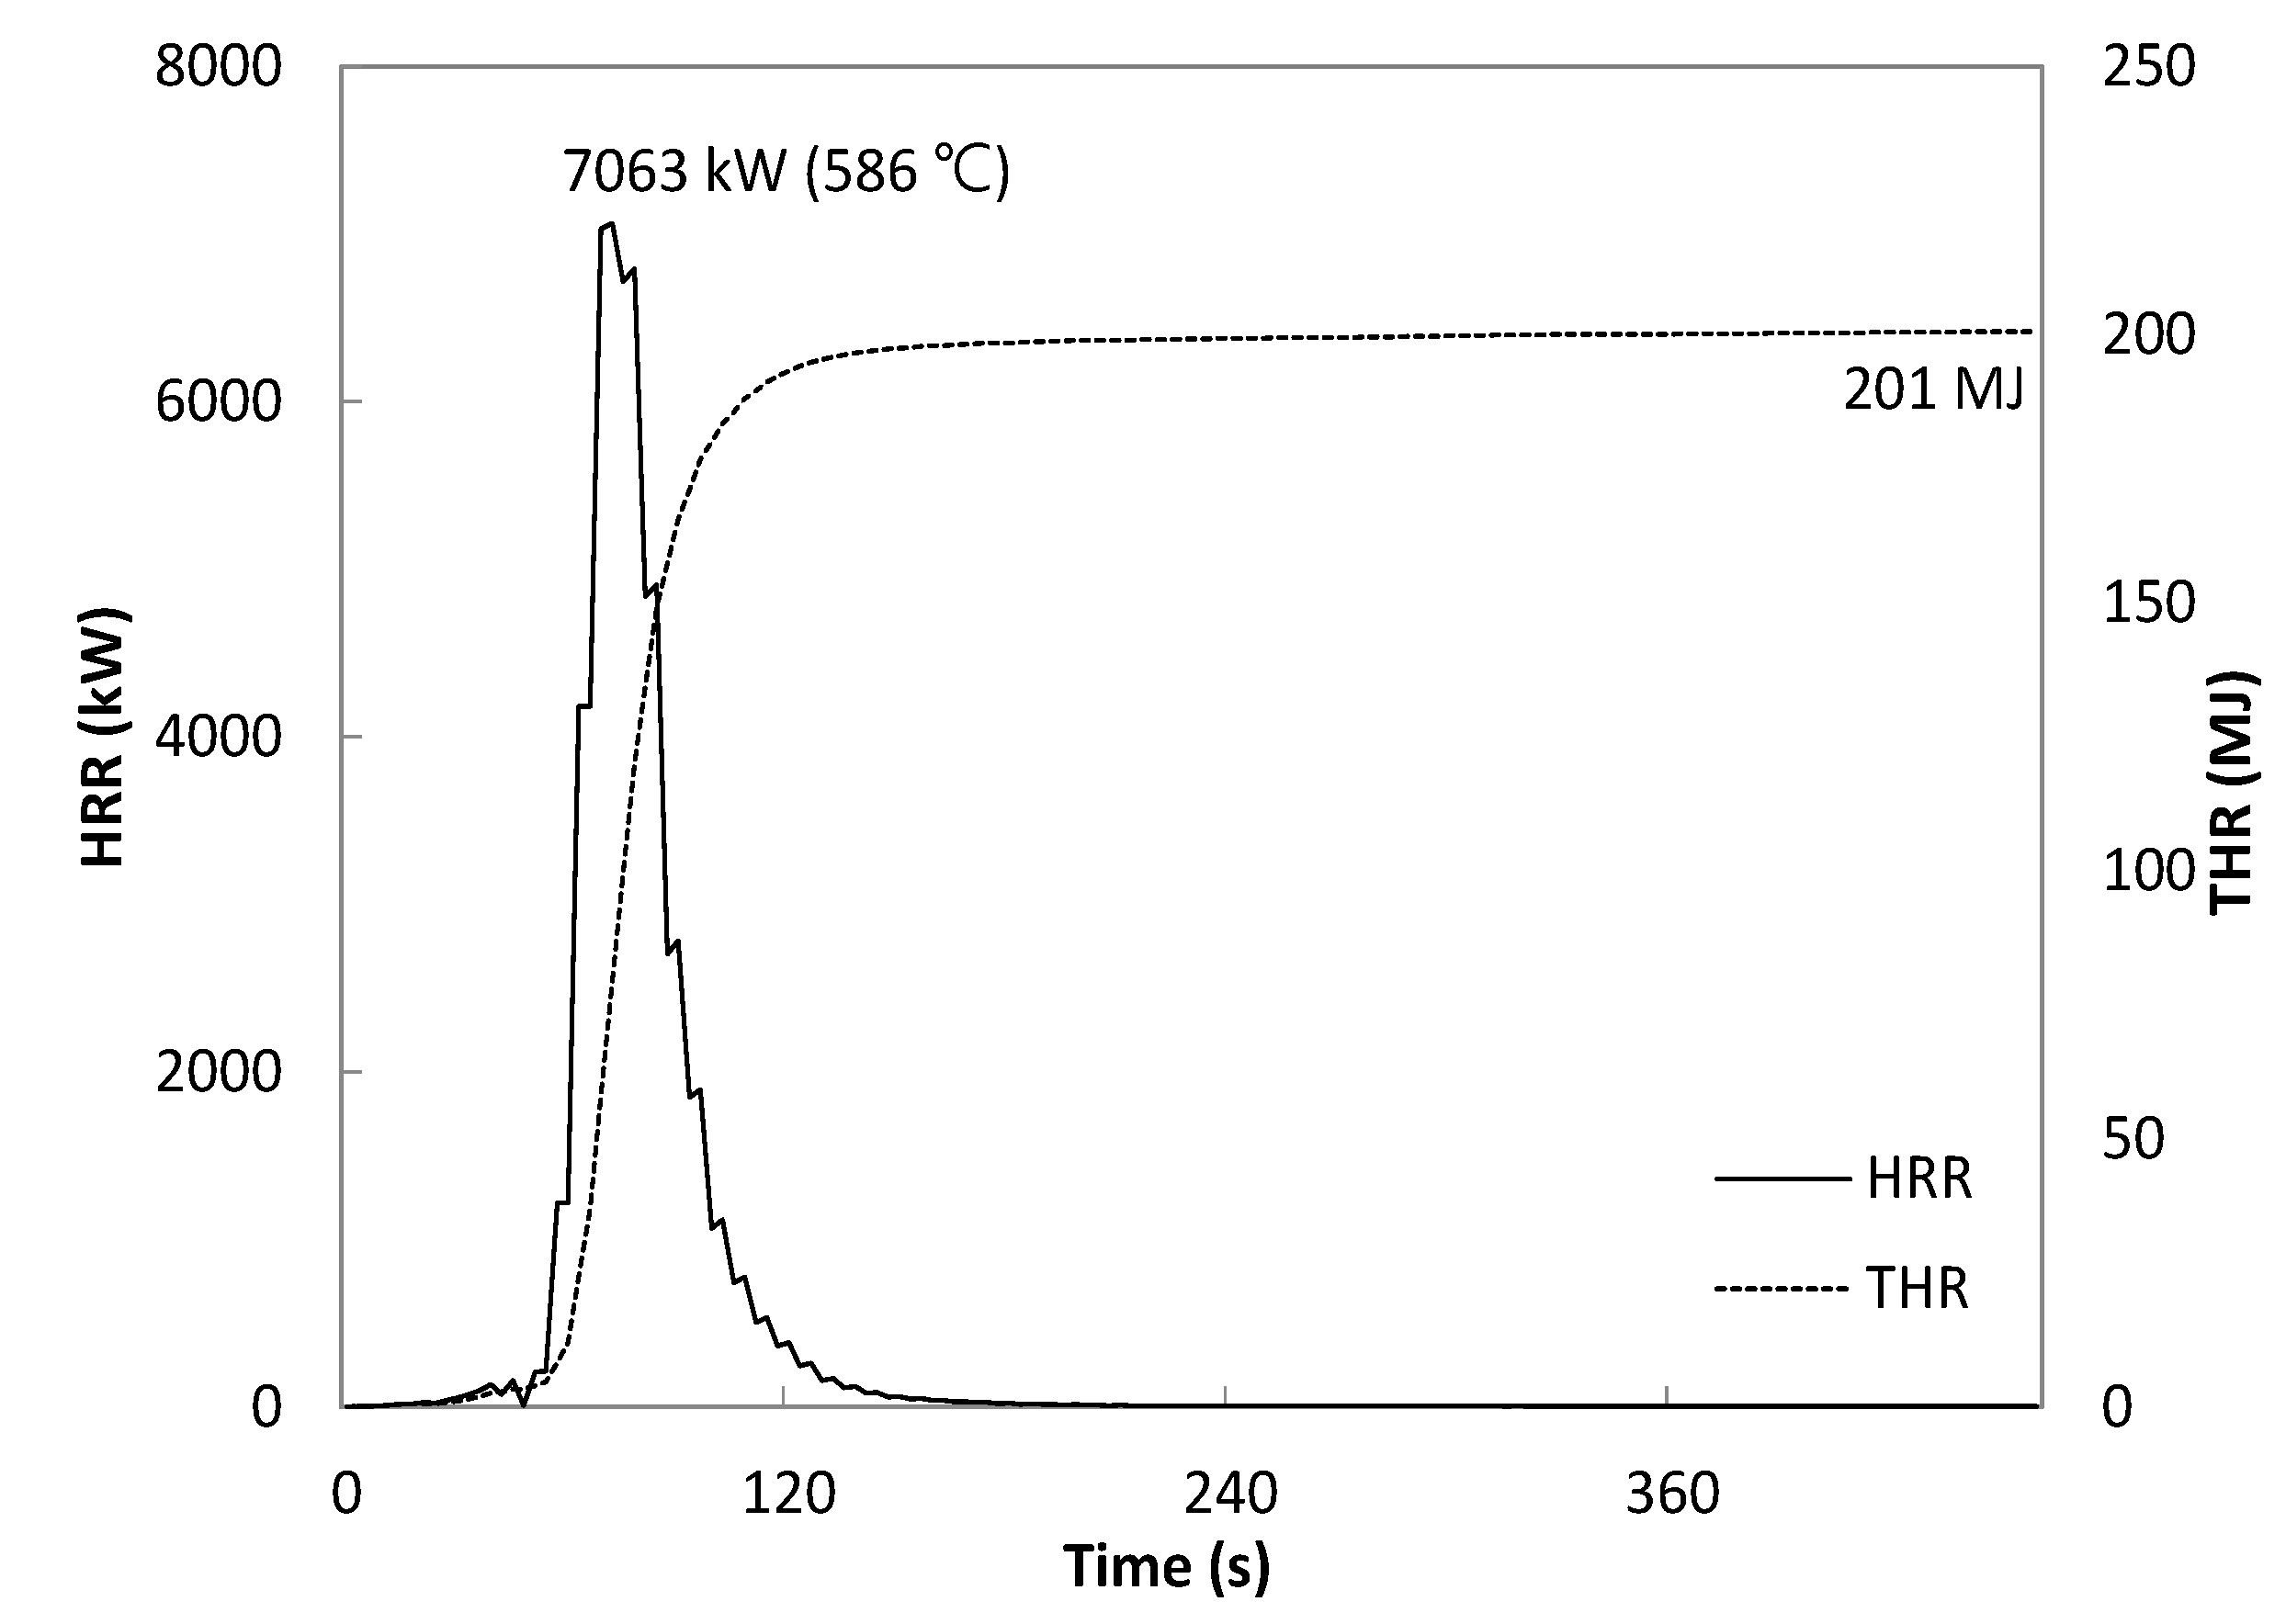
Table 9.
Average, peak, and total HRR and SPR of mattress and electric pad.
Table 9.
Average, peak, and total HRR and SPR of mattress and electric pad.
| Type | HRR | Temperature | SPR |
|---|
| Average | 272 kW | 64 °C | 1.3 m2/s |
| Peak | 7063 kW | 586 °C | 22.2 m2/s |
| Total | 201 MJ | | 972.1 m2 |
Table 10.
Average, peak, and total HRR and SPR of sofa.
Table 10.
Average, peak, and total HRR and SPR of sofa.
| Type | HRR | Temperature | SPR |
|---|
| Average | 196 kW | 16 °C | 0.5 m2/s |
| Peak | 1124 kW | 148 °C | 6.8 m2/s |
| Total | 32 MJ | - | 379.1 m2 |


