1. Introduction
Since the evacuation time is a decisive survival factor during disasters, such as fires, severe weather events, or terrorist attacks [
1,
2], accurate ways of finding escape routes and quick decision making are extremely important during evacuations [
3]. Escape route signs are installed in buildings to support the occupants’ decision making during evacuations. Given the important role of signs in the evacuation process, which includes wayfinding and decision making, design guidelines and regulations affect the performance of signs, including their sizes, colors, and fonts, as well as sign locations, additional lighting, and construction materials [
4,
5,
6]. However, numerous studies have verified that the signs installed according to established guidelines and regulations cannot effectively support decision making [
7,
8].
To overcome this limitation, various studies have been conducted regarding the development of efficient signs and the designation of their optimal installation locations. Prior studies have attempted to increase the affordance of signs, considering variables such as size [
9,
10], brightness [
11], colors and graphics [
12,
13,
14,
15], lighting method [
16,
17,
18,
19,
20], and smoke [
21,
22]. These studies have been successful in improving signs’ affordances, by altering the performance of signs, but no analysis has been conducted on the interaction between signs and humans that considers the installation location or arrow directions.
Previous studies aimed at determining the optimal installation locations of signs assumed that evacuees could recognize signs when they were in “the light coverage area of the closest sign”, and presented only the installation locations of signs, where the coverage areas included the locations of all buildings [
23,
24]. The recognition of signs by evacuees was determined by the distance and angle between them and the signs, whereas the interaction between signs and humans, according to the horizontal/vertical installation locations and arrow directions was not considered.
Recently, several studies have been conducted to derive the installation location of signs, considering the interaction between signs and humans. These studies, however, neither sufficiently considered the horizontal/vertical installation locations, nor the arrow directions of the signs. Zhang et al. [
25] proposed a model for deriving the optimal installation locations of signs, which determines the “viewing distance” of the sign and derives an optimal installation location based on the concept of “the attractiveness of a sign”. The attractiveness of a sign affects people based on the size and color of signs by reflecting the interaction between humans and signs. However, they did not explain the interaction between signs and humans according to the horizontal/vertical installation locations or arrow directions. Bae et al. [
26] conducted research to propose the installation locations of signs based on the analysis of the gaze points of evacuees at various intersections. The study, however, had limitations because experiments were performed at intersections with no installed signs, and the installation locations were determined based on the assumption that the efficiency of signs would increase if installed in locations that attract the attention of more people. In addition, Kim et al. [
27] analyzed the decision-making time of evacuees according to the installation locations of signs and verified the Stroop facilitation and interference effects. However, they analyzed the interaction between signs and humans only at three (left, center, and right) horizontal installation locations and did not consider the installation height.
To the best of our knowledge, no prior study has analyzed the interaction between evacuees and signs by considering both the horizontal/vertical installation locations and the arrow directions of signs. To overcome this limitation, this study analyzed the decision-making time of participants in T-type indoor intersections according to the horizontal/vertical installation locations and the arrow directions of signs (signs in this study represents those composed of arrow symbols). The aim is to provide the optimal installation location of signs based on the results of our analysis. To this end, a total of 198 virtual stimuli, including images containing signs installed in front of virtual T-type indoor intersections, were prepared. The 198 images were obtained through a combination of 99 installation locations with left and right arrow directions. An experiment was then performed requiring participants to observe the virtual stimuli and select either the left or right path according to the arrow direction of the signs. Through the analysis of the experimental results, decision-making times (DMTs) and following rates (FRs) were derived according to the arrow direction and the installation location of the signs. Following rates indicate the number of trials when the response was identical to the direction of the signs divided by the number of total trials [
27]. In addition, variances in DMTs depending on the arrow direction and installation location of signs were analyzed statistically. Finally, the optimal installation location of the signs that supports the shortest DMTs at T-type indoor intersections was proposed based on the experimental results. It is expected that the results of this study will provide a database of DMTs based on the locations of the signs during emergency evacuations and will be utilized to improve the installation guidelines and regulations of signs.
3. Results
The average DMTs for each sign’s installation location based on the experimental results are shown in
Figure 4,
Figure 5 and
Figure 6.
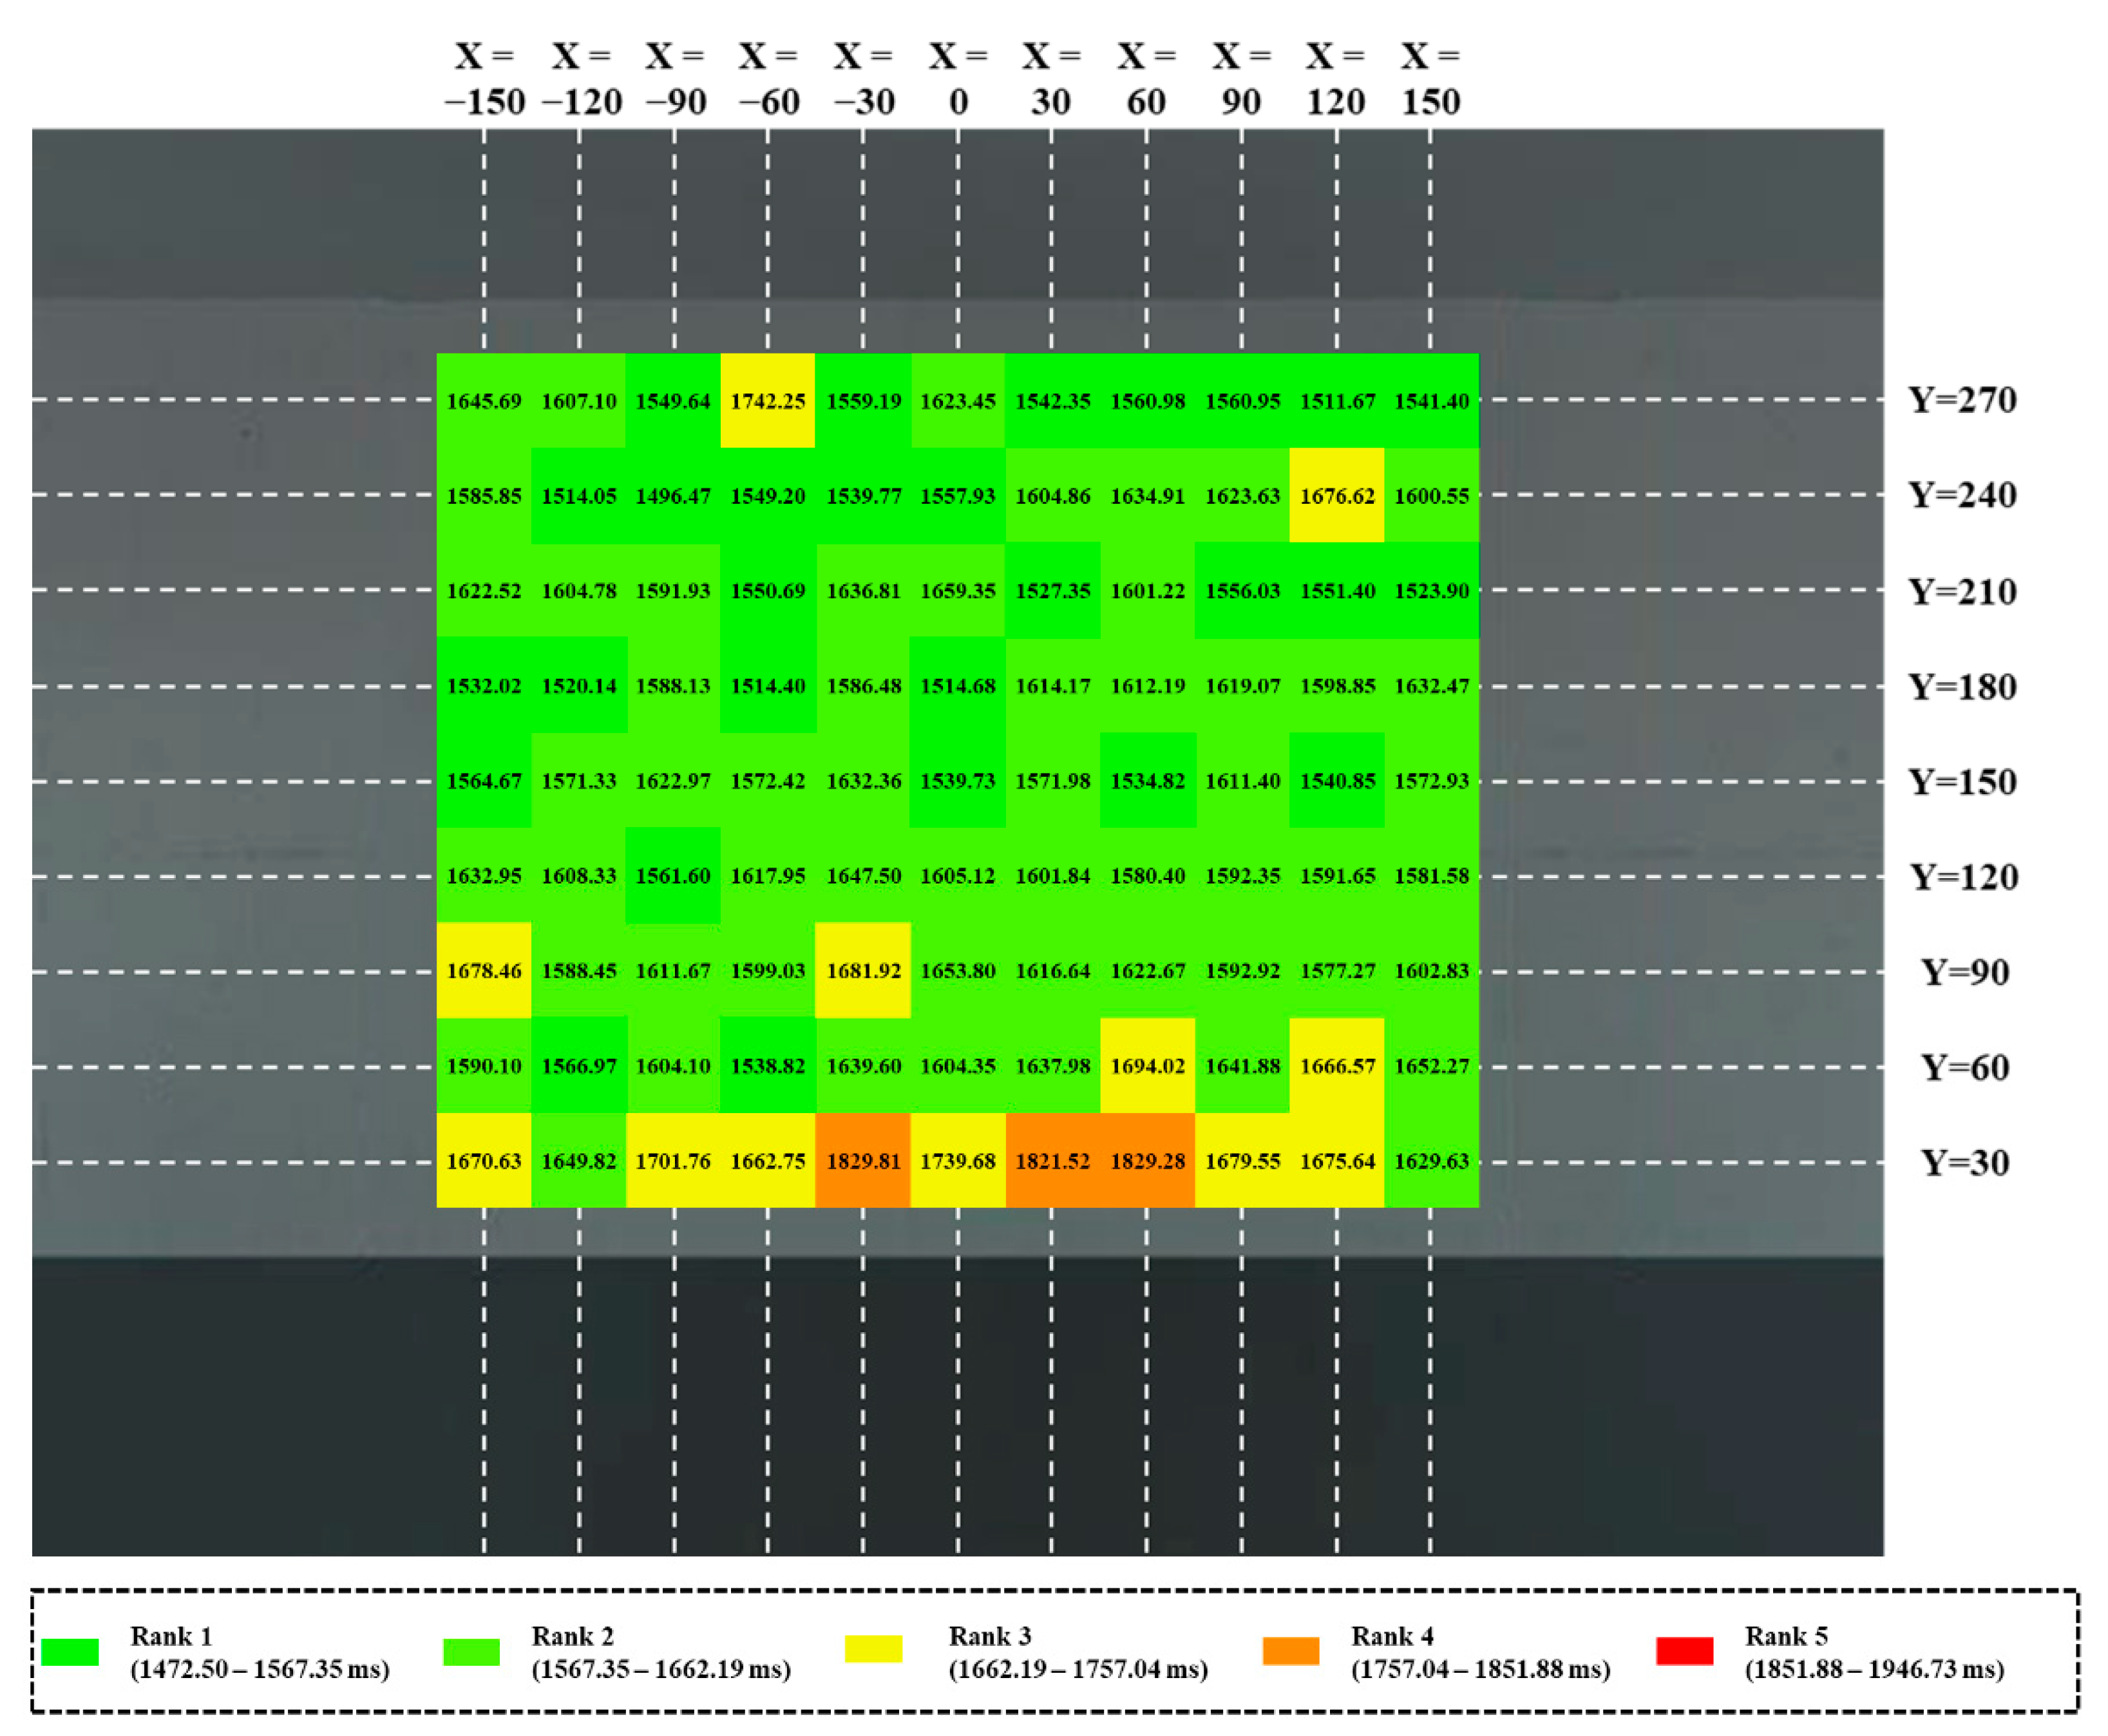
Figure 4 shows the average DMTs of the entire experiment;
Figure 5 and
Figure 6 show the average DMTs for the left arrow direction of the signs and the average DMTs for the right arrow direction, respectively. They intuitively present the magnitudes of the average DMTs for each installation location according to the grading of the average DMTs. Five ranks were divided into equal intervals, based on the maximum (1946.73 ms) and minimum (1472.50 ms) values of the average DMTs, according to the installation locations and arrow directions of the signs.
To analyze the significant variances depending on the installation locations and arrow directions of the signs, the average DMTs and FRs according to the arrow directions of the signs were analyzed first (see
Table 1). The average DMTs for both left and right arrow directions was found to be 1606.55 ms (SD = 227.10 ms) and FRs was 98.82%. As for the arrow direction of signs, the left arrow direction of the signs exhibited a longer average DMT and lower FRs (average DMT = 1614.98 ms, SD = 211.88 ms, FRs = 98.76%) than the right arrow direction (average DMT = 1598.12 ms, SD = 241.08 ms, FRs = 98.88%). The
t-test results revealed that the DMTs differed, depending on the direction of signs (
p = 0.000 < 0.05). The participants exhibited shorter DMTs and higher FRs when they recognized the right arrow of the signs and selected the right direction.
Table 2 shows the average DMTs and FRs according to the horizontal installation location of the signs. The lowest average DMT (1581.35 ms) was observed when the horizontal installation location was x = −120 cm, and the ANOVA results revealed that there were significant variances in DMTs, depending on the horizontal installation location (
p = 0.000 < 0.05).
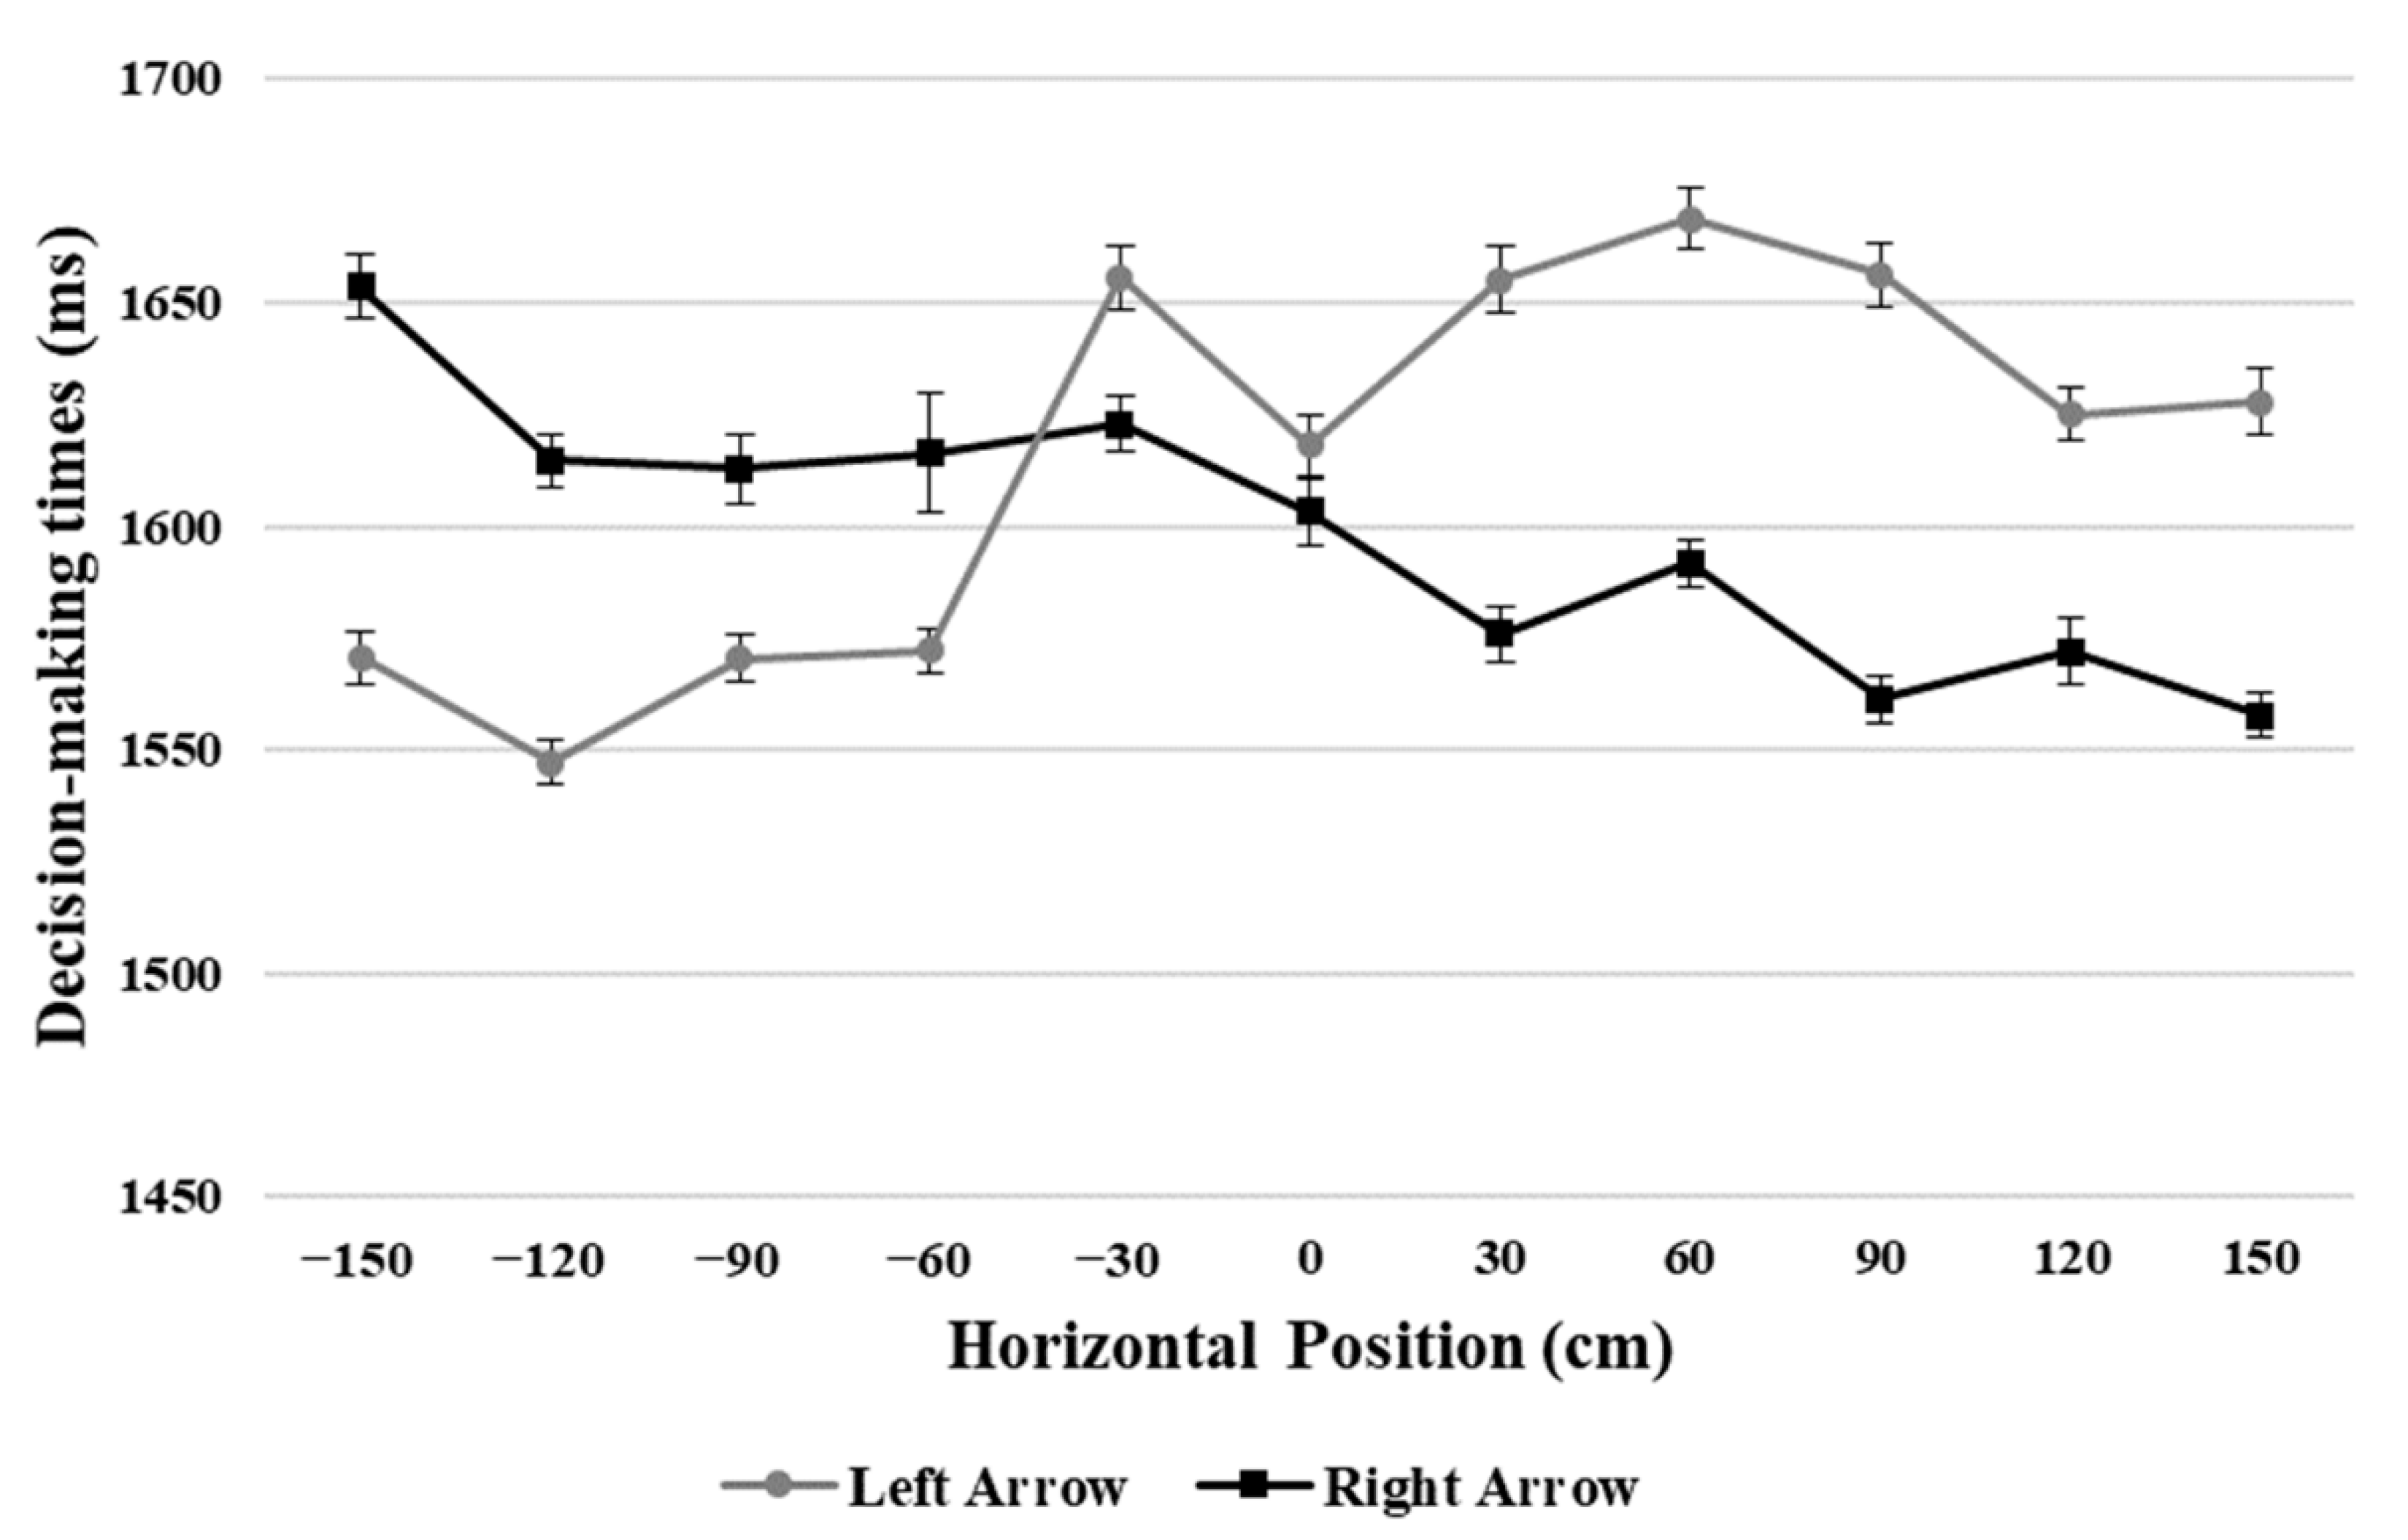
Figure 7 and
Table 3 show the results of DMTs and FRs, according to the horizontal installation location and arrow direction of the signs. For the left arrow direction, the horizontal installation location with the lowest average DMT (1547.22 ms) was found to be x = −120 xm, which was located to the left of the center. For the right arrow direction, the lowest average DMT (1557.81 ms) was observed at x = 150 xm which was located to the right of the center. A
t-test was conducted at each horizontal installation location to analyze the variances depending on the arrow direction at each location. It was found that there were significant variances in DMTs, depending on the arrow direction at all horizontal installation locations, except for x = 0 cm (
p = 0.142 > 0.05), which was the central location of the signs in the horizontal direction. At x = −150 cm, x = −120 cm, x = −90 cm, and x = −60 cm which were located to the left of the center, the average DMTs were found to be shorter and FRs was higher for the left arrow direction. At x = 60 cm, x = 90 cm, x = 120 cm, and x = 150 cm, which were located to the right of the center, the average DMTs were shorter and FRs was higher for the right arrow direction. At x = −30 cm, x = 0 cm, and x = 30 cm, the average DMTs were shorter for the right arrow direction.
Next, the DMTs and FRs, according to the vertical installation location of the signs, were analyzed. As shown in
Table 4, the lowest average DMT (1577.04 ms) was observed at y = 150 cm, whereas the highest average DMT (1717.75 ms) was observed at y = 30 cm. The ANOVA results revealed there were significant variances in DMTs depending on the vertical installation location (
p = 0.000 < 0.05).
Table 5 and
Figure 8 show the DMTs and FRs results according to the arrow direction and vertical installation location of the signs. The average DMTs for both, the left and right arrow directions were found to be the highest at y = 30 cm. For the left arrow direction, the lowest average DMT was observed at y = 270 cm (average DMT = 1579.21 ms). For the right arrow direction, the lowest average DMT was observed at y = 150 cm (average DMT = 1568.25 ms). In addition, when the
t-test was conducted to analyze significant variances in DMTs depending on the arrow direction, there was no significant variance in DMTs depending on the arrow direction of signs at all vertical installation locations except for y = 30 cm and y = 90 cm (y = 30,
p = 0.000 < 0.05; y = 90,
p = 0.003 < 0.05).
4. Discussion
This study produced 198 virtual stimuli, and the DMTs of 120 participants were analyzed, according to the horizontal/vertical installation locations of the signs. The analysis revealed that (1) the average DMT and FRs according to the arrow direction of the signs, (2) the average DMT and FRs according to the horizontal installation location and arrow direction of the signs, and (3) the average DMT and FRs according to the vertical installation location and arrow direction of signs. These results inform the study’s proposal regarding the optimal installation location of the signs.
First, the results confirmed that the right arrow of signs (average DMT = 1598.12 ms, FRs = 98.88%) exhibited shorter DMTs and higher FRs than the left arrow (average DMT = 1614.98 ms, FRs = 98.76%).
This is likely because all participants were right-handed and right-side driving is performed in South Korea, where the experiment was conducted. According to a previous study, Scharine and McBeath [
30] revealed that the learned driving patterns and genetic handedness correlate with the direction preferences of pedestrians, including right-handed and right-side driving subjects preferring to turn right, through an experiment performed in the T-maze. The same discovery was also observed in the results of a survey conducted by Veeraswamy et al. [
28]. The choice between the left or right direction at a T-type intersection was affected by the handedness of participants and learned driving patterns. All participants in the experiment seemed to prefer the right direction as a result of their right-handed and right-side driving experience in South Korea. This may have resulted in shorter DMTs and higher FRs when the right direction was selected than when the left direction was selected according to the arrow direction at a T-type intersection.
Second, it was revealed that there were significant variances in DMTs, depending on the horizontal installation location of the signs (see
Table 2), and depending on the arrow direction for each horizontal installation location (see
Table 3 and
Figure 7). There were significant variances in DMTs depending on the arrow direction at all horizontal installation locations except for x = 0 cm (
p = 0.142 > 0.05), which was the central location of signs in the horizontal direction (see
Table 3). At x = −150 cm, x = −120 cm, x = −90 cm, and x = −60 cm, which were located to the left of the center, the average DMTs were shorter and FRs was higher for the left arrow direction. At x = 60 cm, x = 90 cm, x = 120 cm, and x = 150 cm, which were located to the right of the center, the average DMTs were shorter and FRs was higher for the right arrow direction.
These results can be explained using the “Simon effect [
31]” by the arrow direction and horizontal installation location of signs. The Simon effect occurs depending on the agreement between the arrow direction and horizontal installation location of the signs. The results of this study indicate that the Simon facilitation and interference effects occurred depending on the arrow direction and horizontal installation locations of the signs. Therefore, when the arrow direction of the signs is inconsistent with the horizontal installation location of the signs (e.g., when the arrow points to the right while the horizontal installation location is on the left side), the “Simon interference effect” occurs, FRs decrease, and DMTs increase. When the arrow direction of signs is consistent with the horizontal installation location of signs (e.g., when the arrow points to the left while the horizontal installation location is on the left side), the “Simon facilitation effect”, FRs increase and DMTs decrease.
When the horizontal installation locations of signs were x = −30 cm, x = 0 cm, and x = 30 cm, however, the Simon effect, according to the arrow direction did not occur, and the average DMTs were found to be shorter for the right arrow direction. This was because all the participants were right-handed and right-side driving was performed in South Korea where the experiment was conducted [
28,
30]. This means that the Simon effect, according to the arrow direction of the signs occurs when the horizontal installation location of the signs is more than 60 cm away from the center. Hence, the results of this study indicate that the installation of signs on the same horizontal side as the arrow direction can contribute to reducing the DMTs of occupants in an evacuation situation due to the Simon facilitation effect.
Third, the experimental results revealed significant variances in DMTs depending on the horizontal installation location of the signs (see
Table 4). There was, however, no significant variance in DMTs depending on the arrow direction for each vertical installation location of signs. As for the average DMTs for each vertical installation location, the highest average DMTs for both the left and right arrow directions were observed at y = 30 cm. The lowest average DMTs were observed at y = 270 cm for the left arrow direction and at y = 150 cm for the right arrow direction. These results appear to be similar to the results of previous studies [
26] in which the optimal installation location of the signs was proposed based on the analysis of the gaze point and eye movement data of the participants. In previous studies, the eye movement data obtained while the participants passed through the 2-m high maze-set were analyzed, and the gaze points of the evacuees were quantified in the horizontal and vertical directions according to the type of junction and corridor in which wayfinding decisions occurred. Vertical heights between 100 and 150 cm attracted the gaze of the largest number of people, and vertical heights between 0 and 50 cm attracted the gaze of the fewest number of people. Although a direct comparison cannot be performed, owing to the different heights of the walls used in the experiment (2 m for the previous studies [
26] and 3 m for this study), the average DMTs seemed higher in this study when the participants observed the signs installed at low locations as with the results of the previous studies, because the participants were less likely to notice the low locations of the wall. Therefore, the experimental results of this study indicate that the installation of signs at the low locations of the wall is highly likely to adversely affect the DMTs of occupants in an evacuation situation.
Finally, DMTs according to the vertical and horizontal installation locations of the signs were compared to propose the installation location of the signs to support the fastest DMTs at a T-type indoor intersection. The above results showed that the DMTs of occupants are affected by the arrow direction and horizontal/vertical installation locations of the signs. In addition, in the case of the horizontal installation location, it was determined that the Simon effect occurs at locations more than 60 cm away from the center on both sides. In the case of the vertical installation location, it was determined that DMTs increase when the signs are installed at the low locations of the wall. In this study, the horizontal direction of the wall was divided into three areas based on the locations in which the Simon effect occurred (x = −150~−60 cm, x = −30~30 cm, and x = 60~150 cm), and the vertical installation location was divided into three areas (y = 30~90 cm, y = 120~180 cm, and y = 210~270 cm). The average ranks for each section were then compared to propose the optimal installation location of the signs (see
Figure 9). In this instance, the average rank of each section represents the average of the ranks for each installation location presented in
Figure 4,
Figure 5 and
Figure 6.
When the average ranks for each section were compared, the section exhibiting the lowest average rank (the lower average rank exhibits the faster DMTs) regardless of the arrow direction of signs was determined to be x = −30~30 cm and y = 210~270 cm (Rank: 1.44), followed by x = 60~150 cm and y = 210~270 cm (Rank 1.50), and x = −150~−60 cm and y = 120~180 cm (Rank 1.58). Hence, for the installation of signs regardless of the arrow direction, the highest efficiency can be obtained when it is installed at a height of more than 210 cm in the middle of the wall located in front of a T-type intersection. However, since this result does not consider the descent of the smoke layer, it needs to be corrected through an experiment considering the smoke layer.
For the left arrow direction of signs, the section that exhibited the lowest average rank was x = −150~−60 cm and y = 120~18 cm (Rank: 1.25), followed by x = −150~−60 cm and y = 210~270 cm (Rank: 1.42), and x = −60~60 cm and y = 210~270 cm (Rank: 1.56). Hence, for the left arrow direction of signs, the highest efficiency can be obtained when it is installed at a height between 120 and 180 cm on the left side (x = −150~−60 cm) of the wall located in front of a T-type intersection.
For the right arrow direction of signs, the sections that exhibited the lowest average rank were y = 120~180 cm and y = 210~270 cm for x = 60~150 cm (Rank: 1.33). Hence, for the right arrow direction of signs, the highest efficiency can be obtained when it is installed at a height of more than 120 cm on the right side (x = 60~150 cm) of the wall.
5. Conclusions
This study used virtual stimuli to analyze the DMTs and FRs of participants according to the horizontal/vertical installation locations and arrow direction of signs at T-type indoor intersections. Based on the results, an optimal signs installation location was proposed.
First, the participants exhibited shorter DMTs and higher FRs for the right arrow direction of the signs. This indicates that the learned driving patterns and genetic handedness of the participants are correlated with the direction choice and DMTs.
Second, the Simon facilitation and interference effects occur depending on the arrow direction and horizontal installation location of the signs. In this instance, the Simon effect occurs when the horizontal installation location of the signs is more than 60 cm away from the center of the T-type indoor intersection on both sides.
Third, the DMTs of individuals increase when the vertical installation location of the signs is low.
Finally, in the case of a T-type indoor intersection, it is efficient to install the signs at a height of more than 120 cm on the same horizontal side as the arrow direction. Otherwise, the highest efficiency can be obtained when it is installed at a height of more than 210 cm in the middle of the wall.
This study is also valuable because it provides a scientific basis for selecting the installation location of signs, determined through an experimental analysis. The results of this study may be used to improve the installation guidelines and regulations for signs in the future. However, this paper has limitations as the participants were limited to university students and the experiment was performed on a virtual stimulus rather than an actual T-type intersection. Future studies should compare DMTs by age with participants from various age groups and compare DMTs in smoke conditions.


 ,
, 


