Article

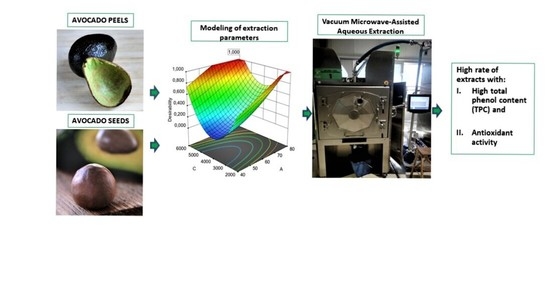
Vacuum Microwave-Assisted Aqueous Extraction of Polyphenolic Compounds from Avocado (Persea Americana) Solid Waste

by
Prodromos Skenderidis
1,*,
Stefanos Leontopoulos
1,
Konstantinos Petrotos
1 and
Ioannis Giavasis
2
1
Laboratory of Food and Biosystems Engineering, Department of Agrotechnology, University of Thessaly, 41110 Larissa, Greece
2
Laboratory of Food Microbiology and Biotechnology, Department of Food Science and Nutrition, University of Thessaly, 43100 Karditsa, Greece
*
Author to whom correspondence should be addressed.
Sustainability 2021, 13(4), 2166; https://doi.org/10.3390/su13042166
Submission received: 18 January 2021 / Revised: 14 February 2021 / Accepted: 15 February 2021 / Published: 18 February 2021

Abstract

:
The extraction efficacy of avocado fruit peels (AP) and seeds (AS) with the use of vacuum microwave-assisted aqueous extraction (VMAAE) was optimized in this study, with regard to extract’s total phenolic content (TPC), maximum antioxidant activity and minimal operational cost. Temperature (79.64 and 78.11 °C for AP and 43.90 and 45.26 °C for AS), time (11.89 and 11.75 min for AP, 10.18 and 10.28 min for AS), ratio of water to raw material (16.45% and 10.02% for AP, 38.73% and 37.65% for AS) and microwave power (5708.04 and 5699.10 W for AP, 5549.08 and 4797.29 W for AS) were estimated statistically as the optimal conditions in order to achieve high rates of extracts with high TPC and antioxidant activity using the 2,2-diphenyl-1-picrylhydrazyl (DPPH) scavenging radical methods, respectively. VMAAE performed under these conditions resulted in received extracts with TPC (0.352 gallic acid equivalent-GAE/g fresh AP/min and 0.124 GAE/g fresh AS/min). Furthermore, it was calculated the DPPH radical scavenging activity was equal to 100 mg/L expressed in L of 0.104 L/min for AP and 0.045 L/min for AS. The results of our study may give a promising solution to avocado processing companies for further utilization of their waste.

Graphical Abstract

1. Introduction

The avocado plant (Persea americana Mill.) is grown worldwide in the tropics. Avocado fruits were consumed in Central America over the past 10,000 years [1]. Due to its high nutritional content, avocado fruit has recently attracted growing global interest [2]. Commercial varieties are mainly based on the hybrid varieties of Guatemala and Guatemalan–Mexican varieties [3].
Consumption of avocados as fresh fruit is widely used nowadays. Furthermore, its pulp is used by food, pharmaceuticals and cosmetic industries due to its high concentration in vitamins, proteins, polyphenols, fibers, minerals, unsaturated fatty acids and other beneficial phytochemicals [4]. During fruit processing the peels (AP) and seeds (AS) end up as by-products comprising of 30% of total fruit weight [5,6]. Pro-anthocyanidins (procyanidin type A and B), catechins, quercetin, glycerides, triamcinolone acetaminophen, saponins, steroids, caffeoalkinic acid and coumaric acid are the main complex mixture of polyphenolic compounds found in avocado residues [7,8,9,10,11,12].
Several patented uses of avocado in cosmetics, food and medical field are currently reported in a review study. These patents indicates the application of avocado pulp and avocado by-products to produce foods like antioxidant tea, nutraceuticals creams, and natural extracts with antioxidant and anti-inflammatory activity [13]. Furthermore the effective use of a spray drier powder from avocado process waste water as a natural antioxidant in pork sausage production was recently presented [14].
The extraction techniques used in industrial food processing results in the isolation of the phytochemicals found in by-products that can be applied as active compounds in functional food, colorants, flavors, antioxidants, antimicrobial, and stabilizers [15]. In addition, the use of these wastes could contribute to the reduction of the environmental impact and costs in the food industry [16].
Regarding isolation and extraction of bioactive components from food residues many methods have been proposed [17,18,19]. Microwave-assisted extraction is characterized by faster extraction times smaller size of the required equipment, higher efficiency, reduced energy consumption (up to 85 times), lower amount of waste and exposure of bioactive components to thermal destruction [20,21].
Furthermore, vacuum microwave-assisted aqueous extraction (VMAAE) has been reported as an innovative extraction technology and is widely recognized as “pure green” technology because of the absence use of organic solvents [22,23]. VMAAE can enhance the mass transfer process by promoting the diffusion of the active substances contained in extracted materials into the solvent using an intake pressure technique [24]. The thermal degradation and oxidation risks can be reduced by the vacuum as this can reduce the solvent’s related boiling temperature. A comparison between VMAAE and the application of a standard microwave-assisted extraction (MAE) on extraction ability of vitamin C from several fruits and vegetables such as guava fruit, green pepper, soybean and tea leaves has demonstrated an increase of vitamin C yields of 53%, 145%, 20% and 60% respectively [25].
The aim of this research study was to demonstrate and model using a response surface methodology the efficacy of industrial-scale VMAAE of avocado peels and seeds regarding the yield of the total content of phenols, evaluating also the antioxidant activity of these extracts. Furthermore, relations of the extraction rate of the selected responses will be used in order to evaluate the operational cost using a Box and Behnken experimental design of 29 experiments performed in triplicate. The appropriate equations were developed in order to model and achieve the prediction of the total phenolic content (TPC) and the extract’s antioxidant activity.

2. Materials and Methods

2.1. Avocado By-Products

Green skin avocado fruits of the “Pinkerton” variety collected in the year of 2019, were purchased from Crete Island in southern Greece. The peels (AP) and the seeds (AS) of the fruit were then separated and stored at −28 °C until further mechanical shivering occurred using a sphere mill in order to powder the samples. The final AP and AS powders were sealed in plastic bags, weighing 2 kg, and kept frozen at −28 °C until extraction procedure.

2.2. Chemicals

Sigma Aldrich were supplied this research study with the appropriate reagents and chemicals such as Folin Ciocalteu 2N; 2,2-diphenyl-1-picrylhydrazyl (DPPH) (PubChem CID:74358); methanol (PubChem CID:887); anhydrous crystal-formed sodium carbonate (PubChem CID:10340); and gallic acid (PubChem CID:370) in order to complete it.

2.3. Extraction Methodology

Different quantities of water (20, 50 or 80 L) depending on the dilution ratio (10%, 25% or 40%) were used in each of the selected experimental conditions in order to extract 2 kg of each sample (AP or AS). Using a MAC-75 (Milestone Technologies Inc., Sorisole, Italy) multimode industrial microwave-type reactor for scale-up vacuum extraction, apparatus constructed by an Italian company (Milestone Technologies Inc., Sorisole, Italy) was used for the extraction experiments completed in Pellas Nature P. Co. (Edessa, Greece) in the year of 2020. The Box and Behnken statistical design (BBD) method which is a spherical design procedure was used in order to achieve the appropriate experimental plan. BBD is a widely used method in the optimization of extraction processes and it is used to select the experimental measuring point’s network [26,27]. Four independent variables (A: extraction temperature: 40–60–80 °C, B: extraction time: 10–50–90 min, C: microwave power: 2000–4000–6000 W/cm2 and D: Water solvent ratio to dry avocado tissue: 10–25–40%) and two optimization objectives or “responses” ((a) maximization of total polyphenols and (b) Minimization of IC50) were taken into account. Optimization conditions were achieved by using the Design Expert v12 software, which calculated the optimal conditions and created the relevant diagrams and mathematical equations of surface response, a methodology that has been already tested successfully [28]. The pressure of the extractor was adjusted at 355 mBar in all experiments.
The obtained extracts were filtered through porous Whatman paper grade 591 and were stored in a freezer at −28 °C until further analysis. Centrifugation at 12,000 rpm for 10 min was carried out for each sample before further analysis occurred. The obtained supernatant solution was used for the response’s analysis.

2.4. Determination of Total Phenolic Content (TPC) of the Extracts

A previously published methodology was applied in this study [29]. Briefly, with 20 μL of each extract, 1.58 mL of distilled water and 100 μL of Folin-Ciocalteu reagent (0.2 N) were mixed. Afterwards, 300 μL of Na2CO3 solution (200 g/L) was added and samples were placed for 30 min in incubation at 43 °C in the dark. The absorbance was then measured at 765 nm. For the calculation of the TPC contained in samples, the calibration curve of gallic acid expressed as gallic acid equivalent (GAE) in mg/g of the fresh by-product was used and 50–500 mg/L was determined as the linearity range of standard gallic acid. TPC yield was expressed as mg of gallic acid equivalent per g of fresh weight (fw) of avocado by-product.

2.5. Total Antioxidant Capacity of the Extracts (2,2-Diphenyl-1-Picrylhydrazyl (DPPH) Method)

A methodology presented by Brand–Williams et al. [30], was applied in this study. Different concentrations of distilled water were used in order to dissolve the samples that used also in the method of TCP. Afterwards, the products from the avocado samples were then mixed with 1 mL of DPPH radical (100 μM) methanol solution. Due to several advantages, DPPH radical assay is the most appropriate and thus it has been chosen among other methods used for the estimation of the antioxidant activity of avocado extracts. In order to achieve the appropriate reaction, the contents were vigorously mixed and incubated at room temperature in the dark for 20 min. The sample was then centrifuged for 10 min at 10,000 rpm and the final absorbance was read at 517 nm. DPPH methanol was used as control while methanol solutions of the tested extracts were used as blank. In order to minimize statistical error, the experiments were repeated three times. Equation (1) was used in order to determine by calculations the percentage of the radical-scavenging capacity (RSC) of the extracts.
% DPPH radical scavenging activity = ((Abs control − Abs sample)/Abs control) × 100
where: Abs sample and Abs are the absorbance values of the tested sample and the control. In order to measure the radical-scavenging capability of the extracts, the value of the (IC50) was calculated using the graph of the % RSC versus the extracts concentration content. The IC50 estimates the concentration of the extract caused by 50% scavenging of DPPH radical and the lower extracts concentrations needed, the higher antioxidant activity is the sample. Finally expressed as the Extract Equivalent Volume (EEqV) IC50 of DPPH radical scavenging activity equal to 100 mg/L expressed in L (Equation (2)):
EEqV   R   IC 50   DPPH   =   ( V t   ×   100 IC 50 DPPHt ) / W
where W is the extracted avocado’s by-product weight that was constantly equal to 2 (kg), Vt and IC50 of DPPHt are the whole volume in liters (L) of the extract and the half maximum inhibitory concentration at a given extraction time respectively.

2.6. Mathematical Modeling of Box–Behnken Designs

An experimental Box–Behnken Design (BBD) methodology was applied in order to choose the testing points. This statistical approach is commonly used due to its proven effectiveness in improving extractions [26,28,31].
For the determination of the BBD model four independent variables were chosen. These independent variables were: the extraction temperature (A = 40–60–80 °C), the extraction time (B = 10–50–90 min), the microwave power (C = 2000–4000–6000 W) and the ratio of water solvent to PP (D = 10–25–40 L/kg) (Table 1). TPC and antioxidant activity based on the IC50 of free radical scavenging (DPPH) were chosen as responses due to their dependence on the extraction method [32,33]. The response variables were selected and adapted to a second order polynomial model equation obtained by response surface methodology (RSM) (Equation (3)):
Y=β0 + ∑3i=1βiXi + ∑3i=1 βiiXii2 + ∑2i=13j=i+1βiiXiXj
The TCP and the IC50 of the DPPH were the response variables (Y). Xi and Xj were the independent variables that controlling the responses and the model’s regression coefficients were β0, βi, βii and βij (intercept, linear, quadratic and interaction).
Design-Expert v12 (Stat-Ease, Inc., Minneapolis, MN, USA) was used as a mathematical program in order to select the final 29 set-point combinations. The determination of these points was applied in triplicate. For the maximization of the effect of the unexplained variability in the observed responses, experiments were randomized and each variable was classified as represented in Table 1 into three groups: −1 (low), 0 (intermediate) and +1 (high).

2.7. Data and Statistical Analysis

Regarding the cost evaluation of the extraction process, the TPC extraction rate was calculated. Equations presented in a previews study [28] was considered in order to estimate the rate of TPC (RTPC) obtained from AP and AS, considering also parameters such as the set-up time of the apparatus, the time used for the extraction and the volume of the mixtures extracted. These parameters are presented in Equation (4).
RTPC   ( mg   GAE / g   fw ) / min   =   C t V t t + K
Ct and Vt are respectively the TPC concentration of equilibrium in the liquid extract at a given extraction time t (mg/L) and the rest of the volume in liters (L) of liquid extract at a particular extraction time. t and K are the extraction time in min and the constant setup time of the apparatus, which was calculated to 15 min.
Likewise, based on the Equation (5), the EEqV rate of IC50 of the DPPH radical scavenging (REEqVR IC50DPPH) was measured.
REEqVR   IC 50   DPPH   =   EEqV   of   IC 50   DPPH t + K
Design-Expert v12 software was used for analysis of variance (ANOVA). Multiple regression analysis was completed using the surface response method. For each extracted avocado by-product, the ANOVA derived two respective surface response equations, correlating the performance and bioactive parameters measured with the four independent extraction parameters. Optimal values of TCP and IC50 of DPPH radical scavenging for the extracts obtained was also estimated using the same program. Furthermore, MiniTab®17.1.0 statistical software (Minitab LCC, State College, PA, USA) used for Pearson correlation test. The statistical significance was set at p ≤ 0.05.

3. Results and Discussion

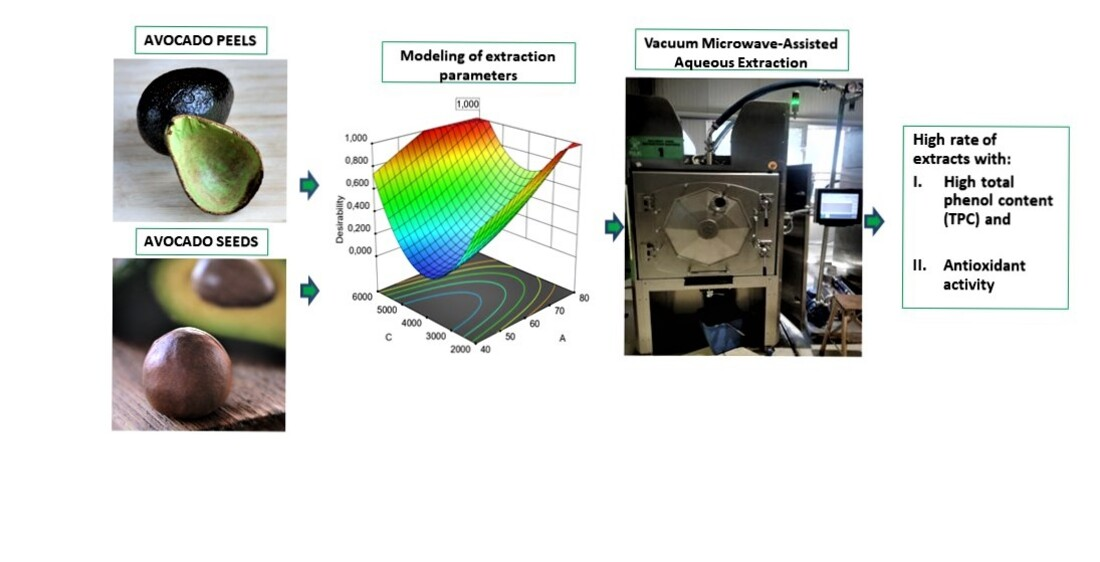
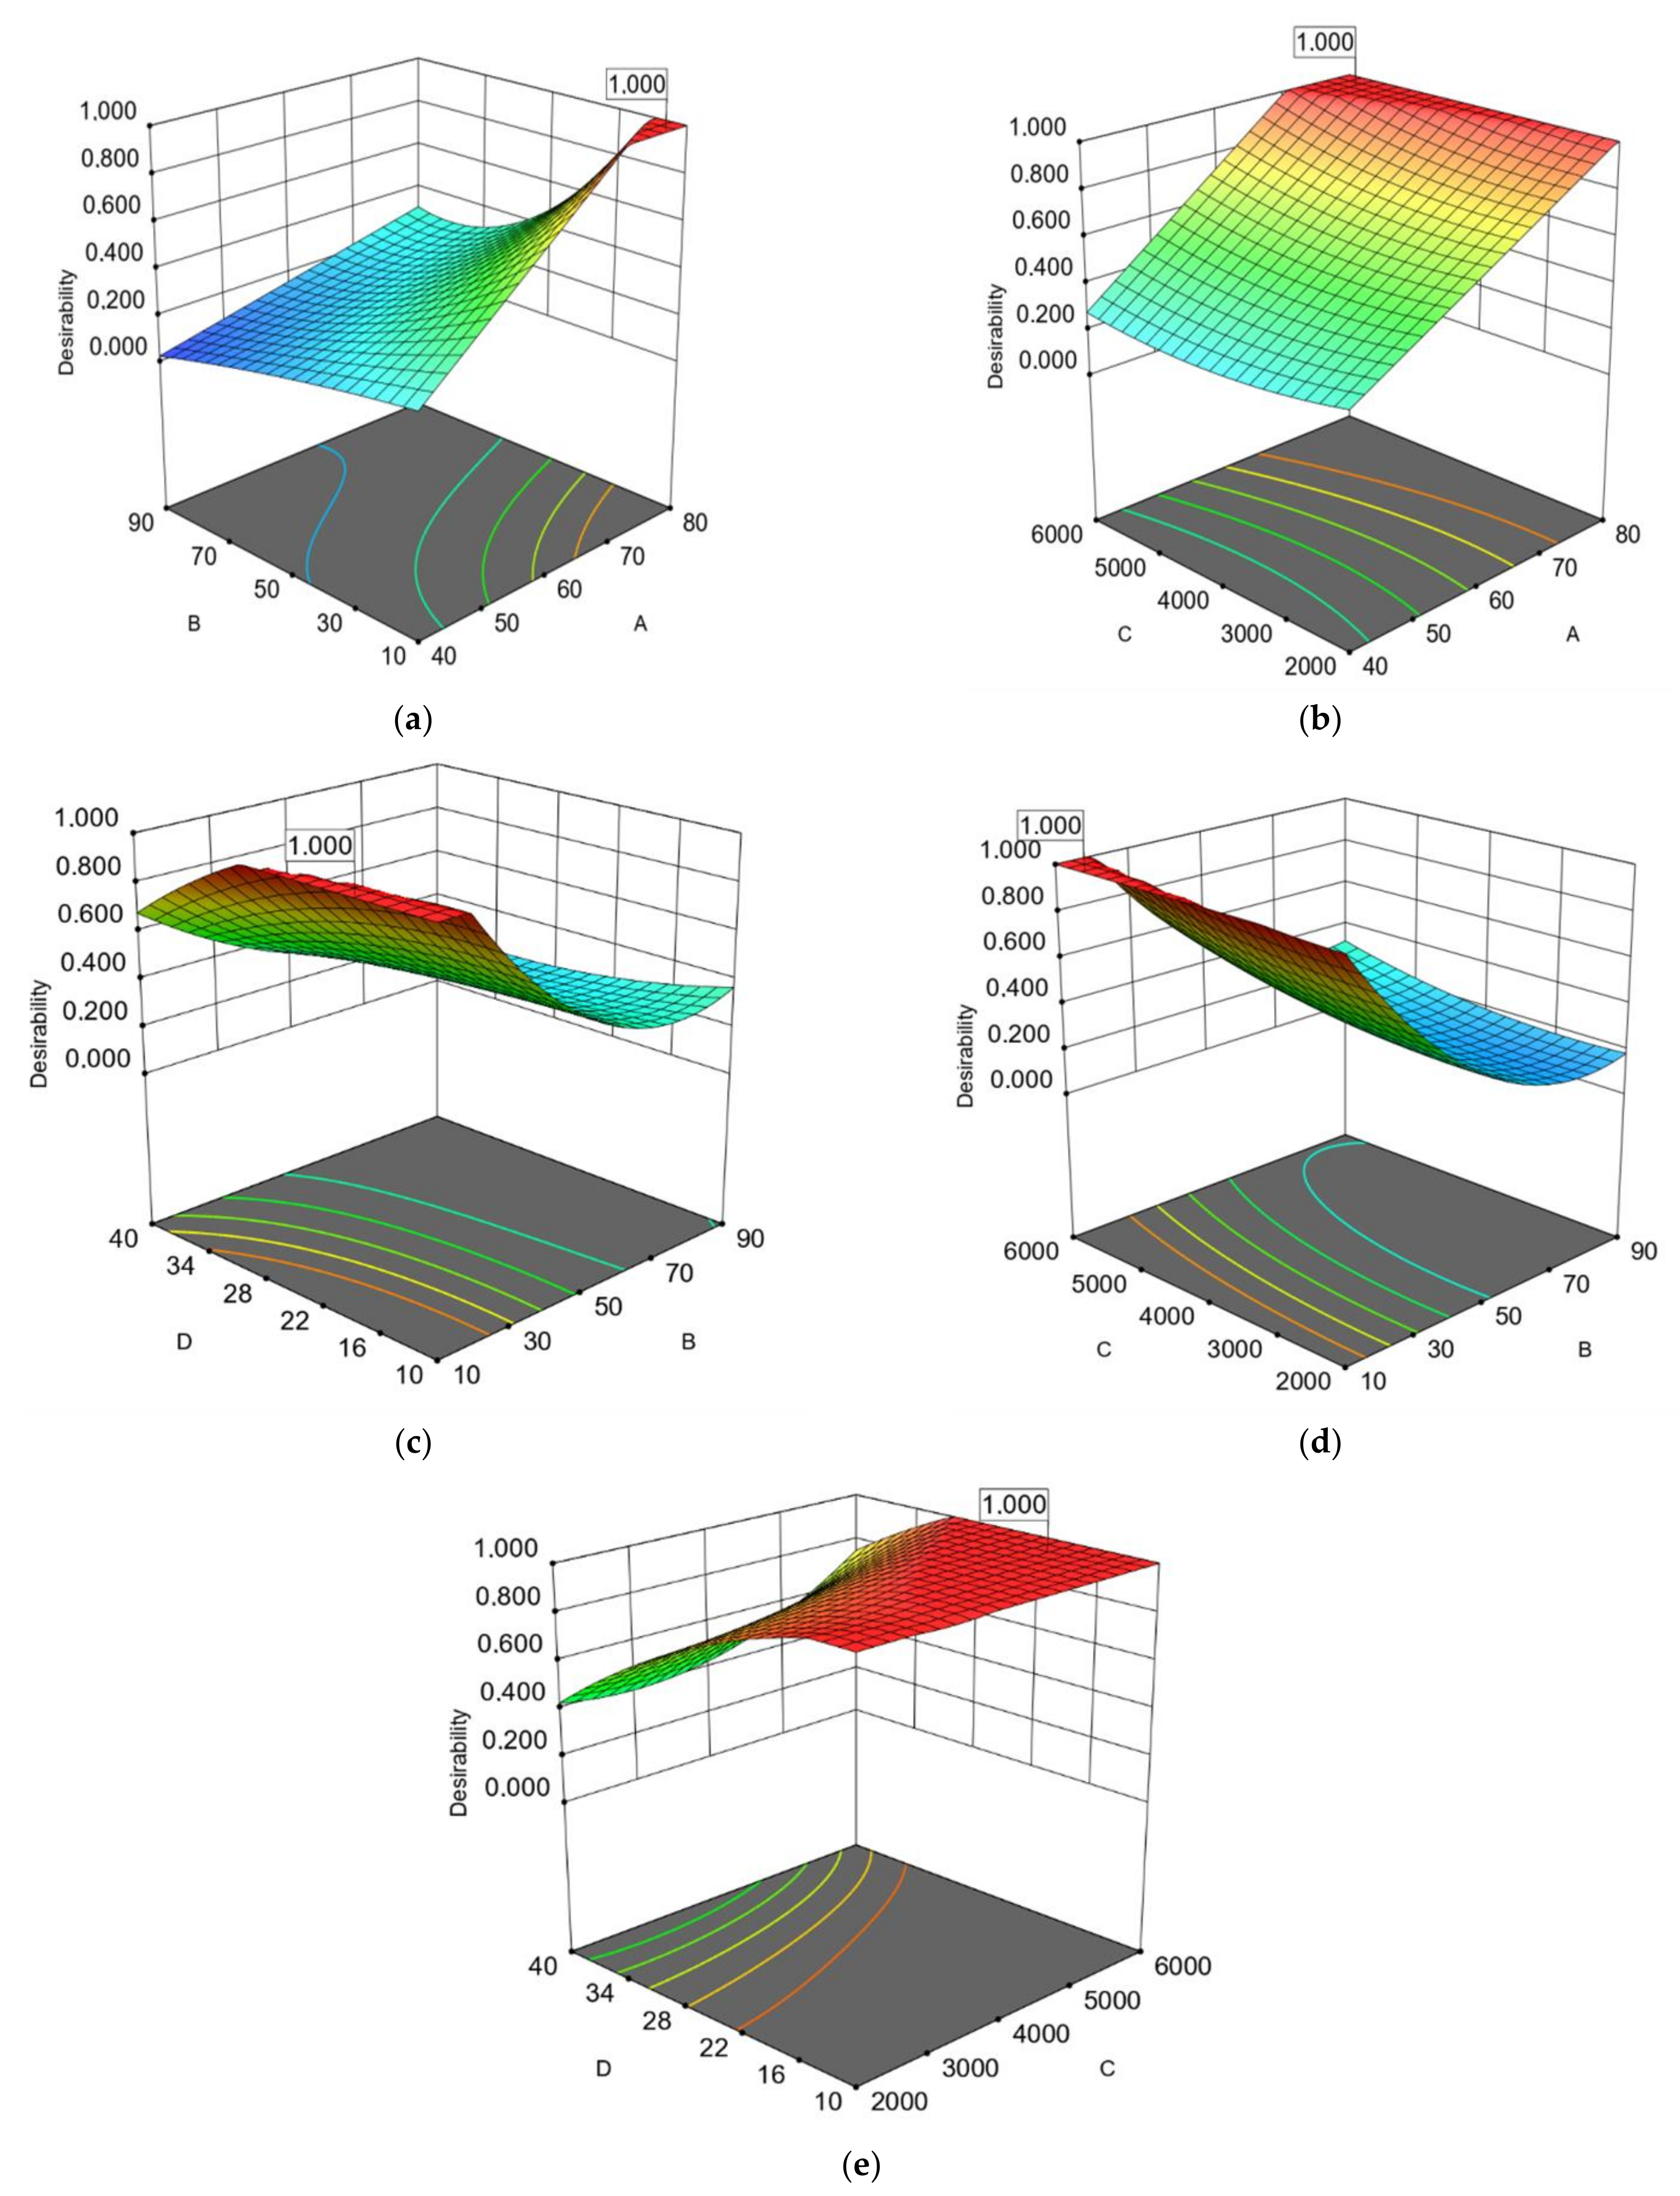
3.1. Predicted Models of the Responses by Response Surface Methodology (RSM)

Table 2 represents the results of the 29 BBD experiments linked to the extracts’ TPC and the radical scavenging activity of the DPPH. By applying multiple regression analysis to the experimental data using the Design Expert software package v12, the quadratic equations linked the responses and the independent variables were developed and were evaluated by ANOVA Table 3 and Table 4. The p-value was used in order to conduct the verification of the significance of each coefficient. A greater corresponding coefficient was observed on smaller p-values [34].
The experimental results shown that the higher achieved TPC in extracts was 10.104 and 5.604 mg GAE/g fw from AP and AS, respectively. Based on this result it can be assumed that the polyphenolic content of the peels was significant higher from the seed’s TPC. These results agreed with the results presented in a research study completed by Calderón-Oliver et al. [35] as for the TPC of AS extracts (5.7 mg GAE/g) but they presented higher TPC in AP extracts (19.7 mg GAE/g). This difference was probably attributed to the moisture difference of AP by-products due to the drying pretreatment of AP that they followed in their method.
Between the TPC of the extracts and the measured IC50 of the DPPH radical scavenging of the extracts there was a negative Pearson correlation of −0.7 and −0.71 of AP and AS, respectively (results not shown). These results indicate that the antioxidant activity (the lower the IC50, the higher antioxidant activity) of the extracts is in accordance with the TPC as well as with the phenols profile as mentioned in a study completed by Kosińska et al. [8] who reported also that AP presented higher antioxidant activity than AS due to higher TPC. Data in Table 3 and Table 4 indicate that the equations obtained of the predicted models shown in Table 5 are significant (p < 0.01) and with high predictive accuracy, as is concluded from the high R2 values. The determination coefficient (R2) indicated the sum of the variations that the model interprets. The determined high values of the adjusted coefficient (R2 adj) have indicated that the models were significant.

3.2. Optimization of Avocado By-Products Vacuum Microwave-Assisted Aqueous Extraction

Using Design Expert v12 statistical and optimization software, the optimal conditions for the extraction parameters were defined in order to optimize the two selected responses taking into account the operational extraction cost. Thus, setting as target the maximum rate of receiving extracts with the higher TPC/g and EEqRVIC50 DPPH the independent variables received, respectively, and the selected program solutions with desirability = 1000 are presented in Table 6.

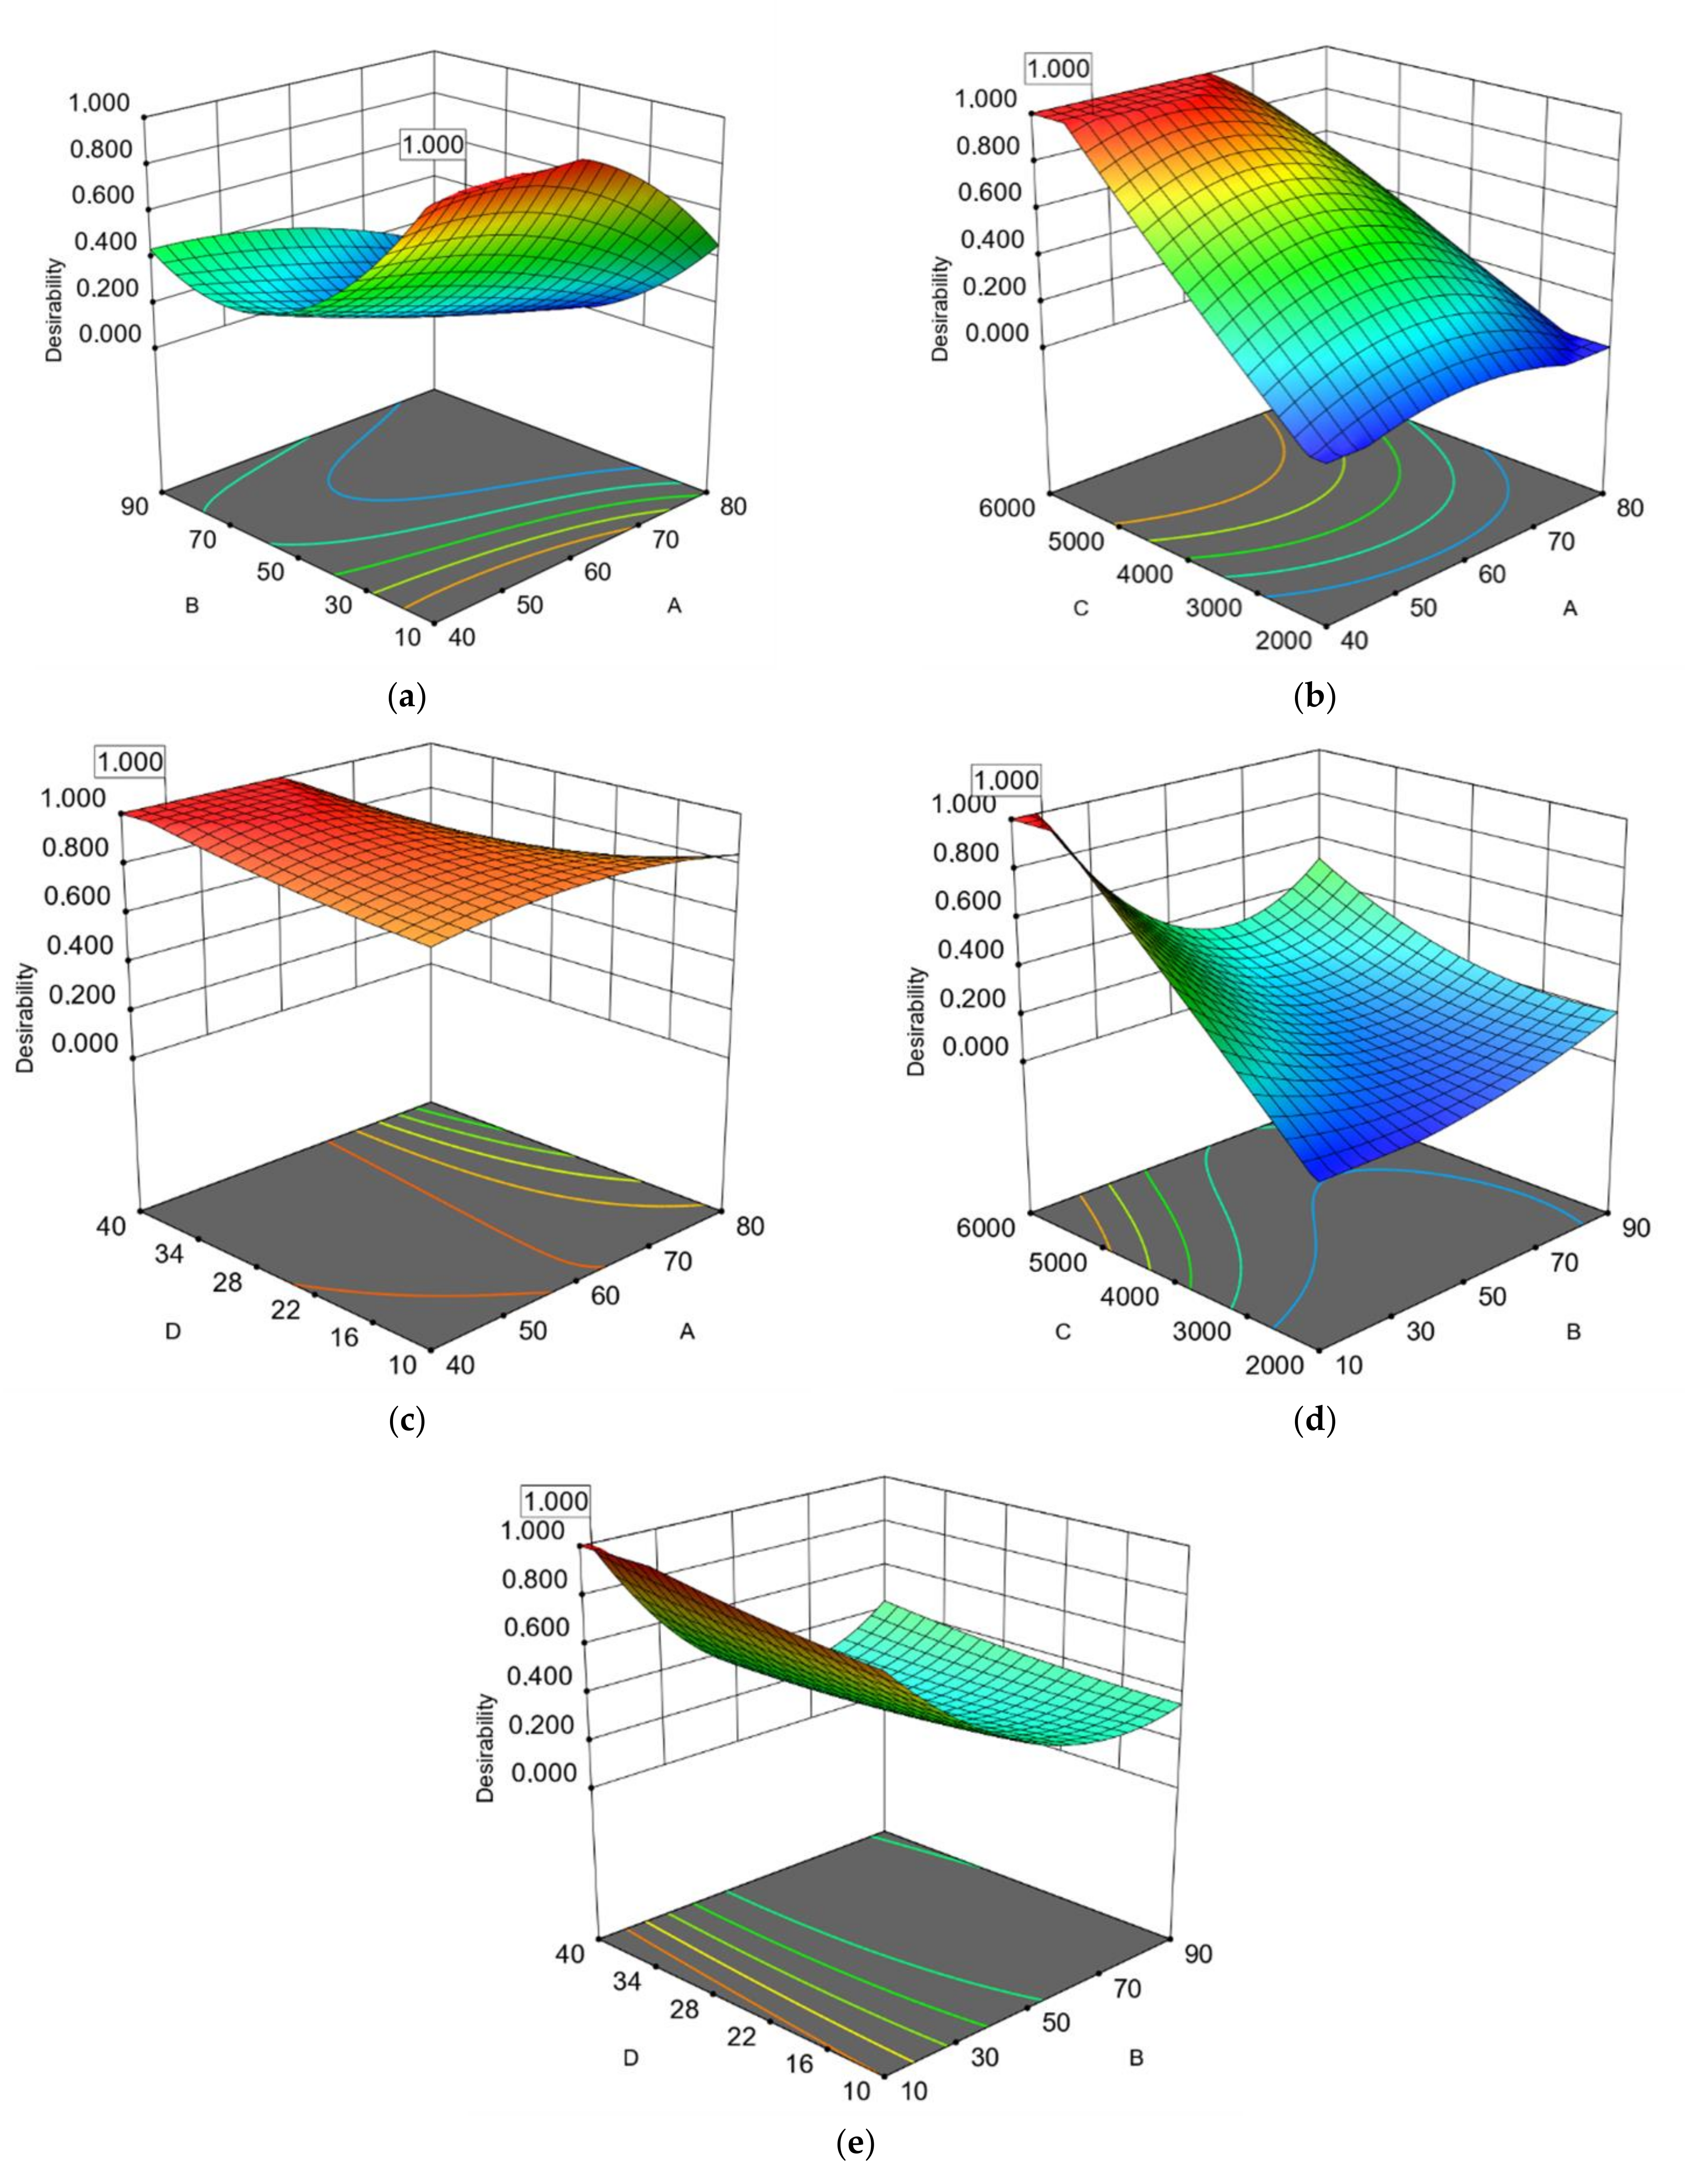
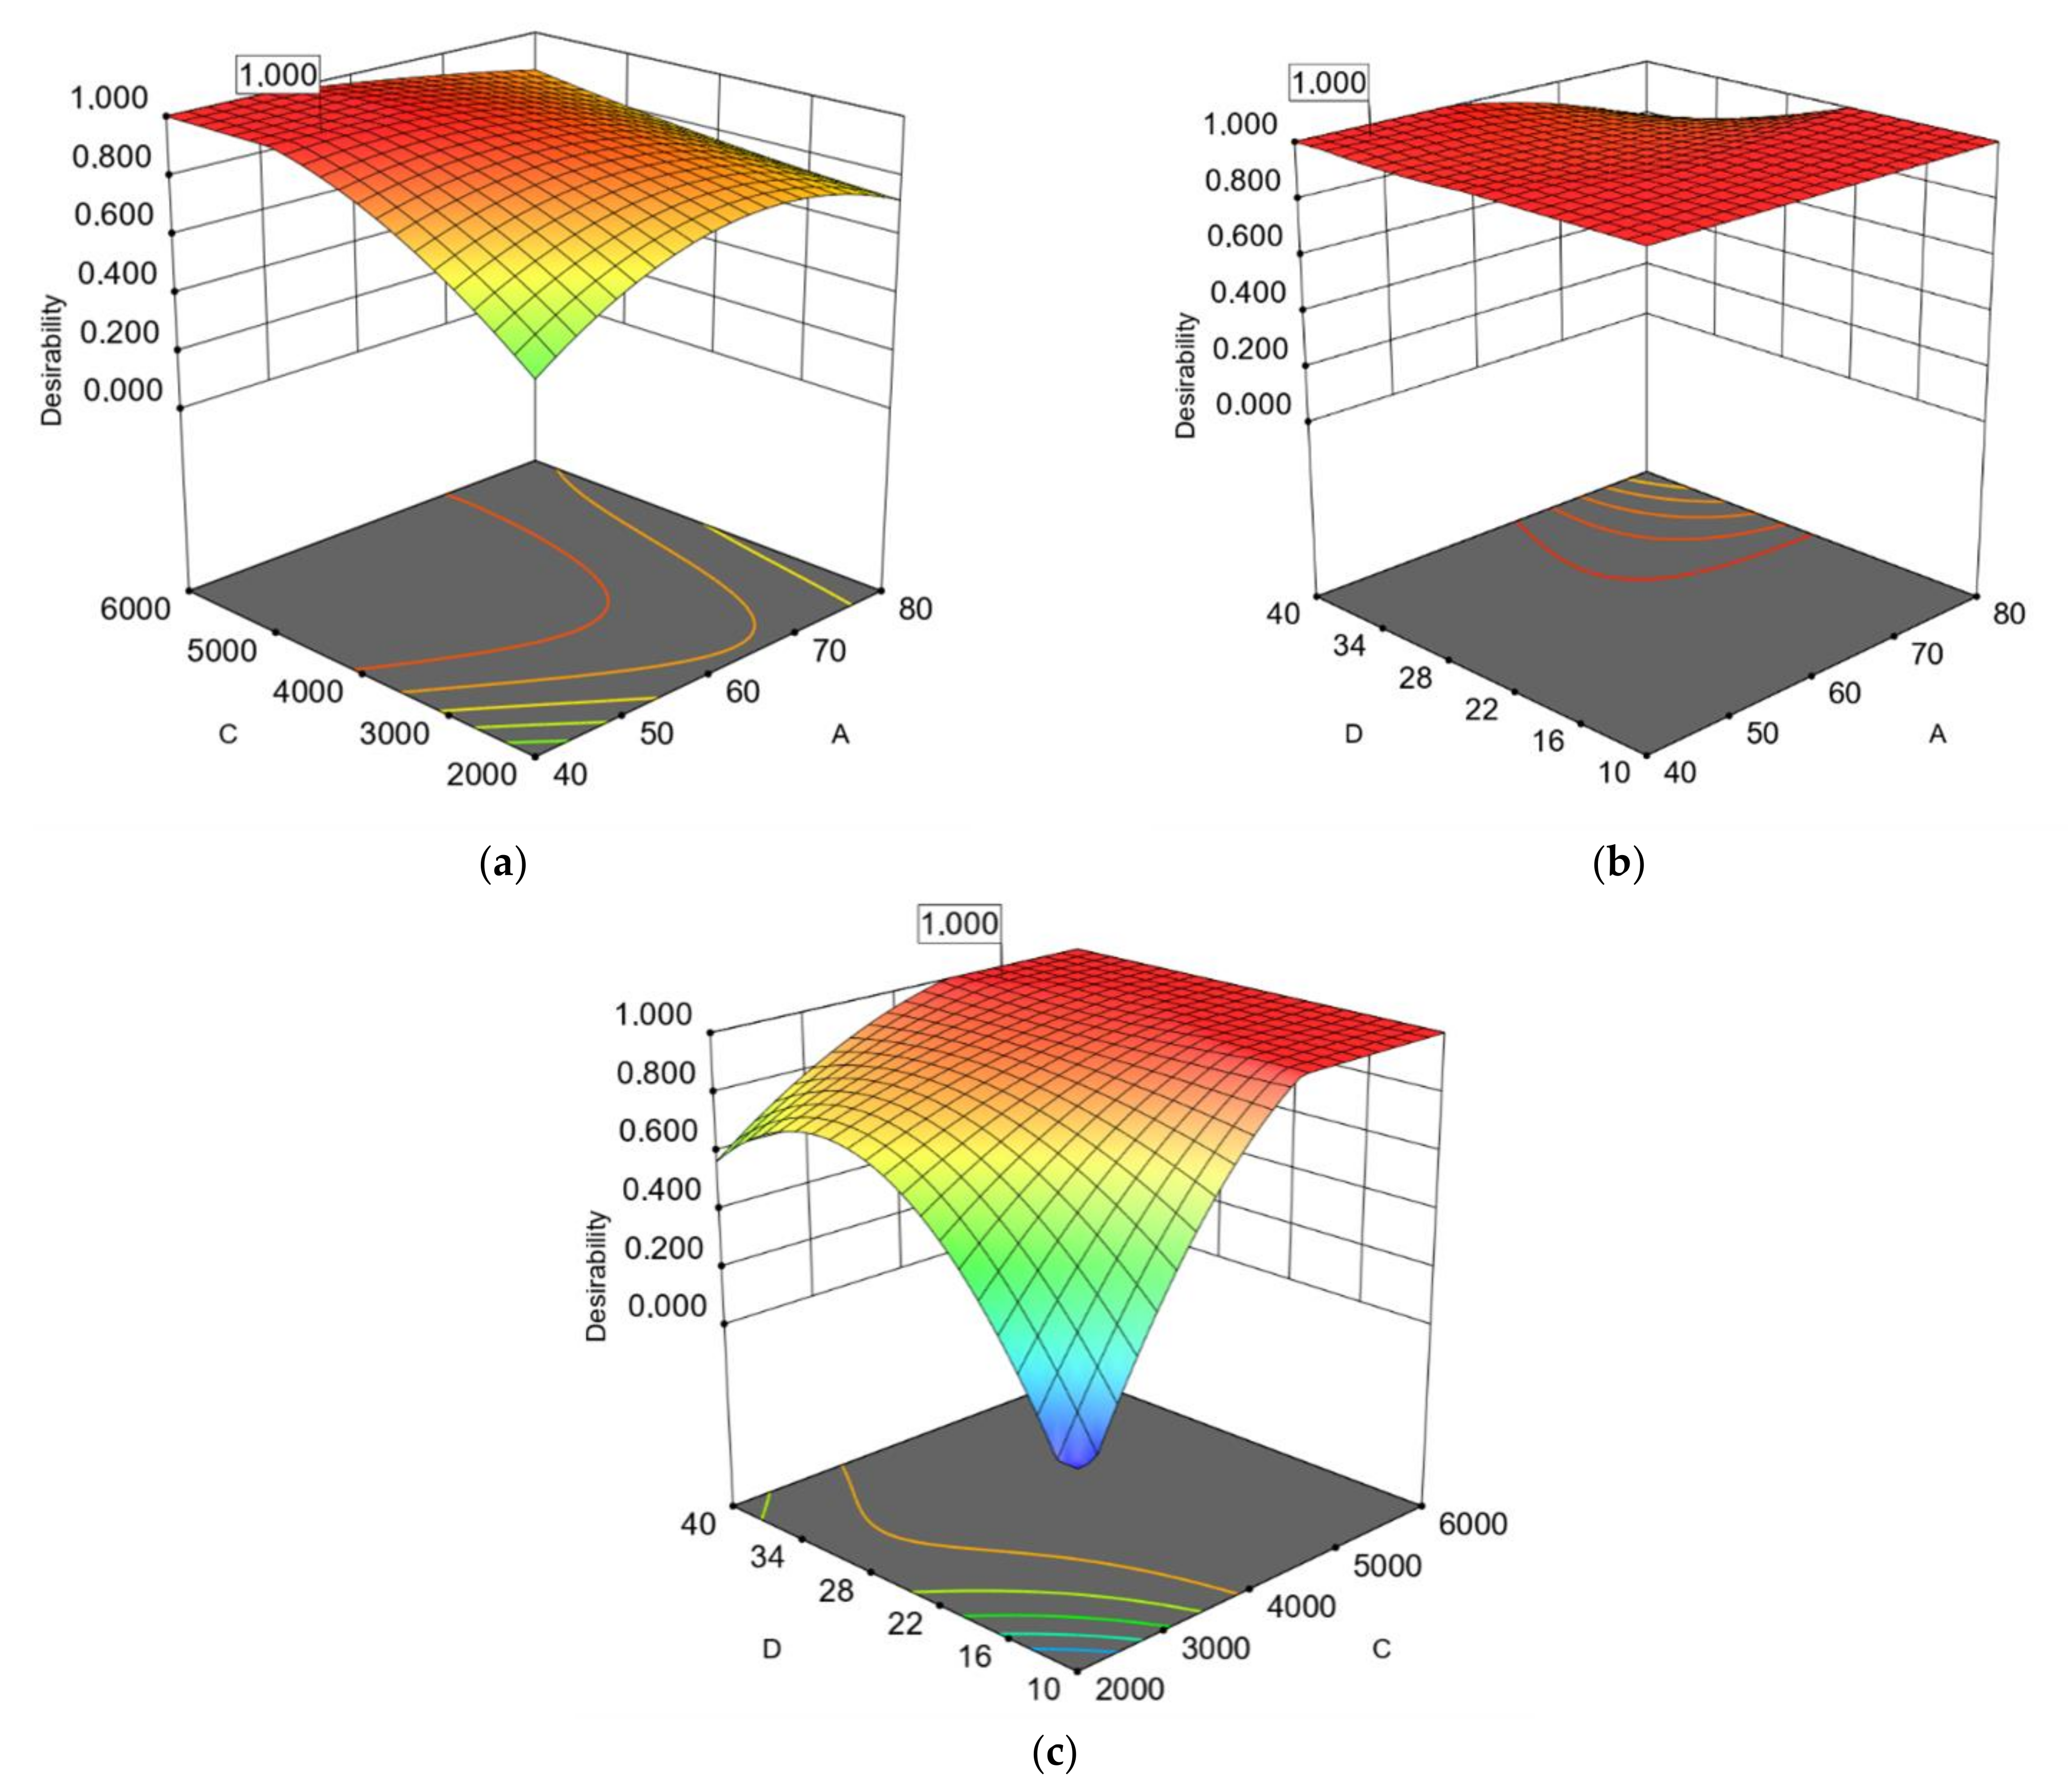
3.3. Effects of Independent Variables and Their Interaction

The effects of regression equations, schematic representations of three-dimensional response surfaces and two-dimensional contour plots are illustrated in Figure 1, Figure 2, Figure 3, Figure 4. The correlation between independent and dependent variables and the interactions between them were visualized using 2–3D plots by using the z-axis while retaining the other two variables at their zero level. Different shapes of the contour plots suggest various interactions between variables. Circular contour plots present negligible correlations between the related variables. The elliptical contour revealed substantially different interactions between the related variables [36]. Microwave temperature (A) and power (C) parameters have reported that they are interrelated. In more detail, it was observed that as microwave power and extraction temperature increase the yield extraction is also increased [23]. Due to reduced viscosity and surface tension, the solvent strength increased at high temperatures, promoting solvent solubilization and increasing hydration of the extracting materials [37]. The significance of the interaction between these independent parameters also presented in the ANOVA (Table 3 and Table 4) (Figure 2a, Figure 3b and Figure 4a). Segovia et al. [18] evaluated the effect of ultrasound (0–104 W) and temperature range (20–60 °C) on the effective extraction of polyphenols from avocado seeds dissolved in water. According to their results, the increase of the ultrasonic power and the extraction temperature resulted in extracts with higher polyphenol content and antioxidant capacity reaching an optimum at their higher tested temperature of 60 °C and presented also a linear relationship between the antioxidant activity and the TPC.
However, studies have reported that the extraction efficacy increases when extraction temperature rises until the optimal temperature is reached and then begins to decrease as the temperature rises further. This phenomenon was presented in the extraction of AS, as can been seen in Figure 3a. It was also observed that differences in extraction temperature may affect the antioxidant ability of the polyphenolic compounds [38]. Furthermore, when VMAAE was evaluated under vacuum system like the system of MAC-75 (Milestone Technologies Inc., Sorisole, Italy) industrial microwave extractor with high power efficiency, the temperature of the boiling point decreased as a result of the vacuum procedure, resulting in better extraction efficiency by the desorption of solutes from active sites within the extracted mixture [28].
From the ANOVA, it is clearly demonstrated that the extraction time (B) affects significantly the efficacy of the VMAAE procedure from the point of operational cost. Thus, the operational cost in this study was estimated on the basis of the industrial extraction rate. The only exception to this was the ratio of EEqV R IC50 DPPH (L) from AS, probably because of the different moisture concentration and the different extracts phenolic profile [8]. Extraction time in MAE has been reported to be short in contrast with the traditional techniques used so far (stirring and maceration) and typically ranges between a few minutes and half an hour, preventing potential degradation and oxidation of bioactive compounds [24]. As represented in Table 6, a period of 11.75 min and 10.18 min were observed in order to achieve the optimal extraction time of AP and AS, respectively. This observation is based on the extraction rate of REEqVR IC50 DPPH, which was similar to the optimal extraction time (12.127 min) used for the extraction of pomegranate peels using the same methodology [28]. The extraction time used in this study is shorter than the required extraction time needed for the extraction of by-products of dry avocados as described by Calderón-Oliver et al., [35]. The two aforementioned methods also require shorter time compared with the process as described by Morais et al. [39] where 4 h extraction time is required in order to achieve production of 1.81 and 1.5 mg GAE/g from fresh peel and seeds using methanol as a solvent.
The interaction among the extraction time (B) and the extraction temperature (A) were statistically significant for the extraction of the two by-products based on ANOVA analysis on TPC, EEqVR IC50 DPPH and their ratio of TPC (except for REEqVR IC50 DPPH of AP) (Table 3 and Table 4). Additionally, as shown in Table 3, the interaction between extraction time (B) and the ratio of water to AP (%) (D) (Figure 1c and Figure 2c) were found to be significant according to ANOVA. This can be explained from the fact that the volume of the solvent must be adequate in order to ensure that the extracted plant material is submerged in the water during the microwave process and this has also been presented as significant by a similar research work [32].Additionally in our study, it was observed in the first 10–12 min and in a ratio of 10–16.45% the achievement of the excellent extraction flows from AP with the highest ΤPC and antioxidant activities while for AS the ratio needs to be higher (37.65–38.73%). This observations is probably explained by the different moisture contain [40]. The fast and effective extraction of phenolic compounds from avocado by-products by the MAE may be explained by the rapid generation of heat by microwave radiation, which induces the degradation of the cellular matrix and increases the release of phenolic compounds and thus antioxidant activity [41,42]. On the other side the combinations of high temperatures with high extraction time increases the thermal stress of polyphenols leading to their degradation. This phenomenon is presented in Figure 3a and is in line with the study of Trujillo et al. [43] who optimized the AP extraction with a combined method of UAE and MAE using laboratory extractors and concluded that the optimal extraction temperature was 15 min at 60 °C with UAE and 60 s with MAE. AP extraction increases after the optimal extraction time. Decrease of the polyphenolic contents of the extracts may be caused by their degradation. The higher optimal temperature in our study is probably due to higher extracted volumes in the industrial-scale extractor. Furthermore, a possible explanation in difference observed between the optimal temperatures in AP and AS is probably due to different phenolic profile and the degradation of certain phenolic compounds [44].
The interaction of extraction time (B) with extraction power (C) were estimated as significant from ANOVA for the rate of total phenolic content of avocado peel and seeds as presented in Table 3 and Table 4. In this case, too, it was observed that in the first minutes of extraction the extraction efficiency increased with increasing microwave intensity (Figure 1d and Figure 3d). This was more evident in the case of AS extraction which started with lower yields at low intensities (Figure 3d).
Finally, interaction between extraction power (C) and ratio of water (%) to extracted material (D) was found to be also significant (Table 3 and Table 4). Figure 1e and Figure 4c show that when the ratio of water (%) to avocado by-product is increased, the volume of the extracted material also increases. AP shows an immediate reduction in the rate of the optimized extracts at 10.02–16.45%. In the case of avocado seeds, this observation occurs when the percentage of the extraction reaches 37.65–38.73%. This difference between the two by-products (which is approximately reach 22%, results not shown) is near to the difference in moisture percentage of AP and AS [40].
In another study it was also shown that the microwave power had significant influence on TPC which may be attributed to the increased solubility of phenolic compounds as a result of increasing power which promotes cell rupture and enhances exudation of phenolic compounds into the extracting solvent [45].

4. Conclusions

In this research study, vacuum microwave aqueous-assisted extraction parameters of temperature, time, microwave power and water to solid ratio of avocado peel and seeds has been used successfully to optimize a microwave industrial extractor. Operational cost (estimated as extraction time) was under consideration in order to achieve optimal extraction parameters leading to high rates of extracts with high TPC and high antioxidant activity, based on measurements of the IC50 of DPPH scavenging. Under these optimal extraction conditions, we obtained high rates of AP and AS extraction with high TPC values (0.352 mg GAE/g fresh AP/min and 0.124 mg GAE/g fresh AS/min) and high antioxidant capacity (0.104 L/min and 0.045 L/min) of extract equivalent volume at reference IC50 of DPPH radical scavenging activity equal to 100 mg/L, respectively. High accuracy of the models examined and feasible application of the optimized process on an industrial scale resulted due to the application of verified tests regarding the optimal extraction conditions based on the experiments in triplicate and the high R2 of the models. According to the results presented in this research, VMAAE achieved the conversion of avocado by-product directly, without using previous cost-effective drying pre-treatments processes, into a valuable phytochemical ingredient for food, pharmaceutical, cosmetic and other industries, thereby providing a viable solution to avocado processing companies for the valorization of their by-products.

Author Contributions

Conceptualization, P.S. and S.L.; Data curation, P.S. and K.P.; Formal analysis, P.S. and K.P.; Investigation, P.S. and S.L.; Software, P.S and K.P.; Supervision, K.P. and I.G.; Writing—original draft, P.S. and S.L.; Writing—review and editing, P.S., S.L., I.G. and K.P. All authors have read and agreed to the published version of the manuscript.

Funding

The Operational Programme “Human Resources Development, Education and Lifelong Learning 2014–2020” in the context of the project “Production of natural antimicrobial substances from solid wastes of natural antimicrobial substances from solid wastes of food industrial for use in foods and plant protection” (MIS 5048533) co-financed by Greece and the European Union (European Social Fund—ESF) funded this research study.

Institutional Review Board Statement

Not applicable.

Informed Consent Statement

Not applicable.

Data Availability Statement

The data presented in this study are available on request from the corresponding author.

Acknowledgments

The authors would like to thank Pella’s Nature P.Co. (Greece) for providing the industrial scale microwave extractor.

Conflicts of Interest

The authors declare no conflict of interest.

References

  1. California Avocado Society. Taxonomy of the Avocado. 1986. Available online: http://www.avocadosource.com/cas_yearbooks/cas_70_1986/cas_1986_pg_135-145.pdf (accessed on 15 January 2021).
  2. Bhuyan, D.J.; Alsherbiny, M.A.; Perera, S.; Low, M.; Basu, A.; Devi, O.A.; Barooah, M.S.; Li, C.G.; Papoutsis, K.; Low; et al. The Odyssey of Bioactive Compounds in Avocado (Persea americana) and their Health Benefits. Antioxidants 2019, 8, 426. [Google Scholar] [CrossRef] [PubMed] [Green Version]
  3. Hanani, Z.A.N. Gelatin. In Encyclopedia of Food and Health; Academic Press: Cambridge, MA, USA, 2016; pp. 191–195. ISBN 978-0-12-384953-3. [Google Scholar]
  4. Tremocoldi, M.A.; Rosalen, P.L.; Franchin, M.; Massarioli, A.P.; Denny, C.; Daiuto, É.R.; Paschoal, J.A.R.; Melo, P.S.; De Alencar, S.M. Exploration of avocado by-products as natural sources of bioactive compounds. PLOS ONE 2018, 13, e0192577. [Google Scholar] [CrossRef] [Green Version]
  5. Semper, C.; Zoologisch-Zootomischen Institut. Arbeiten aus dem Zoologisch-Zootomischen Institut in Würzburg. In Arbeiten aus dem Zoologisch-Zootomischen Institut in Würzburg; Stahel’schen Buch- & Kunsthandlung: Würzburg, Germany, 1874. [Google Scholar]
  6. Melgar, B.; Dias, M.I.; Ciric, A.; Sokovic, M.; Garcia-Castello, E.M.; Rodriguez-Lopez, A.D.; Barros, L.; Ferreira, I.C. Bioactive characterization of Persea americana Mill. by-products: A rich source of inherent antioxidants. Ind. Crop. Prod. 2018, 111, 212–218. [Google Scholar] [CrossRef] [Green Version]
  7. Soong, Y.-Y.; Barlow, P.J. Antioxidant activity and phenolic content of selected fruit seeds. Food Chem. 2004, 88, 411–417. [Google Scholar] [CrossRef]
  8. Kosińska, A.; Karamać, M.; Estrella, I.; Hernández, T.; Bartolomé, B.; Dykes, G.A. Phenolic Compound Profiles and Antioxidant Capacity of Persea americana Mill. Peels and Seeds of Two Varieties. J. Agric. Food Chem. 2012, 60, 4613–4619. [Google Scholar] [CrossRef] [PubMed]
  9. López-Cobo, A.; Gómez-Caravaca, A.M.; Pasini, F.; Caboni, M.F.; Segura-Carretero, A.; Fernández-Gutiérrez, A. HPLC-DAD-ESI-QTOF-MS and HPLC-FLD-MS as valuable tools for the determination of phenolic and other polar compounds in the edible part and by-products of avocado. LWT 2016, 73, 505–513. [Google Scholar] [CrossRef]
  10. Chel-Guerrero, L.; Barbosa-Martín, E.; Martínez-Antonio, A.; González-Mondragón, E.; Betancur-Ancona, D. Some physicochemical and rheological properties of starch isolated from avocado seeds. Int. J. Biol. Macromol. 2016, 86, 302–308. [Google Scholar] [CrossRef]
  11. Ferreyra, R.; Sellés, G.G.; Saavedra, J.; Ortiz, J.; Zúñiga, C.; Troncoso, C.; Rivera, S.A.; González-Agüero, M.; Defilippi, B. Identification of pre-harvest factors that affect fatty acid profiles of avocado fruit ( Persea americana Mill) cv. ‘Hass’ at harvest. South Afr. J. Bot. 2016, 104, 15–20. [Google Scholar] [CrossRef]
  12. Dávila, J.A.; Rosenberg, M.; Castro, E.; Cardona, C.A. A model biorefinery for avocado (Persea americana mill.) processing. Bioresour. Technol. 2017, 243, 17–29. [Google Scholar] [CrossRef] [PubMed]
  13. Araújo, R.G.; Rodriguez-Jasso, R.M.; Ruiz, H.A.; Pintado, M.M.E.; Aguilar, C.N. Avocado by-products: Nutritional and functional properties. Trends Food Sci. Technol. 2018, 80, 51–60. [Google Scholar] [CrossRef]
  14. Permal, R.; Chang, W.L.; Seale, B.; Hamid, N.; Kam, R. Converting industrial organic waste from the cold-pressed avocado oil production line into a potential food preservative. Food Chem. 2020, 306, 125635. [Google Scholar] [CrossRef]
  15. Rasouli, H.; Farzaei, M.H.; Khodarahmi, R. Polyphenols and their benefits: A review. Int. J. Food Prop. 2017, 20, 1–42. [Google Scholar] [CrossRef] [Green Version]
  16. Galanakis, C.M.; Galanakis, C. Recovery of high added-value components from food wastes: Conventional, emerging technologies and commercialized applications. Trends Food Sci. Technol. 2012, 26, 68–87. [Google Scholar] [CrossRef]
  17. Mandal, V.; Mohan, Y.; Hemalatha, S. Microwave assisted extraction—an innovative and promising extraction tool for medicinal plant research. Pharmacogn. Rev. 2007, 1, 7–18. [Google Scholar]
  18. Segovia, F.J.; Corral-Pérez, J.J.; Almajano, M.P. Avocado seed: Modeling extraction of bioactive compounds. Ind. Crop. Prod. 2016, 85, 213–220. [Google Scholar] [CrossRef]
  19. Carciochi, R.A.; D’Alessandro, L.G.; Vauchel, P.; Rodriguez, M.M.; Nolasco, S.M.; Dimitrov, K. Valorization of agrifood by-products by extracting valuable bioactive compounds using green processes. In Ingredients Extraction by Physicochemical Methods in Food; Grumezescu, A.M., Holban, A.M., Eds.; Academic Press: Amsterdam, The Netherlands, 2017; pp. 191–228. [Google Scholar]
  20. Sanchez-Aldana, D.; Aguilar, C.N.; Nevarez-Moorillon, G.V.; Esquivel, J.C.C. COMPARATIVE EXTRACTION OF PECTIC AND POLYPHENOLS FROM MEXICAN LIME POMACE AND BAGASSE. Am. J. Agric. Biol. Sci. 2013, 8, 309–322. [Google Scholar] [CrossRef] [Green Version]
  21. Veggi, P.C.; Martinez, J.; Meireles, M.A. Fundamentals of microwave extraction. In Microwave-assisted Extraction for Bioactive Compounds: Theory and Practice; Chemat, F., Cravotto, G., Eds.; Springer: Boston, MA, USA, 2012; pp. 15–52. [Google Scholar]
  22. Azmir, J.; Zaidul, I.; Rahman, M.; Sharif, K.; Mohamed, A.; Sahena, F.; Jahurul, M.; Ghafoor, K.; Norulaini, N.; Omar, A. Techniques for extraction of bioactive compounds from plant materials: A review. J. Food Eng. 2013, 117, 426–436. [Google Scholar] [CrossRef]
  23. Alupului, A.; Calinescu, I.; Lavric, V. Microwave extraction of active principles from medicinal plants. UPB Sci. Bull. B. 2012, 74, 129–142. [Google Scholar]
  24. Chan, C.-H.; Yusoff, R.; Ngoh, G.-C.; Kung, F.W.-L. Microwave-assisted extractions of active ingredients from plants. J. Chromatogr. A 2011, 1218, 6213–6225. [Google Scholar] [CrossRef] [PubMed]
  25. Xiao, X.-H.; Wang, J.-X.; Wang, G.; Wang, J.-Y.; Li, G.-K. Evaluation of vacuum microwave-assisted extraction technique for the extraction of antioxidants from plant samples. J. Chromatogr. A 2009, 1216, 8867–8873. [Google Scholar] [CrossRef]
  26. Box, G.E.P.; Wilson, K.B. On the Experimental Attainment of Optimum Conditions. J. R. Stat. Soc. Ser. B 1951, 13, 1–38. [Google Scholar] [CrossRef]
  27. Li, Y.; Zhu, C.-P.; Zhai, X.-C.; Zhang, Y.; Duan, Z.; Sun, J.-R. Optimization of enzyme assisted extraction of polysaccharides from pomegranate peel by response surface methodology and their anti-oxidant potential. Chin. Herb. Med. 2018, 10, 416–423. [Google Scholar] [CrossRef]
  28. Skenderidis, P.; Leontopoulos, S.; Petrotos, K.; Giavasis, I. Optimization of Vacuum Microwave-Assisted Extraction of Pomegranate Fruits Peels by the Evaluation of Extracts’ Phenolic Content and Antioxidant Activity. Foods 2020, 9, 1655. [Google Scholar] [CrossRef]
  29. Waterhouse, A.L. Determination of Total Phenolics. Curr. Protoc. Food Anal. Chem. 2002, 6, I1.1.1–I1.1.8. [Google Scholar] [CrossRef]
  30. Brand-Williams, W.; Cuvelier, M.; Berset, C. Use of a free radical method to evaluate antioxidant activity. LWT 1995, 28, 25–30. [Google Scholar] [CrossRef]
  31. Wang, Y.; Liu, Y.; Hu, Y. Optimization of polysaccharides extraction from Trametes robiniophila and its antioxidant activities. Carbohydr. Polym. 2014, 111, 324–332. [Google Scholar] [CrossRef]
  32. Eskilsson, C.S.; Björklund, E. Analytical-scale microwave-assisted extraction. J. Chromatogr. A 2000, 902, 227–250. [Google Scholar] [CrossRef]
  33. Calderón-Oliver, M.; Pedroza-Islas, R.; Escalona-Buendía, H.B.; Pedraza-Chaverri, J.; Ponce-Alquicira, E. Comparative study of the microencapsulation by complex coacervation of nisin in combination with an avocado antioxidant extract. Food Hydrocoll. 2017, 62, 49–57. [Google Scholar] [CrossRef]
  34. Maran, J.P.; Swathi, K.; Jeevitha, P.; Jayalakshmi, J.; Ashvini, G. Microwave-assisted extraction of pectic polysaccharide from waste mango peel. Carbohydr. Polym. 2015, 123, 67–71. [Google Scholar] [CrossRef]
  35. Calderón-Oliver, M.; Escalona-Buendía, H.B.; Medina-Campos, O.N.; Pedraza-Chaverri, J.; Pedroza-Islas, R.; Ponce-Alquicira, E. Optimization of the antioxidant and antimicrobial response of the combined effect of nisin and avocado byproducts. LWT 2016, 65, 46–52. [Google Scholar] [CrossRef]
  36. Khajeh, M.; Moghaddam, A.R.A.; Sanchooli, E. Application of Doehlert Design in the Optimization of Microwave-Assisted Extraction for Determination of Zinc and Copper in Cereal Samples Using FAAS. Food Anal. Methods 2009, 3, 133–137. [Google Scholar] [CrossRef]
  37. Li, J.; Zu, Y.-G.; Fu, Y.-J.; Yang, Y.-C.; Li, S.-M.; Li, Z.-N.; Wink, M. Optimization of microwave-assisted extraction of triterpene saponins from defatted residue of yellow horn (Xanthoceras sorbifolia Bunge.) kernel and evaluation of its antioxidant activity. Innov. Food Sci. Emerg. Technol. 2010, 11, 637–643. [Google Scholar] [CrossRef]
  38. Avhad, M.; Marchetti, J.M. Temperature and pretreatment effects on the drying of Hass avocado seeds. Biomass- Bioenergy 2015, 83, 467–473. [Google Scholar] [CrossRef]
  39. Morais, D.R.; Rotta, E.M.; Sargi, S.C.; Schmidt, E.M.; Bonafe, E.G.; Eberlin, M.N.; Sawaya, A.C.H.F.; Visentainer, J.V. Antioxidant activity, phenolics and UPLC–ESI(–)–MS of extracts from different tropical fruits parts and processed peels. Food Res. Int. 2015, 77, 392–399. [Google Scholar] [CrossRef]
  40. Mohammed, H.N.; Beeram, E.; Divya, B.J.; Pallavi, C.; Demir, H.; Demir, B.B.; Polley, T.; Ghosh, U.; Shiekuma, S.; Ukeyima, M.; et al. Current Research in Agricultural and Food Science Vol. 1; Mastanjević, K., Ed.; Book Publisher International: London, UK, 2020; Volume 1. [Google Scholar] [CrossRef]
  41. Chan, C.H.; Yeoh, H.K.; Yusoff, R.; Ngoh, G.C. A first-principles model for plant cell rupture in microwave-assisted extraction of bioactive compounds. J. Food Eng. 2016, 188, 98–107. [Google Scholar] [CrossRef]
  42. Kala, H.K.; Mehta, R.; Sen, K.K.; Tandey, R.; Mandal, V. Critical analysis of research trends and issues in microwave assisted extraction of phenolics: Have we really done enough. TrAC Trends Anal. Chem. 2016, 85, 140–152. [Google Scholar] [CrossRef]
  43. Trujillo-Mayol, I.; Céspedes-Acuña, C.; Silva, F.L.; Alarcón-Enos, J. Improvement of the polyphenol extraction from avocado peel by assisted ultrasound and microwaves. J. Food Process. Eng. 2019, 42, 13197. [Google Scholar] [CrossRef]
  44. Dahmoune, F.; Nayak, B.; Moussi, K.; Remini, H.; Madani, K. Optimization of microwave-assisted extraction of polyphenols from Myrtus communis L. leaves. Food Chem. 2015, 166, 585–595. [Google Scholar] [CrossRef]
  45. Weremfo, A.; Adulley, F.; Adarkwah-Yiadom, M. Simultaneous optimization of microwave-assisted extraction of phenolic compounds and antioxidant activity of avocado (Persea americana Mill.) seeds using response surface methodology. J. Anal. Methods Chem. 2020, 17. [Google Scholar] [CrossRef] [PubMed]
Figure 1. Response surface (3D) and (2D) contour plots presenting the interactions of the most significant extraction parameters based on operational costs for RTPC of avocado peel: (a) extraction temperature (A) and extraction time (B); (b) extraction temperature (A) and microwave power (C); (c) extraction time (B) and water to solid ratio (D); (d) extraction time (B) and microwave power (C); (e) microwave power (C) and water to solid ratio (D).
Sustainability 13 02166 g001
Figure 2. Response surface (3D) with (2D) contour plots presenting the interactions extraction parameters of avocado peel based on operational costs for the REEqVR IC50 DPPH: (a) extraction temperature (A) and microwave power (C); (b) extraction temperature (A) and water to solid ratio (D); (c) extraction time (B) and water to solid ratio (D); (d) microwave power (C) and water to solid ratio (D).
Sustainability 13 02166 g002
Figure 3. Response surface (3D) with (2D) contour plots presenting the interactions of the most significant extraction parameters of avocado seeds based on operational costs for RTPC: (a) extraction temperature (A) and extraction time (B); (b) extraction temperature (A) and microwave power (C); (c) extraction temperature (A) and water to solid ratio(D); (d) extraction time (B) and microwave power (C); (e) extraction time (B) and water to solid ratio (D).
Sustainability 13 02166 g003
Figure 4. Response surface (3D) with (2D) contour plots presenting the interactions of the most significant extraction parameters of avocado seeds based on operational costs for RTPC: (a) extraction temperature (A) and microwave power (C); (b) extraction temperature (A) and water to solid ratio (D); (c) microwave power (C) and water to solid ratio (D).
Sustainability 13 02166 g004
Table 1. Extraction parameters coded levels-groups of the independent extraction’ variables.
Independent Extraction’ VariablesCode UnitsCoded Variable Level
−101
TemperatureA40 °C 60 °C80 °C
TimeB10 min50 min90 min
PowerC2000 W4000 W6000 W
Ratio of water to avocado peels (AP) or seeds (AS)D10%25%40%
Table 2. Experimental and predicted values of the responses of total phenolic content (TPC) and extract equivalent volume (EEqV) IC50 of DPPH, for different operation parameters combinations based on the experimental design.
Design PointIndependent Variables in Coded ValuesAvocado Peel ResponsesAvocado Seed Responses
TPC (mgGAE/g fw)EEqV R IC50 DPPH (L)TPC (mgGAE/g fw)EEqV R IC50 DPPH (L)
ABCDMeasuredPredictedMeasuredPredictedMeasuredPredictedMeasuredPredicted
1−10106.573 ± 0.066.6981.613 ± 0.011.5164.354 ± 0.064.3541.040 ± 0.010.932
210013.283 ± 0.093.2830.584 ± 0.000.5841.383 ± 0.011.3832.775 ± 0.042.730
300006.602 ± 0.046.8351.163 ± 0.011.5552.021 ± 0.032.5171.720 ± 0.031.634
400−116.817 ± 0.036.8200.871 ± 0.000.8711.450 ± 0.021.4222.750 ± 0.042.750
500006.354 ± 0.016.8351.786 ± 0.021.5552.688 ± 0.042.5171.800 ± 0.021.634
6−10017.867 ± 0.027.8672.516 ± 0.012.5162.433 ± 0.082.4331.750 ± 0.031.985
700007.052 ± 0.046.8351.923 ± 0.021.5552.646 ± 0.082.5170.500 ± 0.021.634
800119.617 ± 0.069.2922.759 ± 0.032.7592.250 ± 0.012.2781.575 ± 0.021.575
901017.300 ± 0.047.3892.500 ± 0.012.5315.217 ± 0.045.2700.688 ± 0.020.443
10−11006.365 ± 0.026.2041.282 ± 0.041.4733.865 ± 0.033.9390.872 ± 0.020.881
11101010.104 ± 0.0810.2291.515 ± 0.021.6962.927 ± 0.012.9271.200 ± 0.051.254
120−10−14.833 ± 0.025.0650.667 ± 0.010.6351.979 ± 0.011.9253.500 ± 0.072.948
13−10−107.594 ± 0.017.7891.429 ± 0.041.3451.906 ± 0.021.9063.120 ± 0.083.132
1400007.469 ± 0.036.8351.256 ± 0.061.5552.344 ± 0.042.5172.000 ± 0.061.634
151−1007.458 ± 0.057.2980.633 ± 0.010.5981.479 ± 0.011.4052.400 ± 0.052.599
160−1−104.802 ± 0.044.4560.667 ± 0.020.7400.573 ± 0.020.7014.200 ± 0.084.225
17010−15.958 ± 0.016.0470.714 ± 0.020.7465.446 ± 0.055.5000.450 ± 0.010.812
1801−107.344 ± 0.027.2921.786 ± 0.041.7954.938 ± 0.064.8090.880 ± 0.030.669
1911007.281 ± 0.027.1211.799 ± 0.031.6535.604 ± 0.085.6790.800 ± 0.020.463
20−1−1002.573 ± 0.012.4130.427 ± 0.020.4181.573 ± 0.041.4983.400 ± 0.043.017
2101108.500 ± 0.068.6952.083 ± 0.051.9665.833 ± 0.035.7050.720 ± 0.020.629
22100−17.250 ± 0.047.2504.348 ± 0.064.3485.588 ± 0.065.5880.500 ± 0.010.455
2310−106.135 ± 0.026.3311.524 ± 0.021.5254.438 ± 0.044.4381.800 ± 0.051.974
240−1012.467 ± 0.032.6990.563 ± 0.010.5322.183 ± 0.072.1302.525 ± 0.042.579
250−1105.656 ± 0.045.8590.877 ± 0.050.9112.969 ± 0.053.0971.200 ± 0.071.345
2600006.698 ± 0.076.8351.645 ± 0.031.5552.885 ± 0.042.5171.640 ± 0.051.634
2700−1−16.379 ± 0.036.3835.556 ± 0.075.5562.542 ± 0.062.5703.900 ± 0.043.900
28−100−11.863 ± 0.011.8630.513 ± 0.010.5132.983 ± 0.072.9831.800 ± 0.012.035
29001−17.042 ± 0.026.7176.667 ± 0.066.6673.454 ± 0.053.4261.000 ± 0.031.000
Measured values are medians of three repetitions ± standard deviation.
Table 3. The variables of the models and their significance after analysis of variance (ANOVA), for avocado peel’s experimental results.
Avocado PeelAvocado Peel
TPC
(mg GAE/g fw)
EEqV R
IC50 DPPH (L)
Ratio TPC
(mg GAE/g fw)/min
Ratio EEqV R
IC50 DPPH (L)/min
p Value p Value p Value p Value
Model<0.0001 *Model<0.0001 *Model<0.0001 *Model<0.0001 *
Variablesp ValueVariablesp ValueVariablesp ValueVariablesp Value
A0.0318 *A-TEMP.0.2881A-TEMP.0.0133A-TEMP.0.1446
B<0.0001 *B-TIME<0.0001 *B-TIME<0.0001 *B-TIME0.0039 *
C0.0002 *C-POWER0.3122C-POWER0.0001 *C-POWER0.2036
D0.2409D-RATIO0.0036 *D-RATIO0.0132 *D-RATIO0.1519
AB0.0009 *AD<0.0001 *AB<0.0001 *AC0.7236
AC0.0002 *BD0.0016 *AC<0.0001 *AD<0.0001 *
AD<0.0001 *CD0.1169AD<0.0001 *BD0.0316 *
BD0.0014 *0.1413BC0.0490 *CD0.1801
CD0.0279 *0.0103 *BD<0.0001 *0.2709
0.78790.2281CD0.0103 *0.0030*
<0.0001 *0.5418<0.0001 *0.0128 *
0.0006 *A²D0.0002 *0.0019 *0.0590 *
0.073AD²0.0185 *<0.0001 *A²C0.4777
A²B0.0698C²D<0.0001 *AB²<0.0001 *A²D0.0084 *
A²D0.0264 *CD²0.0006 *B²D<0.0001 *AC²0.2850
AB²0.0103 *A²D²0.0097 *BD²<0.0001 *AD²0.1980
AD²0.3003C²D²<0.0001 *C²D0.3247C²D<0.0001 *
C²D0.0068 * CD²0.5370CD²0.0162 *
A²D²0.003 * C²D²0.0001 *A²C²0.0189 *
C²D²0.0004 *
Lack of fitting0.6055
Not
significant
0.9780
Not
significant
0.9214
Not
significant
0.8839
Not
Significant
R20.98570.9906 0.9974 0.99
Adj. R20.95550.9761 0.9918 0.9649
* p < 0.05 was considered to be statistically significant A; Extraction temperature (°C), B: Extraction time (min), C: Microwave power (W), D: Ratio of water to avocado by-product (%).
Table 4. The models’ variables and their significance after analysis of variance (ANOVA) for avocado seeds’ experimental results.
Avocado SeedAvocado Seed
TPC
(mg GAE/g fw)
EEqV R
IC50 DPPH (L)
Ratio TPC
(mg GAE/g fw)/min
Ratio EEqV R
IC50 DPPH (L)/min
p Value p Value p Value p Value
Model<0.0001 *Model<0.0001 *Model<0.0009 *Model<0.0001 *
Variablesp ValueVariablesp ValueVariablesp ValueVariablesp Value
A0.0227 *A0.1220A0.0507A0.8792
B<0.0001 *B<0.0001 *B0.0009 *B0.8098
C0.0192 *C0.0004 *C0.0371 *C0.1483
D0.0048 *D0.4145D0.0129 *D0.9703
AB0.0143 *AC0.1145AB0.0816AC0.0037 *
AC0.0002 *AD0.0197 *AC0.0013 *AD0.0031 *
AD0.0003 *BC0.0064 *AD0.0018 *CD<0.0001 *
BC0.0329 *CD0.0703BC0.0002 *0.1139
BD0.46890.5569BD0.31830.0024 *
0.0256 *0.70350.09640.1839
<0.0001 *0.7781<0.0001 *0.6190
0.4497A²D0.0324 *0.1660A²C0.0230 *
0.9014C²D0.89750.3659A²D0.0255 *
A²C0.3652CD²0.3007A²B0.0544 *AC²0.0174 *
A²D0.0180 *C²D²0.1615A²C0.4081C²D0.0011 *
AC²0.5203 A²D0.0353 *CD²<0.0001 *
AD²0.9120 AB²0.4393C²D²0.0003 *
B²C0.0891 AC²0.6226
B²D0.0252 * B²C0.0020 *
A²C²0.0009 * B²D0.0260 *
A²D²0.0055 * BC²0.1076
BD²-
A²B²0.0111 *
A²C²0.0704
B²C²-
Lack of fitting0.8247
Not
significant
0.9155
Not
significant
0.8760
Not
significant
0.9542
Not
significant
R20.9909 0.9234 0.9919 0.9773
Adj. R20.9636 0.8350 0.9545 0.9423
* p < 0.05 was considered to be statistically significant A; Extraction temperature (°C), B: Extraction time (min), C: Microwave power (W), D: Ratio of water to avocado by-product (%).
Table 5. Prediction equations for each response derived from the application of multiple regression analysis on experimental data using the Design Expert v12 software package.
TPCEEqV R IC50 DPPHRATIO TPCRATIO EEqV R IC50 DPPH
APASAPASAPASAPAS
= +6.84 = +2.52 = +0.106 +1.63 = +1.55 +0.0387 = +0.024 +150.87
+0.5182A+0.4115A+0.0055A−0.2089A+0.0900A+0.0060A+0.0033A+2.66A
+1.42B+1.68B−0.0673B−1.07B+0.5275B−0.0162B−0.0047B+3.44B
+0.7017C+0.4281C+0.0113C−0.7300C+0.0854C+0.0066C+0.0028C−37.59C
−0.2562D−0.5740D+0.0078D−0.1844D+0.4206D−0.0088D+0.0032D−0.9210D
−0.9922AB+0.4583AB−0.0467AB+0.3700AC−1.44AD+0.0051AB−0.0007AC+88.66AC
+1.25AC−0.9896AC+0.0192AC+0.5813AD+0.4723BD−0.0152AC−0.0222AD+91.17AD
−2.49AD−0.9135AD−0.0383AD+0.7100BC+0.1940CD−0.0141AD+0.0053BD+185.00CD
+0.9271BD−0.3750BC−0.0058BC+0.4313CD−0.1761−0.0218BC+0.0030CD+34.74
+0.5344CD−0.1083BD+0.0269BD+0.1057−0.3432−0.0026BD+0.0023−79.16
+0.0551−0.5583+0.0082CD+0.0828+0.1419+0.0067−0.0083+33.42
−1.13+1.17+0.0266+0.0612−0.1003+0.0260+0.0091+12.06
+0.8718−0.1104+0.0107+0.7406A²D−0.8609A²D−0.0037+0.0044−90.29A²C
−0.4037+0.0177−0.0277+0.0406C²D+0.3858AD²+0.0023−0.0021A²C+88.29A²D
−0.5143A²B−0.1937A²C+0.0455AB²−0.2888CD²−2.57C²D+0.0083A²B−0.0100A²D−82.80AC²
+0.7656A²D−0.6146A²D−0.0283B²D+0.5279C²D²+0.6642CD²−0.0030A²C−0.0033AC²−150.58C²D
+0.9323AB²−0.1354AC²+0.0259BD² +0.7120A²D²−0.0095A²D+0.0040AD²−266.26CD²
−0.3172AD²−0.0229AD²+0.0038C²D +2.37C²D²−0.0028AB²−0.0363C²D+221.75C²D²
+1.01C²D+0.3948B²C+0.0020CD² −0.0017AC²+0.0087CD²
−1.42A²D²+0.5677B²D+0.0262C²D² +0.0195B²C−0.0119A²C²
+1.56A²C² +0.0103B²D+0.0236C²D²
+1.12A²D² +0.0065BC²
A, B, C and D are the coded extraction parameters: A: Extraction temperature (°C); B: Extraction time (min); C: Microwave power (W); D: Ratio of water to avocado by-product (%).
Table 6. Predicted responses values at the optimum conditions for rate of total phenolic content (RTPC) and the rate of Extract Equivalent Volume (EEqV) at Reference IC50 of DPPH radical scavenging activity equal to 100 mg/L (REEqV RIC50DPPH).
Independent Variables
ABCDRTPC (mg GAE/g fw)/minREEqV RIC50 DPPH L/min
AP79.6411.895708.0416.450.352
AP78.1111.755699.1010.02 0.104
AS43.9010.185549.0838.730.124
AS45.2610.284797,2937.65 0.045
A: Extraction temperature (°C); B: Extraction time (min); C: Microwave power (W); D: Ratio of water to avocado by-product (%).
Publisher’s Note: MDPI stays neutral with regard to jurisdictional claims in published maps and institutional affiliations.

