Article

Quality Evaluation of Winery By-Products from Ionian Islands Grape Varieties in the Concept of Circular Bioeconomy

by
Marinos Xagoraris
1,
Ioanna Oikonomou
1,
Dimitra Daferera
1,
Charalambos Kanakis
1,
Iliada K. Lappa
2,
Charilaos Giotis
2,
Christos S. Pappas
1,
Petros A. Tarantilis
1 and
Efstathia Skotti
2,*
1
Laboratory of Chemistry, Department of Food Science and Human Nutrition, Agricultural University of Athens, 75 Iera Odos, 11855 Athens, Greece
2
Department of Food Science and Technology, Ionian University, Terma Leoforou Vergoti, 28100 Argostoli, Cephalonia, Greece
*
Author to whom correspondence should be addressed.
Sustainability 2021, 13(10), 5454; https://doi.org/10.3390/su13105454
Submission received: 27 March 2021 / Revised: 11 May 2021 / Accepted: 12 May 2021 / Published: 13 May 2021

Abstract

:
The aim of this work was the study and evaluation of winery by-products in the framework of the circular bioeconomy. Grape seeds and grape skins from Greek Ionian Islands varieties were analyzed in an attempt to provide the appropriate basis for model development of their sustainable exploitation at a local or regional level. The by-products were collected directly from the wineries immediately after the vinification process and were analyzed by chromatographic and spectroscopic techniques. In addition, annual production and yields were estimated. Grape seed oil quality was evaluated based on fatty acid methyl ester (FAME) composition. The grape skins’ phenolic fraction was extracted by an eco-friendly, nontoxic water-glycerol solvent system and was detected qualitatively. In addition, total phenolic content (TPC) and antioxidant activity (ABTS, DPPH) were measured. Based on estimated yields, our results demonstrate that winery by-products have the potential to promote the cyclical bioeconomy in a modern economic growth model that will reduce by-products and environmental costs as they can be reused as whole material in foods, dietary supplements, cosmetic ingredients, food colorants, and preservatives.

1. Introduction

Grapes are one of the world’s largest fruit crops, with over 75 million tons grown annually, primarily as Vitis vinifera L. for wine production. According to Food and Agriculture Organization (FAO) statistics, wine production is substantial for the Greek economy, ranking as the country’s second most profitable industry after olives in 2015 and 2016. [1]. Approximately 35.9 million tons of industry by-products arise from wine, while the rest arise from grape juice processing [2]. The Ionian Islands produced 1179.25 tons of wine grapes in 2017, according to the Ministry of Rural Development and Food, generating 175.12 tons of grape pomace [3]. All these by-products could acquire greater potential value if they are valorized properly.
The wine industry generates a significant amount of solid waste, which is primarily disposed of in the environment, causing economic and environmental problems [4,5]. Winery by-product wastes are produced continuously throughout the year and may be hazardous to the environment [6]. By-products are typically characterized by high levels of chemical oxygen demand (COD) and biodegradability [7]. Specifically, grape pomace consists mainly of grape seeds and skins and they remain after pressing and the fermentation during vinification processes.
Grape seeds are a valuable source of oily constituents like sterols, triglycerides, and fatty acids. Polyunsaturated and monounsaturated fatty acids (PUFAs and MUFAs) are abundant in grape seed oils, with PUFAs accounting for the majority of fatty acids. The yield of oil can range from 5.85 to 22.4 percent (w/w), and it is dependent on the cultivar, variety, and year-to-year variations in extraction methods [8,9,10]. Grape skins are characterized by high-phenolic contents. The phenolic composition of grapes varies depending on grape variety and vinification conditions. The major phenolic compounds are anthocyanins, catechins, flavonol glycosides, phenolic acids, and stilbenes [11]. These compounds are responsible for some of the most essential wine characteristics while also acting as antioxidants. [12]. Many studies have evaluated the methods for the valorization of winery by-products. Antioxidant and health-promoting practices were the subject of these studies [4]. Phenolic compounds react to the free radicals and neutralize them with beneficial anti-inflammatory, cardioprotective, and anticarcinogenic effects [13]. The extraction of phenolic compounds from by-products can be done with many organic solvents such as methanol, ethanol, acetone, and ethyl acetate [12].
In general, islands are sensitive systems compared to the mainland. This is due to a variety of factors such as their small size, peculiar environment, unique climate, and relative isolation from the mainland. The small size, in terms of area and population, implies a limited variety and quantity of natural resources as well as fewer opportunities for large-scale productive activities. Furthermore, the distance from the urban centers combined with the traffic difficulties caused by the sea has a substantial impact on the degree of isolation. As a result of these characteristics, vulnerable environments with unpredictable environmental factors and minimal development capacity have emerged. A circular economy approach could contribute positively to the solution of the insularity problem. Materials and products must be reused, repaired, renewed, and recycled as part of the transition to a cyclical bioeconomy. Materials which were considered “by-products” can be turned into raw materials. Strengthening collaboration across the supply chain will help eliminate costs, waste, and environmental impact. Developments in environmental innovation ensure new products, processes, technologies, and organizational structure.
Valorization of a by-products’ biomass for the recovery of phytochemicals should include processes that generate far less or even zero further by-products. Otherwise, no concept of “green” or “sustainable” could be substantiated. As a result, research should focus on the discovery and design of extraction processes that allow for the use of alternative solvents and sustainable natural resources while still ensuring a healthy and high-quality extract/product. [14]. Glycerol is a bio-liquid considered a by-product of the biodiesel industry and simultaneously has not been used widely for extraction purposes. In addition, it constitutes a green and well-established sustainable solvent [15,16]. Utilization of grape pomace as a whole product or combination with green solvents to extract bioactive compounds can be used in the food and cosmetic industry resulting in high added-value end products [17,18,19].
The aim of this research was to find a cost-effective solution for managing winery by-products while also supporting the circular bioeconomy. A quality analysis of grape pomace was conducted for this reason. Nontoxic, environmentally friendly solvents were used to extract the extracts, and the fractions were tested for antioxidant activity. For this purpose, traditional grape varieties of the Ionian Islands were selected. Finally, it should be highlighted that analyses were based on by-products just as they were taken from the wineries to provide a realistic view and the promotion of the cyclical bioeconomy. This research will also serve as a valuable contribution to a deeper investigation of the understudied topic of sustainable waste management of agricultural by-products in the Ionian Islands.

2. Materials and Methods

2.1. Chemicals

All the solvents used were extra purity (>99.5%) including water, glycerol and n-hexane, cyclohexane, and methanol. Phenolic standards with a purity of 98–99% (cinnamic acid, gallic acid, caftaric acid, catechin and epicatechin, epicatechin gallate, rutin, quercetin, kaempferol-3-glucoside, p-coumaric acid, and isorharmentin-3-glucoside) were purchased from Aldrich (Steinheim, Germany) and used for identification in MS. Folin–Ciocalteu reagent was used for TPC measurement, as well as caffeic acid. 2,2-diphenyl-1-picrylhydrazyl (DPPH) and 2,2’-azino-bis-(3-ethylbenzothiazoline-6-sulphonic acid) (ABTS), which were used for the free radicals preparation tests, as well as Trolox.
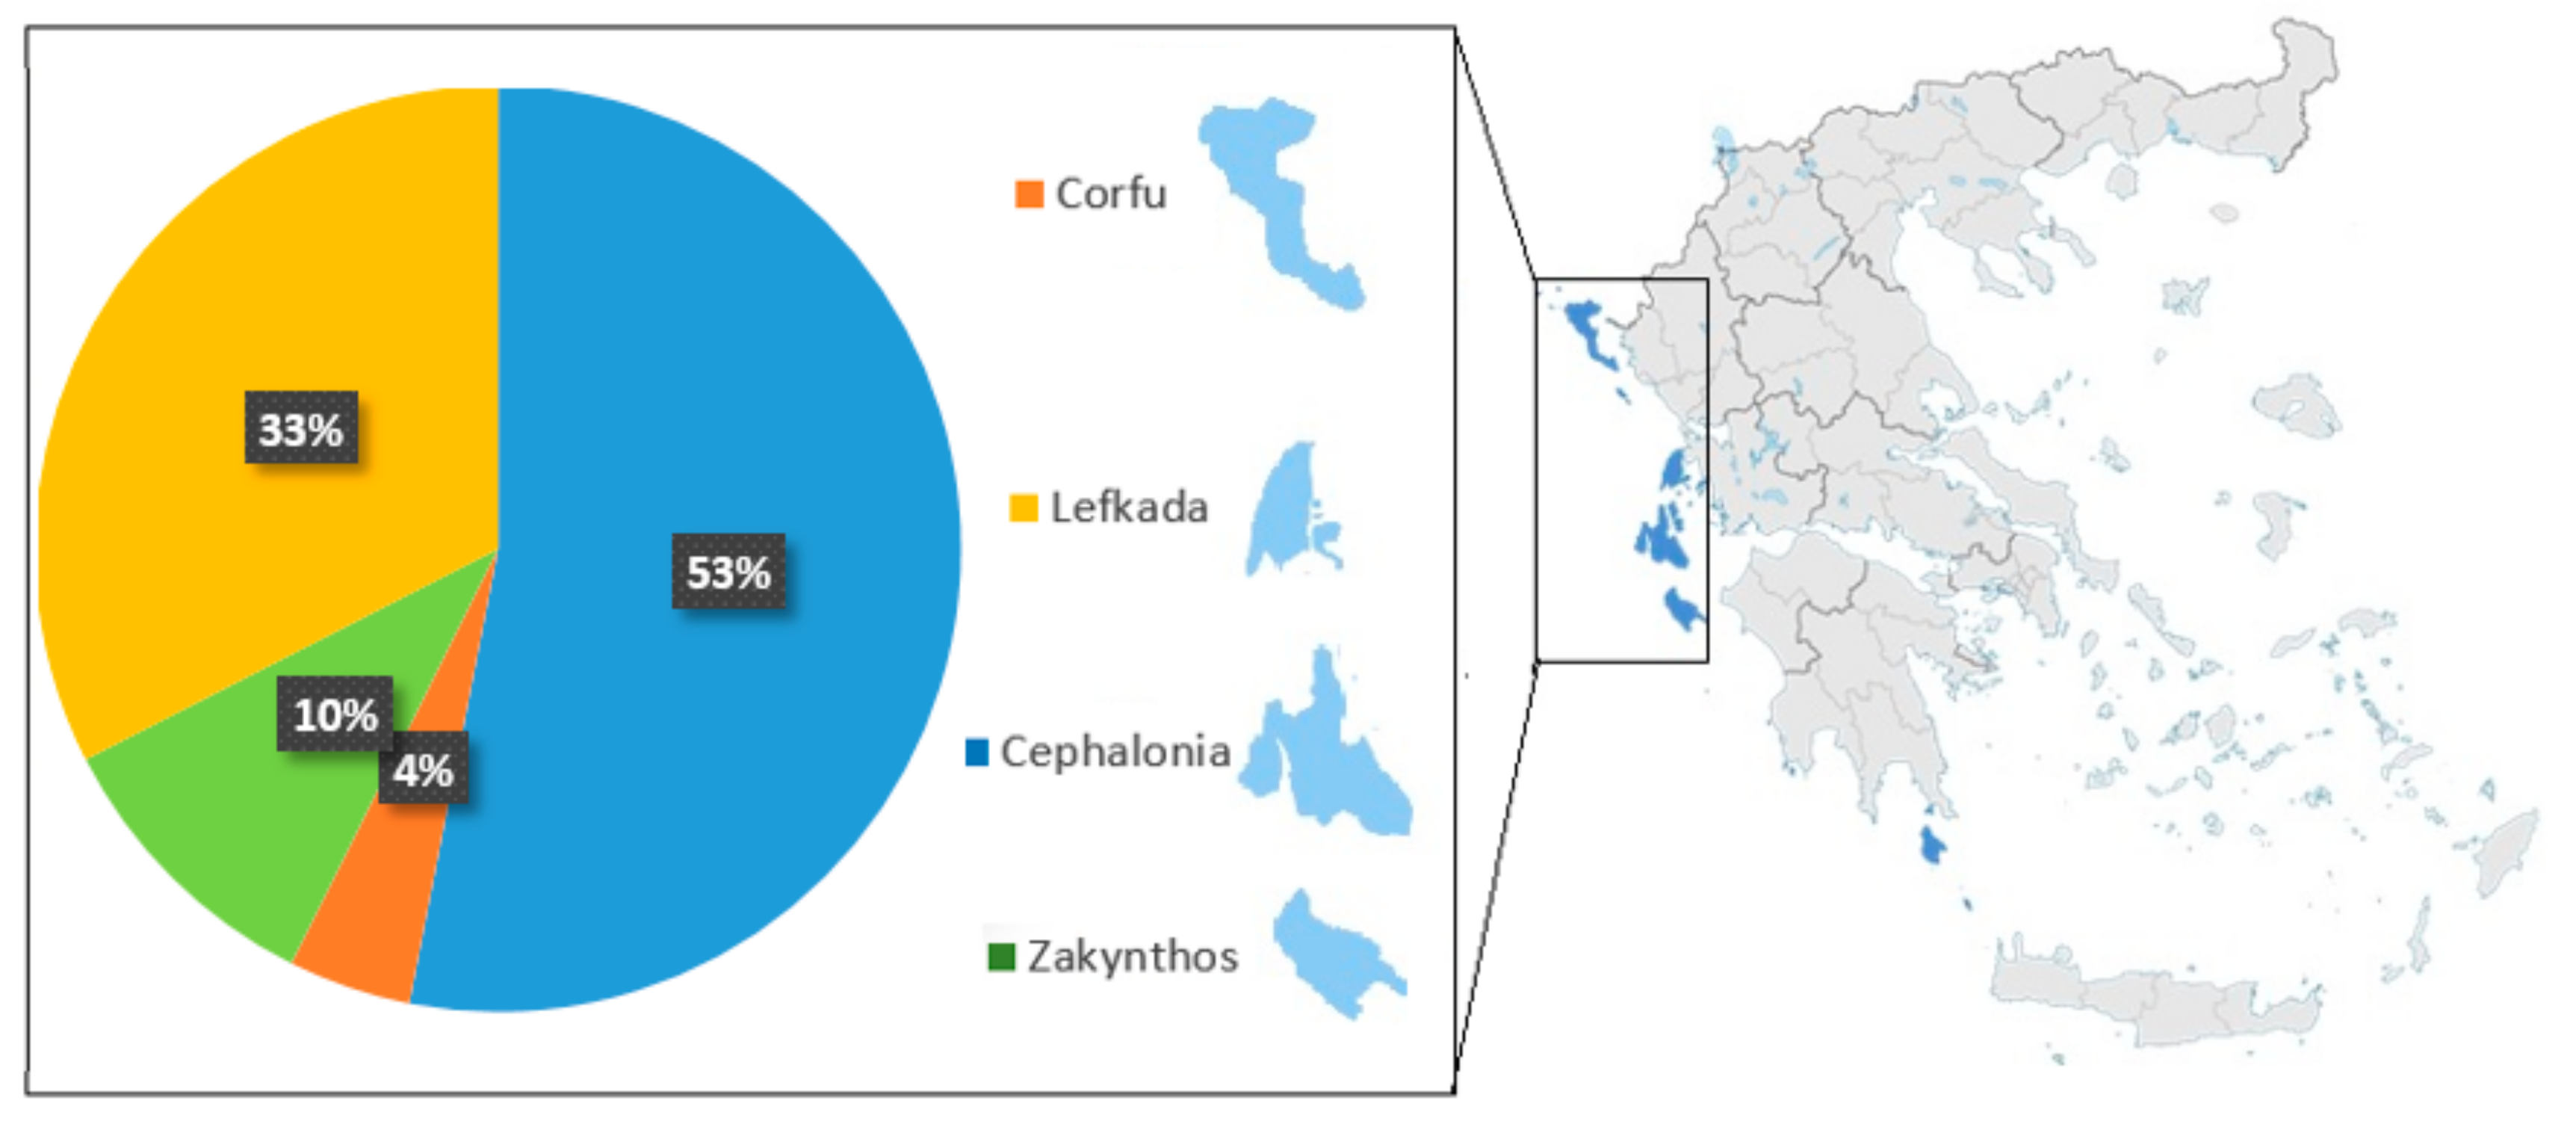
2.2. Plant Material

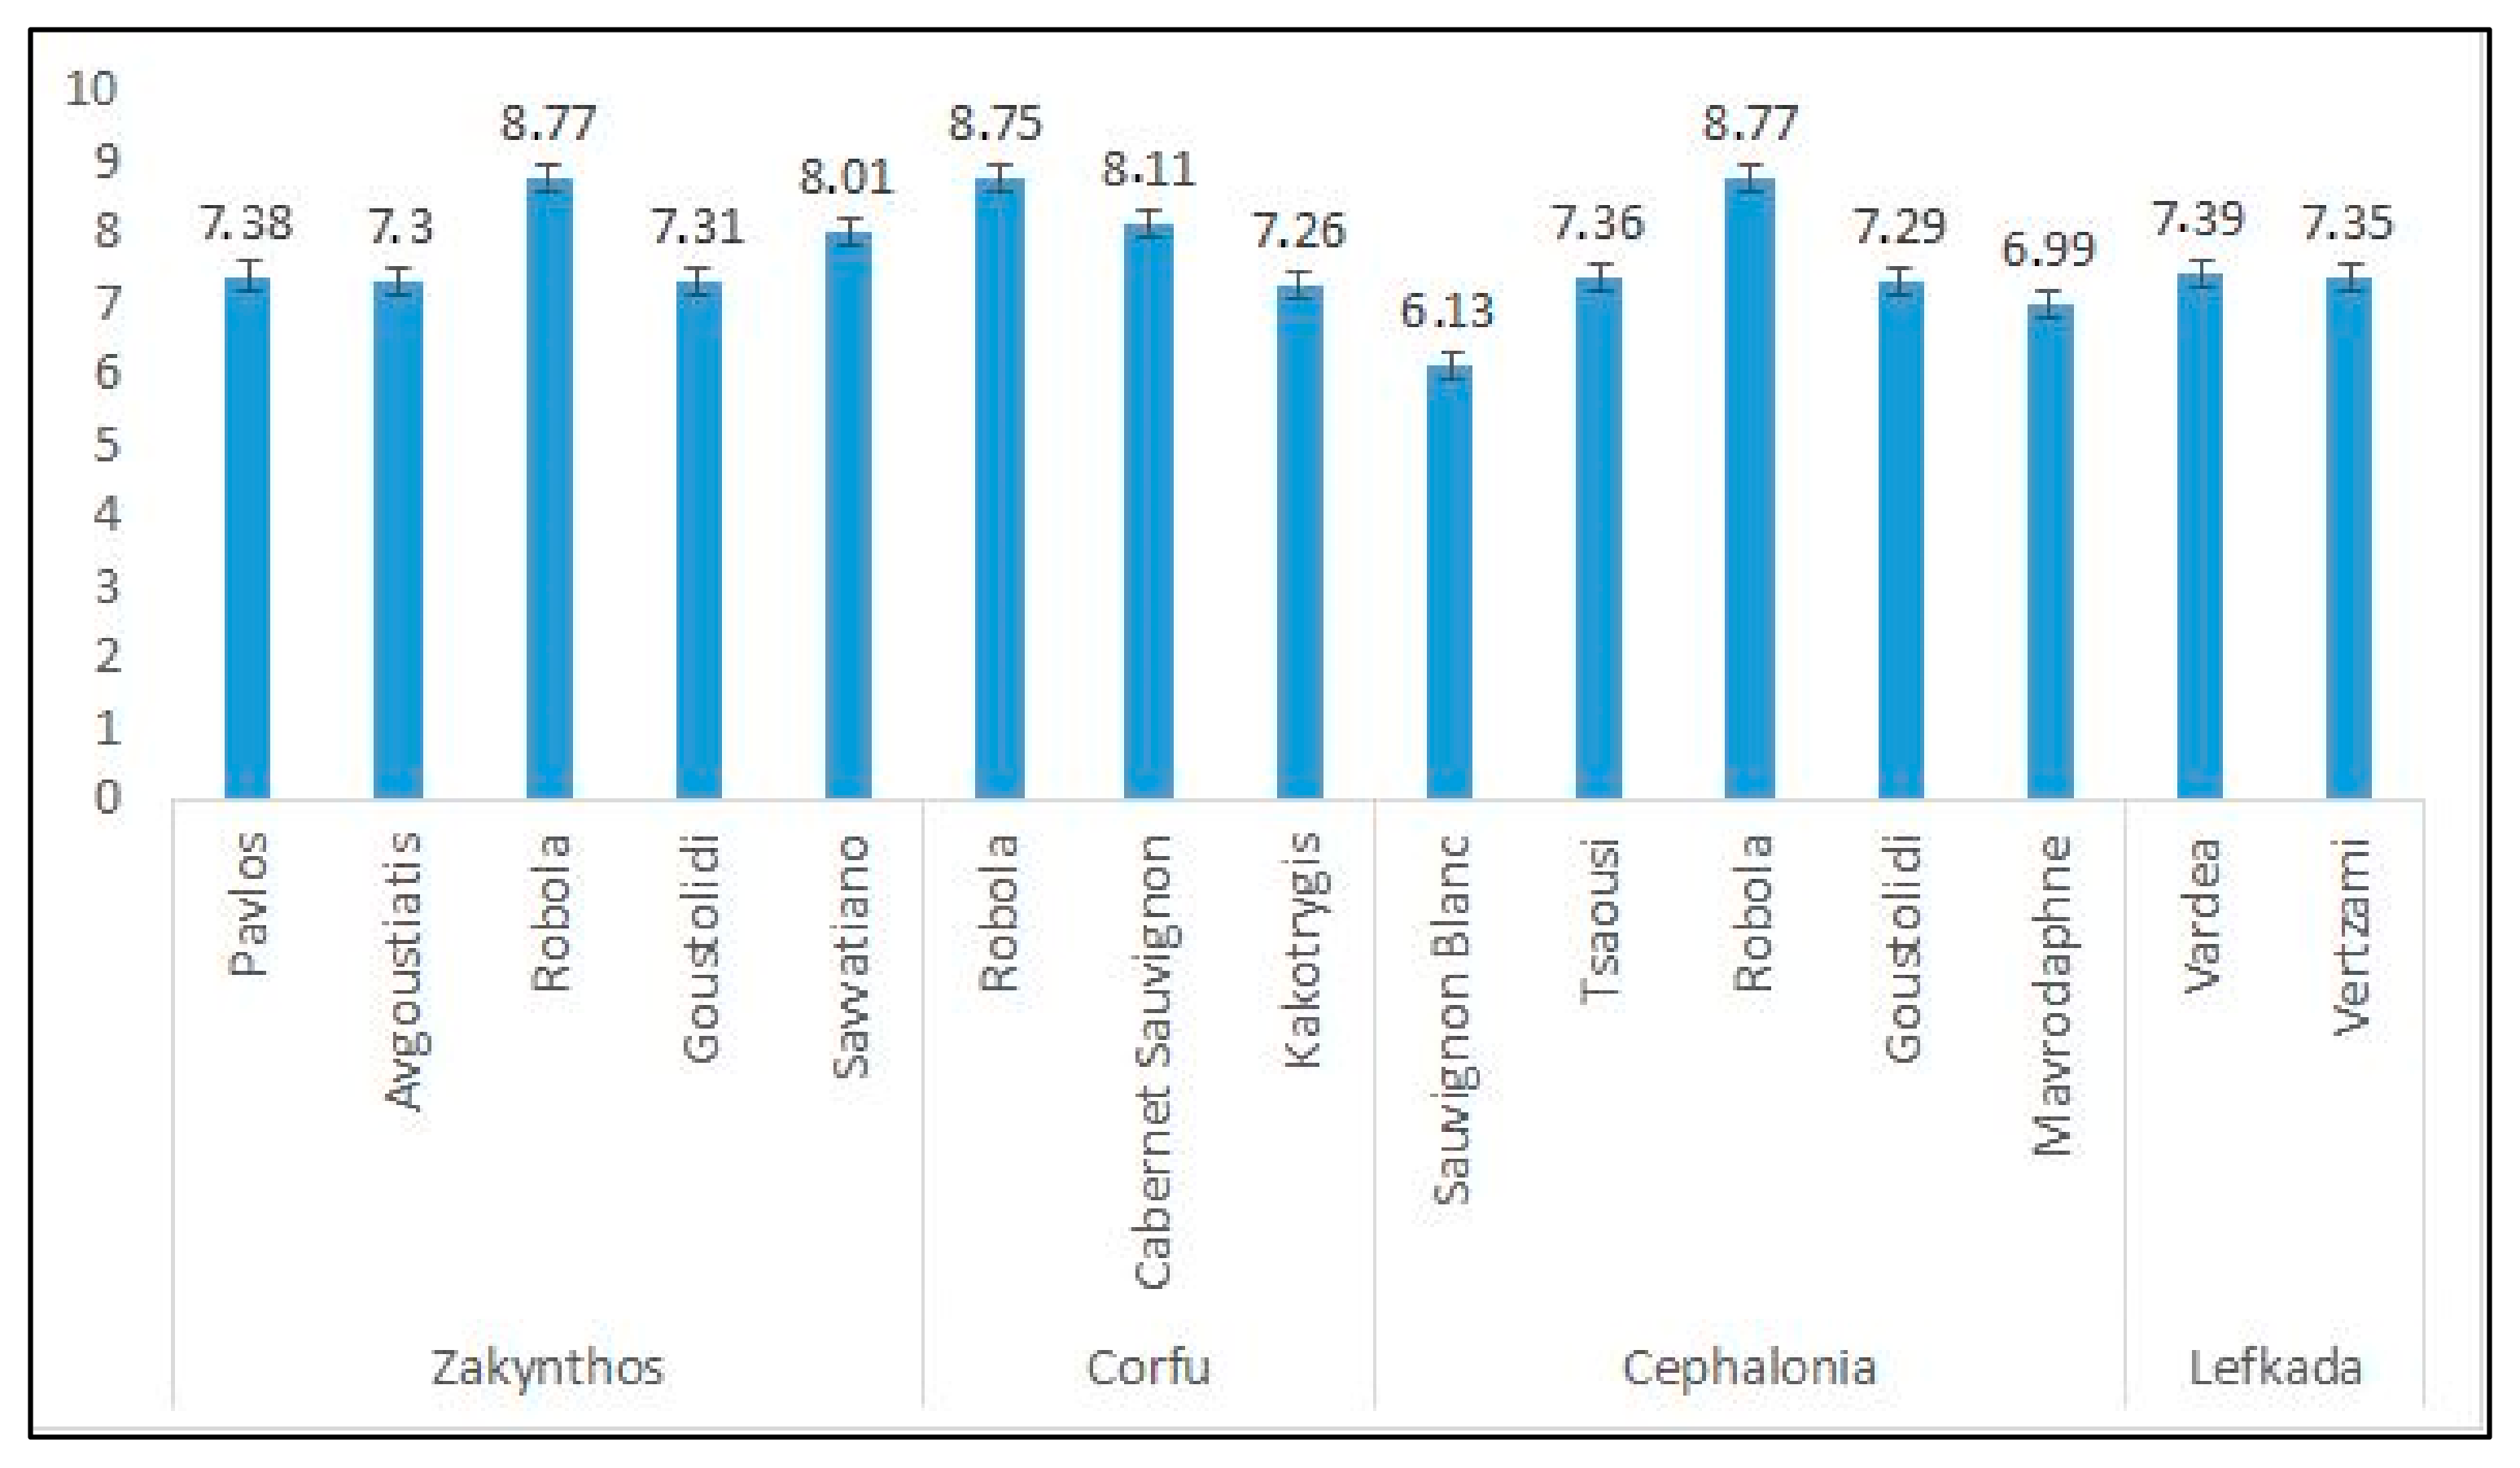
Winery by-products were provided by Gentillini Winery and Vineyards, the Robola Cooperative of Cephalonia, Ktima Grampsa, Ktima Theotoki, and Robotis wineries. Thirty-six samples were analyzed and some of them came from the PDO Robola in Cephalonia. The rest of them were varieties from Pavlos, Avgoustiatis, Robola, Goustolidi, Savvatiano, Cabernet Sauvignon, Kakotrygis, Sauvignon Blanc, Tsaousi, Mavrodaphne, Vardea, and Vertzami.

2.3. Moisture Removal

The initial moisture of crude grape pomace was estimated and expressed in % (w/w). The average moisture was estimated at 73%. The drying process of samples was then carried out in dark on large non-absorbent surfaces at 35 °C assisted by airflow until a final moisture content of 13% was achieved. The duration of the drying process was two days on average and followed by the separation of grape seeds from the skins using a series of sieves. Ratio of skins to seeds for every sample were also specified. Seeds and skins of each sample were sealed in polypropylene bags and stored at −20 °C until their usage.

2.4. Oil Extraction from Grape Seeds

Grape seeds were powdered with a mixer (Philips HR 2074, N.V., Amsterdam, The Netherlands) for 20 s. The crushed grape seed powder was continuously extracted with n-hexane in a soxhlet apparatus at 70 °C for 6 h. The analogy of crushed seeds to n-hexane was 1 to 10 (w/v). Then, the n-hexane fraction was evaporated to dryness under reduced pressure at 35 °C and residuals removed under nitrogen flow.

2.5. Phenolic Extraction from Grape Skins

The extraction of the phenolic compounds was performed using the solid-liquid extraction technique. Before extraction, grape skins were powdered with a mixer (Philips HR 2074, N.V., Amsterdam, The Netherlands) for 2 min with 15 s rest periods to avoid overheating. A defatting process was performed using 1:10 (w/v) n-hexane [12]. Then, defatted samples were extracted with a solvent mixture of water:glycerol (80:20 v/v) at 600 rpm for 60 min at room temperature (25 °C). All processes were done in triplicate and fractions were filtered through a 0.45 μm filter and stored at −20 °C until further analysis.

2.6. Determination of Total Phenolic Content

TPC was estimated using the Folin–Ciocalteu reagent [20]. In the case of grape seed oil, 0.1 mL oil was diluted with deionized water to 5 mL in a 10 mL volumetric flask and the addition of 0.5 mL Folin–Ciocalteu reagent. After 3 min, 1 mL of saturated (Na2CO3 20% w/v) solution was added. The content was mixed and diluted to volume with water and after 1 h measured at 765 nm.
In the case of the grape skin extract, in well plated, 1.5 mL of deionized water, 25 μL of the sample, and 125 μL of Folin–Ciocalteu reagent were added and stirred well. At the end of 3 min we added 375 μL of sodium carbonate solution and 475 μL of deionized water. After 2 h it was measured at 765 nm.
The TPC concentration (CTPC) was calculated and expressed as mg gallic acid equivalents per mL extract (mg GAE mL−1) (y = 0.0012x + 0.012; R2 = 0.9967; Figure S1). TPC yield (YTPC) was calculated as mg gallic acid equivalents per g of dry weight (mg GAE g−1), using the following equation:
Y T P C mg   gallic   acid g   dry   weight = C T P C × V m
where (V) is the volume of the extraction and (m) the dry weight of plant material (g).

2.7. Antioxidant Activity of Grape Seed Oils and Grape Skin Extracts

Antioxidant activity was estimated using DPPH and ABTS assays and AAR was also calculated [21,22,23,24,25]. Grape seed oil was diluted in ethyl acetate (1:10) and 1 mL of the solution was added to 4 mL of DPPH solution (0.08 mM). Instead of oil, the control was made with ethyl acetate. After 30 min in the dark, the absorbance was measured at 515 nm. In the case of grape skin extract, 3 mL of DPPH solution were added to 30 μL of each sample. The solutions were vortexed and kept at room temperature in the dark for 30 min. Absorbance was measured in 515 nm as well. AAR was calculated as described above [24] and is shown in Equation (3).
The ABTS was prepared by the reaction of 25 mL of ABTS solution (7 mM) with 440 μL of potassium persulfate (140 mM). The solution was left at room temperature for 16–18 h. The solution was then diluted with ethanol to obtain an absorbance of 0.7 ± 0.2 at 734 nm. A total of 100 μL of each grape seed oil was mixed with 2 mL of ABTS, and the absorbance was measured after 6 min at 734 nm. Additionally, 30 μL of each grape skin extract was mixed with 3 mL of ABTS, and the absorbance was measured after 6 min at 734 nm as well.
All measurements were expressed as mg Trolox equivalents g−1 dry weight (DPPH: y = 11.554x − 2.3777; R2 = 0.9947; Figure S2) (ABTS: y = 18.248 + 1.4155; R2 = 0.9907; Figure S3). Furthermore, AAR was calculated as previously described and is shown in Equation (3). AAR is expressed as μmol of DPPH g−1 of dry weight. The percentage of inhibition was calculated according to the following formula:
D P P H   I n h i b i t i o n   % = A blank A sample A blank × 100
A A R   μ m o l   D P P H / g   d w = C D P P H C T P C × 1 A 515   f A 515   i × Y T P C
where CDPPH is the initial molar concentration of DPPH (μmol L−1), A515(f) is the sample’s absorbance, and A515(i) is the absorbance of the blank sample.

2.8. Analysis of FAMEs in Grape Seed Oils by GC-MS

The analysis of FAMEs was performed using a Trace Ultra gas chromatograph (GC) (Thermo Scientific Inc., Waltham, MA, USA), coupled to a mass spectrometer (MS) (DSQII, Thermo Scientific Inc., Waltham, MA, USA). The column used was a TR-5MS (30 m × 0.25 mm i.d., 0.25 μm film thickness) and the carrier gas was helium, at a 1 mL min−1 rate. The analysis was performed according to the literature [9] with some modifications. The oven temperature was adapted to 110 °C and then was increased at 205 °C at a rate of 4 °C min−1, followed by an increment of 1 °C min−1 up to 215 °C and, up to 250 °C with a step of 4 °C min−1. Finally, the temperature of 250 °C was kept constant for 15 min. The transfer line and injector temperatures were maintained at 260 and 220 °C, respectively. The injection volume was 1 μL in a split-less mode. The peak identification was carried out with the Wiley 275 mass spectra library, its mass-spectral data, and arithmetic index provided by Adams 0.7 HP.

2.9. Spectroscopic Indices (K232, K268, K270, ΔK)

K232, K268, and K270 extinction coefficients were measured from the absorption of the samples in the UV region at 232, 268, and 270 nm respectively, with a UV-Vis (Cary 60, Agilent spectrophotometer). The samples were prepared according to ISO 3656:2011.

2.10. HPLC-DAD and LC-MS Analysis

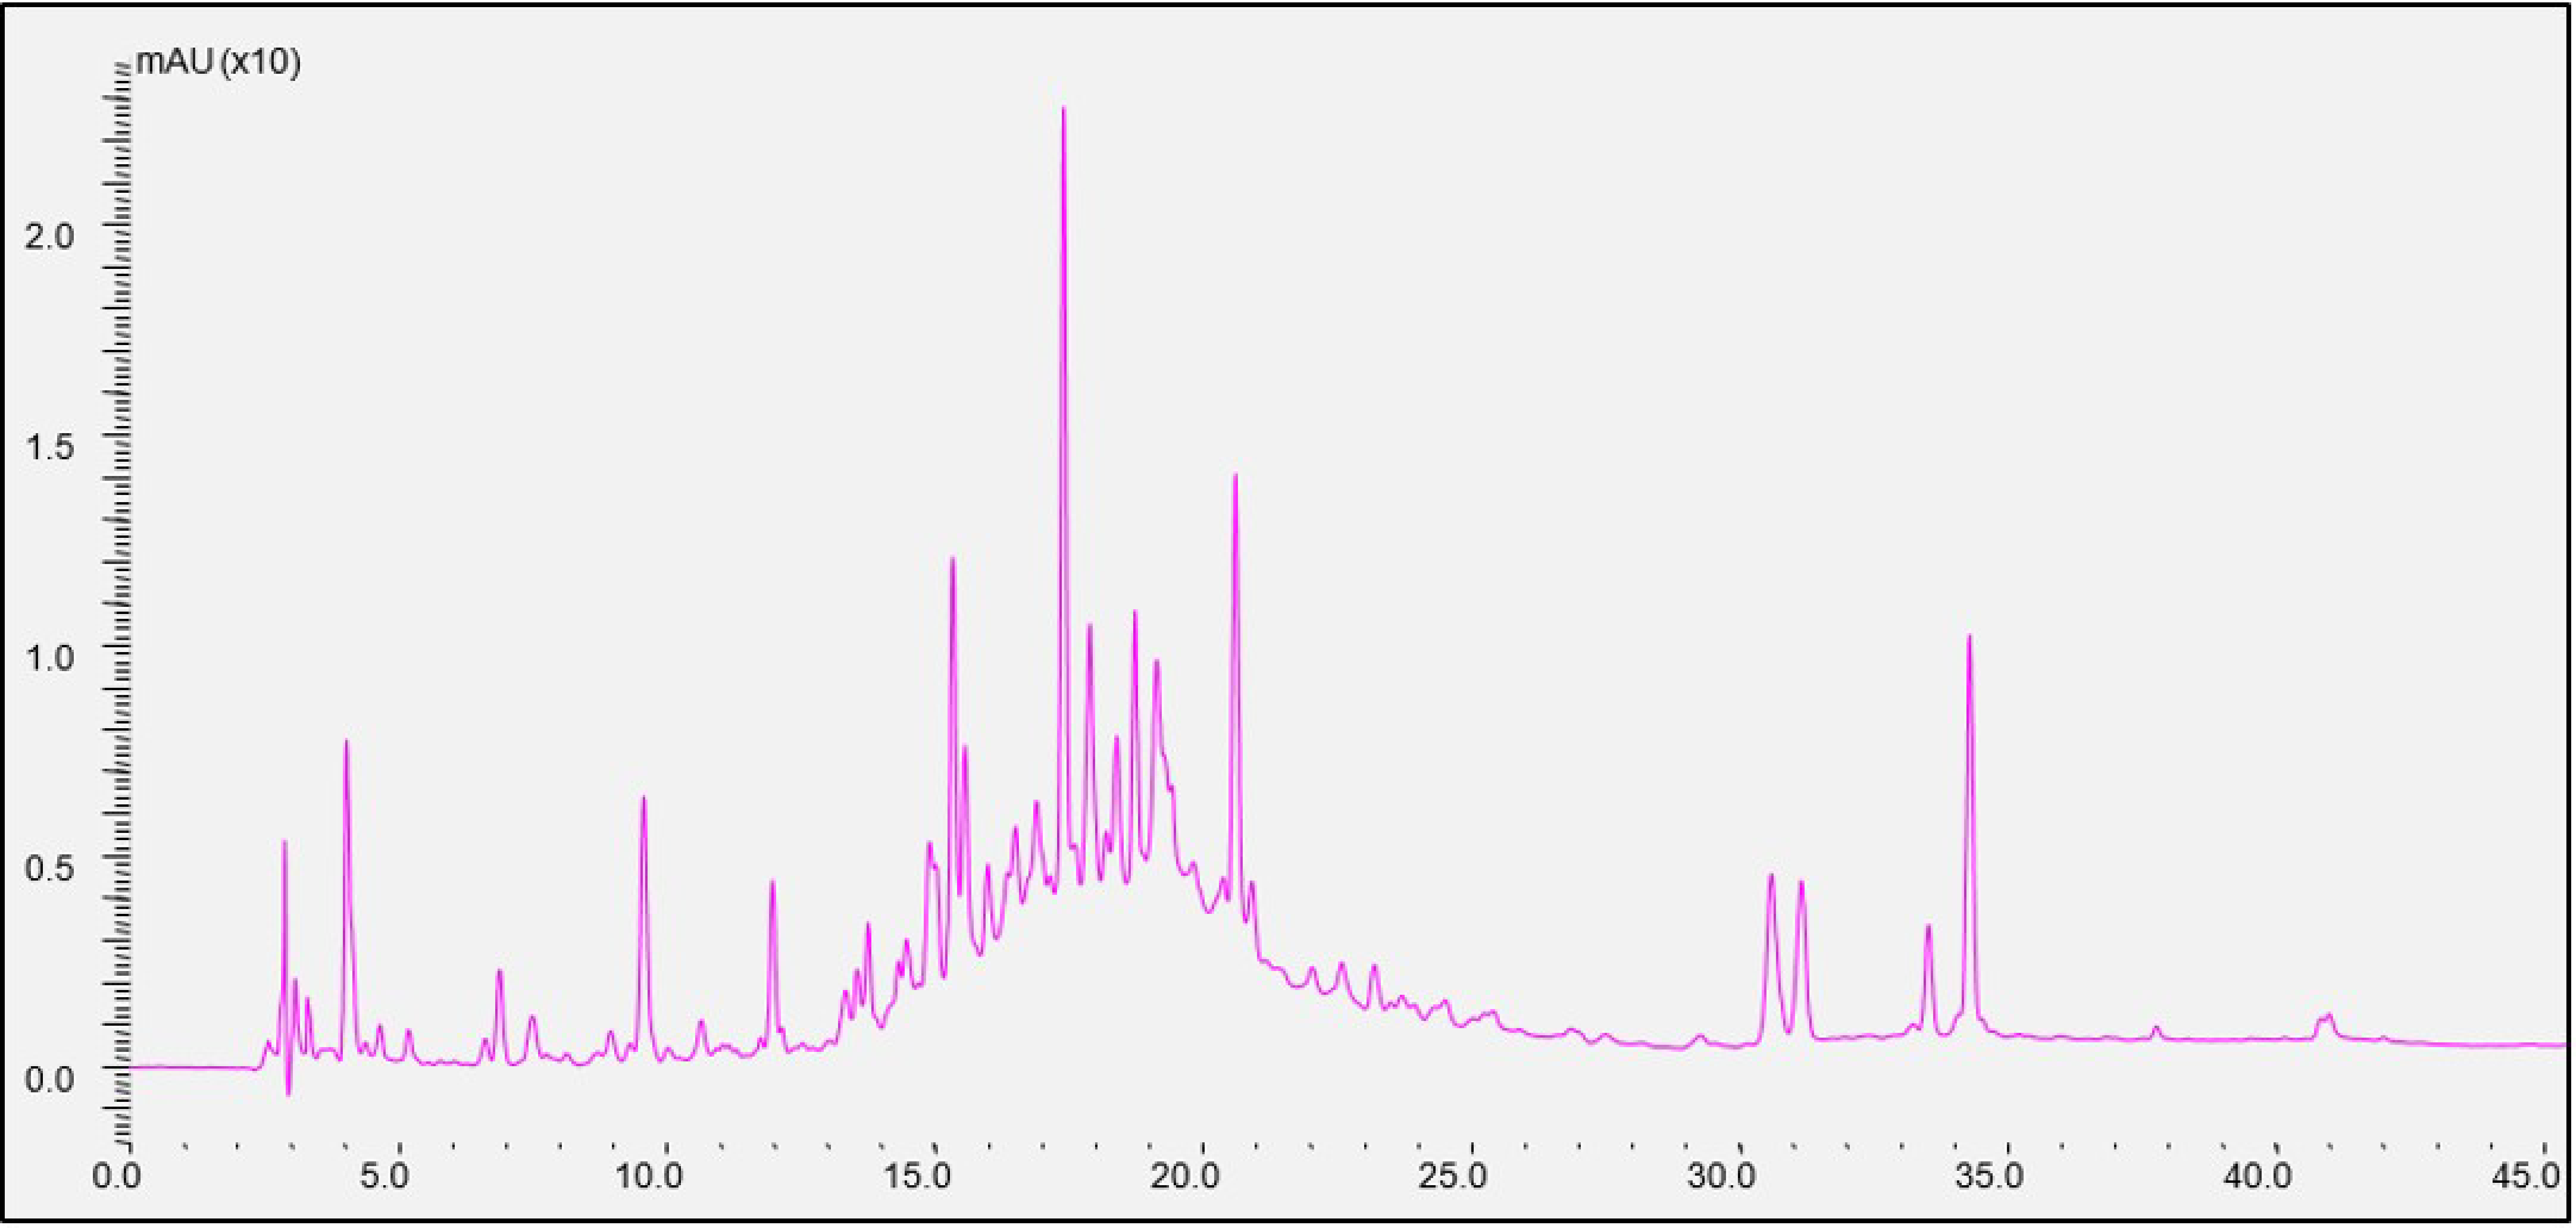
Phenolic extracts were analyzed on high-pressure liquid chromatography (HPLC) Agilent 1100 series (Agilent Corporation, California, MA, USA) with a diode array detector (DAD). The system was connected to a computer and HP Chemstation software.
They were also analyzed on a Shimadzu LC/MS-2010A (Kyoto, Japan) equipped with an LC-10ADvp binary pump, a DGU-14A degasser, a SIL-10ADvp autosampler, an SPD-M10Avp Photo Diode Array Detector, and a quadrupole mass detector (MSD) with an electron spray ion source (MS-ESI, Electrospray Ionization). The system was connected to a computer and Shimatzu version 3.40.307 software for chromatographic processing. The detector was set to negative ion operation mode under these conditions: ionization source temperature CDL (curved desolvation line): 300 °C, mist gas flow (N2): 1.5 L min−1, drying gas pressure (N2): 0.1 MPa (10 L min−1 flow), heat block temperature: 300 °C, mist area potential: −2.5 kV, CDL voltage −20 V, detector voltage: −1.55 kV, scan area: 50–1000 m/z, and scan speed: 6000 amu s−1.
A reversed-phase column Supelco (Discovery HS C18) (Darmstadt, Germany), length 250 mm, internal diameter 4 mm with material porosity of 5 μm was used and it eluted the analytes at a flow rate of 1 mL min−1. The following gradient of mobile phase A (0.1% formic acid in water) and mobile phase B (0.1% formic acid in methanol) was used for the analysis. The program followed was 0–1 min, 5% solvent (B), 1–5 min, 10% solvent (B), 6–15 min, 33% solvent (B), 16–25 min, 41% solvent (B), 26–35 min, 62% solvent (B), 36–42 min, 66% solvent (B), 43–55 min, 100% solvent (B), 56–65 min, 5% solvent (B). Chromatograms were recorded at wavelengths 280, 320, 360, and 520 nm [21].

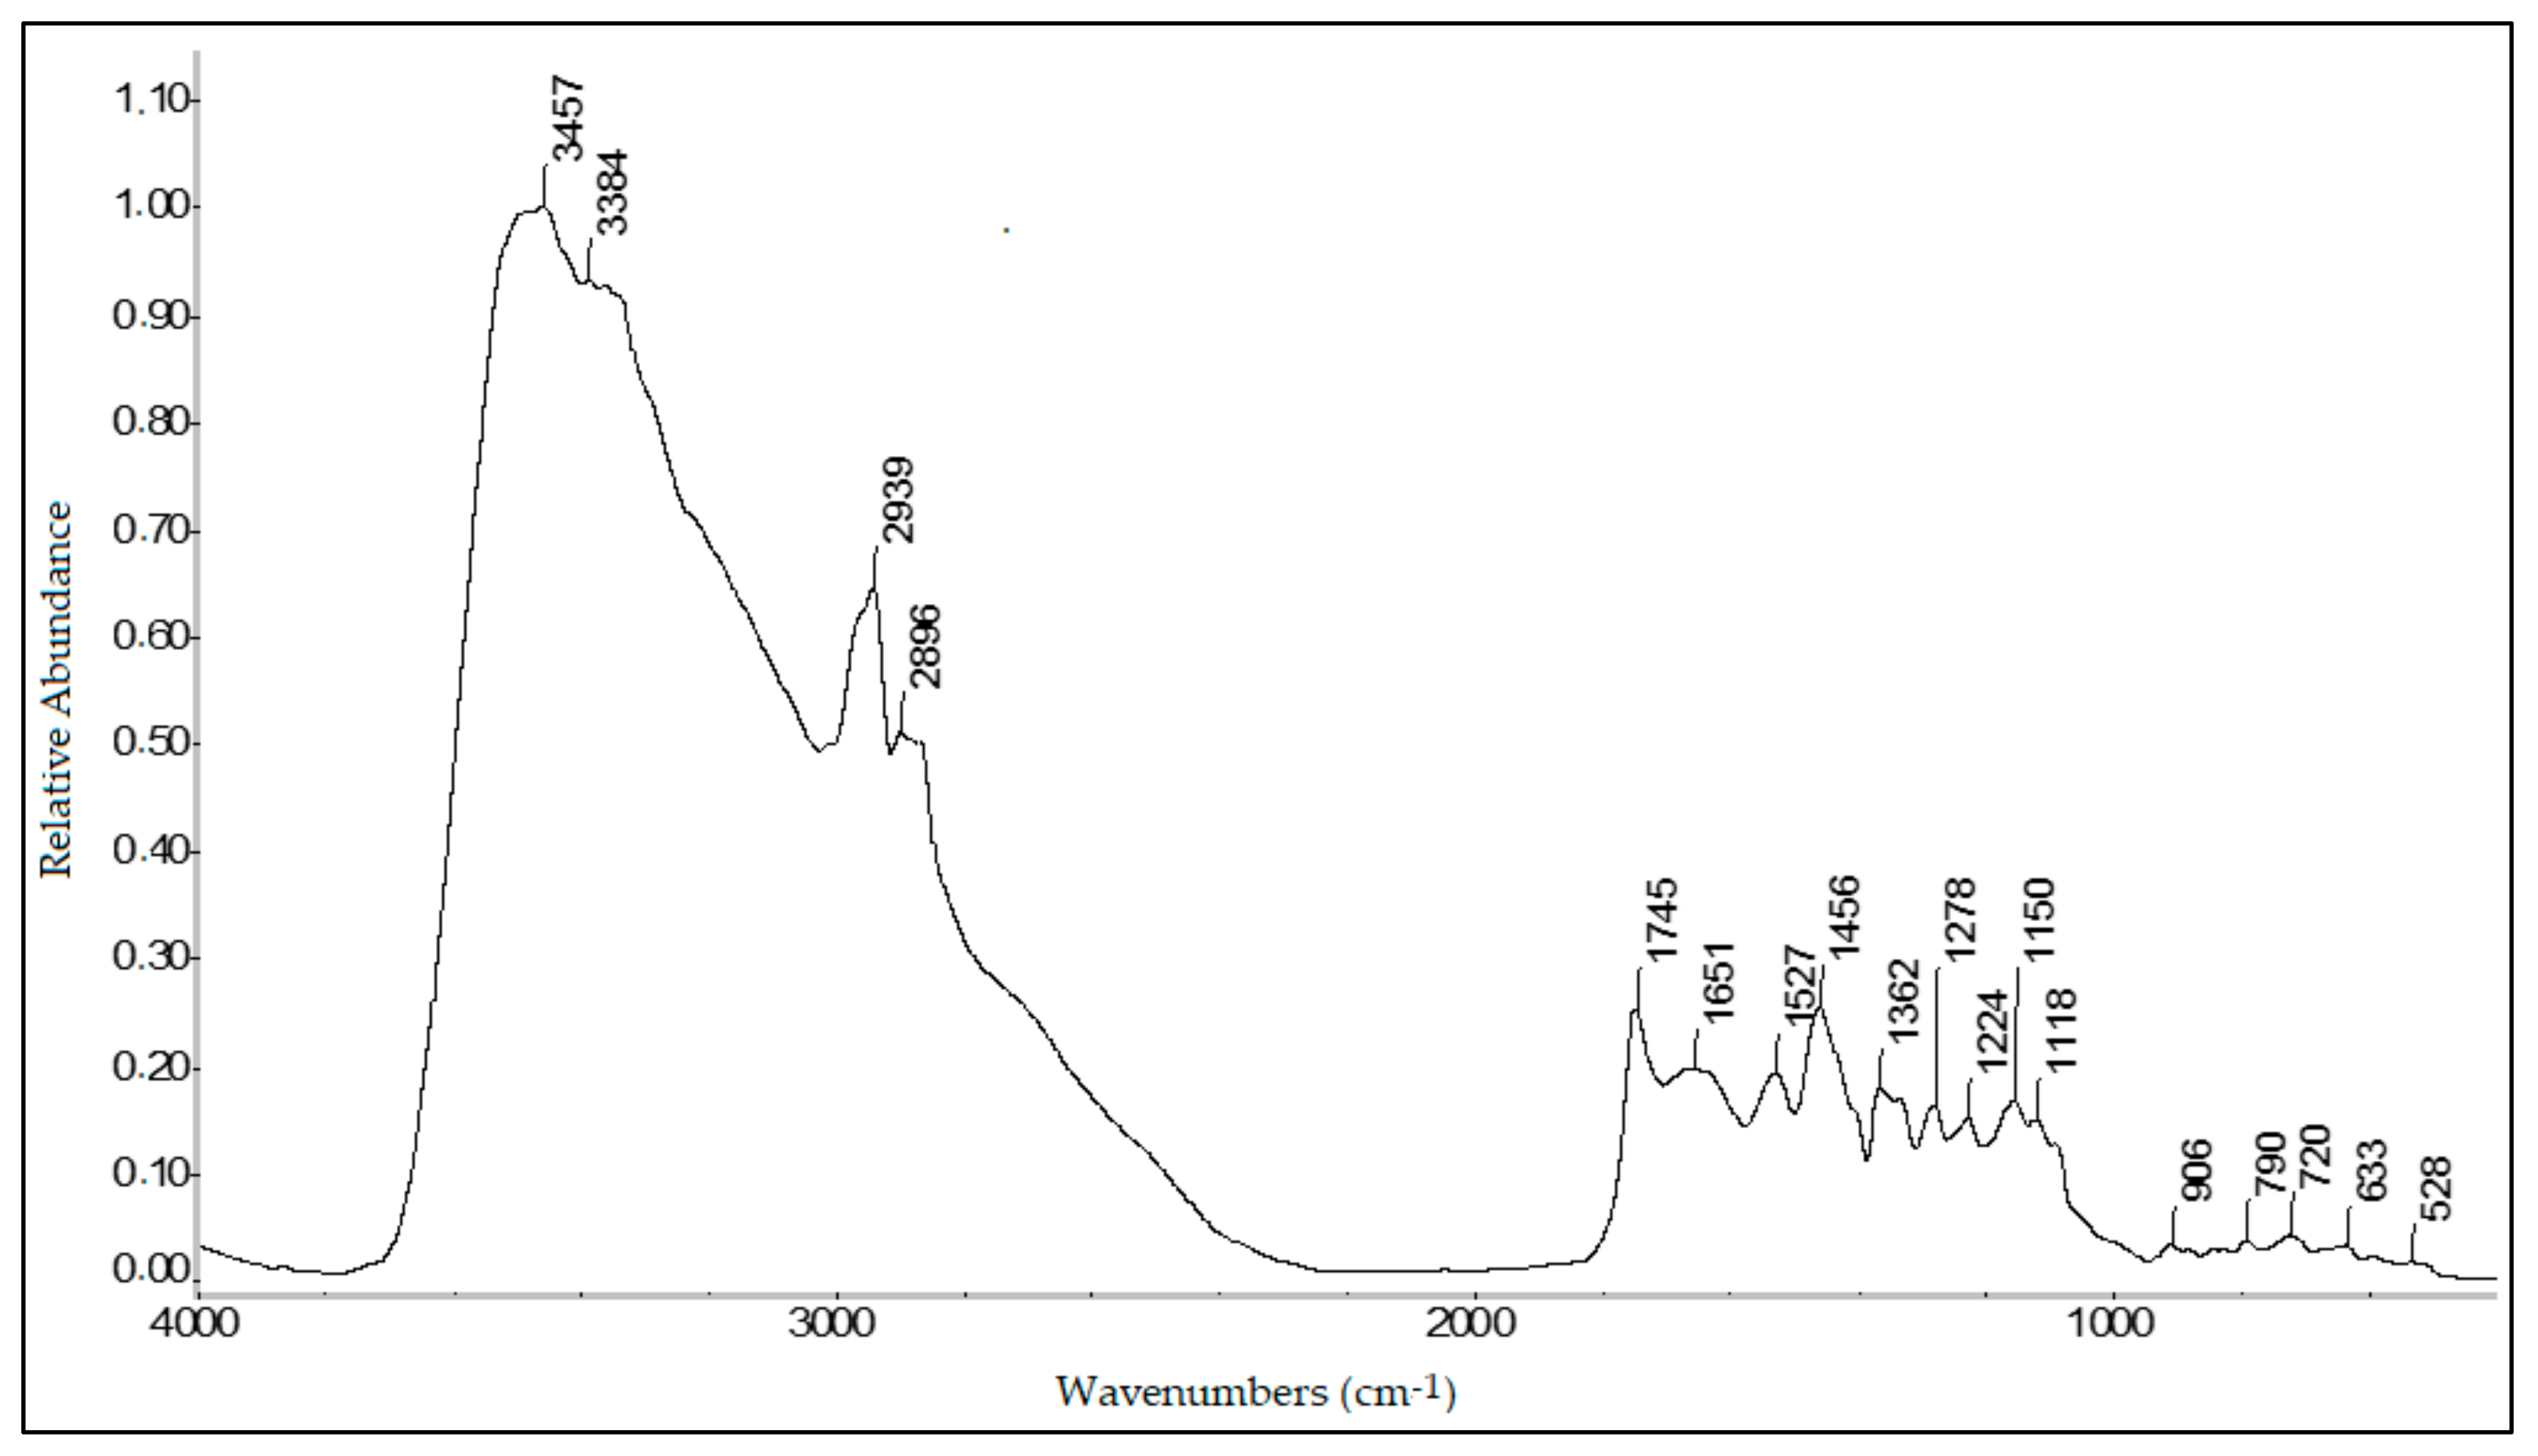
2.11. FTIR Spectroscopy

Fourier-transform infrared (FTIR) spectra were obtained using a Thermo Nicolet 6700 FTIR (Thermo Electron Corporation, Madison, WI, USA) equipped with a deuterated triglycine sulfate (DTGS) detector. The spectra were obtained with the diffuse reflectance infrared Fourier-transform spectroscopy (DRIFTS) technique. The speed of the interferometer moving mirror was 0.6329 mm s−1. Spectra were recorded with a resolution of 4 cm−1 and 100 scans. Before the analysis of each sample, the background was recorded. Triple FTIR spectra of each sample were obtained, using a different subsample each time.
FTIR spectra were smoothed using the Savitsky–Golay algorithm and their baselines were corrected. These pre-treatments were performed with “automatic smoothing” (5-point moving second-degree polynomial) and “baseline correction” (second-degree polynomial, twenty iterations) functions. Finally, using the “statistical spectra” function, the mean of three spectra for each sample was calculated and normalized (absorbance maximum value of 1). Spectrum processing was performed using the software OMNIC ver.9.1 (Thermo Fisher Scientific Inc., Waltham, MA, USA).

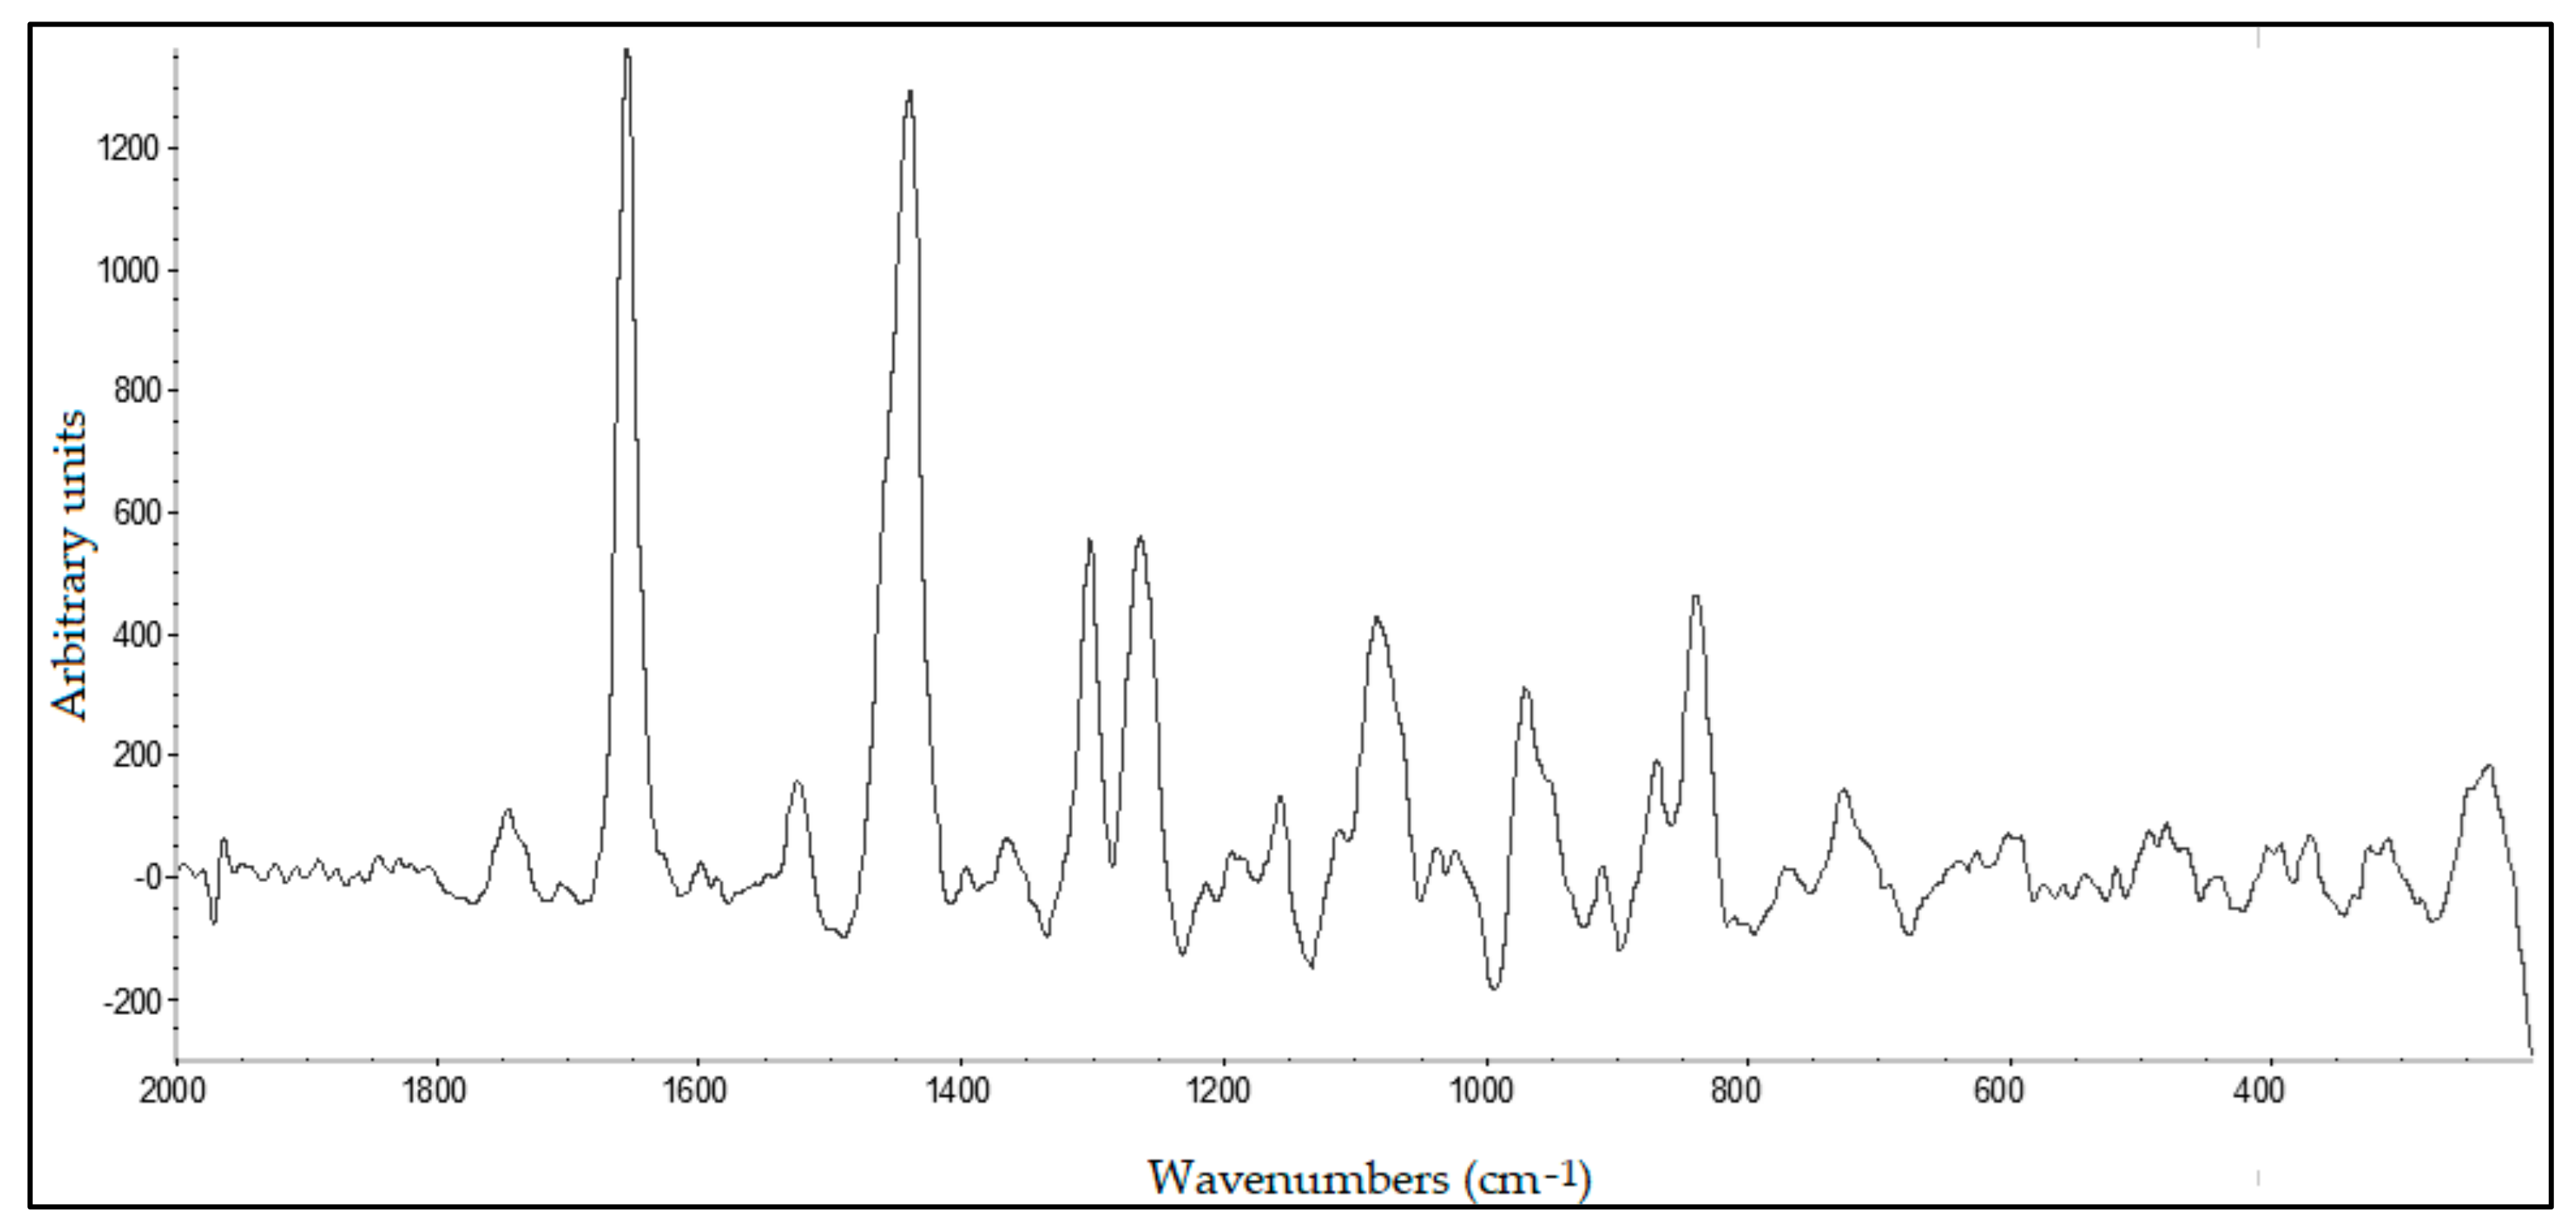
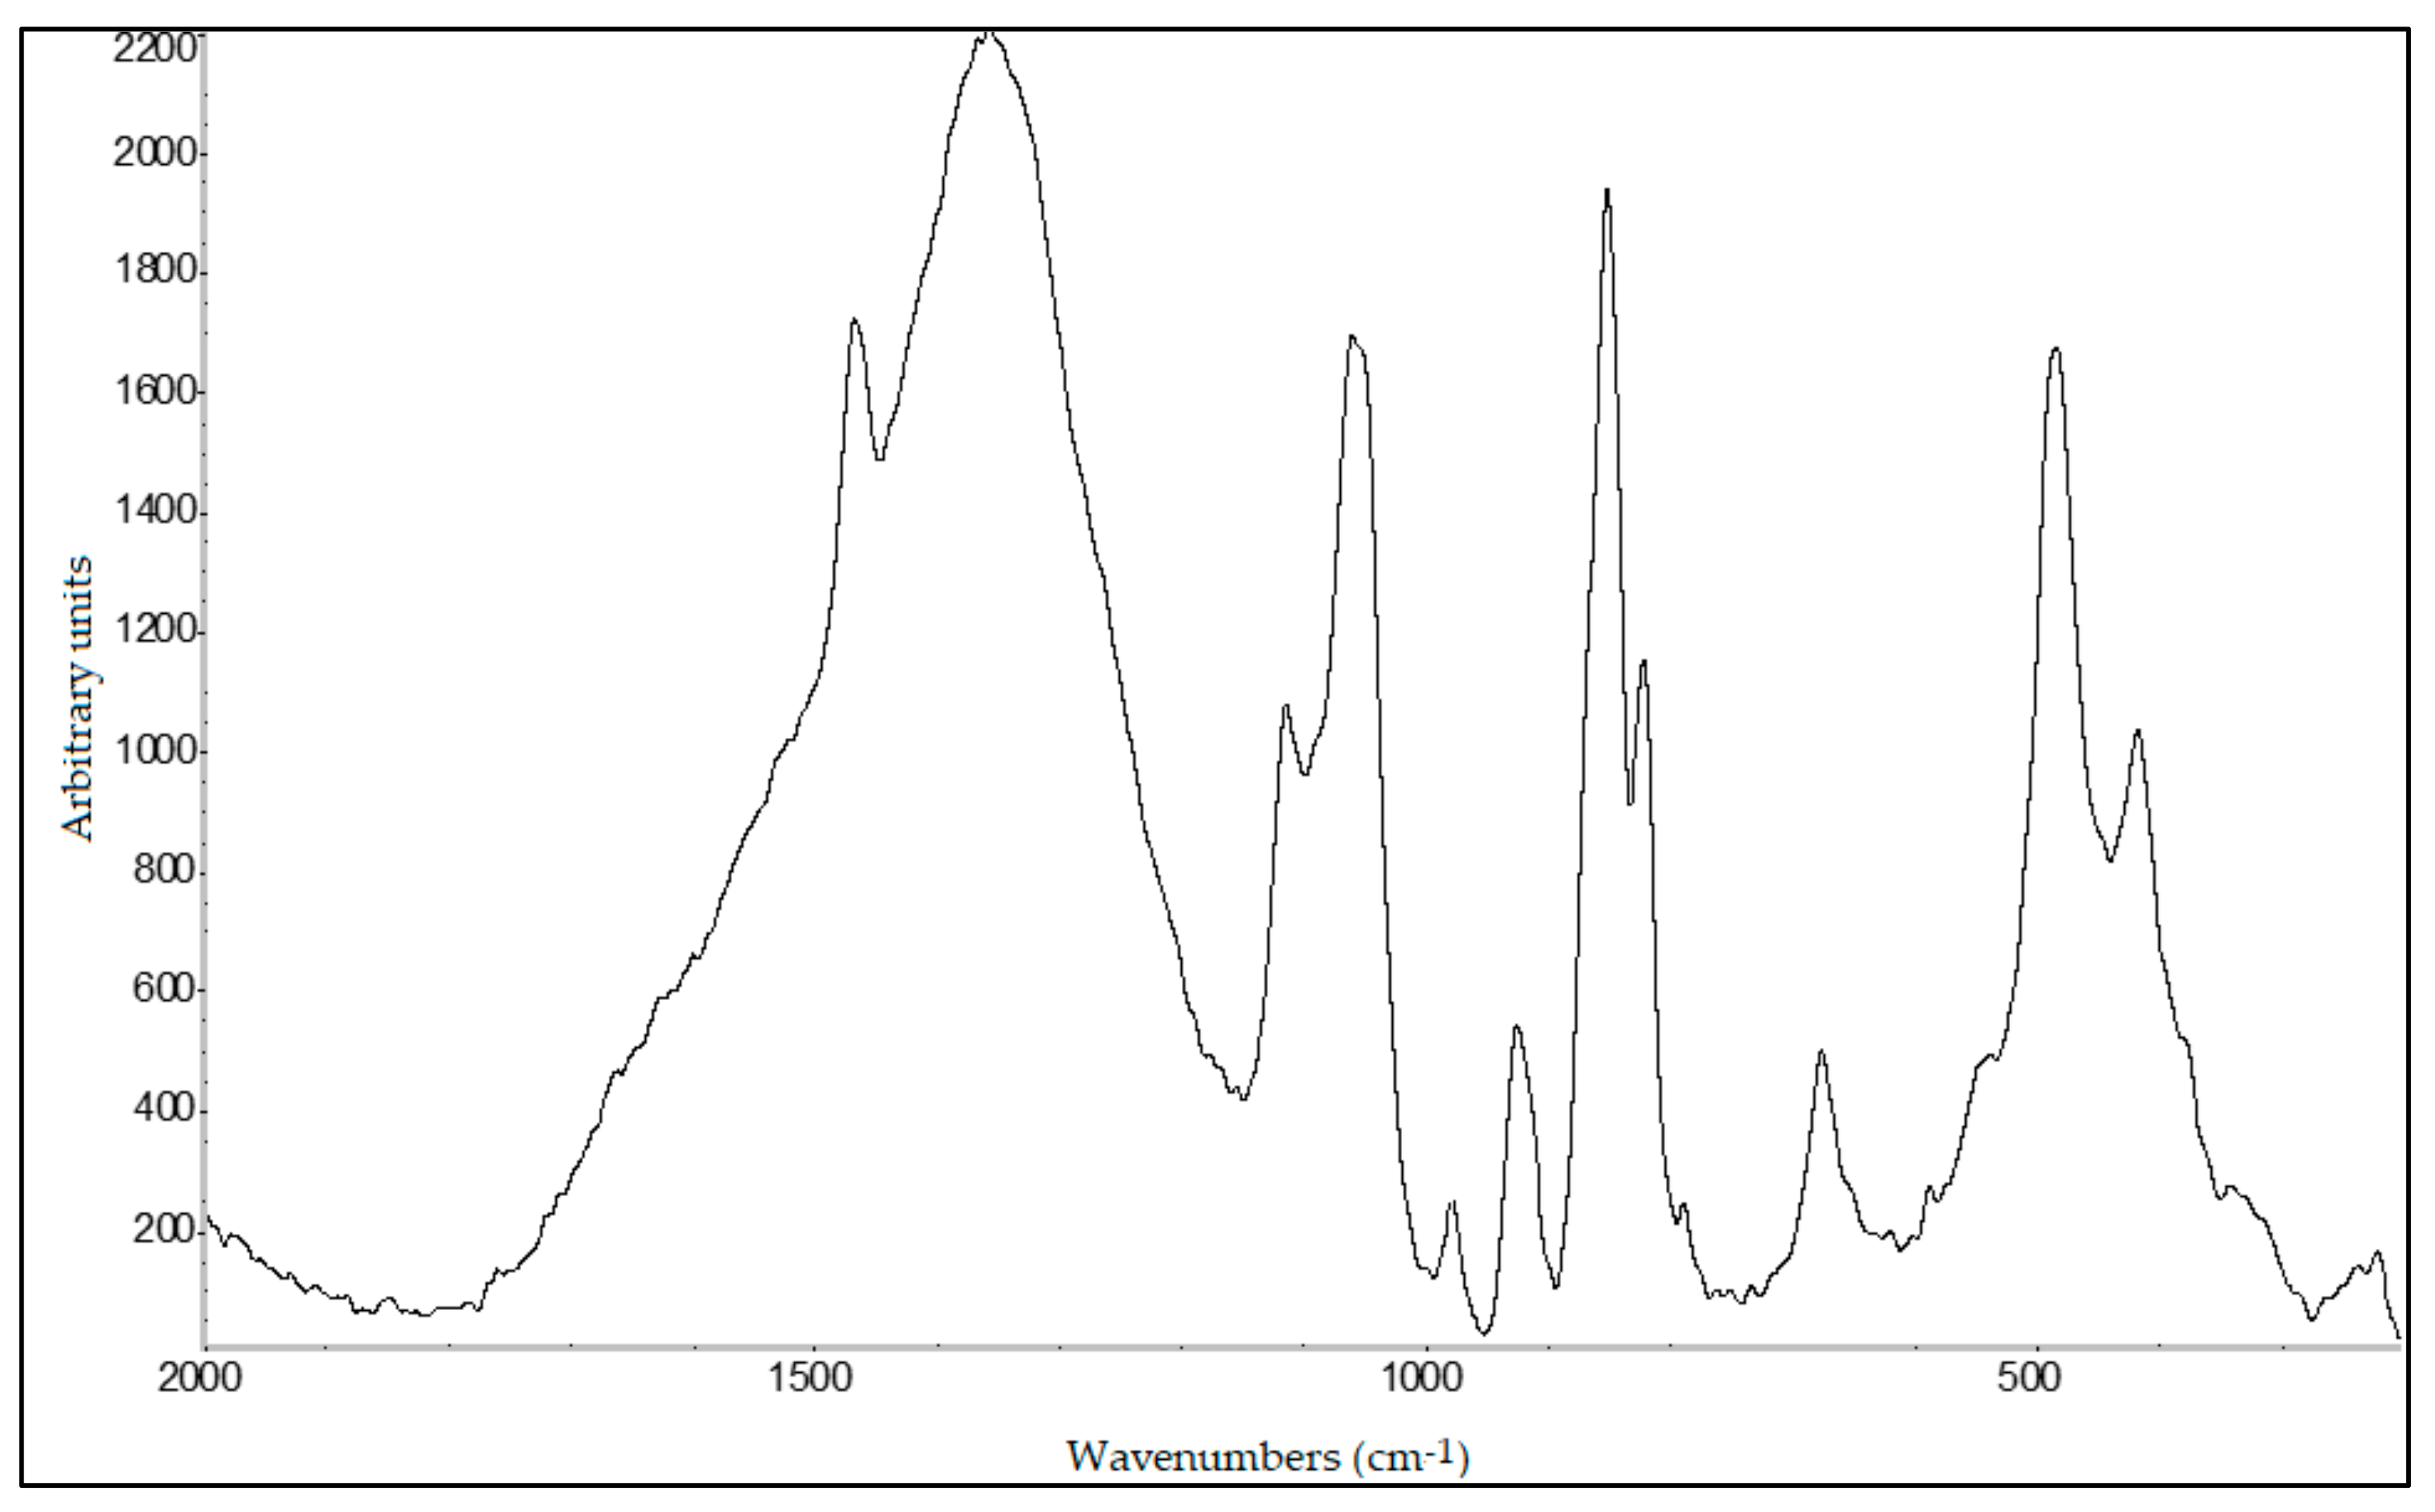
2.12. Raman Spectroscopy

A DeltaNu Advantage 785 visible-infrared Raman spectrometer (DeltaNu Inc., Laramie, WY, USA) equipped with a 785 nm diode laser for excitation with a maximum output power of 71.6 mW was used to record the spectra. Each spectrum was a 10 s acquisition over the spectral range of 2000–200 cm−1 using a resolution of 8 cm−1. The spectrometer was accompanied by NuSpec software. Raman spectra processing was performed as FTIR spectra.

2.13. Statistical Analysis

All the experiments were done in triplicate and the results are given as mean ± standard deviation (SD).

3. Results and Discussion

3.1. Grape Seed Oil Analysis

The grape seed oil yields differ for each grape variety tested and more information is presented in Figure 1. Higher yields were assigned to Robola from Zakynthos, yielding 8.77 ± 0.18% w/w, followed by Cabernet Sauvignon from Corfu, 8.11 ± 0.18 w/w. Lower yields were found in cultivars of Robola coming from the PDO of Robola in Cephalonia, ranging from 5.26 ± 0.33 to 7.01 ± 0.85% w/w. Other authors have pointed out that yields are closely related to two factors, including the variety tested [19] and the extraction method followed [9].
The tentative identity of the fatty acid profiles (% abundance) from characteristic wine by-products varieties of the Ionian Islands are presented in Table 1. Grape seed oils had profile with a valuable source of unsaturated fatty acids (SFAs). Particularly, the FAMEs composition of the grape seed oils varied between the different varieties and cultivars. Linoleic fatty acid (C18:2) was the most abundant, followed by oleic fatty acid (C18:1), palmitic fatty acid (C16:0), and last, stearic fatty acid (C18:0). Other fatty acids found in the samples in smaller amounts were myristic (C14:0) and palmitoleic (C16:1). Linoleic fatty acid ranged from 53.28 ± 1.24 to 57.05 ± 1.40% in Robola cultivars coming from the PDO of Robola in Cephalonia. Other varieties appeared to be higher in the abundance of linoleic fatty acid. For example, Tsaousi and Sauvignon Blanc from Cephalonia, Cabernet from Corfu, and Robola from Zakynthos had 60.95 ± 1.65%, 60.82 ± 2.45%, 59.66 ± 0.84%, and 59.26 ± 0.91%, respectively. On the other hand, oleic fatty acids were the constituent with the second highest abundance. For example, the cultivar of Robola from Cephalonia had content from 22.41 ± 0.76 to 25.44 ± 1.36%. High oleic fatty acid content combined with low linoleic fatty acid content appears to be a feature common for grape seed oils, as other studies have mentioned [19].
For the rest of the varieties tested, oleic fatty acid ranged from 17.55 ± 2.37% in Sauvignon Blanc from Cephalonia to 21.74 ± 0.28% in Goustolidi from Zakynthos. Both linoleic and oleic fatty acids total 78–82% of FAMEs, which is similar to the fatty acid composition of safflower oil, which is related to the genotype and the environment was chosen [26,27].

3.2. Grape Seed Oil Antioxidant Activity

The antioxidant activity of grape seed oil was estimated by DPPH and ABTS assays as presented in Table 2. The varieties of Tsaousi from Cephalonia, Goustolidi from Zakynthos, and four of the cultivars of the PDO of Robola in Cephalonia exhibited more than 60% of the scavenging effect of the DPPH radicals, while the before-mentioned samples inhibited more than 90% of the effect of the ABTS•+ radical, except in the case of Tsaousi from Cephalonia, where the scavenging effect of the ABTS•+ radical was 64.8%. The rest of the grape seed oils tested for their antiradical activity showed the scavenging effect of the DPPH radicals ranging from 42.95 to 56.25%, while they succeed better in eradicating the ABTS•+, with an inhibition rate from 88.16 to 94.20%.
Similar to previous research [28,29], results of this study indicate that grape seed oils are in phenolics due to the low solubility of phenolics in the lipid fraction, as most of the phenolic compounds remain in the defatted grape seed particles which have a phenolic concentration at least 100-fold higher than the phenolic concentration in the oil [30]. TPC in grape seed oils by soxhlet extraction was found to vary from 6.11–46.67 mg GAE g−1 [31,32].
From the results, we conclude that the antioxidant activity of the extracts is influenced by the assay, the extraction method, and the chemical compounds they contain. Other probes, such as DPPH assay, have greater sensitivity to aqueous extracts, while others, such as ABTS, have greater sensitivity to lipophilic extracts. Finally, due to the complexities of the extract’s structure and the synergistic action of the components, detecting the antioxidant activity of a single component is nearly impossible. As a result, determining antioxidant activity using at least two different methods is a mandatory step in order to obtain comparable results and relate the content of phenolic compounds to antioxidant activity.

3.3. Grape Seed Oil Spectroscopic Indices

The spectroscopic indicator, K232 was more than 2.50 for three samples, including two of the Robola cultivars of the PDO of Robola in Cephalonia and Tsaousi from Cephalonia. In all the other samples K232 was less or equal to 2.50. Moreover, six of the grape seed oils’ ΔK were equal to 0.1, and for the other six more than 0.2. According to the EU regulation [33] oils with ΔΚ above 0.1 are not subject to the category “extra virgin/virgin olive oil”. K indices can be misleading if used as the only criterion of the oil quality other than olive oil and therefore must be combined with the other quality parameters as well.

3.4. Raman Spectroscopy in Grape Seed Oils

A representative Raman spectrum from grape seed oil is presented in Figure 2. The grape seed oils gave two strong peaks, one at 1655 cm−1 and the other at 1444 cm−1. A peak at 1655 cm−1 mentioned unsaturated cis double bonds, while the peak at 1444 cm−1 belongs to (-CH2) scissor and twist vibration of fatty acids. Its peaks tend to be stronger as the chain length of the fatty acids increases [34]. The peaks between 1400 and 800 cm−1 belong to aliphatic stretches [35].

3.5. Grape Skin Analysis

Pretreatment of the samples before extraction had an important role in the recovery of bioactive compounds for further analysis. Qualitative determination of phenols according to their structure showed a characteristic absorption spectrum in UV-Vis. In particular, hydroxybenzoic acids, flavonols, and procyanidins were detected at 280 nm, stilbenes, hydroxycinnamic acids, and their esters at 320 nm, flavonols, and their glycosides at 360 nm. UV-Vis spectra of flavonoids showed the two absorption bands I and II. Zone I had an absorbance range of 300–370 nm due to the structure of rings B and C while band II had an absorbance range of 250–300 nm due to the A-ring of the flavonoids. In the absorbance range of 260–280 nm, we also confirmed the existence of phenolic compounds and particular phenolic acids [25]. Finally, absorptions at 520 nm were attributed to anthocyanins.
Determination of phenolic compounds was identified by LC-MS analysis (Figure 3), comparing mass spectrum and the UV spectrum with standards. Peaks were attributed to monomeric 3-flavanols as well as monomeric, dimeric, and trimeric proanthocyanidins. Specifically, Robola grape skin extracts were rich in proanthocyanidins, catechin, epicatechin, a glycoside of kaempferol, and 3-glucuronide of quercetin (Table 3).
Grape skins from white varieties have a higher content of trans-caftaric acid than red grapes [36]. Quercetin-3-O-glucuronide and quercetin-3-O-glucoside remain at relatively high levels in all varieties [37]. The content of myricetin has not been detected in most white varieties. This could be due to the absence of the enzyme flavonoid-3’,5′-hydroxylase in white grape varieties [38,39]. Tannins represent a significant content of the bioactive phytochemicals in vinification residues and available records describe the presence of procyanidin dimers B1, B2, B3, and B4 and procyanidin trimers C1, C2, and C3. Grape skin extracts contain high oligomeric proanthocyanidins [40], which can combine with gallic acid to form gallate esters, and ultimately glycosides [41].
The polyphenolic composition of by-products depends on grape cultivar, vintage effect, grape maturity, and winemaking methods [42]. Heat drying is also a significant factor to consider, especially when applied on an industrial scale, because it affects phenolic stability [43]. These by-products are perishable, and when they are produced in high masses they need rapid stabilization by drying. In addition, the balance between costs and the final quality of the dried by-product must be considered [43]. Another significant factor affecting phenolic isolation is the effectiveness of some solvent’s extractors. In this study, a mixture of water and glycerol is suggested, although polyphenolic extracts were also obtained with other aqueous mixtures of ethanol or acetone with similar effectiveness [44]. In each case, the use of aqueous solutions shows qualitative and quantitative differences.
Despite the cultivar, grape skins can still contain large amounts of phenolic compounds, both after red winemaking and white winemaking. Grape skins from four cultivars from Italy after fermentative maceration still had a high content of total and monomer anthocyanins and lower content of flavans and tannins [45]. However, in our study, the analysis of winery by-products suggests differences in phenolic content from red and white varieties. Guaita et al., 2019 [45] reported that the higher homogeneity of polyphenolic composition between the by-products of different grape cultivars is also the consequence of the management of the fermentative maceration performed by the various wineries. They also stated that these differences may be due to modalities of the by-products mixing operations, the adsorbent effect of the yeast strain, the use of maceration enzymes, the temperature, and the amount of oxygen supplied. This observation enables us to manage the red and white varieties as separate materials.

3.6. Grape Skin Antioxidant Activity

The results of antioxidant activity are displayed in Table 4 and confirmed the high TPC performance of grape skins. The results depended on the variety. Differences also exist due to soil or climatic conditions, winery treatment, or vinification [42]. Nevertheless, it appeared that all the varieties had high TPC even after their vinification with an average of (22.94 mg GAE mL−1). It was observed that the higher TPC was in the red Cabernet Sauvignon variety from Corfu (32.60 mg GAE mL−1) while lower absorptions appeared in white varieties. Similar results were observed in antiradical activity methods. The rest of the grape skin extracts tested for their antiradical activity showed a scavenging effect of the DPPH radicals ranging from 25.43 to 53.20%, while they succeed better in eradicating the ABTS, with an inhibition rate from 24.49 to 98.62%.
It should be noted that the TPC is influenced, in particular, by the concentration of anthocyanins and flavans at a high and medium-low molecular weight. Guaita et al., 2019 [45] reported that another significant factor that affects the concentrations was the fermentative maceration because it can cause a strong reduction in the TPC of skins.
The results of TPC and antiradical activity are correlated (p-value < 0.05) as shown in Table 5. Bosso et al., 2020 [42] also reported correlations between the ABTS values determined and the corresponding TPC. Additionally, another study remarked that the above results are related to a limited number of tannins [46]. The variation in antiradical activity could be due to qualitative differences in the polyphenolic composition of the extracts as previously reported.

3.7. FTIR and Raman Spectroscopy of Grape Skins

A representative FTIR spectrum from the grape skin sample is presented in Figure 4. The assignments of the major peaks are shown in Table 6. It was observed that the spectra showed significant similarities. The samples consist of water, protein, fat, organic acid, sugar, nitrogen compounds, and flavonoids.
Respectively, Raman spectra from grape skin extract are presented in Figure 5. The assignments of the major peaks are shown in Table 7. It was observed that the spectra showed significant similarities. The samples consisted of phenolic compounds distinguished in non-flavonoid phenols and flavonoid phenols. In particular, the extracts contained phenolic acids, flavonols, flavanones, tannins, and anthocyanins.

3.8. A Holistic Management of Winery by-Products Based on Their Chemical Analysis

Chemical analysis of grape pomace showed that they consist of valuable phytochemicals like PUFAs, MUFAs, and polyphenols. These fatty acids can balance the PUFA/saturated fatty acid (SFA) ratio of the human diet [56]. Furthermore, studies have shown that a diet enriched in polyphenols has multiple benefits for human health such as cardiovascular and coronary heart diseases [57,58], diabetes [59], and anti-inflammatory activity [60,61].
Foods enriched with grape pomace, either as extracts or as whole powder, have been demonstrated in the past. Cereals and dairy products would be able to be used for enrichment more easily [62,63,64]. Grape pomace has been successfully used in cheese manufacturing [65,66], marmalade or candies [67], salad dressing [68], and tomato puree [69]. Meat products are the food categories in which these by-products have been most widely used to prevent lipid oxidation. They have been applied in beef [70], pork [71,72], chicken [73], turkey [74], goat [75], and buffalo [76]. Grape seed oil was also proposed as an innovative food ingredient in various food formulations improving their nutritional properties [77]. The incorporation of grape seed oil (up to 10%) was proposed to improve the fatty acid profile of frankfurters [78]. Otherwise, it can be used in cosmetics as it has moisturizing properties [79].
The availability of winery by-products in the Ionian Islands according to statistical data of the Greek Ministry of Agriculture is estimated in total at 1038.87 tons per year. Cephalonia Island contributes more than half (53%) (Figure 6). Moreover, more details of mass balance are presented in Table 8.
Based on estimated yields, a production of 5895.03 L per year of grape seed oil will provide a higher additive value. The minimized dry mass provides the advantages of easier and more cost-efficient transportation both inside the islands and especially to the mainland. In addition, their transport time will be much shorter without particularly high costs. The amount of 107.32 tons of grape seeds and skins can be reused as whole material in food or pharmaceutical companies contributing directly to the circular bioeconomy. These results also underline the importance of a management plan of by-products in the Ionian Islands.

4. Conclusions

The present work outlined the importance of qualitative characteristics of winery by-products especially from traditional PDO grape varieties of Ionian Islands as a critical input to any by-product management plan towards a circular bioeconomy. To provide a realistic representation, by-product samples were collected directly from wineries after the vinification process. The solvents used were nontoxic and environmentally friendly. In addition, the application of green extraction processes ensures that the final products are safe for humans thus increasing the breadth of demand. Grape pomace can be used to empower business sectors of the food industry, beverage, medicine, cosmetics, cooking, feed, and many more. It can also be used as a whole material after a short preprocessing that involves moisture removal and pulverization. Furthermore, due to the ease and speed at which they can be transported, the same handling outcomes are inferred in lowering environmental and economic costs. All the above support the meaning of the circular economy, which states that anything previously classified as “by-products” can now be converted and classified as raw material. After a feasibility analysis, the qualitative data of winery by-products combined with annual production data by variety and per island, allowed for a first mass balance estimation that could form the basis of any management plan. In any case, further research into the optimization of each processing phase is needed to optimize efficiency.

Supplementary Materials

The following are available online at https://www.mdpi.com/article/10.3390/su13105454/s1, Figure S1: A representative calibration curve of gallic acid. Figure S2: A representative calibration curve of DPPH inhibition by Trolox. Figure S3: A representative calibration curve of ABTS inhibition by Trolox.

Author Contributions

Conceptualization, M.X. and I.O.; methodology, C.S.P. and P.A.T.; software, M.X. and I.O; validation, I.K.L. and C.G.; formal analysis, C.K. and D.D.; investigation, M.X. and I.O.; data curation, C.K. and D.D.; writing—original draft preparation, M.X.; writing—review and editing, E.S.; supervision, E.S. and P.A.T.; project administration, E.S., C.S.P., and P.A.T. All authors have read and agreed to the published version of the manuscript.

Funding

The present research was carried out by the Technological Educational Institution of the Ionian Islands within the framework of the project “Valorization of winemaking residues for the production of high added value raw materials for the food, cosmetics and parapharmaceutical industry” of the ROP “Ionia Nisia 2014–2020”, co-funded by the European Union (ERDF) and Greece.

Institutional Review Board Statement

Not applicable.

Informed Consent Statement

Not applicable.

Data Availability Statement

Not applicable.

Acknowledgments

We thank Gentillini Winery, the Robola Cooperative of Cephalonia, Ktima Grampsa, and Ktima Theotoki Wineries for winery by-products samples.

Conflicts of Interest

The authors declare no conflict of interest.

References

  1. Food and Agricultural Organization. FAOSTAT. Available online: http://www.fao.org/faostat/en/ (accessed on 20 March 2021).
  2. International Organisation of Vine and Wine. OIV. 2016. Available online: http://www.oiv.int/ (accessed on 20 March 2021).
  3. Ministry of Rural Development and Food. 2018. Available online: http://www.minagric.gr/index.php/el/ (accessed on 20 March 2021).
  4. Teixeira, A.; Baenas, N.; Dominguez-Perles, R.; Barros, A.; Rosa, E.; Moreno, D.A.; Garcia-Viguera, C. Natural Bioactive Compounds from Winery By-Products as Health Promoters: A Review. Int. J. Mol. Sci. 2014, 15, 15638–15678. [Google Scholar] [CrossRef] [PubMed] [Green Version]
  5. Da Silva, A.C.; Jorge, N. Bioactive compounds of oils extracted from fruits seeds obtained from agroindustrial waste. Eur. J. Lipid Sci. Technol. 2017, 119, 1600024. [Google Scholar] [CrossRef]
  6. Devesa-Rey, R.; Vecino, X.; Varela-Alende, J.; Barral, M.; Cruz, J.; Moldes, A. Valorization of winery waste vs. the costs of not recycling. Waste Manag. 2011, 31, 2327–2335. [Google Scholar] [CrossRef]
  7. Moletta, R. Winery and distillery wastewater treatment by anaerobic digestion. Water Sci. Technol. 2005, 51, 137–144. [Google Scholar] [CrossRef] [PubMed] [Green Version]
  8. Maier, T.; Schieber, A.; Kammerer, D.R.; Carle, R. Residues of grape (Vitis vinifera L.) seed oil production as a valuable source of phenolic antioxidants. Food Chem. 2009, 112, 551–559. [Google Scholar] [CrossRef]
  9. Beveridge, T.H.J.; Girard, B.; Kopp, A.T.; Drover, J.C.G. Yield and Composition of Grape Seed Oils Extracted by Supercritical Carbon Dioxide and Petroleum Ether: Varietal Effects. J. Agric. Food Chem. 2005, 53, 1799–1804. [Google Scholar] [CrossRef]
  10. Sabir, A.; Unver, A.; Kara, Z. The fatty acid and tocopherol constituents of the seed oil extracted from 21 grape varieties (Vitis spp.). J. Sci. Food Agric. 2012, 92, 1982–1987. [Google Scholar] [CrossRef] [PubMed]
  11. Arvanitoyannis, I.S.; Ladas, D.; Mavromatis, A. Potential uses and applications of treated wine waste: A review. Int. J. Food Sci. Technol. 2006, 41, 475–487. [Google Scholar] [CrossRef]
  12. Lafka, T.I.; Sinanoglou, V.; Lazos, E.S. On the extraction and antioxidant activity of phenolic compounds from winery wastes. Food Chem. 2007, 104, 1206–1214. [Google Scholar] [CrossRef]
  13. Babbar, N.; Oberoi, H.S.; Sandhu, S.K. Therapeutic and Nutraceutical Potential of Bioactive Compounds Extracted from Fruit Residues. Crit. Rev. Food Sci. Nutr. 2014, 55, 319–337. [Google Scholar] [CrossRef]
  14. Philippi, K.; Tsamandouras, N.; Grigorakis, S.; Makris, D.P. Ultrasound-Assisted Green Extraction of Eggplant Peel (Solanum melongena) Polyphenols Using Aqueous Mixtures of Glycerol and Ethanol: Optimisation and Kinetics. Environ. Process. 2016, 3, 369–386. [Google Scholar] [CrossRef]
  15. Apostolakis, A.; Grigorakis, S.; Makris, D.P. Optimisation and comparative kinetics study of polyphenol extraction from olive leaves (Olea europaea) using heated water/glycerol mixtures. Sep. Purif. Technol. 2014, 128, 89–95. [Google Scholar] [CrossRef]
  16. Karakashov, B.; Grigorakis, S.; Loupassaki, S.; Makris, D.P. Optimisation of polyphenol extraction from Hypericum perforatum (St. John’s Wort) using aqueous glycerol and response surface methodology. J. Appl. Res. Med. Aromat. Plants 2015, 2, 1–8. [Google Scholar] [CrossRef]
  17. Fernandes, L.; Casal, S.; Cruz, R.; Pereira, J.A.; Ramalhosa, E. Seed oils of ten traditional Portuguese grape varieties with interesting chemical and antioxidant properties. Food Res. Int. 2013, 50, 161–166. [Google Scholar] [CrossRef]
  18. Zhao, L.; Yagiz, Y.; Xu, C.; Lu, J.; Chung, S.; Marshall, M.R. Muscadine grape seed oil as a novel source of tocotrienols to reduce adipogenesis and adipocyte inflammation. Food Funct. 2015, 6, 2293–2302. [Google Scholar] [CrossRef]
  19. Davidov-Pardo, G.; McClements, D.J. Nutraceutical delivery systems: Resveratrol encapsulation in grape seed oil nanoemulsions formed by spontaneous emulsification. Food Chem. 2015, 167, 205–212. [Google Scholar] [CrossRef]
  20. Singleton, V.L.; Orthofer, R.; Lamuela-Raventos, R.M. Section III. Polyphenols and Flavonoids-14-Analysis of Total Phenols and Other Oxidation Substrates and Antioxidants by Means of Folin-Ciocalteu reagent. Meth. Enzymol. 1999, 299, 152–177. [Google Scholar] [CrossRef]
  21. Singh, R.P.; Murthy, C.K.N.; Jayaprakasha, G.K. Studies on the antioxidant activity of pomegranate (Punica granatum) peel and seed extracts using in vitro models. J. Agric. Food Chem. 2002, 50, 81–86. [Google Scholar] [CrossRef] [PubMed]
  22. Magalhaes, L.; Segundo, M.A.; Reis, S.; Lima, J.L. Methodological aspects about in vitro evaluation of antioxidant properties. Anal. Chim. Acta 2008, 613, 1–19. [Google Scholar] [CrossRef]
  23. Kallithraka, S.; Mohdaly, A.A.-A.; Makris, D.P.; Kefalas, P. Determination of major anthocyanin pigments in Hellenic native grape varieties (Vitis vinifera sp.): Association with antiradical activity. J. Food Compos. Anal. 2005, 18, 375–386. [Google Scholar] [CrossRef]
  24. Makris, D.P.; Kefalas, P. Characterization of Polyphenolic Phytochemicals in Red Grape Pomace. Int. J. Waste Resour. 2013, 3. [Google Scholar] [CrossRef] [Green Version]
  25. Cheng, V.J.; Bekhit, A.E.D.A.; McConnell, M.; Mros, S.; Zhao, J. Effect of extraction solvent, waste fraction and grape variety on the antimicrobial and antioxidant activities of extracts from wine residue from cool climate. Food Chem. 2012, 134, 474–482. [Google Scholar] [CrossRef]
  26. Fernandez-Martinez, J.; Del Rio, M.; De Haro, A. Survey of safflower (Carthamus tinctorius L.) germplasm for variants in fatty acid composition and other seed characters. Euphytica 1993, 69, 115–122. [Google Scholar] [CrossRef]
  27. Yang, R.; Zhang, L.; Li, P.; Yu, L.; Mao, J.; Wang, X.; Zhang, Q. A review of chemical composition and nutritional properties of minor vegetable oils in China. Trends Food Sci. Technol. 2018, 74, 26–32. [Google Scholar] [CrossRef]
  28. Lutterodt, H.; Slavin, M.; Whent, M.; Turner, E.; Yu, L. (Lucy) Fatty acid composition, oxidative stability, antioxidant and antiproliferative properties of selected cold-pressed grape seed oils and flours. Food Chem. 2011, 128, 391–399. [Google Scholar] [CrossRef]
  29. Matthäus, B. Virgin grape seed oil: Is it really a nutritional highlight? Eur. J. Lipid Sci. Technol. 2008, 110, 645–650. [Google Scholar] [CrossRef]
  30. Fiori, L.; De Faveri, D.; Casazza, A.A.; Perego, P. Grape by-products: Extraction of polyphenolic compounds using supercritical CO2 and liquid organic solvent: A preliminary investigation Subproductos de la uva: Extracción de compuestos polifenólicos usando CO2 supercrítico y disolventes orgánicos líquidos—una investigación preliminar. CyTA J. Food 2009, 7, 163–171. [Google Scholar] [CrossRef]
  31. Ben Mohamed, H.; Duba, K.S.; Fiori, L.; Abdelgawed, H.; Tlili, I.; Tounekti, T.; Zrig, A. Bioactive compounds and antioxidant activities of different grape (Vitis vinifera L.) seed oils extracted by supercritical CO2 and organic solvent. LWT 2016, 74, 557–562. [Google Scholar] [CrossRef]
  32. Antolovich, M.; Prenzler, P.D.; Patsalides, E.; McDonald, S.; Robards, K. Methods for testing antioxidant activity. Analyst 2002, 127, 183–198. [Google Scholar] [CrossRef]
  33. European Commission. Characteristics of olive and olive pomace oils and their analytical methods. Regulation EC/1989/2003. Off. J. Eur Comm. 2003, L295, 57–66. [Google Scholar]
  34. Czamara, K.; Majzner, K.; Pacia, M.Z.; Kochan, K.; Kaczor, A.; Baranska, M. Raman spectroscopy of lipids: A review. J. Raman Spectrosc. 2015, 46, 4–20. [Google Scholar] [CrossRef]
  35. Beattie, J.R.; Bell, S.E.J.; Borgaard, C.; Fearon, A.; Moss, B.W. Prediction of adipose tissue composition using raman spectroscopy: Average properties and individual fatty acids. Lipids 2006, 41, 287–294. [Google Scholar] [CrossRef]
  36. Di Lecce, G.; Arranz, S.; Jáuregui, O.; Tresserra-Rimbau, A.; Quifer-Rada, P.; Lamuela-Raventós, R.M. Phenolic profiling of the skin, pulp and seeds of Albariño grapes using hybrid quadrupole time-of-flight and triple-quadrupole mass spectrometry. Food Chem. 2014, 145, 874–882. [Google Scholar] [CrossRef] [PubMed]
  37. Bonilla, F.; Mayen, M.; Merida, J.; Medina, M. Extraction of phenolic compounds from red grape marc for use as food lipid antioxidants. Food Chem. 1999, 66, 209–215. [Google Scholar] [CrossRef]
  38. Mattivi, F.; Guzzon, R.; Vrhovsek, U.; Stefanini, A.M.; Velasco, R. Metabolite Profiling of Grape: Flavonols and Anthocyanins. J. Agric. Food Chem. 2006, 54, 7692–7702. [Google Scholar] [CrossRef]
  39. Jeffery, D.; Parker, M.; Smith, P. Flavonol composition of Australian red and white wines determined by high-performance liquid chromatography. Aust. J. Grape Wine Res. 2008, 14, 153–161. [Google Scholar] [CrossRef]
  40. González-Centeno, M.R.; Jourdes, M.; Femenia, A.; Simal, S.; Rosselló, C.; Teissedre, P.-L. Proanthocyanidin Composition and Antioxidant Potential of the Stem Winemaking Byproducts from 10 Different Grape Varieties (Vitis vinifera L.). J. Agric. Food Chem. 2012, 60, 11850–11858. [Google Scholar] [CrossRef] [PubMed]
  41. Ky, I.; Lorrain, B.; Kolbas, N.; Crozier, A.; Teissedre, P.-L. Wine by-Products: Phenolic Characterization and Antioxidant Activity Evaluation of Grapes and Grape Pomaces from Six Different French Grape Varieties. Molecules 2014, 19, 482–506. [Google Scholar] [CrossRef] [Green Version]
  42. Bosso, A.; Cassino, C.; Motta, S.; Panero, L.; Tsolakis, C.; Guaita, M. Polyphenolic Composition and In Vitro Antioxidant Activity of Red Grape Seeds as Byproducts of Short and Medium-Long Fermentative Macerations. Foods 2020, 9, 1451. [Google Scholar] [CrossRef]
  43. Guaita, M.; Panero, L.; Motta, S.; Mangione, B.; Bosso, A. Effects of high-temperature drying on the polyphenolic composition of skins and seeds from red grape pomace. LWT 2021, 145, 111323. [Google Scholar] [CrossRef]
  44. Bosso, A.; Guaita, M.; Petrozziello, M. Influence of solvents on the composition of condensed tannins in grape pomace seed extracts. Food Chem. 2016, 207, 162–169. [Google Scholar] [CrossRef] [PubMed]
  45. Guaita, M.; Bosso, A. Polyphenolic Characterization of Grape Skins and Seeds of Four Italian Red Cultivars at Harvest and after Fermentative Maceration. Foods 2019, 8, 395. [Google Scholar] [CrossRef] [Green Version]
  46. Motta, S.; Guaita, M.; Cassino, C.; Bosso, A. Relationship between polyphenolic content, antioxidant properties and oxygen consumption rate of different tannins in a model wine solution. Food Chem. 2020, 313, 126045. [Google Scholar] [CrossRef]
  47. Karoui, R.; Downey, G.; Blecker, C. Mid-Infrared Spectroscopy Coupled with Chemometrics: A Tool for the Analysis of Intact Food Systems and the Exploration of Their Molecular Structure: Quality Relationships—A Review. Chem. Rev. 2010, 110, 6144–6168. [Google Scholar] [CrossRef] [PubMed]
  48. Nogales-Bueno, J.; Baca-Bocanegra, B.; Rooney, A.; Hernández-Hierro, J.M.; Heredia, F.J.; Byrne, H.J. Linking ATR-FTIR and Raman features to phenolic extractability and other attributes in grape skin. Talanta 2017, 167, 44–50. [Google Scholar] [CrossRef] [PubMed] [Green Version]
  49. Heredia-Guerrero, J.A.; Benãtez, J.; Domãnguez, E.; Bayer, I.S.; Ecingolani, R.; Eathanassiou, A.; Eheredia, A. Infrared and Raman spectroscopic features of plant cuticles: A review. Front. Plant Sci. 2014, 5, 305. [Google Scholar] [CrossRef] [PubMed] [Green Version]
  50. Hanlin, R.; Hrmová, M.; Harbertson, J.; Downey, M. Review: Condensed tannin and grape cell wall interactions and their impact on tannin extractability into wine. Aust. J. Grape Wine Res. 2010, 16, 173–188. [Google Scholar] [CrossRef]
  51. Bancuta, O.R.; Chilian, A.; Bancuta, I.; Ion, R.M.; Setnescu, R.; Setnescu, T.; Gheboianu, A.; Lungulescu, M. FT-IR and UV-VIS Characterization of grape extracts used as antioxidants in polymers. Rev. Roum. Chim. 2015, 60, 571–577. [Google Scholar]
  52. Fernández, K.; Agosin, E. Quantitative Analysis of Red Wine Tannins Using Fourier-Transform Mid-Infrared Spectrometry. J. Agric. Food Chem. 2007, 55, 7294–7300. [Google Scholar] [CrossRef]
  53. Ping, L.; Pizzi, A.; Guo, Z.D.; Brosse, N. Condensed tannins from grape pomace: Characterization by FTIR and MALDI TOF and production of environment friendly wood adhesive. Ind. Crop. Prod. 2012, 40, 13–20. [Google Scholar] [CrossRef]
  54. Boulet, J.; Williams, P.; Doco, T. A Fourier transform infrared spectroscopy study of wine polysaccharides. Carbohydr. Polym. 2007, 69, 79–85. [Google Scholar] [CrossRef]
  55. Kacuráková, M. FT-IR study of plant cell wall model compounds: Pectic polysaccharides and hemicelluloses. Carbohydr. Polym. 2000, 43, 195–203. [Google Scholar] [CrossRef]
  56. Williams, C.M. Dietary fatty acids and human health. Anim. Res. 2000, 49, 165–180. [Google Scholar] [CrossRef] [Green Version]
  57. Khurana, S.; Venkataraman, K.; Hollingsworth, A.; Piche, M.; Tai, T.C. Polyphenols: Benefits to the Cardiovascular System in Health and in Aging. Nutrients 2013, 5, 3779–3827. [Google Scholar] [CrossRef]
  58. Quiñones, M.; Miguel, M.; Aleixandre, A. Beneficial effects of polyphenols on cardiovascular disease. Pharmacol. Res. 2013, 68, 125–131. [Google Scholar] [CrossRef]
  59. Bahadoran, Z.; Mirmiran, P.; Azizi, F. Dietary polyphenols as potential nutraceuticals in management of diabetes: A review. J. Diabetes Metab. Disord. 2013, 12, 43. [Google Scholar] [CrossRef] [PubMed] [Green Version]
  60. Kim, S.K.; Kim, H.; Kim, S.A.; Park, H.K.; Kim, W. Anti-Inflammatory and Anti-Superbacterial Activity of Polyphenols Isolated from Black Raspberry. Korean J. Physiol. Pharmacol. 2013, 17, 73–79. [Google Scholar] [CrossRef]
  61. Nichols, J.A.; Katiyar, S.K. Skin photoprotection by natural polyphenols: Anti-inflammatory, antioxidant and DNA repair mechanisms. Arch. Dermatol. Res. 2009, 302, 71–83. [Google Scholar] [CrossRef] [PubMed] [Green Version]
  62. Jr, C.H.; Ross, C.F. Total Phenolic Content, Consumer Acceptance, and Instrumental Analysis of Bread Made with Grape Seed Flour. J. Food Sci. 2011, 76, S428–S436. [Google Scholar] [CrossRef]
  63. Florina, M.M.; Ramona, G.; Ersilia, A.; Mariana, P.A.; Melinda, O. Determination of the nutritional properties from grape seed flour. Curr. Opin. Biotechnol. 2013, 24, S115. [Google Scholar] [CrossRef]
  64. Chouchouli, V.; Kalogeropoulos, N.; Konteles, S.J.; Karvela, E.; Makris, D.P.; Karathanos, V.T. Fortification of yoghurts with grape (Vitis vinifera) seed extracts. LWT 2013, 53, 522–529. [Google Scholar] [CrossRef]
  65. Han, J.; Britten, M.; St-Gelais, D.; Champagne, C.P.; Fustier, P.; Salmieri, S.; Lacroix, M. Polyphenolic compounds as functional ingredients in cheese. Food Chem. 2011, 124, 1589–1594. [Google Scholar] [CrossRef]
  66. Marchiani, R.; Bertolino, M.; Belviso, S.; Giordano, M.; Ghirardello, D.; Torri, L.; Piochi, M.; Zeppa, G. Yogurt Enrichment with Grape Pomace: Effect of Grape Cultivar on Physicochemical, Microbiological and Sensory Properties. J. Food Qual. 2016, 39, 77–89. [Google Scholar] [CrossRef]
  67. Cappa, C.; Lavelli, V.; Mariotti, M. Fruit candies enriched with grape skin powders: Physicochemical properties. LWT 2015, 62, 569–575. [Google Scholar] [CrossRef]
  68. Tseng, A.; Zhao, Y. Wine grape pomace as antioxidant dietary fibre for enhancing nutritional value and improving storability of yogurt and salad dressing. Food Chem. 2013, 138, 356–365. [Google Scholar] [CrossRef]
  69. Lavelli, V.; Harsha, P.S.; Torri, L.; Zeppa, G. Use of winemaking by-products as an ingredient for tomato puree: The effect of particle size on product quality. Food Chem. 2014, 152, 162–168. [Google Scholar] [CrossRef] [PubMed]
  70. Ahn, J.; Grün, I.U.; Mustapha, A. Effects of plant extracts on microbial growth, color change, and lipid oxidation in cooked beef. Food Microbiol. 2007, 24, 7–14. [Google Scholar] [CrossRef]
  71. Carpenter, R.; O’Grady, M.; O’Callaghan, Y.; O’Brien, N.; Kerry, J. Evaluation of the antioxidant potential of grape seed and bearberry extracts in raw and cooked pork. Meat Sci. 2007, 76, 604–610. [Google Scholar] [CrossRef]
  72. Sasse, A.; Colindres, P.; Brewer, M.S. Effect of Natural and Synthetic Antioxidants on the Oxidative Stability of Cooked, Frozen Pork Patties. J. Food Sci. 2009, 74, S30–S35. [Google Scholar] [CrossRef]
  73. Shirahigue, L.D.; Contreras-Castillo, C.J.; Selani, M.M.; Nadai, A.P.; Mourão, G.B.; Gallo, C.R. Winery grape-residue extract: Effects on quality and sensory attributes of cooked chicken meat. Food Sci. Biotechnol. 2011, 20, 1257–1264. [Google Scholar] [CrossRef]
  74. Mielnik, M.; Olsen, E.; Vogt, G.; Adeline, D.; Skrede, G. Grape seed extract as antioxidant in cooked, cold stored turkey meat. LWT 2006, 39, 191–198. [Google Scholar] [CrossRef]
  75. Rababah, T.M.; Feng, H.; Yang, W.; Al-Mahasneh, M.; Ereifej, K.; Al-U’Datt, M. Effect of grape seed extracts on physico-chemical and sensory properties of goat meat cooked by conventional electric or microwave ovens. Food Sci. Technol. Res. 2012, 18, 325–332. [Google Scholar] [CrossRef] [Green Version]
  76. Tajik, H.; Aminzare, M.; Raad, T.M.; Hashemi, M.; Azar, H.H.; Raeisi, M.; Naghili, H. Effect of Z ataria multiflora Boiss Essential Oil and Grape Seed Extract on the Shelf Life of Raw Buffalo Patty and Fate of Inoculated L isteria monocytogenes. J. Food Process. Preserv. 2015, 39, 3005–3013. [Google Scholar] [CrossRef]
  77. Jung, Y.K.; Jung, S.; Lee, H.J.; Kang, M.G.; Lee, S.K.; Kim, Y.J.; Jo, C. Effect of High Pressure after the Addition of Vegetable Oil on the Safety and Quality of Beef Loin. Food Sci. Anim. Resour. 2012, 32, 68–76. [Google Scholar] [CrossRef] [Green Version]
  78. Da Porto, C.; Porretto, E.; Decorti, D. Comparison of ultrasound-assisted extraction with conventional extraction methods of oil and polyphenols from grape (Vitis vinifera L.) seeds. Ultrason. Sonochemistry 2013, 20, 1076–1080. [Google Scholar] [CrossRef]
  79. Sotiropoulou, E.I.; Varelas, V.; Liouni, M.; Nerantzis, E.T. Grape Seed Oil: From a Winery Waste to a Value Added Cosmetic Product-a Review. 2015. Available online: https://www.researchgate.net/publication/ (accessed on 20 April 2020).
Figure 1. Grape seed oils yields (%w/w) for main grape varieties tested.
Sustainability 13 05454 g001
Figure 2. Raman spectrum of Robola grape seed oil from Cephalonia.
Sustainability 13 05454 g002
Figure 3. LC-MS of polyphenolic fraction from wine by-products of the Robola variety.
Sustainability 13 05454 g003
Figure 4. Mean FTIR spectrum derived from Robola sample.
Sustainability 13 05454 g004
Figure 5. Mean Raman spectrum derived from Robola sample.
Sustainability 13 05454 g005
Figure 6. Spatial distribution of winery by-products in the Ionian Islands.
Sustainability 13 05454 g006
Table 1. Tentative identity of fatty acid profiles (% abundance) from characteristic wine by-products varieties of the Ionian Islands.
Fatty Acids Chemical Formula aAvgoustiatis (%)Kakotrygis (%)Mavrodaphne (%)Paul (%)Robola (%)Goustolidi (%)Sauvingnon Blanc (%)Tsaousi (%)Cabernet Sauvignon (%)
C12:00.04 ± 0.000.04 ± 0.010.04 ± 0.000.05 ± 0.000.03 ± 0.000.04 ± 0.000.03 ± 0.000.03 ± 0.000.03 ± 0.01
C14:00.23 ± 0.020.24 ± 0.010.27 ± 0.000.22 ± 0.000.17 ± 0.000.25 ± 0.010.16 ± 0.000.18 ± 0.000.25 ± 0.05
C15:00.05 ± 0.060.05 ± 0.020.05 ± 0.000.04 ± 0.000.03 ± 0.000.05 ± 0.000.03 ± 0.000.05 ± 0.000.03 ± 0.01
C16:014.4 ± 0.3214.97 ± 0.3115.03 ± 0.0514.13 ± 0.0613.4 ± 0.0915.34 ± 0.1112.47 ± 0.6012.86 ± 0.7914.23 ± 1.30
C17:00.09 ± 0.010.09 ± 0.030.09 ± 0.000.09 ± 0.000.09 ± 0.010.08 ± 0.010.12 ± 0.010.08 ± 0.010.09 ± 0.00
C18:05.06 ± 0.004.81 ± 0.004.49 ± 0.004.78 ± 0.004.78 ± 0.034.21 ± 0.017.70 ± 0.054.23 ± 0.036.39 ± 0.03
C20:00.10 ± 0.000.09 ± 0.000.09 ± 0.000.09 ± 0.000.09 ± 0.000.07 ± 0.010.16 ± 0.000.10 ± 0.000.13 ± 0.01
C14:10.03 ± 0.000.03 ± 0.000.03 ± 0.000.02 ± 0.000.01 ± 0.000.03 ± 0.000.02 ± 0.000.03 ± 0.000.01 ± 0.01
C15:10.04 ± 0.000.05 ± 0.000.05 ± 0.000.06 ± 0.000.04 ± 0.000.05 ± 0.000.05 ± 0.000.05 ± 0.000.04 ± 0.01
C16:10.58 ± 0.000.58 ± 0.000.66 ± 0.050.65 ± 0.060.61 ± 0.000.65 ± 0.030.26 ± 0.040.46 ± 0.050.40 ± 0.01
C17:10.10 ± 0.000.09 ± 0.000.10 ± 0.000.10 ± 0.000.08 ± 0.000.09 ± 0.000.09 ± 0.000.08 ± 0.010.08 ± 0.03
C18:122.87 ± 1.3322.45 ± 1.3825.27 ± 0.9922.52 ± 0.8324.29 ± 0.5921.74 ± 0.2817.55 ± 2.3720.44 ± 1.6018.42 ± 1.23
C20:10.15 ± 0.000.13 ± 0.000.12 ± 0.030.14 ± 0.000.15 ± 0.000.12 ± 0.000.18 ± 0.030.17 ± 0.050.15 ± 0.01
C16:20.00 ± 0.000.02 ± 0.000.02 ± 0.000.02 ± 0.000.01 ± 0.000.02 ± 0.000.03 ± 0.000.02 ± 0.000.02 ± 0.00
C18:256.19 ± 1.1056.35 ± 0.0253.28 ± 1.2457.05 ± 1.4059.26 ± 0.9157.26 ± 1.0860.82 ± 2.4560.95 ± 1.6559.66 ± 0.84
SFAs19.97 ± 0.0620.29 ± 0.0520.06 ± 0.0119.40 ± 0.0118.59 ± 0.0220.04 ± 0.0220.67 ± 0.0917.53 ± 0.1221.15 ± 0.20
MUFAs23.77 ± 0.2223.33 ± 0.2326.23 ± 0.1823.49 ± 0.1525.18 ± 0.1022.68 ± 0.1718.15 ± 0.2221.23 ± 0.2919.10 ± 0.22
PUFAs56.19 ± 0.5556.37 ± 0.0653.70 ± 0.3757.07 ± 0.3259.27 ± 0.6057.28 ± 0.5460.85 ± 0.8060.97 ± 0.8459.68 ± 0.60
a Results are given as mean ± SD.
Table 2. Antioxidant activity of grape seed oil extracts.
Total PhenolicsAntioxidant Activity
VarietyRegiona CTPCb DPPHc DPPHd ABTSe ABTS
Sauvignon BlancCephalonia24.17 ± 0.200.8956.26 ± 2.3092.75 ± 3.340.94
TsaousiCephalonia18.75 ± 0.190.9660.71 ± 2.6064.88 ± 1.270.64
RobolaCephalonia17.50 ± 0.090.6742.95 ± 1.6494.20 ± 3.490.96
RobolaZakynthos18.33 ± 0.120.8755.41 ± 3.9088.16 ± 2.140.89
GoustolidiZakynthos6.11 ± 0.191.0465.90 ± 3.2094.16 ± 3.880.96
RobolaCephalonia22.50 ± 0.151.0767.73 ± 3.1991.55 ± 3.460.93
RobolaCephalonia13.28 ± 0.130.9560.17 ± 3.5797.63 ± 3.941.00
RobolaCephalonia20.83 ± 0.150.9861.88 ± 2.1295.15 ± 3.260.97
RobolaCephalonia30.00 ± 0.141.0063.57 ± 3.6994.60 ± 3.340.96
MavrodaphneCephalonia29.17 ± 0.090.6843.21 ± 2.0994.55 ± 3.120.96
RobolaCephalonia10.56 ± 0.080.7749.31 ± 2.1289.44 ± 2.540.91
RobolaCephalonia22.22 ± 0.100.7849.86 ± 2.6792.91 ± 3.220.95
AvgoustiatisZakynthos18.33 ± 0.120.7145.14 ± 2.5592.87 ± 3.140.94
PaulZakynthos35.00 ± 0.190.8855.56 ± 3.2991.75 ± 3.690.93
Avgoustiatis, SkiadopoulosZakynthos40.00 ± 0.200.7950.14 ± 3.6490.91 ± 3.050.92
Avgoustiatis, KatsaliZakynthos37.50 ± 0.130.7748.75 ± 2.6792.03 ± 3.240.94
KakotrygisCorfu19.17 ± 0.120.8755.42 ± 2.4093.85 ± 3.670.96
Cabernet SauvignonCorfu46.67 ± 0.100.8654.58 ± 2.1391.62 ± 3.160.93
SyrahCorfu18.33 ± 0.090.8855.69 ± 2.0990.07 ± 3.100.91
MatzaviCorfu16.67 ± 0.050.8855.97 ± 1.3086.43 ± 2.880.88
RobolaCorfu22.50 ± 0.120.8252.22 ± 1.2288.81 ± 3.090.90
Moschato whiteCorfu15.83 ± 0.160.7447.22 ± 2.4388.95 ± 2.490.90
MavrodaphneCephalonia24.17 ± 0.060.8855.56 ± 2.7793.01 ± 2.390.95
Avgoustiatis, PyrarnisZakynthos30.83 ± 0.090.6743.06 ± 1.3187.97 ± 2.190.89
VertzamiLefkada28.33 ± 0.050.6943.75 ± 2.3988.81 ± 2.880.90
VardeaLefkada35.83 ± 0.160.7950.00 ± 2.4989.37 ± 2.610.91
Pavlos, Cardinal, ZambellaZakynthos18.33 ± 0.120.7245.69 ± 2.6189.65 ± 2.770.91
a CTPC (mg mL−1) ± SD: concentration of TPC expressed as mg GAE mL−1 of extract. b DPPH (mg Trolox g−1): the inhibition of free radical DPPH expressed as mg Trolox equivalents g−1 dry weight. c DPPH: (I %) ± SD: the % inhibition of free radical DPPH. d ABTS (I %) ± SD: the % inhibition of free radical ABTS. e ABTS (mg Trolox g−1): the inhibition of free radical ABTS expressed as mg Trolox equivalents g−1 dry weight.
Table 3. Tentative identity of major polyphenols from characteristic wine by-products varieties of the Ionian Islands.
Peak RtUV-Vis[M-H]-[M-H]-Tentative IdentityRobolaAvgoustiatisMavrodaphnePaulCabernet SauvignonKakotrygisGoustolidi
7.4274146148cinnamic acid++++-++
9.5215; 270168170gallic acid++++++++++++
13.5217330332monogaloglucose++++--++
14.8218; 278576578procyanidin dimer++++++++
15.0217; 277576578procyanidin dimer+++++-++
15.3278577578procyanidin dimer+++++-++
15.5286; 328310312caftaric acid++-+--+++
15.9218; 277865866procyanidin trimer+++++-++
16.4220; 279576578procyanidin dimer+++++-++
16.8220; 277576578procyanidin dimer+++++-++
17.3278288290catechin+++++++++++
17.8278; 375576578procyanidin dimer++++++++
18.3223; 271443442epicatechin gallate++++++++
19.1219; 278865866procyanidin trimer+++++-++
19.2222; 278865866catechin trimer++++-++
19.3222; 278576578procyanidin dimer+++++++
20.5278288290epicatechin++++++++
25.0226163164p-coumaric acid+-+---+
30.5225; 354476478quercetin-3-glucuronide +++-+-+
31.1226; 355609610rutin++++---++
33.5264; 348446448kaempferol-7-O-glucoside+++++-++
34.2265; 349446448kaempferol-3-O-galactoside++++++-+++
34.4226; 350477448isorhamnentin-3-O-glycoside+++++-+-++
37.7373301302quercetin++++---+
Table 4. TPC and antioxidant activity of grape skin extracts.
Total PhenolicsAntioxidant Activity
VarietyWinery/ProducerRegiona CTPCb AARc DPPHd ABTS e ABTS
Sauvignon BlancGentiliniCephalonia10.56 ± 0.010.6029.55 ± 0.5724.49 ± 1.1842.16
TsaousiGentiliniCephalonia14.72 ± 0.010.7833.11 ± 0.6332.30 ± 1.4355.68
RobolaGentilini/FagiasCephalonia25.00 ± 0.020.7021.42 ± 1.0455.52 ± 0.8595.88
RobolaGrapsasZakynthos15.13 ± 0.011.1440.72 ± 1.3360.44 ± 1.29104.39
GoustolidiGrapsasZakynthos16.11 ± 0.010.9042.73 ± 0.6577.28 ± 0.86133.55
RobolaGentilini/KokkinopiliaCephalonia30.28 ± 0.020.6519.94 ± 0.0763.86 ± 0.28110.33
RobolaGentiliniCephalonia28.00 ± 0.011.0531.16 ± 0.3698.04 ± 0.14169.49
RobolaGentilini/XalkiasCephalonia28.61 ± 0.010.8625.93 ± 0.8886.94 ± 0.29150.28
RobolaGentilini/ValsamataCephalonia33.33 ± 0.020.5316.75 ± 0.4658.74 ± 1.05101.45
MavrodaphneTavlianatosCephalonia28.89 ± 0.011.2035.20 ± 1.0797.06 ± 1.33167.79
RobolaGentilini/LianosCephalonia10.56 ± 0.010.4614.87 ± 0.4443.35 ± 3.8474.82
RobolaGentiliniCephalonia22.22 ± 0.010.7923.89 ± 0.9871.37 ± 2.20123.32
AvgoustiatisGrapsasZakynthos21.29 ± 0.010.8826.39 ± 0.0970.67 ± 0.24122.11
PaulGrapsasZakynthos32.22 ± 0.031.0430.72 ± 0.5485.31 ± 2.15147.46
Avgoustiatis, SkiadopoulosKallinikosZakynthos15.30 ± 0.011.4336.57 ± 0.5390.07 ± 0.90155.69
Avgoustiatis, KatsaliKallinikosZakynthos18.67 ± 0.011.1533.99 ± 0.2686.80 ± 0.83150.04
KakotrygisTheotokisCorfu22.64 ± 0.011.1433.70 ± 0.4675.52 ± 0.76130.51
Cabernet SauvignonTheotokisCorfu32.60 ± 0.011.4742.73 ± 1.2091.09 ± 2.47157.46
SyrahTheotokisCorfu18.40 ± 0.010.4015.89 ± 0.0946.37 ± 0.7680.05
MatzaviTheotokisCorfu16.99 ± 0.010.5318.87 ± 1.0454.35 ± 2.0893.86
RobolaTheotokisCorfu16.74 ± 0.010.8827.69 ± 1.0586.29 ± 0.89149.15
Moschato whiteTheotokisCorfu13.30 ± 0.010.4419.43 ± 0.5967.61 ± 1.98116.81
MavrodaphneGentiliniCephalonia29.36 ± 0.011.4322.17 ± 0.2262.37 ± 1.09 1.014 ± 1.04107.75
Avgoustiatis, PyrarnisGentiliniZakynthos27.36 ± 0.011.2238.10 ± 0.1498.62 ± 1.14170.50
VertzamiRobotisLefkada29.10 ± 0.011.7929.79 ± 0.0990.60 ± 0.46156.61
VardeaRobotisLefkada35.67 ± 0.020.4819.23 ± 0.4771.34 ± 4.03123.27
Pavlos, Cardinal, ZambellaMerkatisZakynthos26.55 ± 0.020.5724.83 ± 0.5565.29 ± 1.52112.80
a CTPC (mg mL−1) ± SD: concentration of TPC expressed as mg GAE mL−1 of extract. b AAR: AAR expressed as μmol of DPPH g−1 of dry weight. c DPPH (mg Trolox g−1): the inhibition of free radical DPPH expressed as mg Trolox equivalents g−1 dry weight. d ABTS (I %) ± SD: the % inhibition of free radical ABTS. e ABTS (mg Trolox g−1): the inhibition of free radical ABTS expressed as mg Trolox equivalents g−1 dry weight.
Table 5. Correlations between TPC and antiradical activity methods.
Variablesa CTPCb AARc DPPHd ABTSe ABTS
a CTPC10.7620.7030.7700.770
b AAR0.76210.6860.6320.632
c DPPH0.7030.68610.4760.476
d ABTS0.7700.6320.47611.000
e ABTS0.7700.6320.4761.0001
a CTPC (mg mL−1): concentration of TPC expressed as mg GAE mL−1 of extract. b AAR: AAR expressed as μmol of DPPH g−1 of dry weight. c DPPH (mg Trolox g−1): the inhibition of free radical DPPH expressed as mg Trolox equivalents g−1 dry weight. d ABTS (I %): the % inhibition of free radical ABTS. e ABTS (mg Trolox g−1): the inhibition of free radical ABTS expressed as mg Trolox equivalents g−1 dry weight.
Table 6. Main peaks of the FTIR spectrum derived from Robola sample.
Wavelengths (cm−1)Functional GroupPeak PerformanceAssignmentReference
~3457O-HSugarsStretching[47,48,49]
~3384C-N ProteinsStretching[47]
~2939C-H (-CH2)LipidsSymmetrical Stretching[47,48]
~2896C-H (-CH2)LipidsAsymmetric Stretching[47,48]
~1745C=O; -COOR Pectins; Triglyceride ester linkages; Amide IStretching[47,50]
~1651C=O; -COOTriglyceride ester linkagesAsymmetric Stretching[50]
~1527C-N; Ν-HProteins; Amide IIStretching, Bending[47]
~1456C-N; -CH2Amide III, LipidsStretching, Bending[47]
~1362-CH3LipidsSymmetrical bending[47]
~1278C-O-CLipidsAsymmetric Stretching[47]
~1150C-O; C-O-CPolysaccharides; CoutinStretching[49]
~1118C-O-C Sugars; PolysaccharidesStretching[48]
~790C-CLipidsStretching[49]
~720-CH2-SugarsSwing[49]
~633C-H Aromatic ringBending[51,52]
Table 7. Main peaks of the Raman spectrum derived from Robola sample.
Wavelengths (cm−1)Functional GroupPeak PerformanceAssignmentReference
~673C=OMonosubstituted benzeneDeformation[51,52]
~786C-C; -CH2n—substituted benzeneBending[52]
~819-CH2n—substituted benzeneBending[52]
~850C-CAlkaneBending[51]
~924C-CH3Alkanes off plane bendingBending[53,54]
~975C-CH3AlkaneBending[54,55]
~1058BenzeneDisubstituted benzene derivativesBending[53,54]
~1112C-C; C-OSugarBending[53]
~1364C-H; -CH3; -OH,Alkanes, PhenolsStretching[48]
~1466C-H; -CH3; C=CAlkanes, PhenolsStretching[48]
~1628C=CAlkene, Aromatic ringBending[48]
~1849C=O5-membered cyclic anhydridesBending[48]
Table 8. Mass balance of winery by-products from the Ionian Islands.
Ionian IslandsVarietyAnnual Production (tn)Grape Pomace (tn) aGrape Seeds (tn) aGrape Skins (tn) aGrape Seeds Oil Yield (L)
ZakynthosPavlos10.910 ± 0.291.091 ± 0.030.592 ± 0.020.499 ± 0.0147.498 ± 1.26
Avgoustiatis72.660 ± 1.966.771 ± 0.184.441 ± 0.122.331 ± 0.06356.224 ± 9.61
Robola5.030 ± 0.030.585 ± 0.000.339 ± 0.000.246 ± 0.0027.209 ± 0.16
Goustolidi10.865 ± 0.351.337 ± 0.040.426 ± 0.010.912 ± 0.0334.141 ± 1.10
Savvatiano5.750 ± 0.100.528 ± 0.010.187 ± 0.000.179 ± 0.0014.968 ± 0.26
CorfuRobola22.220 ± 0.092.136 ± 0.010.624 ± 0.000.760 ± 0.0050.045 ± 0.20
Cabernet Sauvignon4.556 ± 0.020.370 ± 0.000.218 ± 0.000.152 ± 0.0017.460 ± 0.08
Kakotrygis17.794 ± 0.281.191 ± 0.020.733 ± 0.010.458 ± 0.0158.833 ± 0.93
CephaloniaSauvignon Blanc0.800 ± 0.020.119 ± 0.000.042 ± 0.000.077 ± 0.003.398 ± 0.08
Tsaousi57.379 ± 2.36.539 ± 0.264.518 ± 0.182.022 ± 0.08362.384 ± 14.53
Robola393.573 ± 1.645.501 ± 0.1833.846 ± 0.1411.656 ± 0.052715.025 ± 11.04
Goustolidi38.245 ± 0.843.392 ± 0.072.218 ± 0.051.174 ± 0.03177.925 ± 3.91
Mavrodaphne61.415 ± 1.235.747 ± 0.122.533 ± 0.051.992 ± 0.04203.179 ± 4.07
LefkadaVardea71.654 ± 1.096.445 ± 0.105.605 ± 0.090.840 ± 0.01449.603 ± 6.84
Vertzami266.014 ± 3.227.702 ± 0.3317.168 ± 0.2110.534 ± 0.131377.140 ± 16.57
a Dry mass balance.
Publisher’s Note: MDPI stays neutral with regard to jurisdictional claims in published maps and institutional affiliations.

