Article

Urban Flood Risk and Economic Viability Analyses of a Smart Sustainable Drainage System

1
CERIS, Instituto Superior Técnico, Department of Civil Engineering, Architecture and Georesources, University of Lisbon, 1049-001 Lisbon, Portugal
2
School of Engineering, Arts, Science and Technology, University of Suffolk at Suffolk New College, Ipswich IP4 1QJ, UK
*
Author to whom correspondence should be addressed.
Sustainability 2021, 13(24), 13889; https://doi.org/10.3390/su132413889
Submission received: 18 November 2021 / Revised: 12 December 2021 / Accepted: 13 December 2021 / Published: 15 December 2021

Abstract

:
Urban drainage systems are in transition from functioning simply as a transport system to becoming an important element of urban flood protection measures providing considerable influence on urban infrastructure sustainability. Rapid urbanization combined with the implications of climate change is one of the major emerging challenges. The increased concerns with water security and the ageing of existing drainage infrastructure are new challenges in improving urban water management. This study carried out in the Seixal area in Portugal examines flood risk analyses and mitigation techniques performed by computational modelling using MIKE SHE from the Danish Hydraulic Institute (DHI). Several scenarios were compared regarding flood risk and sustainable urban drainage systems (SuDS) efficiency. To obtain a more accurate analysis, the economic viability of each technique was analyzed as well through (i) life cost analysis and (ii) taking into account the damages caused by a certain type of flood. The results present that the best scenario is the one that will minimize the effects of great urbanization and consequently the flood risk, which combines two different measures: permeable pavement and detention basin. This alternative allows us to fully explore the mitigation capacity of each viable technique, demonstrating a very important improvement in the flood mitigation system in Seixal.

1. Introduction

Flood is a very common type of natural disaster in most of the urban areas around the world and particularly Europe [1]. The development of urban areas through the rapid flow of urbanization continuously expands the impervious surfaces that are directly increasing the runoff depth and hence flood volume. It also generates some new challenges related to sustainability such as environmental degradation, energy intensity and carbon emissions. The United Nations reports that the world’s population will nearly double by 2050 compared to 2018 [2,3]. At the same time, Europe’s urbanization is expected to increase to approximately 83.7% by 2050 [4]. Whilst in most parts of the world urban population increase occurs faster or at the same rate as land consumption, in Europe and Northern America, more lands have been consumed to accommodate the growing population [2]. It is expected that cities will face resource distribution challenges associated with an increase in the population flow, energy issues due to the reduction of fossil fuel resources, escalation maintenance and management costs due to ageing infrastructure and improper land resource utilization. These facts combined with climate change likely increase the risk of floods. Currently, the carbon emission is still at a very high level and there is no chance that it can be halted in near future. The recent conference of parties (COP26) depicted a clearer way towards climate adaptation and carbon reduction through the Glasgow Climate Pact; the first-ever climate deal to explicitly plan to reduce coal, more urgent emission cuts and more financial support for developing countries to help them adapt to climate impacts [5]. Innovative and new sustainable systems are essential to accelerate the carbon cut and improve adaptation strategies. Many pieces of research have focused on strategies to mitigate the climate change issues using different techniques, e.g., renewable energy storage/generation [6]. Although the COP26 was promising by achieving some great agreements to cope with climate challenges, in the best scenario there will be a long period of worsening the climate issues that adaptation to the ever-changing situations seems to be the only available option. In that sense, all the climate change research centres around the world agree that precipitation patterns will change in future, which will have severe rainfall changes in parts of the world such as higher precipitation with greater intensity that highlights the risk of the flood. In addition to that, the sea level rises in most parts of the world increase the risk of coastal waves and flooding. Therefore, flooding can occur as a consequence of high rainfall intensity in the catchment area, insufficient storm drainage capacity, river overflows, storm surge or as a combination of these phenomena [7,8,9,10,11,12,13].
Overall, the risks of flooding are expected to be amplified and sustainable solutions such as sustainable urban drainage systems (SuDS) are quite vital to enhance infrastructure resilience and to support a solid adaptation strategy. The use of SuDS can reduce urban surface water flooding as well as the pollution impact of urban discharges on receiving waters [14,15,16,17]. SuDS are more sustainable than conventional drainage techniques, offering benefits such as attenuation of runoff before concentration, improvement of water quality, maintenance of groundwater recharge rates through infiltration and minimization of flood impacts on the environment. In urban areas where many surfaces are sealed by buildings and paving, natural infiltration is limited. Instead, drainage networks consisting of pipes and culverts divert surface water to local watercourses. In some cases, this has resulted in downstream flooding and deterioration in river water quality caused when foul sewers are overwhelmed by surface water leading to a release of dirty water into rivers [18,19,20,21]. Drainage systems need to adapt to and manage extreme events including flooding and periods of drought while helping to reduce carbon emissions. Storage of runoff within a SuDS system is essential for providing the extended detention of flows for water quality treatment, as well as for peak flow attenuation of larger flows for flood protection downstream of the site. Runoff storage can be provided within an on-site system through the use of structural controls and/or non-structural features and landscaped areas [22,23,24,25].
Attenuation storage is used to store runoff to enable a reduction in the peak discharge from the site. Retention storage facilities are designed to contain a permanent pool of water (in stormwater ponds and wetlands) which are used to provide water quality treatment. The differences between a conventional drainage system and a sustainable drainage system are shown in Figure 1.
It is important to determine which SuDS techniques are best suited to the proposed land use of the area draining to the system. The construction industry research and information association (CIRIA) presents the following criteria for SuDS [26]:
  • Land use characteristics.
  • Site characteristics.
  • Catchment characteristics.
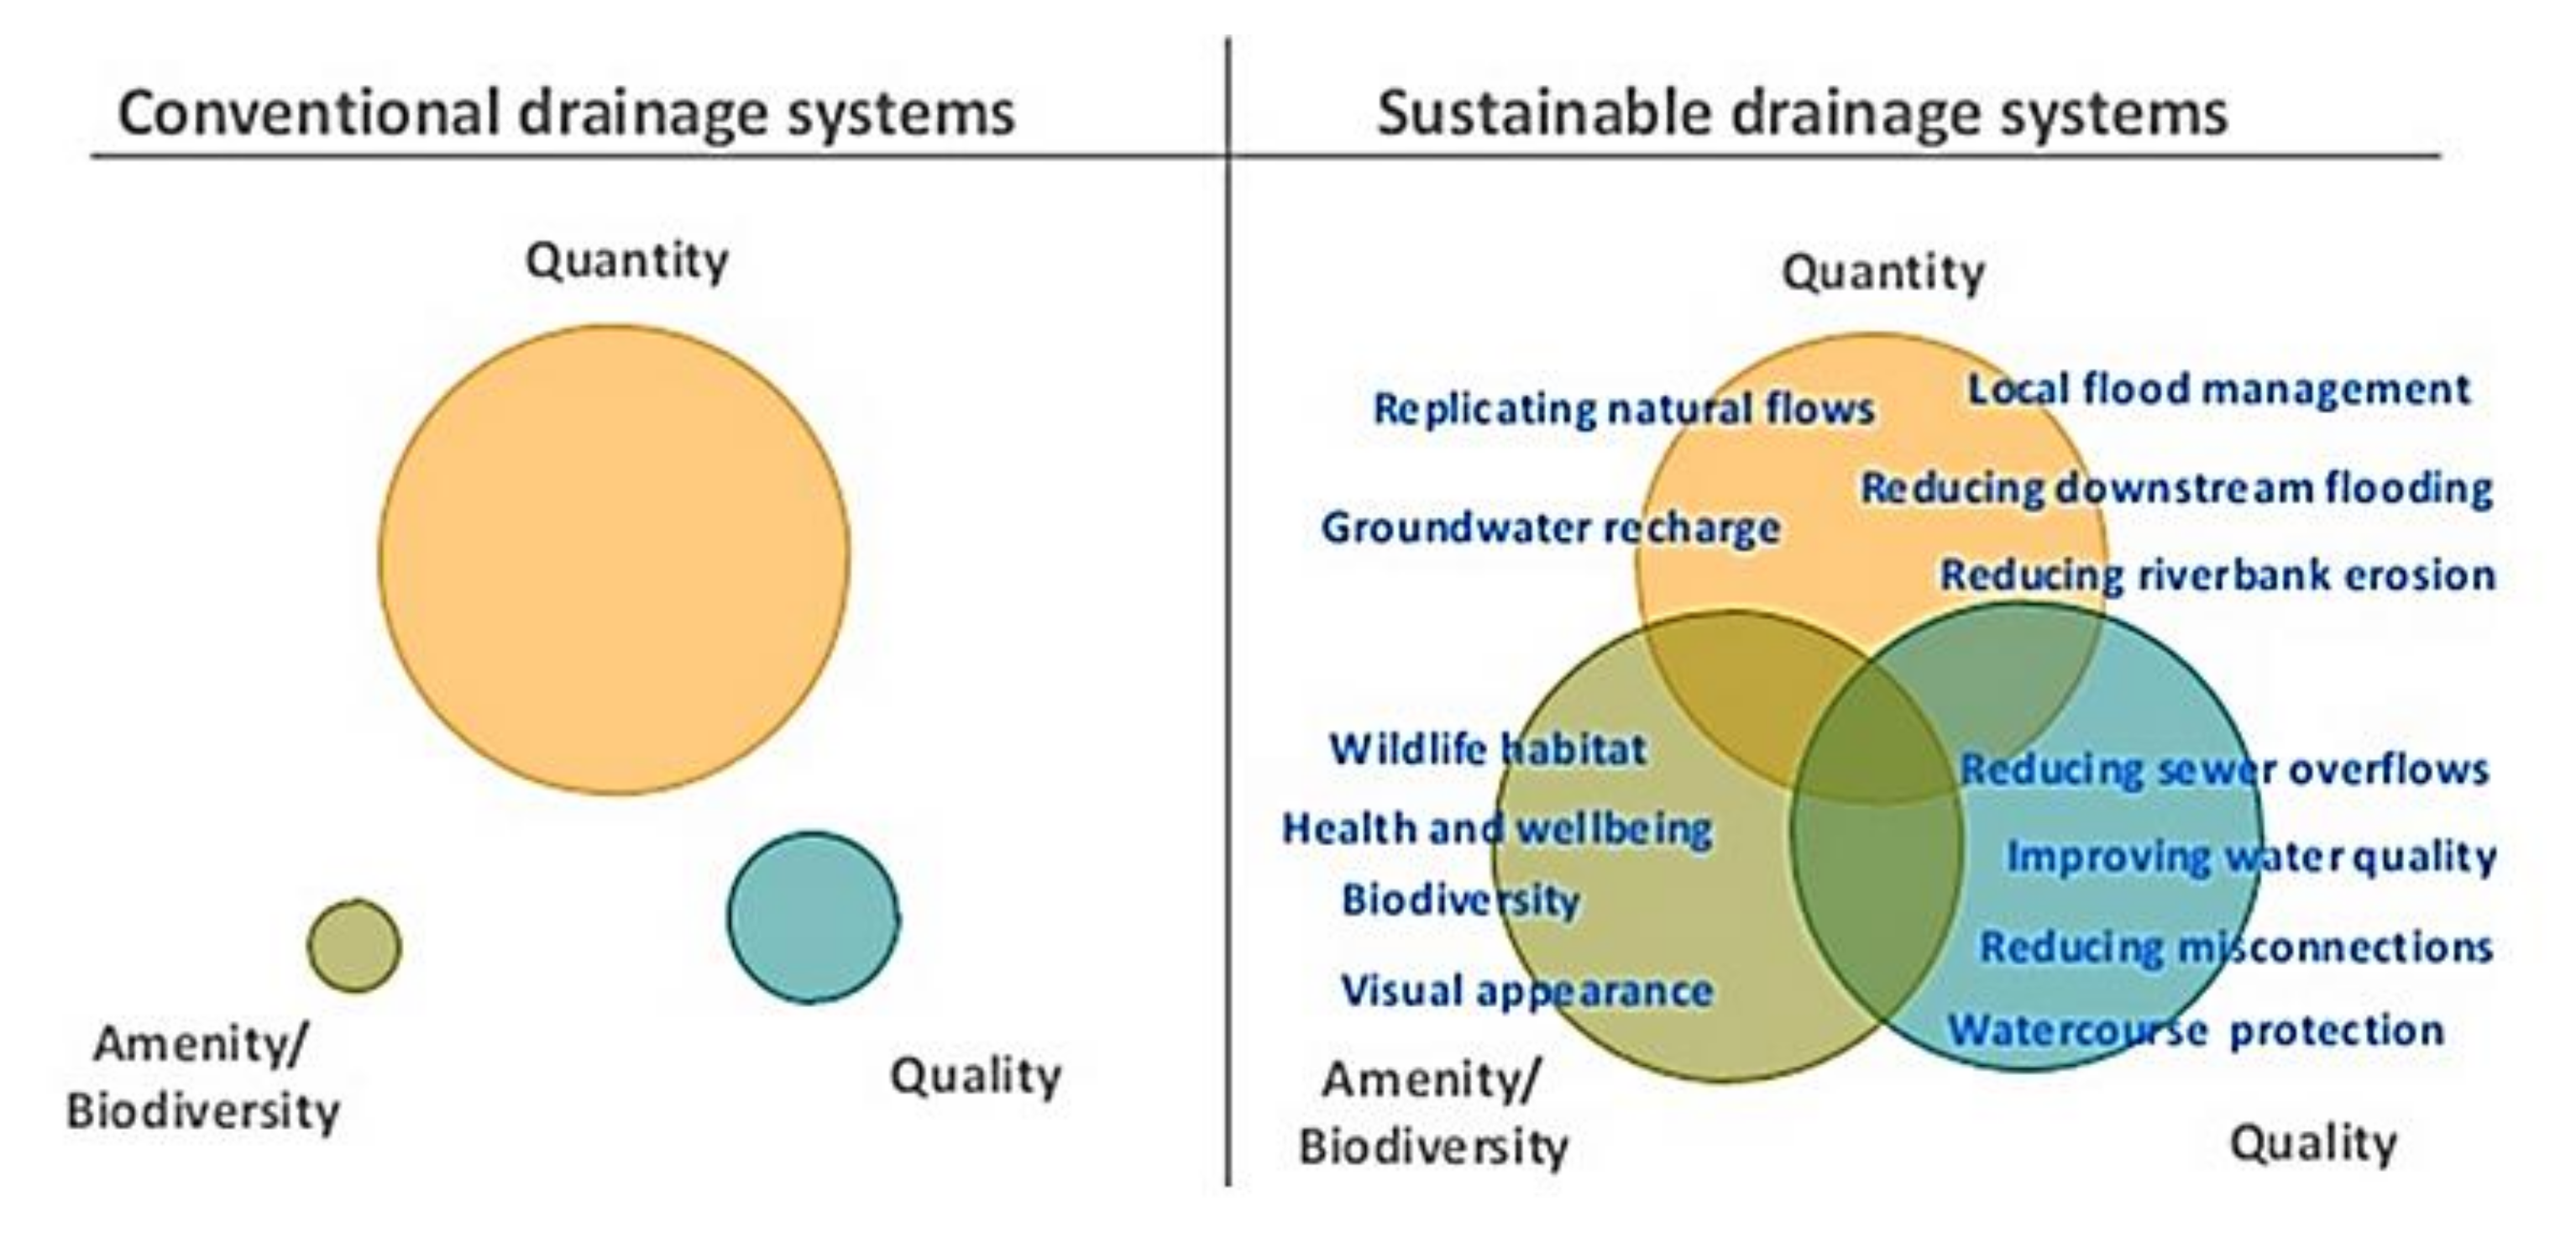
  • Quantity and quality performance.
  • Amenity and environmental necessities.
SuDS may be divided into the following components: source control; swales and conveyance channels; filtration; infiltration; retention and detention; wetlands and inlet/outlet/control structures.
Having discussed the existing challenges and possible solutions, the main objectives of this research are to give an overview of urban water issues and smart water management and also to provide information about the possible implementation of sustainable urban drainage systems towards more sustainable water management. To achieve these objectives, an analysis is performed by including a case study and a model simulation using MIKE SHE [27], which allows demonstrating the benefits of these innovative and sustainable systems. This research presents the susceptibility to flooding risk related to the old city centre of Seixal in Portugal and methods to prevent these extreme events in the area using SuDS and a cost/benefit analysis of solution implementation.

2. Simulation Model

MIKE SHE is a physically based model, based on physical laws, which are derived from forms of the laws of conservation of mass, momentum, and energy. The evapotranspiration model is calculated using the Kristensen and Jensen methods, although user input reference ET can be calculated in numerous ways [28,29,30,31,32,33,34]. Channel flow is handled using one-dimensional (1-D) diffusive wave Saint Venant equations and overland flow is calculated using two-dimensional (2-D) diffusive wave Saint Venant equations. Water infiltrating into the unsaturated zone can be modelled using the 1-D Richards flow or gravity flow. The saturated zone is modelled using a three-dimensional (3-D) Boussinesq equation which uses finite difference methods to solve the partial differential equations.
S f x = S 0 x h x u g u x 1 g u t q u g h
S f y = S 0 y h y v g v y 1 g v t q v g h
In the x direction, this reduces to:
S f x = S 0 x h x
where Sfx is the friction slope, S0x is the ground slope, h is the flow depth above the ground surface and x is the direction of flow.
Simplifying slope, the original equation in the x direction reduces to:
S f x = z g x h x
MIKE SHE allows the user to pick one of two methods to calculate flow in the saturated zone module of the model, i.e., a three-dimensional finite difference method and a linear method. In this study, the three-dimensional finite difference method was selected and will be discussed. The finite difference method takes advantage of Darcy’s law and continuity with a similar approach using finite difference techniques. It is calculated in three dimensions and can use a preconditioned conjugate gradient (PCG), where sources and sinks interact with the saturated zone either implicitly or explicitly in the 3-D partial differential equation given as:
x K x x h x + y K y y h y + z K z z h z L = S h t
where x, y, z are unique axes in the Cartesian coordinate system [L], Kxx, Kyy, and Kzz are hydraulic conductivities along the x, y, and z axes [LT−1], h is the hydraulic head [L], L is the sink/source term [T−1] and S is the specific storage coefficient [L−1].
Two special features should be noted in the above equation. First, the equation is nonlinear when the flow is confined. Second, the storage coefficient switches between the specific storage coefficient when confined and the specific yield for unconfined conditions.

3. Methodology

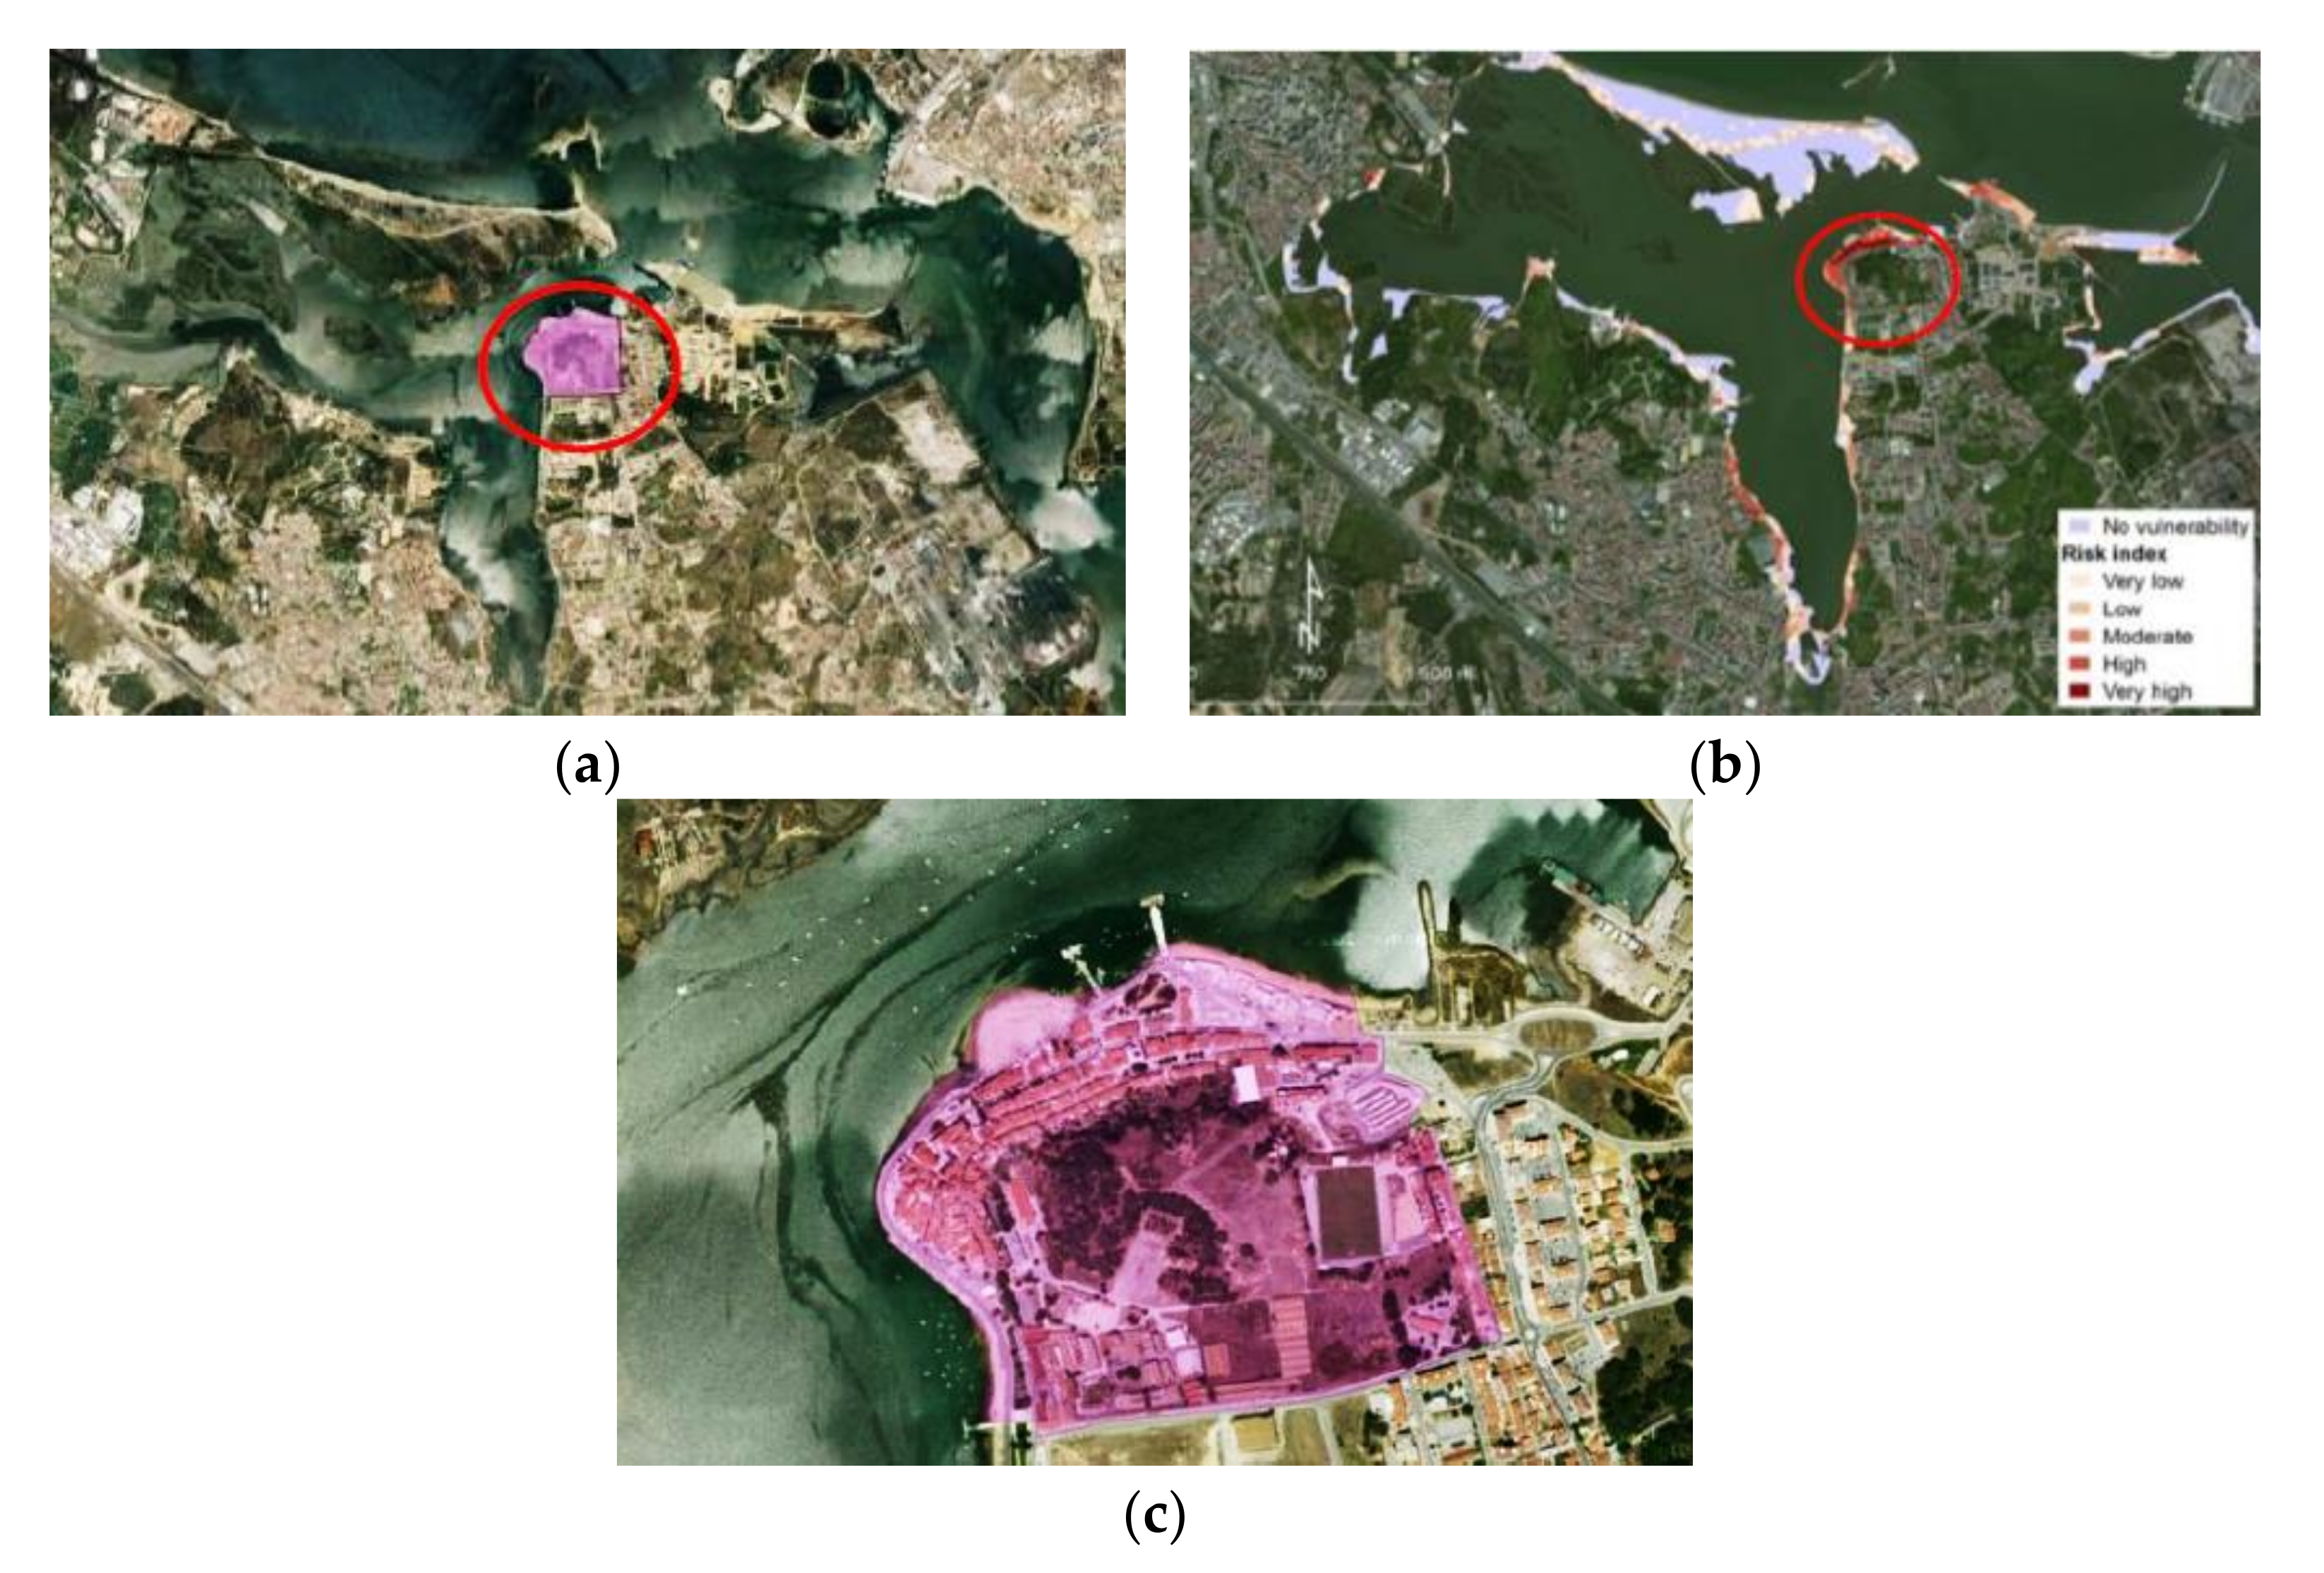
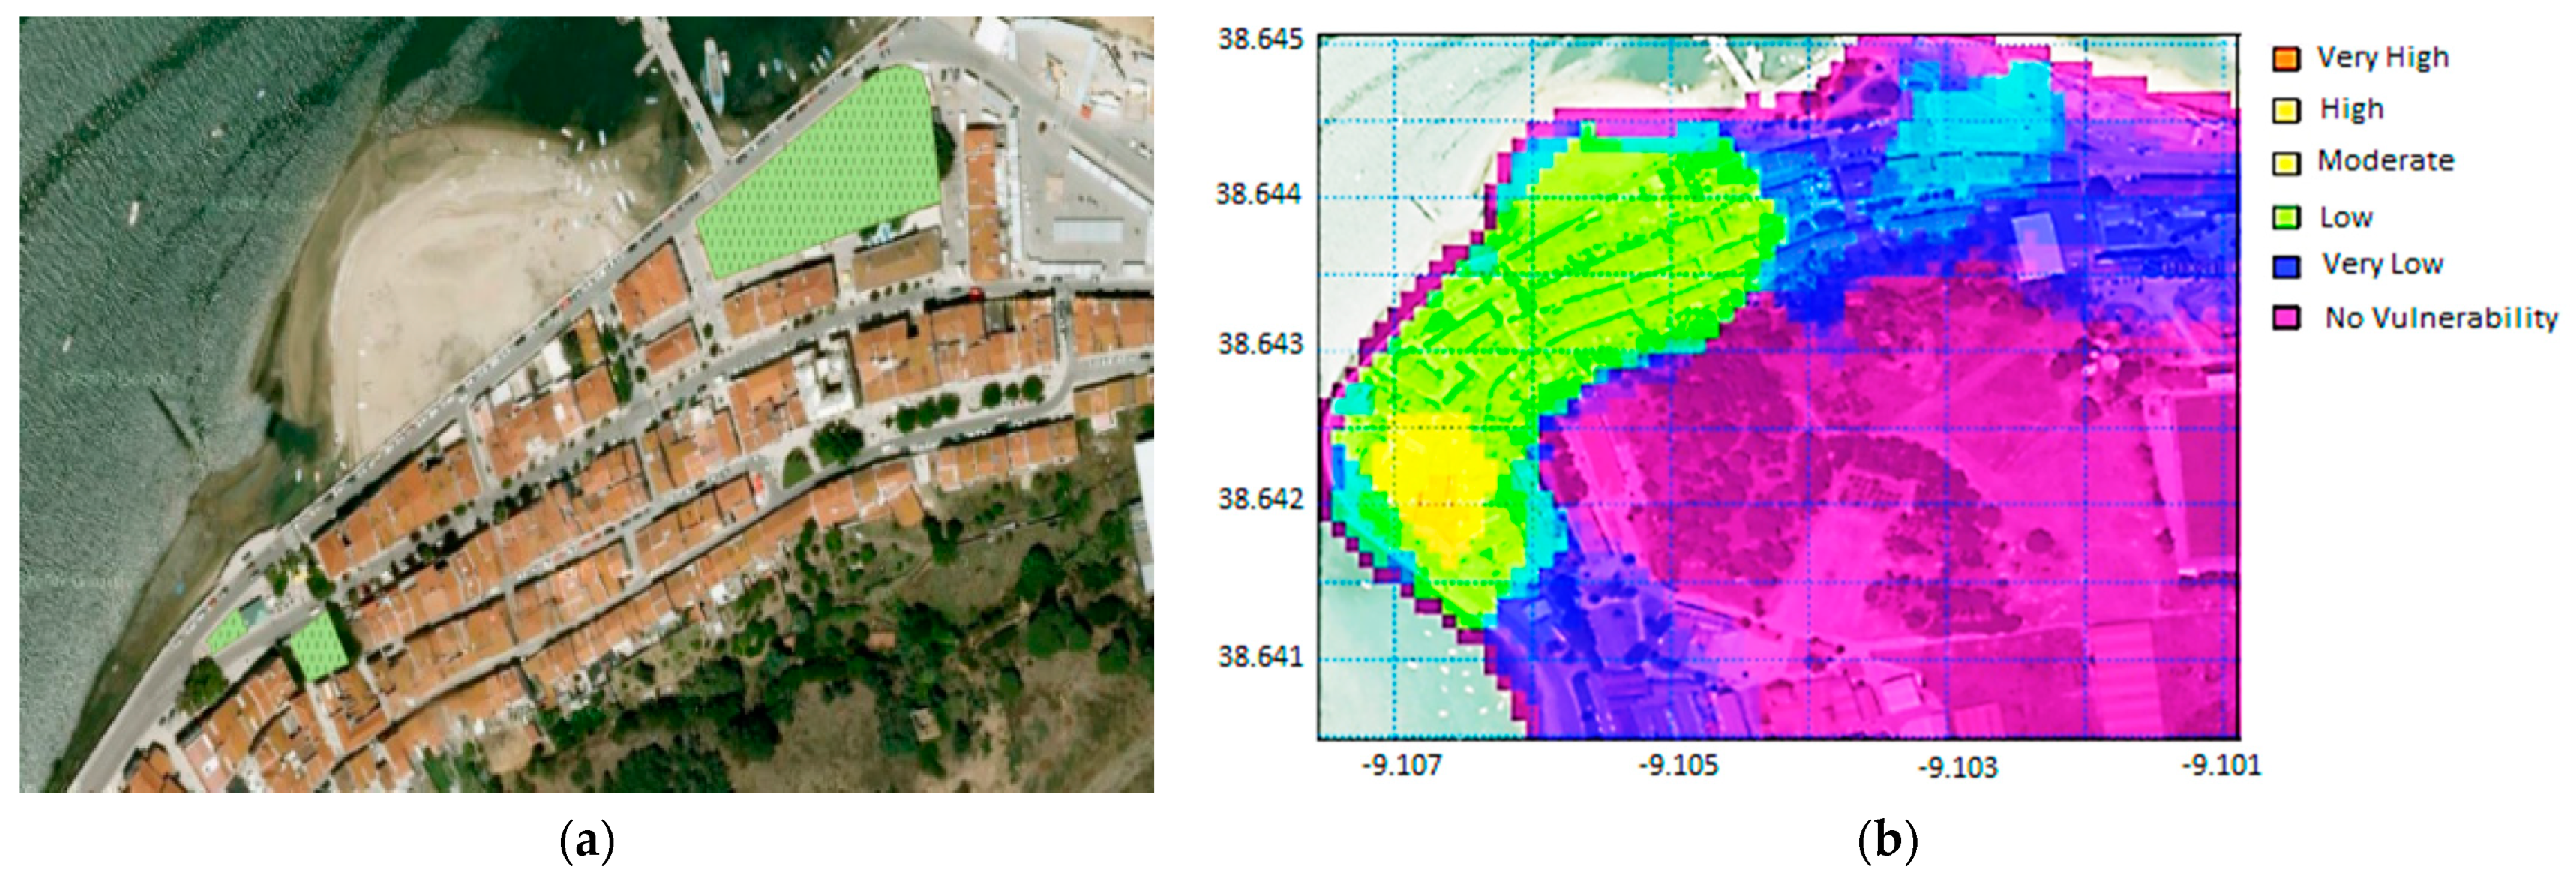
3.1. Description of the Cases Study

The Tagus estuary has a high potential for flooding from different sources along its margins, due to the intense occupation. This study was conducted in a restricted area (Figure 2) located in the south-eastern margin of the estuary, which was selected due to a record of flood episodes and relatively diverse land use occupation, with a total area of 491,127 m2 and 1170 m of margin length. The territorial occupation of this area is associated with relevant industrial sites that were built in Seixal (steel industry). Due to this important industrial presence, urban areas grew nearby. Currently, some management territorial plans indicate the intention of transforming a large part of these industrial sites into urban areas (which includes residential, services and logistics facilities) (Figure 2).
Marginal flooding in the Tagus estuary can have adverse effects. Some urbanized marginal areas, such as Seixal, are low-lying so that the potential human and material costs of a flood are high. One of the most severe historic episodes described was originated by the combination of extreme storm surge levels, locally generated waves on 15 February 1941 and a windstorm, causing high human casualties and property damages along the estuarine margins. The ongoing rise in the sea level affects tidal propagation and circulation in estuaries, and these changes can have far-reaching consequences on the sediment dynamics, water quality and extreme water levels. The increasing of the population is also causing a major impact, the induced erosion may cause accelerated siltation and the urbanization will increase the runoff.
The consequences will be the growth of water’s turbidity, the acceleration of sedimentation and the spread of silts, muds and clay throughout the estuary, which leads to a major vulnerability of its margins.

3.2. Model Validation and Testing

MIKE SHE allows users to easily visualize the parameters that are being introduced and to create output image data. Regarding the background, in order to place the visual data at the geographic site, a georeferenced Google satellite image of the study area was used. The QGis 2.12.0 tool was used to create a readable image by MIKE SHE, which allows georeferencing a normal Google satellite image with the Google Open Layers plugin. This is necessary since MIKE SHE uses georeferenced inputs such as shapefiles and grid files. Every input and output data is shown over this image, giving the geographic information [35,36,37].
In the foreground, a polygon shapefile of the study area was created with the QGIS 2.12.0 tool. The shape acts as a boundary within which every calculation is made. This appears represented in every output image given by the software and allows the user to study a specific area. One of the necessary inputs to define the simulation is the duration of the simulation and the time step period. The simulation period chosen was 2 months. The time steps used in the model for efficient simulation were initial unsaturated zone time step 6 (h); maximum unsaturated zone time step (1 h); maximum saturated zone time step (4 h); maximum overland flow time step (1 h).
The meteorological data consisted of three main inputs: precipitation rate, net rainfall fraction and infiltration fraction. The precipitation rate was set as uniform and with a constant temporal distribution. The value assumed was 3.5 mm/day (i.e., average precipitation in the rainiest month, November). It was considered that precipitation was equally distributed in the study area and only 10% of the rain was infiltrated. The digital elevation model (DEM) that was acquired with a 7.5 arcsecond resolution GeoTIFF data (with an RMSE range between 26 and 30 m) was converted into a point file suitable for MIKE SHE using QGIS 2.12.0. The elevations in the point file were triangularly interpolated into a 10 by 10 m resolution inside MIKE SHE. Figure 3a shows the topography as it appears in MIKE SHE in the study area. The MIKE SHE model was run under various land management scenarios to investigate the effect that land use has on the hydrological model. There are two main land uses in the study area: green areas (Figure 3b) and paved areas (Figure 3c).
Several simulations were analyzed and performed in order to verify if the outputs given by the MIKE SHE model were identical to the flood data registered in the study area. Modelled flood outputs from these simulations were compared and adapted to real and observed conditions. The results showed that the model simulates flooding identical to the real flood in the area. After the model definition, it was possible to start the scenario simulation for each SuDS alternative.
The study area is a built-up area among the most densely inhabited around the estuary’s margins. The area totals 672,016 inhabitants in 670.39 km2. For this study, it was considered as a residential and commercial area. It was determined whether any site characteristics may restrict or preclude the use of a particular SuDS technique. The area is almost impermeable due to the roads and buildings and also a slight slope (nearly flat). There is a lack of space for new facilities. Analyzing the characteristics, it was concluded that only these techniques were valuable at this point: retention pond, wetland, infiltration trench, soak away, filter strips, filter trench, detention basin, green roof and permeable pavement. Construction and maintenance costs can vary widely between techniques and the long-term costs of SuDS should be considered at an early stage. In selecting a design from a series of options, both capital and operational costs should be considered using a whole life costing approach. To select the most appropriate technique, community and environmental affecting factors were studied and graded in a selection matrix as shown in Table 1.
Under this analysis, it was concluded that the techniques valuable for the study area were infiltration trench, detention basin and permeable pavement and they were applied to the study area (Figure 4, Figure 5 and Figure 6). Trenches are shallow excavations filled with rubble or stone that create temporary subsurface storage for either infiltration or filtration of stormwater runoff. Infiltration trenches allow water to exfiltrate into the surrounding soils from the bottom and sides of the trench.
To apply the technique, streets with the most vulnerability to flood were selected while the normal circulation of people and vehicles was not affected.
Detention basins are surface storage basins or facilities that provide flow control through the attenuation of stormwater runoff [38]. Normally they are dry parcels of land that may also function as a recreational facility. To apply the technique, places with space near areas with the most vulnerability to flooding were selected in a way that the normal flow of people and vehicles was not affected and could also be used as recreational facilities, as seen in Figure 5.
Permeable pavements provide a pavement suitable for pedestrian and/or vehicular traffic while allowing rainwater to infiltrate through the surface and into the underlying layers. The water is temporarily stored before infiltration to the ground. Alternatively, it can be reused or discharged to a watercourse or other drainage system. To apply the technique all the streets with the most vulnerability to flooding were selected to still allow normal circulation of people and vehicles, as seen in Figure 6.

4. Results and Discussions

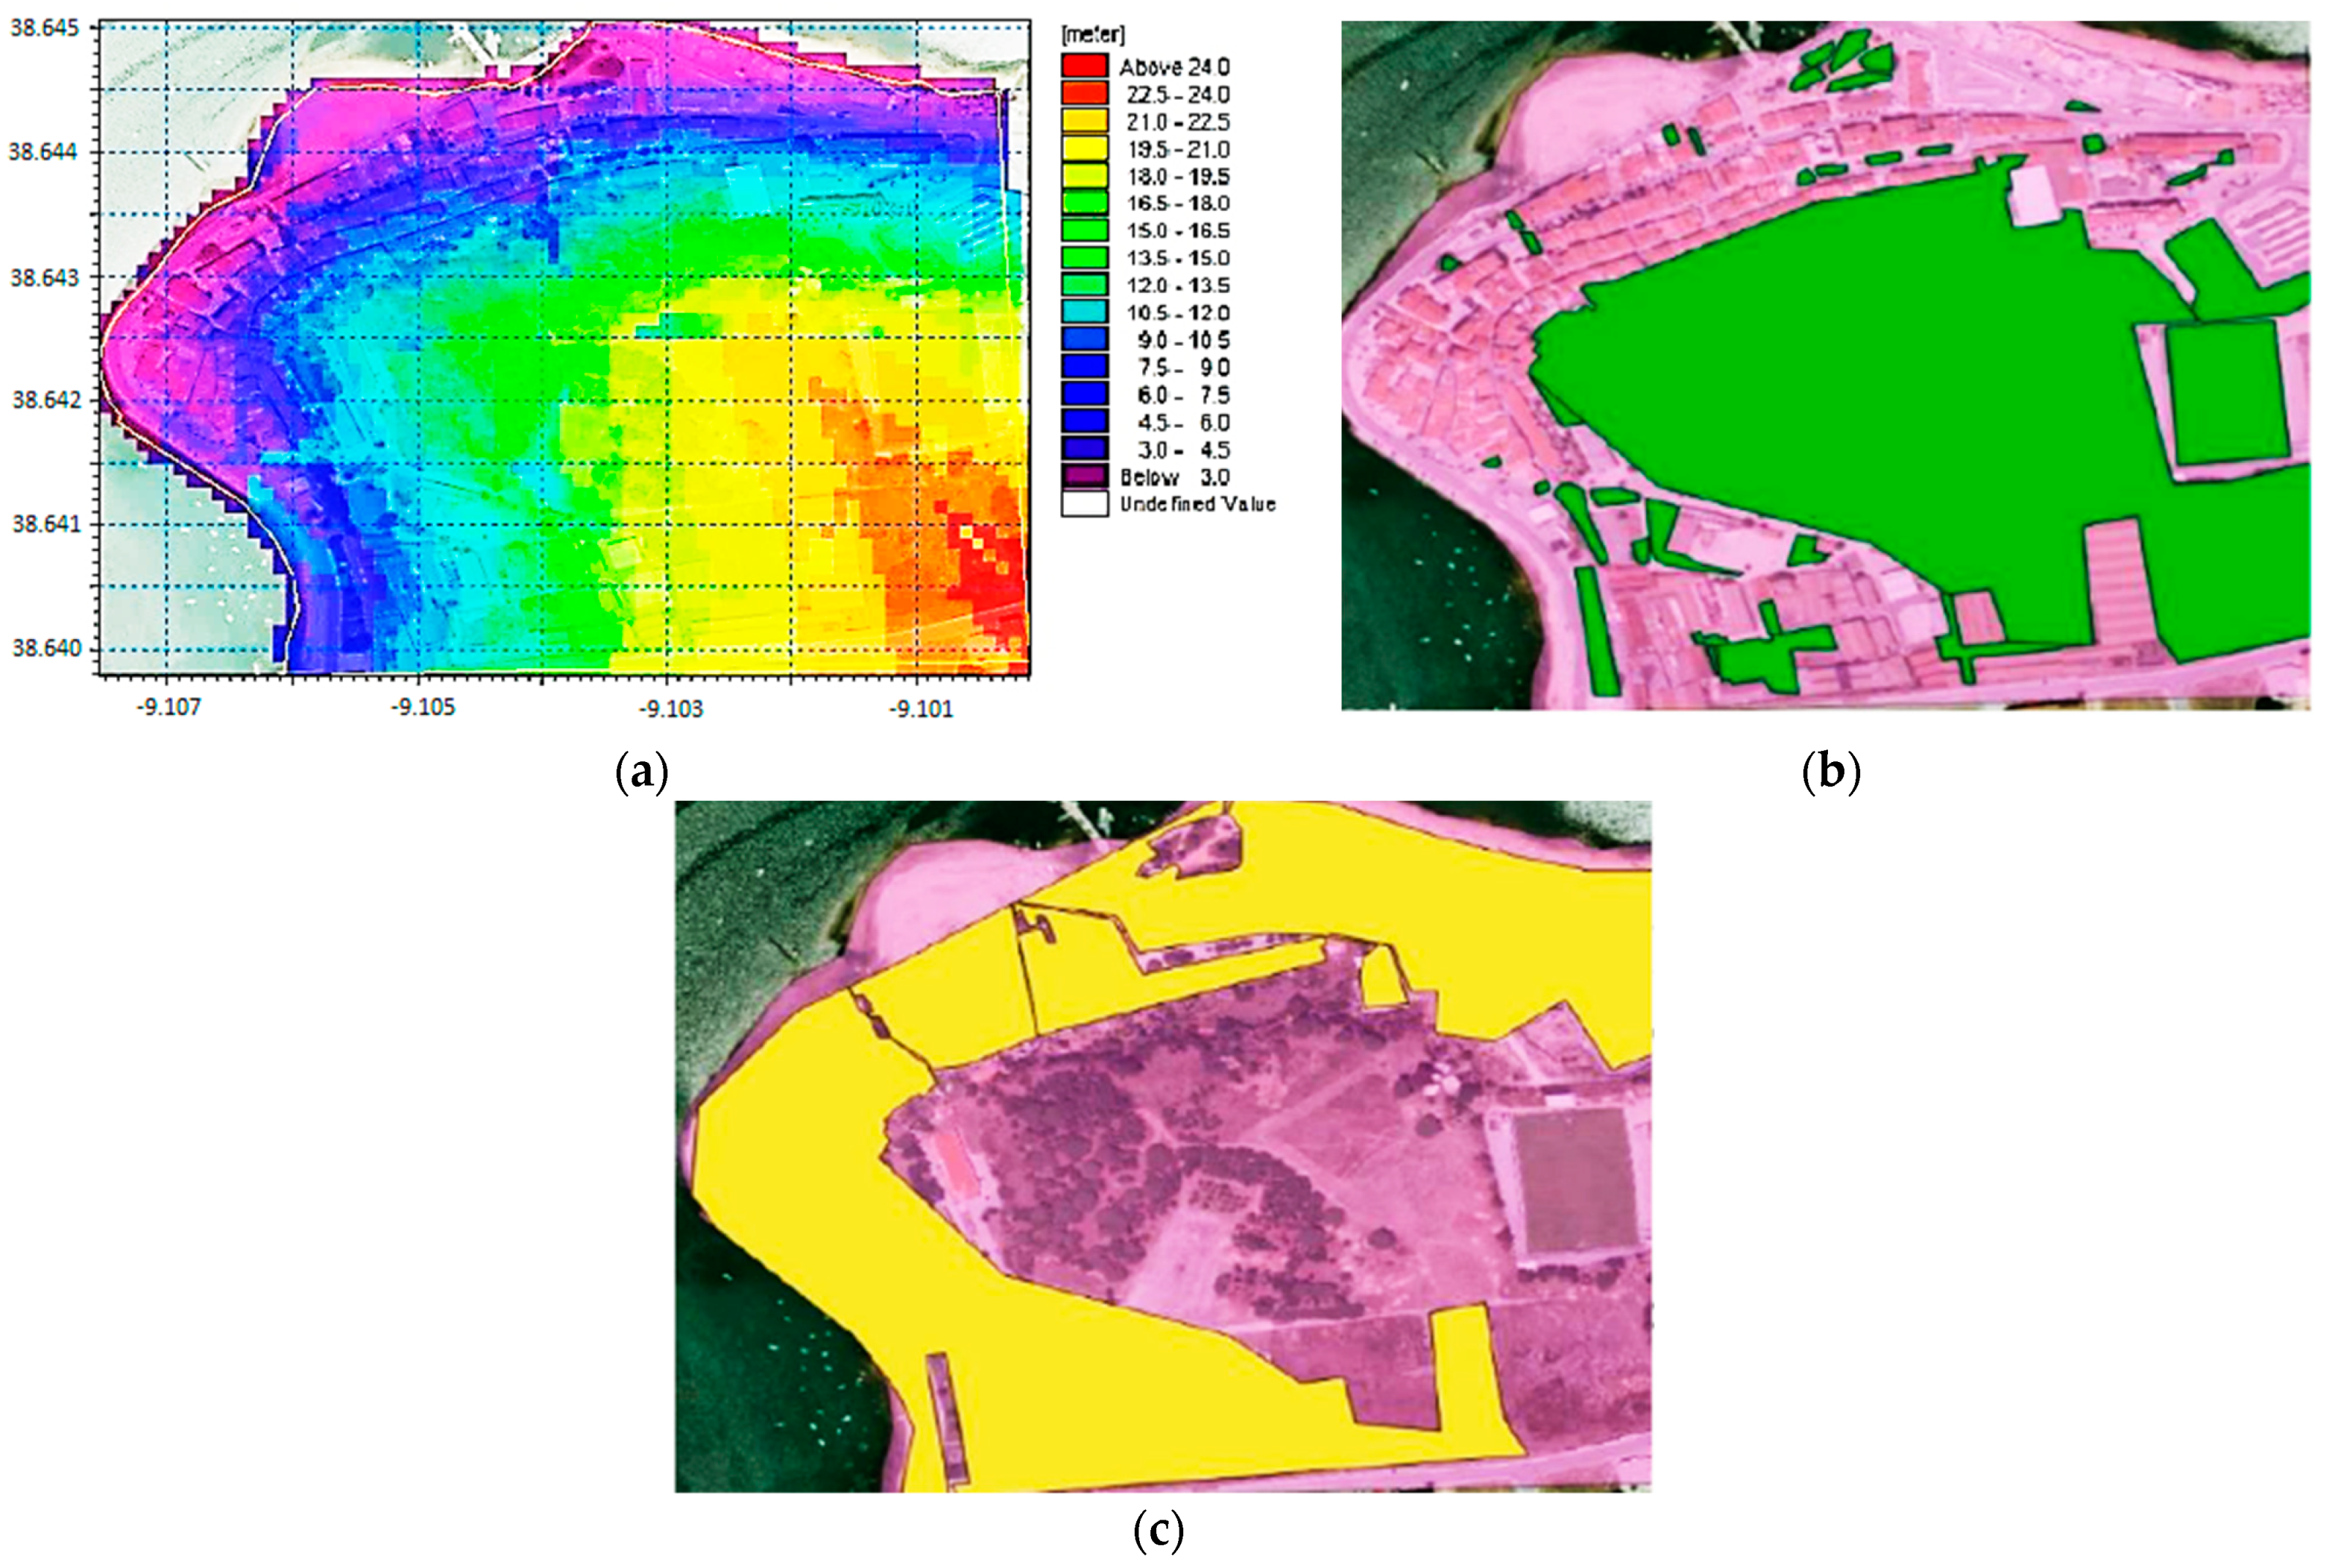
4.1. Susceptibility to Flood Risk

In studying the affected area, measuring the risk level can be one measurement method for efficiency when dealing with a new solution such as SuDS [39]. Other techniques like experimental investigations can be very expensive and hard to provide enough accuracy in the SuDS topic [40]. For that reason, this study analyses the solutions through a risk assessment approach. Taking into account the simulations performed for the different scenarios, the flood risk areas for each situation were calculated. The results showed the probability of flooding much like what would occur in nature. The analysis provides the possibility to assess the simulation scenarios for each alternative SuDS. All assessed solutions eliminate the very high risk (Table 2).
The calculations showed that applied techniques have a major impact on flood risk attenuation. Although the results are acceptable, the intervention areas are considerable and may reduce the community acceptance and the economic viability. For these reasons another scenario was simulated that combined two techniques, i.e., detention basin and permeable pavement. Similarly to the previous scenarios, places were selected to be most vulnerable to flood but had less effect on the normal circulation of people and vehicles (Figure 7).
After the model analysis, it was possible to do the same comparison between the other scenarios. While visualizing the graphic model it was noticeable that for the combined scenario the moderate risk was mitigated.
Under this analysis, it was concluded that all the techniques are meaningful for the study area since the first reaction of the model was to mitigate the very high risk. When considering only the first three scenarios, infiltration trenches were the worse alternative and permeable pavement was the most effective technique. For both economic and viability reasons, a scenario with the combination of detention basin and permeable pavement techniques was considered, which revealed that the combination could be a reliable option.

4.2. Economic Viability

A cost/benefit analysis has been carried out in this research based on a systematic process including life cost and damage analyses. This provides a decent tool for making a decision about the most effective method that benefits outweigh the costs. This is a common approach in studying SuDS because the benefits of new solutions must be somehow measured to provide a good insight into its applicability and efficiency. One of the most sensible measures can be financial analysis [41].

4.2.1. Life Cost Analysis

Life cost analysis considers all relevant and identifiable financial cash flows regarding the acquisition and use of an asset. In order to compile whole life costs, the following parameters may be required:
  • Procurement and design costs;
  • Capital construction costs (CCC);
  • Operation and maintenance costs (OMC);
  • Monitoring costs;
  • Replacement or decommissioning costs (RDC).
For the life costs analysis, the tested techniques in the MIKE SHE model were considered, using the data given by the simulation scenarios. The results of this analysis are shown in Table 3.
The detention basin technique can be considered as the most economical solution even with one of the largest areas. Although infiltration trench shows to be an economical technique, its capacity to reduce flood risk is inferior to the others; therefore it was not a reliable option for this case study. As presented previously, the scenario with combined techniques (combination of detention basin and permeable pavement techniques) is the best scenario for mitigating flood risk, for that reason the relation between cost/effectiveness appears to be acceptable.

4.2.2. Damage Analysis

The damage analysis considered three main aspects: flood cost/m2, data given by MIKE SHE model over flood risk and influence risk area. The three referred aspects were combined to calculate the damage cost for each scenario. All the scenarios were compared with the MIKE SHE model that simulates flooding much like what would occur in nature (Table 4).
Hence, it was concluded all the techniques are valuable for the study area since that all of them have a lower cost compared with the scenario without intervention. When considering only the first three scenarios, the infiltration trenches technique was the worse alternative and the detention basin was the most effective technique. The scenario with the combination of detention basin and permeable pavement techniques revealed that could be a reliable option and less expensive as well.

5. Conclusions

Climate change and urbanization are making flood occurrences a very frequent event that puts the health of urban areas and infrastructures at risk. The ongoing rise in sea level affects tidal propagation and circulation in estuaries is an additional challenge that can have severe consequences on the sediment dynamics, water quality and extreme water levels. This research analyzed the evolution of prone to flood areas in Seixal bay, Portugal and covered the application of SuDS towards a more efficient way for flood mitigation. The study was conducted with a MIKE SHE model and addressed the present and future conditions. The impacts of climate change on estuaries should be anticipated to allow the implementation of adaptation measures and to inform decision-makers about possible interventions.
The simulations undertaken in this study show that SuDS application in the case study would have significant effects on flood mitigation. In the case of a combination of two techniques, the achievement would be particularly substantial due to the decrease of susceptibility to flooding risks. The MIKE SHE software allowed us to simulate water movements from different sources, under different soil layers and pre-established time steps, and to compare different flood models in the same study area taking into consideration topography, precipitation, the existence of rivers nearby and soil-specific properties.
The study area, in Seixal, was analyzed regarding flood risk and flood mitigation techniques whilst several scenarios regarding flood risk and SuDS efficiency were included. To obtain a more complete analysis, the economic viability of each technique was also determined. The flood mitigation capacity of each SuDS technique was considered, as well as the community acceptance of their construction and maintenance. Factors such as vulnerability to flood and quantity of flooded area were taken into consideration in the definition of the most efficient system to solve flood situations in Seixal bay. The developed analyses allowed us to fully explore the mitigation capacity of each technique. The economic viability of different scenarios was established through life cost analysis and the damages caused by floods occurrence.
Overall, it was concluded that the best scenario is the one that minimizes the effects of great urbanization and consequently the increase of flood risk, which combines the permeable pavement with a detention basin. The installation of this system proved to be viable, demonstrating very important progress in the flood mitigation system in Seixal.

Author Contributions

H.M.R. developed the idea; H.M.R. and M.B. contributed in preparing the manuscript; Results are analysed with the contribution of H.M.R. and M.B.; All authors have read and agreed to the published version of the manuscript.

Funding

This research received no external funding.

Institutional Review Board Statement

Not applicable.

Informed Consent Statement

Not applicable.

Data Availability Statement

The data presented in this study is available on the paper and not to be distributed due to confidential reasons used only for this investigation purposes.

Acknowledgments

The authors gratefully thank Filipa Caleiro, MSc student under supervision of prof Helena M. Ramos, for providing the data and required information to carry out this research. Also, autors want to thanks DHI for providing the licence discount for MIKE SHE under educational agreement.

Conflicts of Interest

The authors declare no conflict of interest.

References

  1. EEA. Mapping the Impacts of Natural Hazards and Technological Accidents in Europe—An Overview of the Last Decade; European Environment Agency Technical report 13/2010; European Environment Agency: Copenhagen, Denmark, 2010; p. 144. [Google Scholar]
  2. European Commission: Developments and Forecasts on Continuing Urbanisation. Available online: https://knowledge4policy.ec.europa.eu/foresight/topic/continuing-urbanisation/developments-and-forecasts-on-continuing-urbanisation_en (accessed on 13 November 2021).
  3. United Nation: New Urban Agenda. 2017. Available online: https://unhabitat.org/sites/default/files/2019/05/nua-english.pdf (accessed on 14 November 2021).
  4. European Commission: Population Data Collection for European Local Administrative Units from 1960 Onwards. 2013. Available online: https://op.europa.eu/en/publication-detail/-/publication/3baa2718-41dd-4913-9034-a5740bc5e654/language-en (accessed on 14 November 2021).
  5. COP26 Outcomes. Available online: https://ukcop26.org/the-conference/cop26-outcomes/ (accessed on 18 November 2021).
  6. Besharat, M.; Dadfar, A.; Viseu, M.T.; Brunone, B.; Ramos, H.M. Transient-Flow Induced Compressed Air Energy Storage (TI-CAES) System towards New Energy Concept. Water 2020, 12, 601. [Google Scholar] [CrossRef] [Green Version]
  7. Ramos, H.M.; Pérez-Sánchez, M.; Franco, A.B.; López-Jiménez, P.A. Urban Floods Adaptation and Sustainable Drainage Measures. Fluids 2017, 2, 61. [Google Scholar] [CrossRef] [Green Version]
  8. Liu, J.; Shen, Z.Y.; Chen, L. Assessing how spatial variations of land use pattern affect water quality across a typical urbanized watershed in Beijing, China. Landsc. Urban Plan. 2018, 176, 51–63. [Google Scholar] [CrossRef]
  9. Li, C.L.; Liu, M.; Hu, Y.M.; Shi, T.; Qu, X.Q.; Walter, M.T. Effects of urbanization on direct runoff characteristics in urban functional zones. Sci. Total Environ. 2018, 643, 301–311. [Google Scholar] [CrossRef] [PubMed]
  10. Salvadore, E.; Bronders, J.; Batelaan, O. Hydrological modelling of urbanized catchments: A review and future directions. J. Hydrol. 2015, 529, 62–81. [Google Scholar] [CrossRef]
  11. Wang, H.; Mei, C.; Liu, J.H.; Shao, W.W. A new strategy for integrated urban water management in China: Sponge city. Sci. China Technol. Sci. 2017, 3, 317–329. [Google Scholar] [CrossRef]
  12. Wu, J.; Wang, Z.H.; Dong, Z.C.; Tang, Q.H.; Lv, X.Z.; Dong, G.T. Analysis of Natural Streamflow Variation and Its Influential Factors on the Yellow River from 1957 to 2010. Water 2018, 10, 1155. [Google Scholar] [CrossRef] [Green Version]
  13. Kefi, M.; Mishra, B.K.; Kumar, P.; Masago, Y.; Fukushi, K. Assessment of Tangible Direct Flood Damage Using a Spatial Analysis Approach under the Effects of Climate Change: Case Study in an Urban Watershed in Hanoi, Vietnam. ISPRS Int. J. Geo-Inf. 2018, 7, 29. [Google Scholar] [CrossRef] [Green Version]
  14. Mukherjee, S.; Aadhar, S.; Stone, D.; Mishra, V. Increase in extreme precipitation events under anthropogenic warming in India. Weather Clim. Extremes 2018, 20, 45–53. [Google Scholar] [CrossRef]
  15. Schmitt, T.G.; Thomas, M.; Ettrich, N. Analysis and modeling of flooding in urban drainage systems. J. Hydrol. 2004, 299, 300–311. [Google Scholar] [CrossRef]
  16. Rangari, V.A.; Umamahesh, N.V.; Bhatt, C.M. Assessment of inundation risk in urban floods using HEC RAS 2D. Model. Earth Syst. Environ. 2019, 5, 1839–1851. [Google Scholar] [CrossRef]
  17. Gonzalez-Alvarez, A.; Coronado-Hernández, O.E.; Fuertes-Miquel, V.S.; Ramos, H.M. Effect of the Non-Stationarity of Rainfall Events on the Design of Hydraulic Structures for Runoff Management and Its Applications to a Case Study at Gordo Creek Watershed in Cartagena de Indias, Colombia. Fluids 2018, 3, 27. [Google Scholar] [CrossRef] [Green Version]
  18. Ashu, A.B.; Lee, S.-I. Assessing Climate Change Effects on Water Balance in a Monsoon Watershed. Water 2020, 12, 2564. [Google Scholar] [CrossRef]
  19. Huang, Y.; Ma, Y.; Liu, T.; Luo, M. Climate Change Impacts on Extreme Flows Under IPCC RCP Scenarios in the Mountainous Kaidu Watershed, Tarim River Basin. Sustainability 2020, 12, 2090. [Google Scholar] [CrossRef] [Green Version]
  20. Wang, Z.; Yao, W.; Wang, M.; Xiao, P.; Yang, J.; Zhang, P.; Tang, Q.; Kong, X.; Wu, J. The Influence of River Channel Occupation on Urban Inundation and Sedimentation Induced by Floodwater in Mountainous Areas: A Case Study in the Loess Plateau, China. Sustainability 2019, 11, 761. [Google Scholar] [CrossRef] [Green Version]
  21. Cunningham, S.C.; Nally, R.M.; Read, J.; Baker, P.J.; White, M.; Thomson, J.R.; Griffioen, P. A robust technique for mapping vegetation condition across a major river system. Ecosystems 2009, 12, 207–219. [Google Scholar] [CrossRef]
  22. Lauer, J.W.; Caitlyn, E.; Christian, L.; Patrick, B.; Rachel, R. Air-photo based change in channel width in the Minnesota River basin: Modes of adjustment and implications for sediment budget. Geomorphology 2017, 297, 170–184. [Google Scholar] [CrossRef]
  23. Philip, K.L.; Lalit, K.; Richard, K. Monitoring river channel dynamics using remote sensing and GIS techniques. Geomorphology 2019, 325, 92–102. [Google Scholar]
  24. Mejia, A.I.; Moglen, G.E. Spatial distribution of imperviousness and the space-time variability of rainfall, runoff generation, and routing. Water Resour. Res. 2010, 46, W07509. [Google Scholar] [CrossRef] [Green Version]
  25. Da Silva, C.V.F.; Schardong, A.; Garcia, J.I.B.; Oliveira, C.D.P.M. Climate Change Impacts and Flood Control Measures for Highly Developed Urban Watersheds. Water 2018, 10, 829. [Google Scholar] [CrossRef] [Green Version]
  26. Ballard, B.; Wilson, S.; Udale-Clark, H.; Illman, S.; Scott, T.; Ashley, R.; Kellagher, R. The SuDS Manual (CIRIA C753); CIRIA: London, UK, 2015. [Google Scholar]
  27. DHI. MIKE SHE User Manual; Danish Hydraulic Institute: Hørsholm, Denmark, 2019. [Google Scholar]
  28. Obeysekera, J.; Salas, J.D. Frequency of recurrent extremes under nonstationarity. J. Hydrol. Eng. 2016, 21, 04016005. [Google Scholar] [CrossRef]
  29. Salas, J.D.; Obeysekera, J.; Vogel, R.M. Techniques for assessing water infrastructure for nonstationary extreme events: A review. Hydrol. Sci. J. 2018, 63, 325–352. [Google Scholar] [CrossRef]
  30. Song, J.Y.; Chung, E.S. A multi-criteria decision analysis framework for prioritizing sites and types of low impact development practices. Water 2017, 9, 291. [Google Scholar] [CrossRef] [Green Version]
  31. Russo, B.; Gómez, M.; Macchione, F. Pedestrian hazard criteria for flooded urban areas. Nat. Hazards 2013, 69, 251–265. [Google Scholar] [CrossRef]
  32. Sandink, D.; Simonovic, S.P.; Schardong, A.; Srivastav, R. A Decision Support System for Updating and Incorporating Climate Change Impacts into Rainfall Intensity-DurationFrequency Curves: Review of the Stakeholder Involvement Process. Environ. Model. Softw. J. 2016, 84, 193–209. [Google Scholar]
  33. Abdellatif, M.; Atherton, W.; Alkhaddar, R.; Osman, Y. Flood risk assessment for urban water system in a changing climate using artificial neural network. Nat. Hazards 2015, 79, 1059–1077. [Google Scholar] [CrossRef]
  34. Hammond, M.J.; Chen, A.S.; Djordjević, S.; Butler, D.; Mark, O. Urban flood impact assessment: A state-of the-art review. Urban Water J. 2015, 12, 14–29. [Google Scholar] [CrossRef] [Green Version]
  35. Cipolla, S.S.; Maglionico, M.; Stojkov, I. A long-term hydrological modelling of an extensive green roof by means of SWMM. Ecol. Eng. 2016, 95, 876–887. [Google Scholar] [CrossRef]
  36. Yang, Y.; Chui, T.F.M. Rapid Assessment of Hydrologic Performance of Low Impact Development Practices under Design Storms. JAWRA J. Am. Water Resour. Assoc. 2018, 54, 613–630. [Google Scholar] [CrossRef]
  37. Szewranski, S.; Kazak, J.; Zmuda, R.; Wawer, R. Indicator-based assessment for soil resource management in the Wroclaw larger urban zone of Poland. Pol. J. Environ. Stud. 2017, 26, 2239–2248. [Google Scholar] [CrossRef] [Green Version]
  38. Ramos, H.M.; Teyssier, C.; Samora, I.; Schleiss, A.J. Energy recovery in SuDS towards smart water grids: A case study. Energy Policy 2013, 62, 463–472. [Google Scholar] [CrossRef] [Green Version]
  39. Ertan, S.; Çelik, R.N. The Assessment of Urbanization Effect and Sustainable Drainage Solutions on Flood Hazard by GIS. Sustainability 2021, 13, 2293. [Google Scholar] [CrossRef]
  40. Neupert, J.W.; Lau, P.; Venghaus, D.; Barjenbruch, M. Development of a New Testing Approach for Decentralised Technical Sustainable Drainage Systems. Water 2021, 13, 722. [Google Scholar] [CrossRef]
  41. Fraga, J.P.R.; Okumura, C.K.; Guimarães, L.F.; de Arruda, R.N.; Becker, B.R.; de Oliveira, A.K.B.; Veról, A.P.; Miguez, M.G. Cost-benefit analysis of sustainable drainage systems considering ecosystems services benefits: Case study of canal do mangue watershed in Rio de Janeiro city, Brazil. Clean Technol. Environ. Policy 2021. [Google Scholar] [CrossRef]
Figure 1. Differences between a conventional drainage system and a sustainable drainage system.
Sustainability 13 13889 g001
Figure 2. (a) Location of the case study; (b) risk index in Seixal bay; (c) contour of the studied area.
Sustainability 13 13889 g002
Figure 3. MIKE SHE model simulation: (a) topography map of the study area; (b) green areas adopted; (c) paved areas adopted in the study area.
Sustainability 13 13889 g003
Figure 4. (a) Infiltration trenches technique applied in QGIS; (b) MIKE SHE model for flood with infiltration trenches technique applied.
Sustainability 13 13889 g004
Figure 5. (a) Detention basin technique applied in QGIS; (b) MIKE SHE model for flood with detention basin technique applied.
Sustainability 13 13889 g005
Figure 6. (a) Permeable pavement technique applied in QGIS; (b) MIKE SHE model for flood with permeable pavement technique applied.
Sustainability 13 13889 g006
Figure 7. (a) Combination of detention basin and permeable pavement; (b) MIKE SHE model for combination of detention basin and permeable pavement.
Sustainability 13 13889 g007
Table 1. Community and environmental factors selection matrix (adapted from [26]).
TechniqueMaintenanceCommunity
Acceptance
CostHabitat Creation Potential
Retention PondMediumHighMediumHigh
WetlandMediumLowHighMedium
Infiltration trenchLowMediumLowLow
SoakawayLowMediumMediumLow
Filter stripHighHighMediumHigh
Filter trenchMediumMediumMediumLow
Detention basinLowHighLowMedium
Green roofHighHighHighHigh
Permeable PavementMediumMediumMediumLow
Table 2. Comparison of flood risk in affected areas between different scenarios.
RiskNo InterventionInfiltration TrenchesDetention BasinPermeable PavementCombined Techniques
No Vulnerability53.47%52.66%50.52%79.37%81.74%
Very Low18.67%19.81%28.13%10.72%9.65%
Low18.47%19.54%19.34%20.24%7.26%
Moderate1.10%3.74%1.41%2.20%1.35%
High4.09%4.26%0.60%0.43%-
Very High4.20%----
Table 3. Cost comparison of flood risk between different scenarios in Euro (€).
ComponentCCC OMCRDCSecondaryTotal
Infiltration trench142,212.501422.1349,774.3828,442.50172,077.13
Detention basin52,643.07584.9218,425.0710,528.6163,756.61
Permeable pavement317,925.007065.00111,273.7563,585.00492,783.75
Combined techniques209,243.073910.8473,235.0741,848.61255,002.53
Table 4. Cost comparison between estimated damage costs in affected areas for different simulated scenarios in Euro (€).
RiskNo InterventionInfiltration TrenchesDetention BasinPermeable PavementCombined Techniques
No Vulnerability-----
Very Low6514.2593474.9104362.5091812.0874794.334
Low5337.5684957.7254839.7465397.7902296.978
Moderate628.0901306.412422.5691464.4431049.828
High1931.6444811.4031397.274535.126-
Very High5.417.045----
Total19,928.60714,550.45211,022.0999209.4468141.142
Saving-5278.1558806.50710,619.16011,687.464
Publisher’s Note: MDPI stays neutral with regard to jurisdictional claims in published maps and institutional affiliations.

