Article

Fabrication and Performance of Low-Fouling UF Membranes for the Treatment of Isolated Soy Protein Solutions

by
Esperanza M. Garcia-Castello
1,2,*,
Antonio D. Rodriguez-Lopez
2,3,
Sergio Barredo-Damas
2,3,
Alicia Iborra-Clar
2,3,
Jairo Pascual-Garrido
2 and
Maria Isabel Iborra-Clar
2,3,*
1
Institute of Food Engineering for Development (IIAD), Universitat Politècnica de València, Camino de Vera, 46022 Valencia, Spain
2
Department of Chemical and Nuclear Engineering, Universitat Politècnica de València, Camino de Vera, 46022 Valencia, Spain
3
Research Institute for Industrial, Radiophysical and Environmental Safety (ISIRYM), Universitat Politècnica de València, Camino de Vera, 46022 Valencia, Spain
*
Authors to whom correspondence should be addressed.
Sustainability 2021, 13(24), 13682; https://doi.org/10.3390/su132413682
Submission received: 31 October 2021 / Revised: 6 December 2021 / Accepted: 8 December 2021 / Published: 10 December 2021
(This article belongs to the Special Issue Sustainable Food Waste Valorisation by Membrane Technology)

Abstract

:
Consumers are becoming more conscious about the need to include functional and nutritional foods in their diet. This has increased the demand for food extracts rich in proteins and peptides with physiological effects that are used within the food and pharmaceutical industries. Among these protein extracts, soy protein and its derivatives are highlighted. Isolated soy protein (ISP) presents a protein content of at least 90%. Wastewaters generated during the production process contain small proteins (8–50 kDa), and it would be desirable to find a recovery treatment for these compounds. Ultrafiltration membranes (UF) are used for the fractionation and concentration of protein solutions. By the appropriate selection of the membrane pore size, larger soy proteins are retained and concentrated while carbohydrates and minerals are mostly recovered in the permeate. The accumulation and concentration of macromolecules in the proximity of the membrane surface generates one of the most important limitations inherent to the membrane technologies. In this work, three UF membranes based on polyethersulfone (PES) were fabricated. In two of them, polyethylene glycol (PEG) was added in their formulation to be used as a fouling prevention. The membrane fouling was evaluated by the study of flux decline models based on Hermia’s mechanisms.

1. Introduction

The functional and nutritional properties as well as the physiological effects of some proteins and peptide extracts on the human body have increased the market demand for these products within the food and pharmaceutical industries [1,2]. Among these protein extracts, soy protein and their derivatives may be highlighted due to their anti-cancer, cholesterol-lowering and body-fat reducing effects together with other health benefits [3]. The isolated soy protein (ISP) can be considered the most refined soybean product since it presents a protein content of at least 90%. This high protein content results in a considerable complex production process.
The wastewater generated during the production process contains different commercially valuable compounds (mono- and oligosaccharides, salts, soluble protein and minerals) [4,5], and their disposal would represent losses in the efficiency process and environmental problems. Nowadays, the circular economy concept considers that for reaching some advantages, manufacturing systems should be based on the use of both renewable energies and sustainable production alternatives. Some of these sustainable alternatives are based on the minimization of the generation of liquid, solid and gaseous residues at any stage of the process (from farm-to-fork). The promotion of the use and exploitation of residues unavoidably obtained both energy and high value-added products; thus, chemicals resources are in full force, and many studies are in progress in this field [6,7]. In this context, considering that the wastewater streams from ISP production contain, among others, small proteins (8–50 kDa), it would be desirable to find a treatment that recovers these compounds and favors their return to the productive process, resulting in both economic and environmental benefits [8,9].
Conventional methods for the obtaining of either protein concentrate or isolate extraction usually involve an extraction with alcohol or alkali solvents, a subsequent heat treatment and final precipitation or centrifugation [2,10]. The exposition to the mentioned extreme conditions may result in poor functional properties of the concentrates as well as the loss of some proteins within the waste streams [2,10]. Consequently, the application of membrane separation technologies has emerged as a promising alternative both for the production process and wastewater treatment with several advantages over conventional methods related to higher efficiency, lower costs and the possibility to operate without the addition of chemical products and at ambient temperature which entails superior functional properties, among others [8,9,10,11].
In particular, ultrafiltration membranes (UF) are often used for the fractionation and concentration of protein solutions [12]. In this way, by means of the appropriate selection of the membrane pore size, larger soy proteins are retained and concentrated by the membrane while the carbohydrates and minerals are mainly removed by permeation through the membrane [13,14]. However, the accumulation and concentration of macromolecules in the proximity of the membrane surface generates one of the most important limitations inherent to the membrane technologies, i.e., efficiency loss over time, which involves a hindrance to its application in a wider range of applications [15,16].
The decrease in process efficiency is observed either in the permeate flux or membrane selectivity. This problem may be attributed both to the concentration polarization phenomenon and membrane fouling, which increases flow resistance through the membrane. The different mechanisms of membrane fouling may be typically classified into four main models which describe fouling mode individually. Those mechanistic models were proposed by Hermia [17] describing the fouling mechanisms responsible for flux decline for constant pressure dead-end filtration. Based on these models, fouling may occur by standard blocking, intermediate blocking, complete blocking and cake layer formation [18,19,20,21]. All these models may be written according to a common mathematical equation (Equation (1)):
d 2 t d V 2 = k d t d V n
where t is the operational time, V (m3) is the cumulative volume of permeate, k is a constant and n determines the flux decline mechanism. Thus, n = 2 is related to a complete blocking, n = 1.5 to a standard blocking, n = 1 to an intermediate blocking and n = 0 to a cake layer formation [19,22].
These Hermia models have been applied to study cross-flow filtration processes either directly or after some modifications [20]. Likewise, these mechanisms have been proposed to occur not only individually but considering their combination and simultaneous occurrence to describe experimental observations from other research works [18,19].
One of the many possible factors strongly affecting ultrafiltration membrane performance and fouling rate is related to membrane material [23]. Currently, most of the commercially available ultrafiltration membranes are made from hydrophobic polymers such as polysulfone (PSU), cellulose acetate (CA), polyamide (PA), polyvinylidenefluoride (PVDF), polyacrylonitrile (PAN) and polyethersulfone (PES), due to their excellent properties [24]. Specifically, PES is an amorphous well-known polymer containing repeated ether and sulfone linkage alternating between aromatic rings which provide with thermal, chemical and mechanical stability. These properties make PES an attractive material in membrane preparation due to the wide range of ultrafiltration applications. Nevertheless, the hydrophobic nature of PES makes these membranes susceptible to be fouled, particularly in protein-contacting applications [25,26,27].
On the other side, it is generally acknowledged that increasing the hydrophilic nature of the membrane surface may considerably reduce membrane fouling [12,28,29]. Therefore, the combination of the excellent bulk properties of the hydrophobic polymers with a more hydrophilic nature surface might significantly improve process performance [24]. This improved combination may be achieved through certain surface membrane modifications and is gaining importance as a minimizing membrane fouling procedure [30].
Commonly, the most used methods in the surface modification to increase the surface hydrophilicity include adsorption, surface coating [31], plasma treatment [32], grafting [33], chemical modification and blending [12,28,34]. From the mentioned alternatives, both surface coating and grafting strategies may narrow membrane pores [28]. Furthermore, the addition of diverse additives in the casting solution is considered the easiest method procedure for the surface modification. The main goal of this addition is to create a spongy, soft and porous membrane structure by enhancing pore formation, introducing hydrophilicity, extending pore interconnectivity and hindering macrovoids establishment. With that purpose, the additive can be either a single component or a mixture of inorganic salts, surfactants, polymers, mineral fillers and even non-solvent [35,36].
Usually, hydrophilic polymers as polyethylene glycol (PEG) are used to obtain hydrophilic membranes by its blending with the membrane-forming hydrophobic polymer. The non-ionic nature of the PEG helps in the creation of an energetic barrier preventing macromolecules adsorption and has been recognized as an effective modifier and pore-forming agent [34,36,37,38].
The main aim of this work is to develop a procedure for the membrane preparation, by the phase inversion method, of asymmetric PES/solvent membranes in the presence of a non-solvent pore-forming additive (PEG) contributing with its hydrophilic nature to an anti-fouling behavior and improved efficiency. In addition, the empirical models presented by Hermia are used to identify whether the fouling mechanisms involved in the UF process can be described by a particular model separately or as a series of involved mechanisms. Developed membranes are evaluated by measuring the permeability and selectivity during UF of a 4% ISP solution.

2. Materials and Methods

2.1. Materials

Commercial PES (Ultrason® S 2010, BASF, Ludwigshafen, Germany) as polymer and N,N-dimethylacetamide (DMA) (purity ≥ 99%) (Merck, Darmstadt, Germany) as solvent were used to prepare the polymer solution for the laboratory-made membranes. Poly(ethylene glycol) 20,000 for synthesis (stabilized) (Sigma Aldrich-Fluka Chemie GmbH, Buchs, Switzerland) was used as a hydrophilic and pore-former additive. Isolated soy protein from Merck (soy protein acid hydrolysate (powder)) (Darmstadt, Germany), was used to prepare the feed solution. Chemicals and reagents did not suffer previous pretreatment before their use.
Two different UF commercial membranes (C#1 and C#2) were tested to compare filtration efficiency. Both commercial membranes were PES material membranes (IRIS 3028, Novasep Orelis) differing in their MWCO (C#1, 3 kDa; C#2, 30 kDa). Regarding surface charge, both C#1 and C#2 membranes are neutral, while they can be both classified as hydrophobic membranes because of the material.

2.2. Membrane Preparation

The asymmetric laboratory-made (lab-made) membranes were prepared by phase inversion method, induced by immersion precipitation. This technique is widely used to prepare polymeric micro and ultrafiltration asymmetric membranes. The diffusion-induced phase separation process involves the conversion of a film of polymer solution cast on a suitable substrate into a two-phase system. By immersing the substrate in a non-solvent bath, the solvent in the casting solution is exchanged with non-solvent, and the precipitation of polymer occurs. In this way, the solid phase forms the membrane structure, whereas the liquid phase forms the membrane pores.
In relation to the membrane thickness, some studies have proved that thinner membranes perform better since they show lower resistance to the permeate flux [39,40]. However, the lower resistance might also involve lower selectivity, whereas a greater particle removal obtained by increasing the thickness of the membranes could be at the expense of rapid fouling rate.
In this work, three casting solutions composed of PES, PEG and DMA at different proportions were prepared (Table 1) and stirred at 45 °C until the complete dissolution of polymers. The resulting casting solutions (L#2-L#4) were then cast onto a polypropylene/polyethylene non-woven Videlon® FO2431 D porous support with a steel casting knife having a 75 µm thickness.
The casting process was carried out at room temperature and at humid air (RH = 50–60%) for 10 s. Immediately (lasting up to 5 s), these cast films were immersed into an osmotized water bath at different temperatures in the range 15–27 °C and kept in there for 10 min. Resulting membranes were washed and soaked in osmotized water for 1 h at room temperature. It is important to control the casting parameters since all these factors have a consequence in terms of permeability, fouling and selectivity of the prepared membranes.

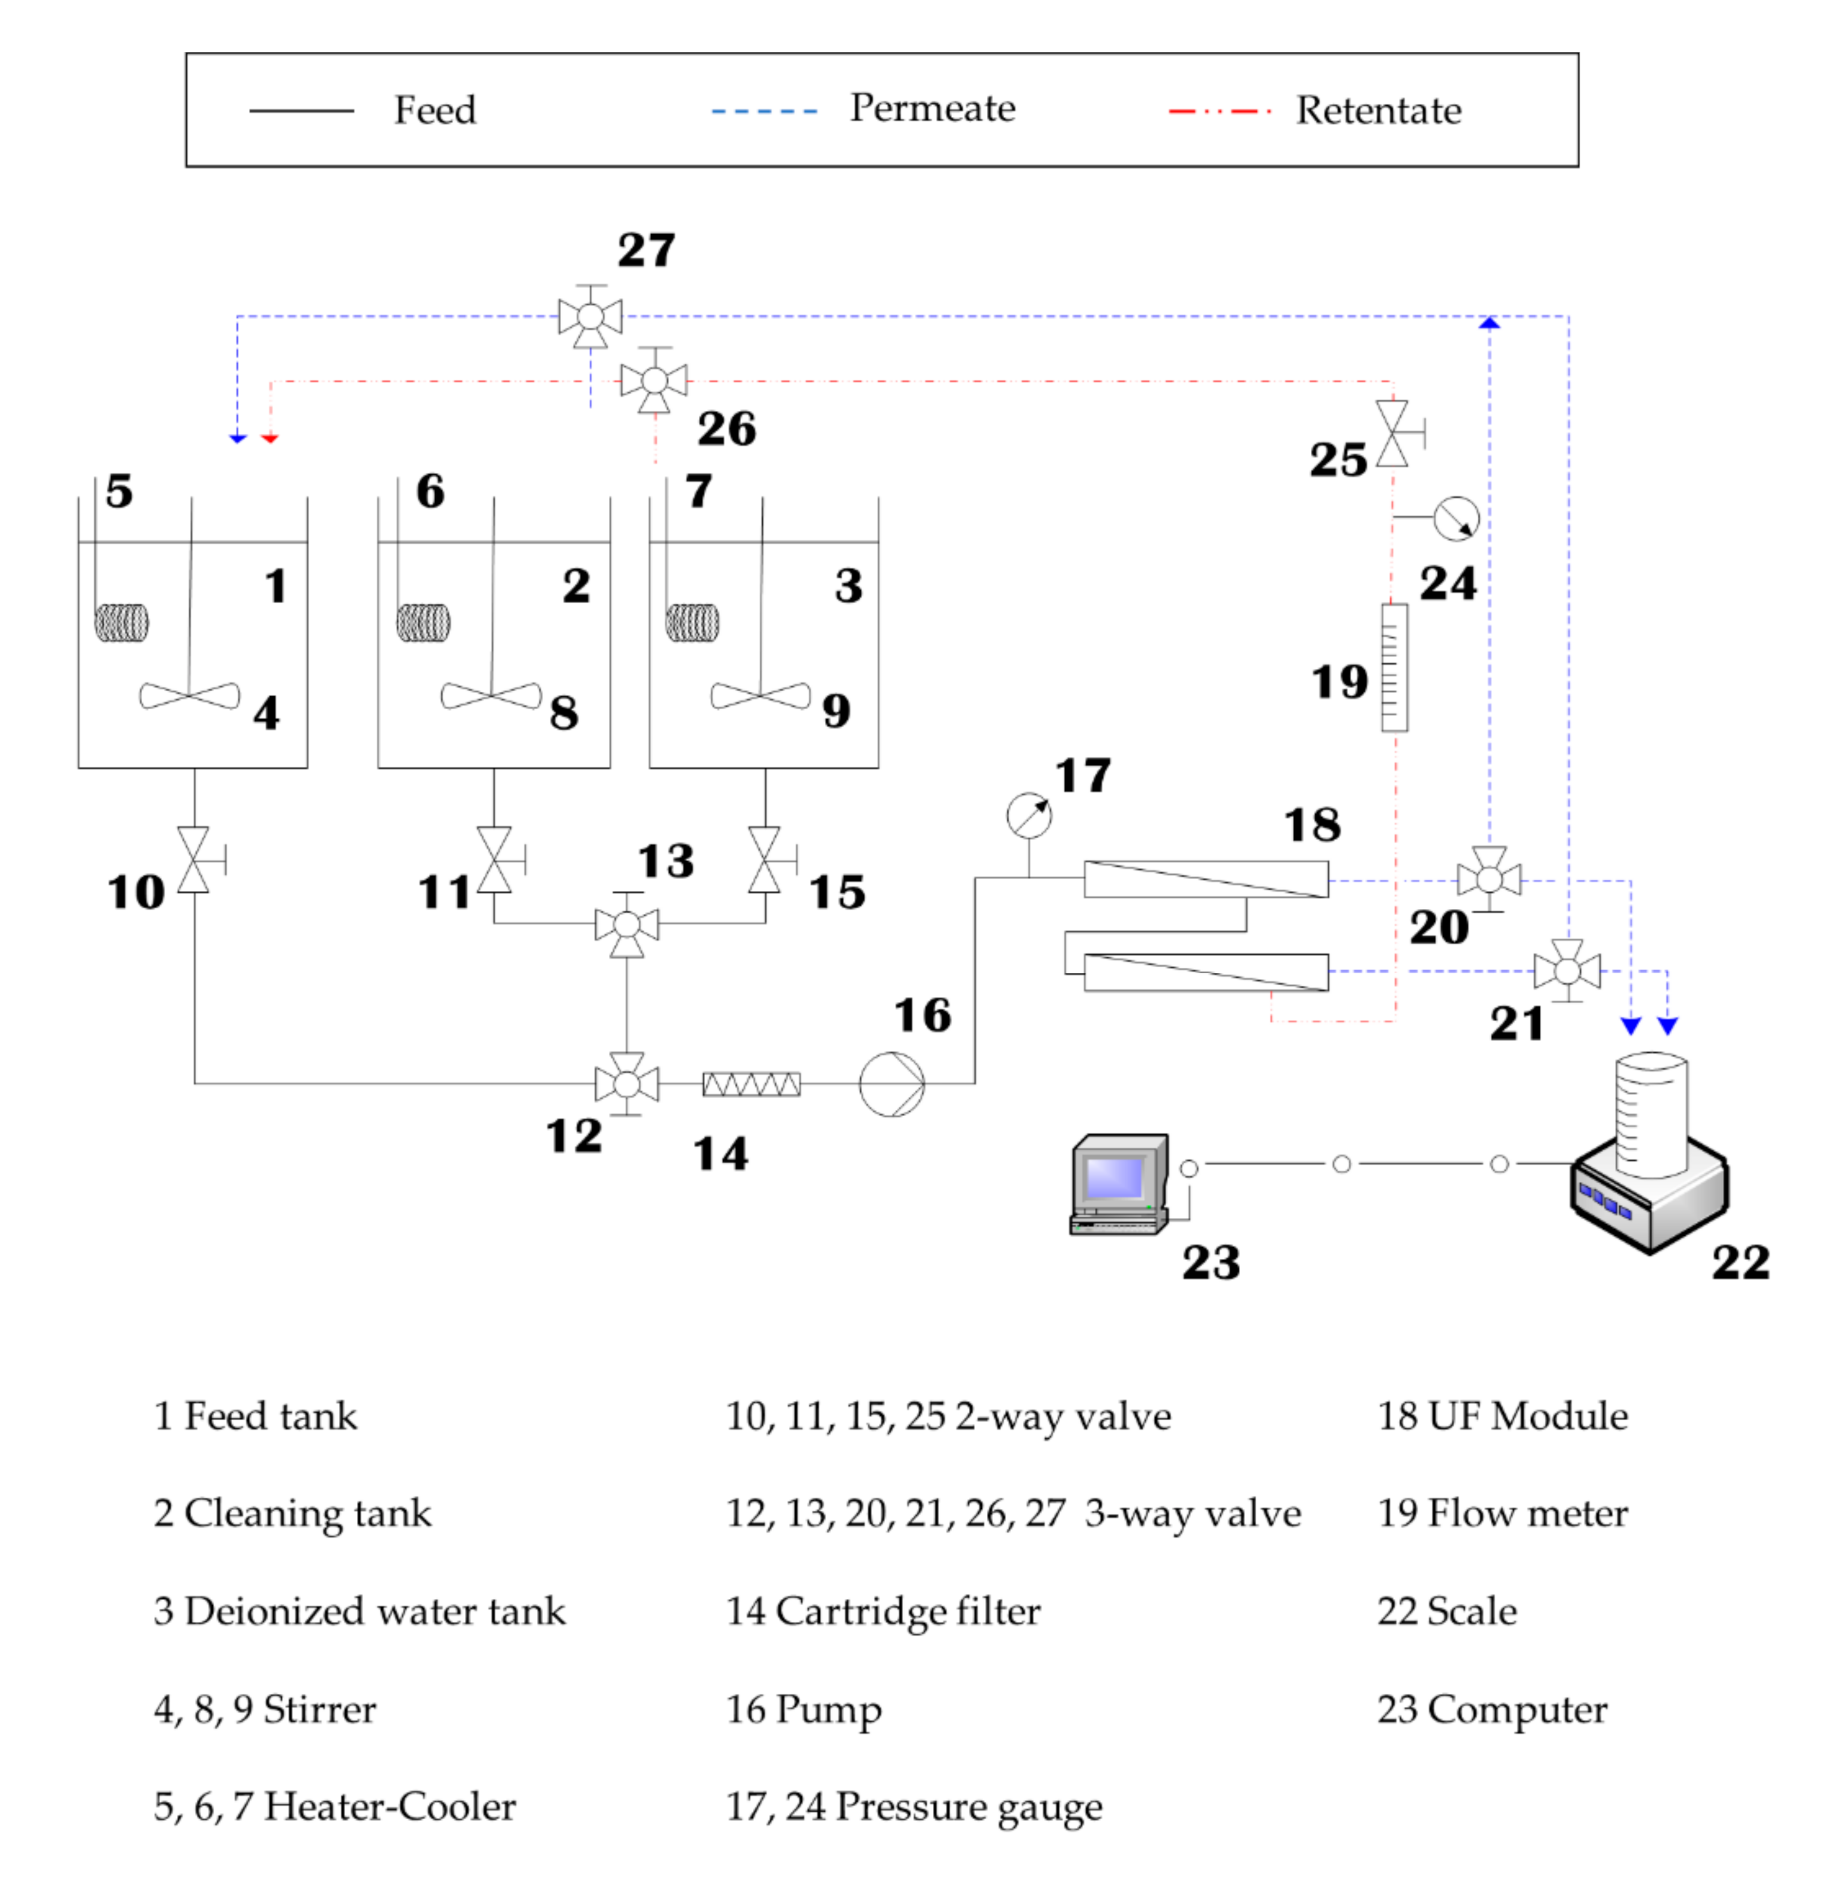
2.3. Ultrafiltration Procedure

Both membrane permeability and ISP fouling experiments were conducted in a lab scale plant (Figure 1). The cross-flow cell houses two flat sheet membrane pieces of 60 cm2 effective area each.
ISP fouling experiments were performed on filtration concentration mode, i.e., permeate streams were collected separately while retentate was sent back to the feed tank to observe fouling rate and mechanisms. In accordance with other works [8], ISP feed solution was prepared at a concentration of 0.4%. These fouling experiments were carried out at a transmembrane pressure of 2 bar.
An increase in the process temperature leads to an increase in the permeate flux caused by the reduction in the viscosity and the subsequent increase in the diffusion coefficient [41]. However, depending on the feed nature, some studies observed the opposite trend, since increase in permeate flux entails a higher amount of particles and fouling through the membrane. As a consequence, partial or complete blocking of membrane pores may occur [42]. Thus, we decided to keep temperature constant.
All the experiments were performed at a preset retentate flow of 220 L/h while the feed temperature was kept constant during the operation at 25 ± 1 °C by means of a cooler (J.P. Selecta, Abrera, Spain). Permeate flux was gravimetrically determined at different moments with a scale (0.01 g accuracy) (KB 800-2, KERN & SOHN GmbH, Balingen, Germany) and samples were kept apart at −20 °C until their analysis for the determination of the ISP concentration.

2.4. Membrane Characterization

2.4.1. Membrane Permeability

Membrane permeability was experimentally determined under steady-state flow, where at least 3 readings were collected to obtain an average value. These values were obtained by measuring the permeate flux to osmotized water, Jw, at different transmembrane pressure values (TMP: 1, 2 and 3 bar) and a constant temperature of 25 °C. The values of the permeate flux were calculated according to Equation (2).
J w = d V A · d t
where Jw (m/s) is the osmotized water permeate flux, V (m3) is the permeate volume, A is the membrane active surface area (m2) and t (s) is the sampling time. The slope of the straight line obtained by plotting the permeate flux versus the TMP corresponds to the membrane water permeability.

2.4.2. Membrane Performance

Subsequently to the membrane characterization, performance of selected membranes was evaluated in terms of fouling rate by calculating its normalized flux. The normalized flux is represented by the flux rate (JP) and the initial flux (J0) rate (JP/J0). Furthermore, soy protein rejection was determined by measuring the amount of protein in the feed and permeate streams, respectively. In this way, the rejection index (R) was calculated in accordance with Equation (3):
R % = 1 C p e r m e a t e C f e e d · 100
where Cpermeate and Cfeed represent the soy protein concentration in the permeate and initial feed, respectively. Membrane performance was also evaluated in terms of the volume reduction factor (VRF), defined according to the Equation (4):
V R F = V f e e d V r e t e n t a t e = 1 + V p e r m e a t e V r e t e n t a t e
Thus, concentration tests were performed for 4 h during which permeate flux rate was measured every 10 min over the operating time. Samples of the different streams (feed, permeate and retentate) were collected with a 30 min interval between sampling and stored at −20 °C for a later analysis.
Regarding the repeatability of experiments, this work was carried out in alignment with other recent research published by several authors in different ultrafiltration application fields [43,44,45,46,47,48].

2.5. Analytical Determination

The colorimetric method proposed by Bradford [49] was selected to determine the protein content in the different streams. Colorimetric methods are based in the reaction between some functional groups of proteins and chromogenic reagents producing colored complexes. In this method, an acidic solution of Coomassie Brilliant Blue G-250 dye is added to the protein solution involving the binding of the dye to proteins. Subsequently, the absorbance of the mixture was determined at 595 nm and compared with the absorbance of the solution without protein. Absorbance values were determined using an UV-visible spectrophotometer (HP 8453, Poway, CA, USA).

2.6. Fouling Mechanisms

The mode of flux decline may be identified by an analysis of the curve represented by Hermia’s mechanisms. From Equation (2), which defines permeate flux, the expression dt/dV is given as Equation (5):
d t d V = 1 A · J
Taking derivative of Equation (5) with respect to t leads to the expression (Equation (6)):
d 2 t d V 2 = 1 A · J 3 · d J d t
Substituting derivatives from Equations (5) and (6) in Equation (1) leads to the governing equation of flux with time (Equation (7)):
d J d t = α · J 3 n
where α is a constant and the value of n defines the mode of flux decline. Table 2 briefly describes the types of flux decline depending on the fitting of experimental values to the corresponding equations [50,51]. The complete pore blocking (Equation (8)) assumes the complete pore obstruction by means of sealing when particles are larger than pore size. On the other hand, standard or internal blocking (Equation (9)) is based on the decrease in the membrane pore diameter when particles enter the pores and either get deposited or adsorbed on the pore wall. Alternatively, intermediate blocking (Equation (10)) involves a dynamic situation of blocking/unblocking based on the probability of macromolecules obstructing the pore entrance but not completely blocking it. Finally, the cake filtration model (Equation (11)) assumes that either particles or macromolecules may form a cake on the membrane surface when they do not enter the pores [19,22,52].
These models were initially proposed to describe the different fouling mechanisms separately for dead-end filtration. However, in the course of crossflow filtration, fouling may occur as a combination or sequence of different mechanisms. Consequently, the flux decline data may be described by more than one model in succession involving more than one mechanism occurring in the filtration process, and transitions in fouling mechanisms may be observed during filtration [53]. The SOLVER tool of the MS Excel program was used to carry out the regressions of the experimental data. The goodness of fit of the models to the experimental data was assessed by using the linear regression coefficient (R2) and the sum of square errors (SSE).

3. Results and Discussion

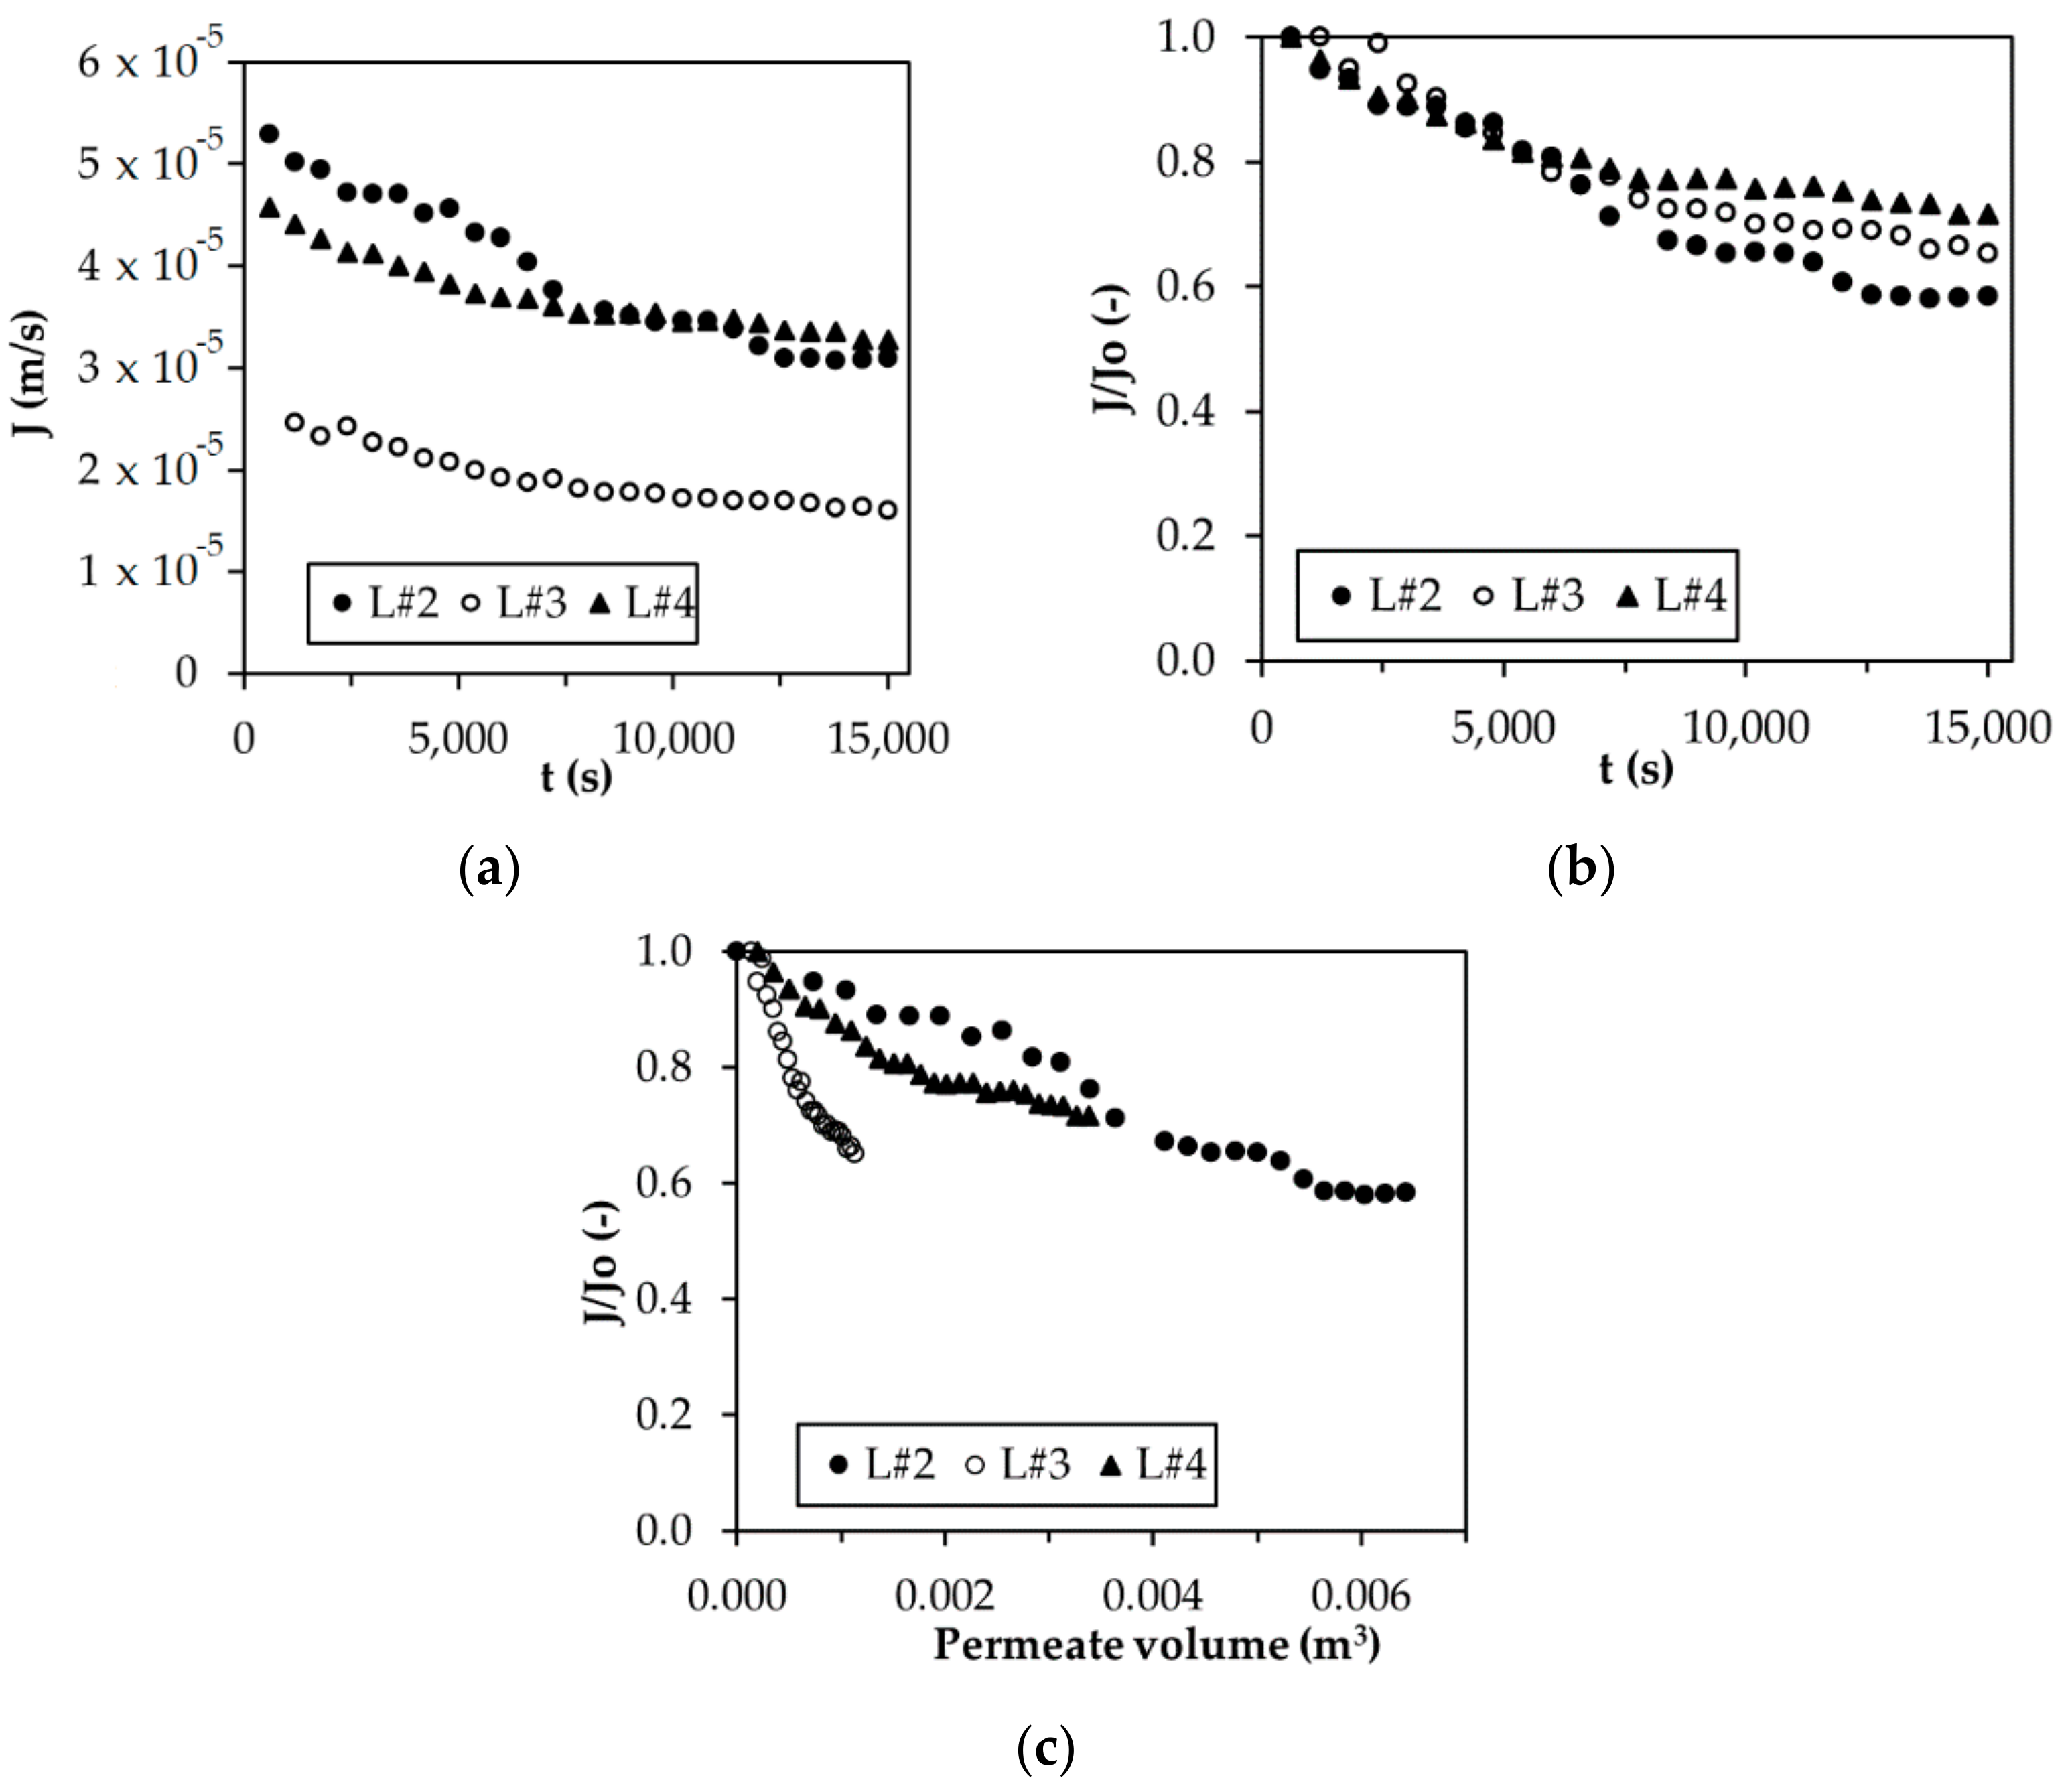
3.1. Flux Performance

The water permeability for the commercial membranes (C#1-C#2) as well as for the laboratory made membranes (L#2-L#4) was determined. In Table 3 are listed the obtained permeabilities. Commercial membranes showed the expected increment of permeability according to the cut-off given by the company. However, for laboratory-made membranes, the material and fabrication conditions determined the permeability of the membrane. Membranes L#2 and L#3 were polymerized at the same temperature (20 °C) and the water permeability of L#2 was substantially higher than the obtained for the L#3 membrane. The use of the PEG in the formulation of the membrane produces an important change in the membrane structure, likely reducing the pore diameter. According to the water permeabilities, we can assume that the cut-off of L#2 could be close to 30 kDa, while L#3 and L#4 cut-off are between the cut-off of membranes C#1 and C#2.
Laboratory-made membranes L#2–L#4 were studied in terms of membrane fouling during the concentration process of a synthetic feed solution of ISP with a concentration of 0.4% (4 g/L). The initial permeate fluxes in the concentration process were 5.37 × 10⁻⁵, 2.46 × 10⁻⁵ and 4.63 × 10⁻⁵ m/s for the L#2, L#3 and L#4 membranes, respectively (Figure 2a). As expected, the L#3 membrane showed a lower flux compared to the L#2 membrane. This might be due to the change in their composition: the presence of PEG in L#3 apparently reduces the size of these UF membrane pores. The membrane L#4, on the contrary, presents a flux evolution with time, closer to L#2 than to L#3, likely due to the higher temperature used during its fabrication (27 °C).
Flux decline (Figure 2b) is mostly due to the fouling of the membrane. Membranes including PEG in their composition showed lower fouling with a permeate flux decrease of around 28 and 35%, for L#4 and L#3 membranes, respectively, while L#2 gave a flux decline of about 42%. Thus, PEG addition in the membrane structure likely has a positive effect on the avoiding of the fouling process.
The larger decline in the normalized permeate flux observed in Figure 2c is directly related to higher hydraulic resistance [54].

3.2. Isolated Soy Protein Concentration

The study of the isolated soy protein has been done in terms of the volume reduction factor and its relation to the rejection index. All membranes have shown to different extents a not very remarkable capability to concentrate the feed solution (Figure 3a). In this figure, the different responses seem to be directly related to the permeability of each membrane. Thus, membrane L#2 that showed highest slope presented the highest permeability. On the other hand, membranes L#3 and L#4, prepared with PEG, showed lower VRF values because of their lower permeabilities.
Membrane L#3 showed the higher rejection index, which is related to previous observations regarding water permeability and permeate flux. The rejection index, R, increases as expected with VRF since the higher the VRF, the higher the fouling of the membrane, which limits the solute passing through the membrane (Figure 3b). For a VRF = 1.1, higher rejections are obtained in the order L#3 > L#2 > L#4. This is due not only to the membrane fouling but to the cut-off of the membrane, so membranes with lower cut-off likely present higher R. This is consistent with the cut-off ranges estimated from the permeability values (Table 3).

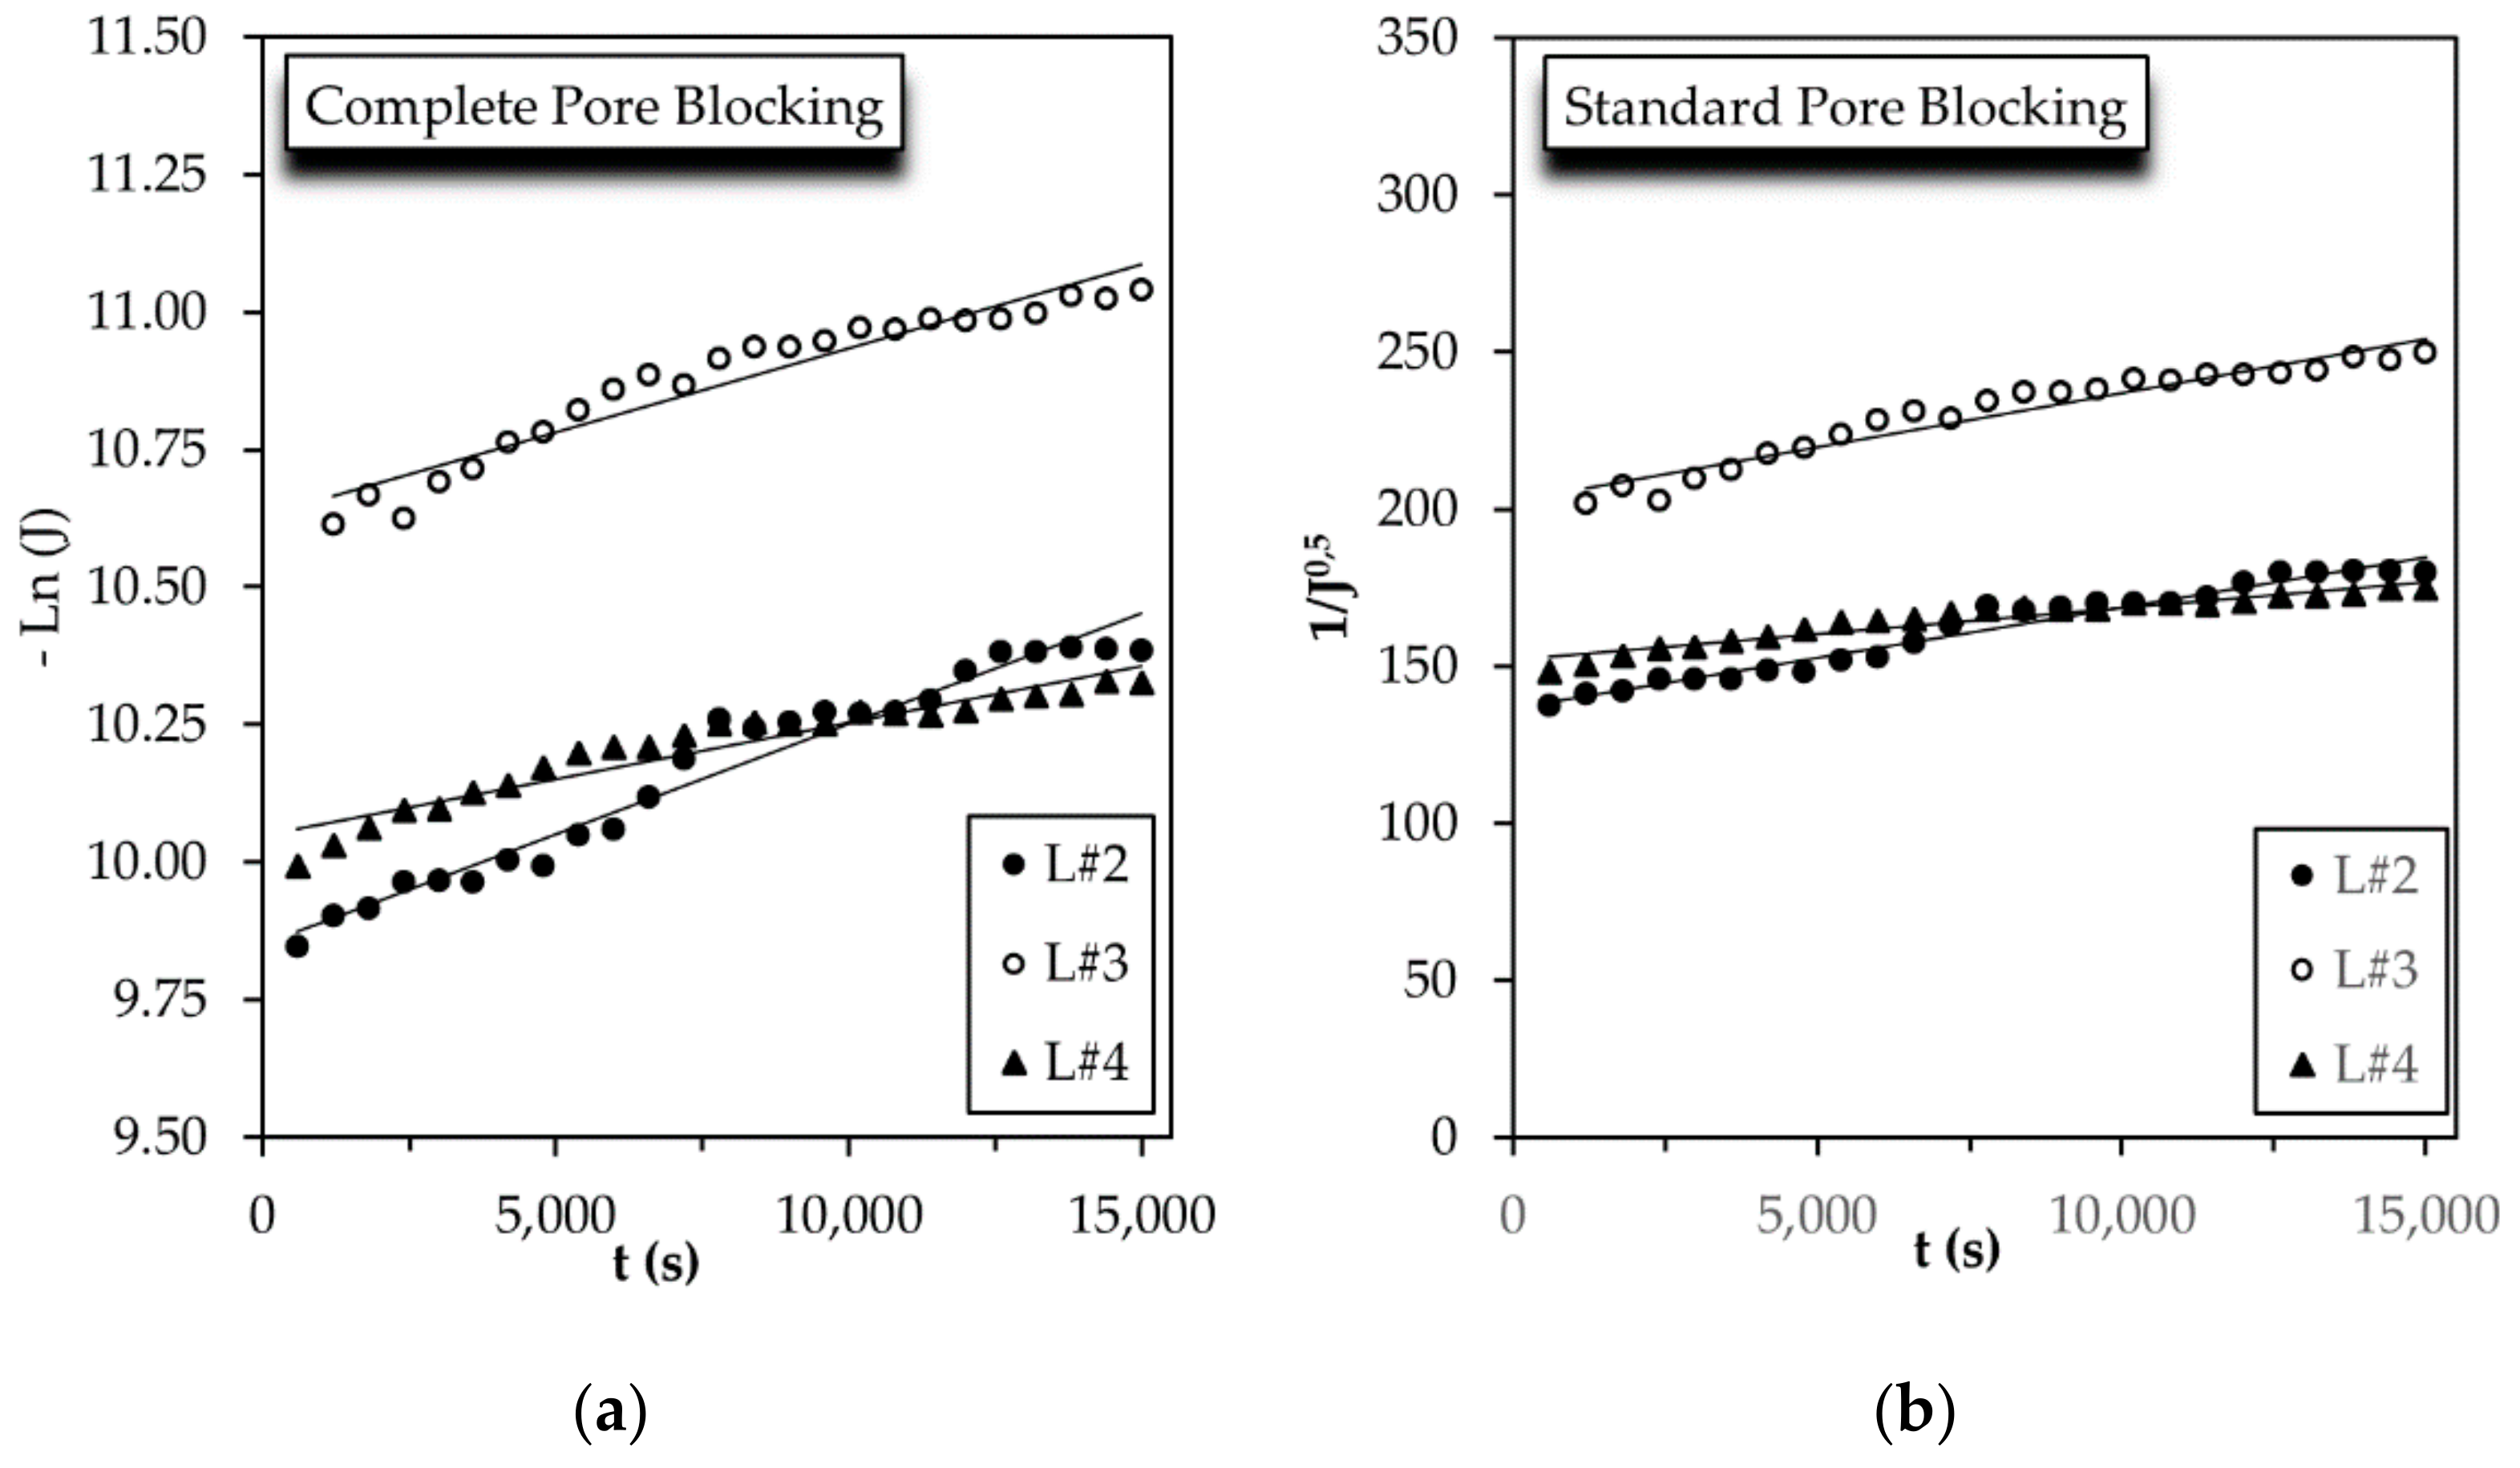
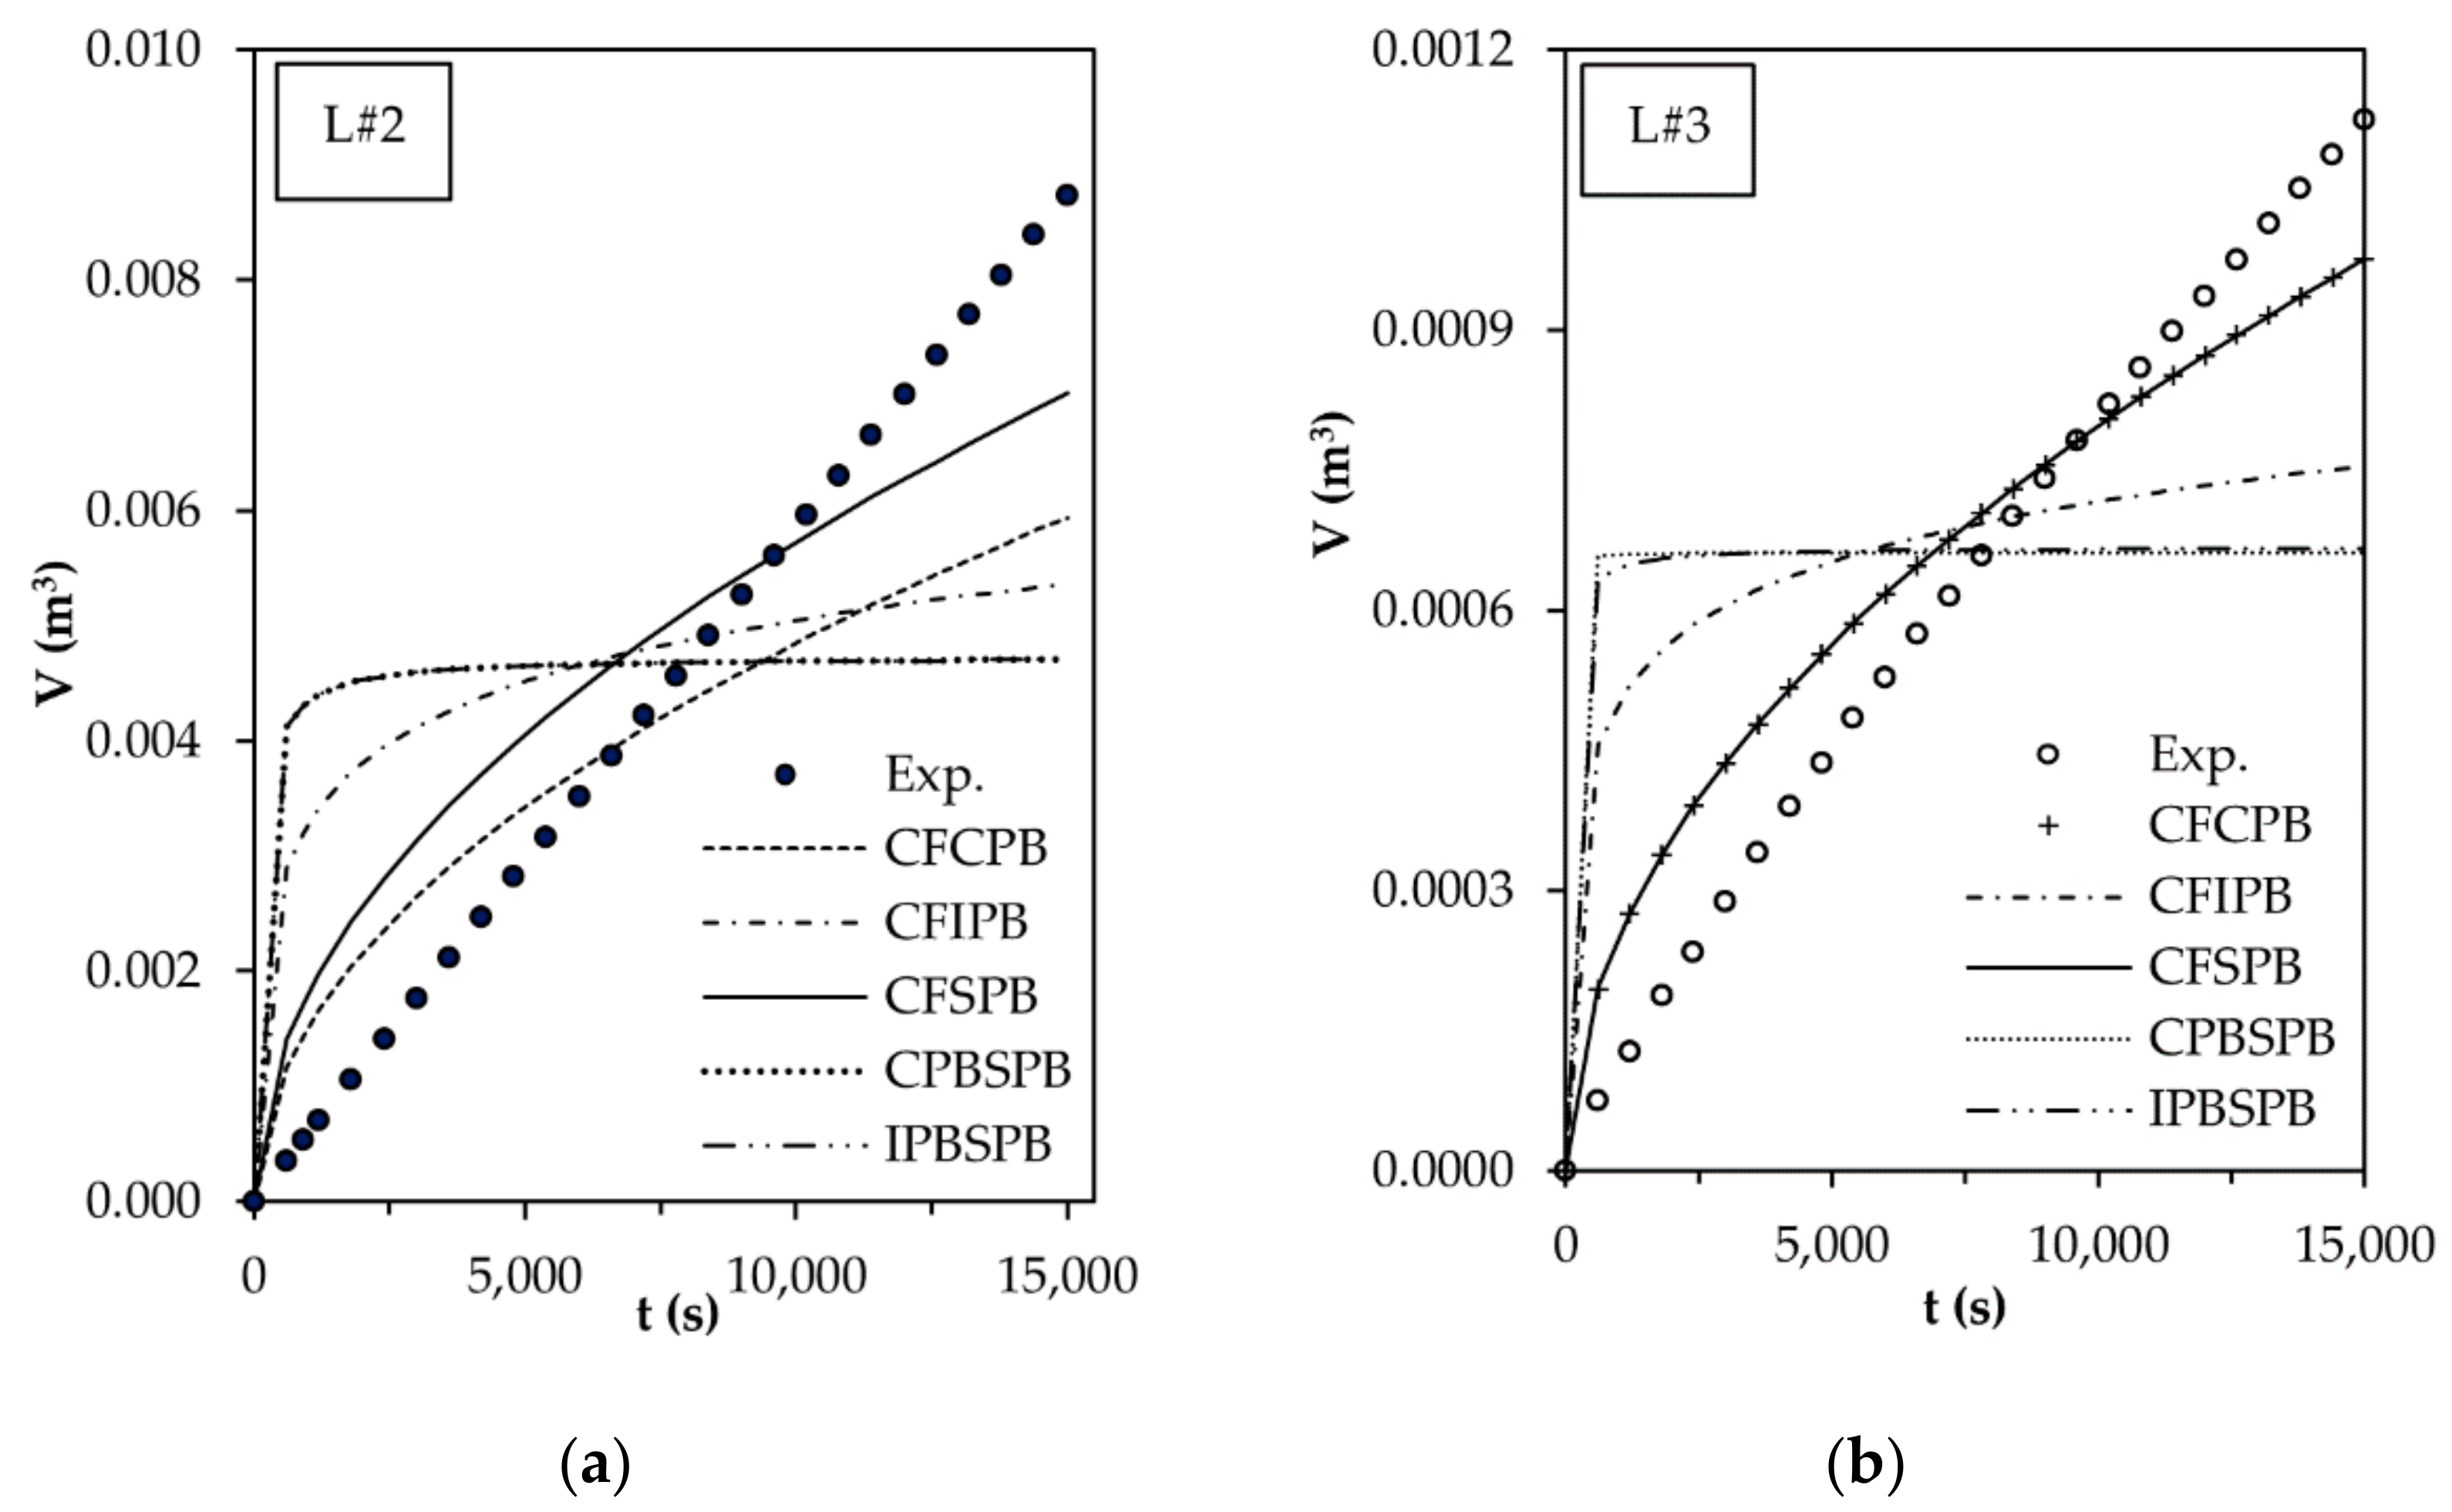
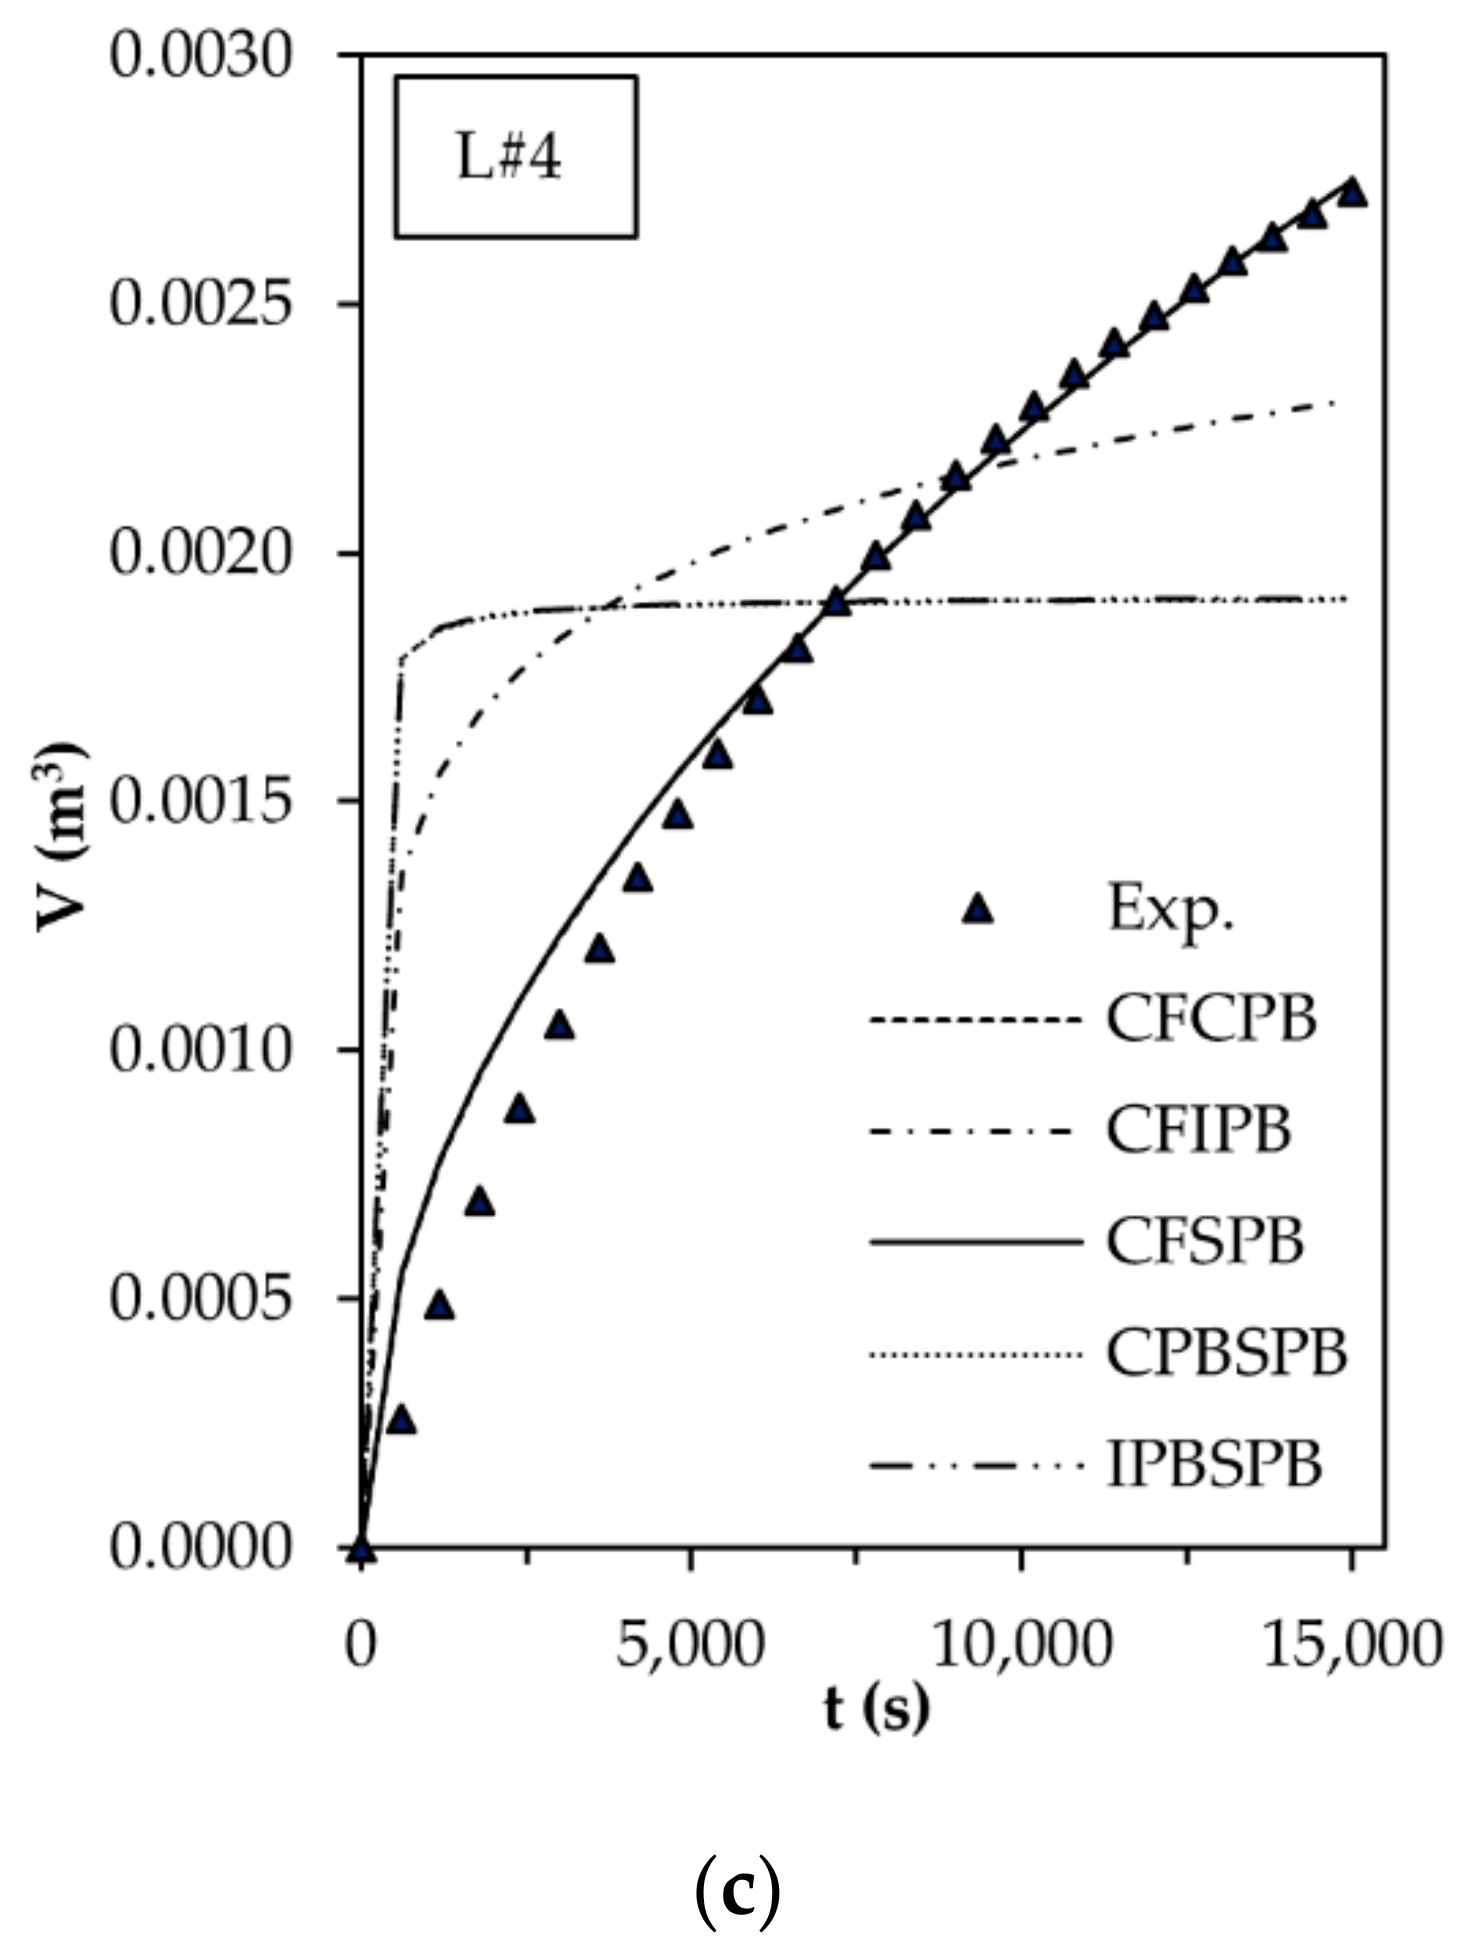
3.3. Flux Decline Mechanism

Experimental data have been represented according to Equations (8)–(11) to determine the flux decline mechanism governing the membrane blockage for all lab-made membranes (Figure 4). In Table 4 are listed both the lineal regression indexes and the different constants obtained for all Hermia’s mechanisms and membranes.
As shown in Figure 4 and Table 4, for membranes L#3 and L#4, the best fitting values correspond to the cake filtration model. However, in the case of membrane L#2, regression coefficients for all models are quite similar; thus, it is difficult to decide which model better fits the experimental data. In any case, in general the regression values obtained for the three lab-made membranes do not allow to conclude easily the mechanism governing the membrane fouling by ISP. From constants listed in Table 4, it was possible to depict the expected flux with time course according to the four Hermia’s mechanisms (Figure 5).
The fact that, especially for membrane L#4, experimental data are away from all fitted models is remarkable. This is due to the low regression coefficients found for all studied models that are in the range of 91–93%. For membrane L#3, regression coefficients were between 93–97%, and for membrane L#2, on the contrary, fitting was quite better between 97–98%.
Other authors found similar difficulties in the determination of the fouling mechanisms according to Hermia’s models (CPB, SPB, IPB and CF) [55,56]. In different studies, several combined models applicable to non-commercial UF membranes have been proposed and applied [55,56]. Three of the combined models are variations of the CF model with the addition of the effect of the other three Hermia’s mechanisms: Cake Filtration—Complete Pore Blocking (CFCPB); Cake Filtration—Intermediate Pore Blocking (CFIPB); and Cake Filtration—Standard Pore Blocking (CFSPB). Other combinations leading to another two models have been proposed: Complete Pore Blocking—Standard Pore Blocking (CPBSPB) and Intermediate Pore Blocking—Standard Pore Blocking (IPBSPB) [55,56,57]. In Table 5 are listed equations corresponding to the five combined models considered.
In Table 5, V is the cumulative permeate volume and Ki refers to different Hermia mechanisms in combination (Table 2). According to Equations (12)–(16), the different combined models proposed have been plotted in Figure 6. The SSE values were used to determine the goodness of each combined model. In Table 6 are listed the fitted parameters as well as the SSE values for all membranes.
As shown in Figure 6a, none of the combined models fit the experimental data for the L#2 membrane. However, for membranes L#3 and L#4, the CFCPB and CFSPB models are overlapped and are the models that better fit the experimental data, especially for the membrane L#4 (Figure 6b,c). For all membranes, models CFIPB, CPBSPB and IPBSPB are, by far, the combined models presenting a worse fitting. As expected, CFIPB, CPBSPB and IPBSPB models showed the highest SSE for L#2–L#4 membranes, meaning that the sum of squares deviation is more significant, and as consequence, they do not explain the flux decline of the lab-made membranes and can be disesteemed.
For L#3 and L#4 membranes, SSE showed approx. the same value, and it is not clear the determination of which combined model is the most applicable between the CFCPB and CFSPB models. However, it was found that the SSE for the CFSPB is around 10% higher than for the CFCPB for both L#3-L#4 membranes, which implies that CFCPB is the combined model that better explains the fouling effect of L#3 and L#4 membranes on the permeate flux decline. Moreover, according to Bolton et al. (2006) [18], it is possible to determine the contribution of the CF mechanism on the whole CFCPB combined model. The relation Kcf·J02/Kcb presents high values (138,190 and 82,227 for L#3 and L#4 membranes, respectively), meaning that CF strongly contributes to the membrane fouling.
According to the selected Cake Filtration—Complete Pore Blocking mechanism, pores are probably not blocked, while the membrane surface gets blocked for both simultaneous CPB and CF mechanisms. In general, these types of surface fouling are considered as reversible fouling that could be removed by physical cleaning methods [57].

4. Conclusions

The main goal of this work was to preparate different UF membranes under different formulation and fabrication conditions (L#2, L#3 and L#4). Comparing their water permeabilities with commercial UF membranes (C#1 and C#2), it was found that MWCO of L#2 membrane could be close to 30 kDa, while L#3 and L#4 MWCO are between 3–30 kDa. Regarding the flux decline, L#3 and L#4 membranes containing PEG showed lower fouling with a permeate flux decrease of around 35 and 28%, respectively, while L#2 gave a flux decline of about 42%. Thus, PEG addition likely has a positive effect on the prevention of the fouling process. It was not possible to clearly identify the Hermia mechanism governing the flux decline for any lab-made membrane. However, experimental data gave better fitting to models based on different combinations of pure Hermia mechanisms for PES/PEG membranes (L#3 and L#4). In particular, in the combination of pure cake filtration and complete pore blocking mechanisms (CFCPB) was found the fouling model that likely explains the permeate flux decline.

Author Contributions

Conceptualization, E.M.G.-C., A.I-C. and M.I.I.-C.; formal analysis, E.M.G.-C. and A.D.R.-L.; methodology, S.B.-D., A.I.-C. and J.P.-G.; investigation, A.I.-C. and J.P.-G.; supervision, M.I.I.-C.; data curation, E.M.G.-C. and A.D.R.-L.; writing—original draft preparation, E.M.G.-C., A.D.R.-L., S.B.-D., A.I.-C.; writing—review and editing, E.M.G.-C., A.D.R.-L. and M.I.I.-C.; funding acquisition, M.I.I.-C. All authors have read and agreed to the published version of the manuscript.

Funding

The Universitat Politècnica de València (Spain), through the project 2623 (PAID-05-10), funded this research.

Institutional Review Board Statement

Not applicable.

Informed Consent Statement

Not applicable.

Data Availability Statement

Not applicable.

Acknowledgments

The authors acknowledge the Universitat Politècnica de València (Spain) for its financial support through the project 2623 (PAID-05-10).

Conflicts of Interest

The authors declare no conflict of interest.

References

  1. Langevin, M.E.; Roblet, C.; Moresoli, C.; Ramassamy, C.; Bazinet, L. Comparative application of pressure- and electrically-driven membrane processes for isolation of bioactive peptides from soy protein hydrolysate. J. Membr. Sci. 2012, 403, 15–24. [Google Scholar] [CrossRef]
  2. Mondor, M.; Ali, F.; Ippersiel, D.; Lamarche, F. Impact of ultrafiltration/diafiltration sequence on the production of soy protein isolate by membrane technologies. Innov. Food Sci. Emerg. Technol. 2010, 11, 491–497. [Google Scholar] [CrossRef]
  3. Chove, E.; Grandison, A.S.; Lewis, M.J. Some functional properties of fractionated soy protein isolates obtained by microfiltration. Food Hydrocoll. 2007, 21, 1379–1388. [Google Scholar] [CrossRef]
  4. Moure, A.; Domínguez, H.; Parajó, J.C. Fractionation and Enzymatic Hydrolysis of Soluble Protein Present in Waste Liquors from Soy Processing. J. Agric. Food Chem. 2005, 53, 7600–7608. [Google Scholar] [CrossRef] [PubMed]
  5. Moure, A.; Domínguez, H.; Parajó, J.C. Ultrafiltration of industrial waste liquors from the manufacture of soy protein concentrates. J. Chem. Technol. Biotechnol. 2006, 81, 1252–1258. [Google Scholar] [CrossRef]
  6. Panwar, D.; Saini, A.; Panesar, P.S.; Chopra, H.K. Unraveling the scientific perspectives of citrus by-products utilization: Progress towards circular economy. Trends Food Sci. Technol. 2021, 111, 549–562. [Google Scholar] [CrossRef]
  7. Wilts, H.; Fecke, M.; Zeher, C. Economics of Waste Prevention: Second-Hand Products in Germany. Economies 2021, 9, 74. [Google Scholar] [CrossRef]
  8. Cassini, A.; Tessaro, I.C.; Marczak, L.; Pertile, C. Ultrafiltration of wastewater from isolated soy protein production: A comparison of three UF membranes. J. Clean. Prod. 2010, 18, 260–265. [Google Scholar] [CrossRef]
  9. Ali, F.; Ippersiel, D.; Lamarche, F.; Mondor, M. Characterization of low-phytate soy protein isolates produced by membrane technologies. Innov. Food Sci. Emerg. Technol. 2010, 11, 162–168. [Google Scholar] [CrossRef]
  10. Krishnakumar, N.; Yea, M.; Cheryan, M.; Kumar, N.K. Ultrafiltration of soy protein concentrate: Performance and modelling of spiral and tubular polymeric modules. J. Membr. Sci. 2004, 244, 235–242. [Google Scholar] [CrossRef]
  11. Susanto, H.; Widiasa, I.N. Ultrafiltration fouling of amylose solution: Behavior, characterization and mechanism. J. Food Eng. 2009, 95, 423–431. [Google Scholar] [CrossRef]
  12. Su, Y.; Li, C.; Zhao, W.; Shi, Q.; Wang, H.; Jiang, Z.; Zhu, S. Modification of polyethersulfone ultrafiltration membranes with phosphorylcholine copolymer can remarkably improve the antifouling and permeation properties. J. Membr. Sci. 2008, 322, 171–177. [Google Scholar] [CrossRef]
  13. Marcos, B.; Moresoli, C.; Skorepova, J.; Vaughan, B. CFD modeling of a transient hollow fiber ultrafiltration system for protein concentration. J. Membr. Sci. 2009, 337, 136–144. [Google Scholar] [CrossRef]
  14. Rajabzadeh, A.R.; Moresoli, C.; Marcos, B. Fouling behavior of electroacidified soy protein extracts during cross-flow ultrafiltration using dynamic reversible irreversible fouling resistances and CFD modeling. J. Membr. Sci. 2010, 361, 191–205. [Google Scholar] [CrossRef]
  15. Sosalagere, C.; Kehinde, B.A.; Sharma, P. Isolation and functionalities of bioactive peptides from fruits and vegetables: A reviews. Food Chem. 2022, 366, 130494. [Google Scholar] [CrossRef]
  16. Korhonen, H.; Pihlanto, A. Food-derived bioactive peptides-opportunities for designing future foods. Curr. Pharm. Des. 2003, 9, 1297–1308. [Google Scholar] [CrossRef] [PubMed] [Green Version]
  17. Hermia, J. Constant pressure blocking filtration laws-application to power law non Newtonian fluids. Inst. Chem. Eng. Trans. 1982, 60, 183–187. [Google Scholar]
  18. Bolton, G.; LaCasse, D.; Kuriyel, R. Combined models of membrane fouling: Development and application to microfiltration and ultrafiltration of biological fluids. J. Membr. Sci. 2006, 277, 75–84. [Google Scholar] [CrossRef]
  19. Charfi, A.; Ben Amar, N.; Harmand, J. Analysis of fouling mechanisms in anaerobic membrane bioreactors. Water Res. 2012, 46, 2637–2650. [Google Scholar] [CrossRef] [PubMed]
  20. Sarkar, B.; De, S. A combined complete pore blocking and cake filtration model for steady-state electric field-assisted ultrafiltration. AIChE J. 2012, 58, 1435–1446. [Google Scholar] [CrossRef]
  21. Ruby Figueroa, R.A.; Cassano, A.; Drioli, A. Ultrafiltration of orange press liquor: Optimization for permeate flux and fouling index by response surface methodology. Sep. Purif. Technol. 2011, 80, 1–10. [Google Scholar] [CrossRef]
  22. de Barros, S.T.D.; Andrade, C.M.G.; Mendes, E.S.; Peres, L. Study of fouling mechanism in pineapple juice clarification by ultrafiltration. J. Membr. Sci. 2003, 215, 213–224. [Google Scholar] [CrossRef]
  23. Grossman, A.D.; Yang, Y.; Yogev, U.; Calero Camarena, D.; Oron, G.; Bernstein, R. Effect of ultrafiltration membrane material on fouling dynamics in a submerged anaerobic membrane bioreactor treating domestic wastewater. Environ. Sci. Water Res. Technol. 2019, 5, 1145–1156. [Google Scholar] [CrossRef]
  24. Reddy, A.V.R.; Mohan, D.J.; Bhattacharya, A.; Shah, V.J.; Ghosh, P.K. Surface modification of ultrafiltration membranes by preadsorption of a negatively charged polymer: I. Permeation of water soluble polymers and inorganic salt solutions and fouling resistance properties. J. Membr. Sci. 2003, 214, 211–221. [Google Scholar] [CrossRef]
  25. Venault, A.; Chang, Y.; Wang, D.M.; Bouyer, D.; Higuchi, A.; Lai, J.Y. PEGylation of anti-biofouling polysulfone membranes via liquid- and vapor-induced phase separation processing. J. Membr. Sci. 2012, 403, 47–57. [Google Scholar] [CrossRef]
  26. Kim, J.H.; Kim, C.K. Ultrafiltration membranes prepared from blends of polyethersulfone and poly(1-vinylpyrrolidone-co-styrene) copolymers. J. Membr. Sci. 2005, 262, 60–68. [Google Scholar] [CrossRef]
  27. Dong, H.B.; Xu, Y.Y.; Yi, Z.; Shi, J.L. Modification of polysulfone membranes via surface-initiated atom transfer radical polymerization. Appl. Surf. Sci. 2009, 255, 8860–8866. [Google Scholar] [CrossRef]
  28. Shi, Q.; Su, Y.; Zhu, S.; Li, C.; Zhao, Y.; Jiang, Z. A facile method for synthesis of pegylated polyethersulfone and its application in fabrication of antifouling ultrafiltration membrane. J. Membr. Sci. 2007, 303, 204–212. [Google Scholar] [CrossRef]
  29. Saha, N.K.; Balakrishnan, M.; Ulbricht, M. Fouling control in sugarcane juice ultrafiltration with surface modified polysulfone and polyethersulfone membranes. Desalination 2009, 249, 1124–1131. [Google Scholar] [CrossRef]
  30. Susanto, H.; Arafat, H.; Janssen, E.M.L.; Ulbricht, M. Ultrafiltration of polysaccharide protein mixtures: Elucidation of fouling mechanisms and fouling control by membrane surface modification. Sep. Purif. Technol. 2008, 63, 558–565. [Google Scholar] [CrossRef]
  31. Korzhova, E.; Déon, S.; Koubaa, Z.; Fievet, P.; Lopatin, D.; Baranov, O. Modification of commercial UF membranes by electrospray deposition of polymers for tailoring physicochemical properties and enhancing filtration performances. J. Membr. Sci. 2020, 598, 117805. [Google Scholar] [CrossRef]
  32. Enfrin, M.; Wang, J.; Merenda, A.; Dumée, L.F.; Lee, J. Mitigation of membrane fouling by nano/microplastics via surface chemistry control. J. Membr. Sci. 2021, 633, 119379. [Google Scholar] [CrossRef]
  33. Gao, N.; Li, M.; Jing, W.; Fan, Y.; Xu, N. Improving the filtration performance of ZrO2 membrane in non-polar organic solvents by surface hydrophobic modification. J. Membr. Sci. 2011, 375, 276–283. [Google Scholar] [CrossRef]
  34. Peyravi, M.; Rahimpour, A.; Jahanshahi, M.; Javadi, A.; Shockravi, A. Tailoring the surface properties of PES ultrafiltration membranes to reduce the fouling resistance using synthesized hydrophilic copolymer. Microporous Mesoporous Mater. 2012, 160, 114–125. [Google Scholar] [CrossRef]
  35. Rahimpour, A.; Madaeni, S.S.; Jahanshahi, M.; Mansourpanah, Y.; Mortazavian, N. Development of high performance nano-porous polyethersulfone ultrafiltration membranes with hydrophilic surface and superior antifouling properties. Appl. Surf. Sci. 2009, 255, 9166–9173. [Google Scholar] [CrossRef]
  36. Chakrabarty, B.; Ghoshal, A.; Purkait, M. Effect of molecular weight of PEG on membrane morphology and transport properties. J. Membr. Sci. 2008, 309, 209–221. [Google Scholar] [CrossRef]
  37. Rahimpour, A.; Madaeni, S. Polyethersulfone (PES)/cellulose acetate phthalate (CAP) blend ultrafiltration membranes: Preparation, morphology, performance and antifouling properties. J. Membr. Sci. 2007, 305, 299–312. [Google Scholar] [CrossRef]
  38. Peeva, P.D.; Knoche, T.; Pieper, T.; Ulbricht, M. Cross-flow ultrafiltration of protein solutions through unmodified and surface functionalized polyethersulfone membranes – Effect of process conditions on separation performance. Sep. Purif. Technol. 2012, 92, 83–92. [Google Scholar] [CrossRef]
  39. Essalhi, M.; Khayet, M. Self-sustained webs of polyvinylidene fluoride electrospun nanofibers at different electrospinning times: 2. Theoretical analysis, polarization effects and thermal efficiency. J. Membr. Sci. 2013, 433, 180–191. [Google Scholar] [CrossRef]
  40. Eykens, L.; Hitsovac, I.; De Sitter, K.; Dotremont, C.; Pinoyd, L.; Nopens, I.; Van der Bruggen, B. Influence of membrane thickness and process conditions on direct contact membrane distillation at different salinities. J. Membr. Sci. 2016, 498, 353–364. [Google Scholar] [CrossRef]
  41. Mai, H.C. Application of cross-flow filtration technique in purification and concentration of juice from Vietnamese fruits. Beverages 2017, 3, 44. [Google Scholar] [CrossRef] [Green Version]
  42. Campos, P.R.F.; Módenes, A.N.; Espinoza-Quiñones, F.R.; Trigueros, D.E.G.; Barros, S.T.D.; Pereira, N.C. Improvement on the concentrated grape juice physico-chemical characteristics by an enzymatic treatment and Membrane Separation Processes. An. Acad. Bras. Ciências 2016, 88, 423–436. [Google Scholar] [CrossRef] [Green Version]
  43. Ng, C.Y.; Mohammad, A.W.; Ng, L.Y.; Jahim, J.M. Membrane fouling mechanisms during ultrafiltration of skimmed coconut milk. J. Food Eng. 2014, 142, 190–200. [Google Scholar] [CrossRef]
  44. Kirschner, A.Y.; Cheng, Y.-H.; Paul, D.R.; Field, R.W.; Freeman, B.D. Fouling mechanisms in constant flux crossflow ultrafiltration. J. Membr. Sci. 2019, 574, 65–75. [Google Scholar] [CrossRef] [Green Version]
  45. Lamdande, A.G.; Mittal, R.; Raghavarao, K.S.M.S. Flux evaluation based on fouling mechanism in acoustic field-assisted ultrafiltration for cold sterilization of tender coconut water. Innov. Food Sci. Emerg. Technol. 2020, 61, 102312. [Google Scholar] [CrossRef]
  46. Coelho, L.L.; Scaratti, G.; Hissanaga, A.M.; Oechsler, B.F.; José, H.J.; Moreira, R.F.P.M. Modeling and fouling control in a hybrid membrane process using CuO-catalytic membrane coupled to ozone. J. Environ. Chem. Eng. 2021, 9, 106138. [Google Scholar] [CrossRef]
  47. Cainglet, H.E.; Saavedra, T.; Bürgmayr, S.; Zhang, J.; Xie, Z.; Garnier, G.; Tanner, J. Recycled paper mill process water pre-treatment using ultrafiltration for water system closure. J. Water Process. Eng. 2021, 44, 102407. [Google Scholar] [CrossRef]
  48. Yogarathinam, L.T.; Velswamy, K.; Gangasalam, A.; Ismail, A.F.; Goh, P.S.; Narayanan, A.; Abdullah, M.S. Performance evaluation of whey flux in dead-end and cross-flow modes via convolutional neural networks. J. Environ. Manag. 2022, 301, 113872. [Google Scholar] [CrossRef]
  49. Bradford, M.M. A rapid and sensitive method for the quantification of microgram quantities of protein utilizing the principle of protein-dye binding. Anal. Biochem. 1976, 72, 248–254. [Google Scholar] [CrossRef]
  50. Rai, C.; Rai, P.; Majumdar, G.C.; De, S.; DasGupta, S. Mechanism of permeate flux decline during microfiltration of watermelon (Citrillus lanatus) juice. Food Bioprocess Technol. 2010, 3, 545–553. [Google Scholar] [CrossRef]
  51. Garcia-Castello, E.M.; Mayor, L.; Chorques, S.; Argüelles, A.; Vidal-Brotóns, D.; Gras, M.L. Reverse osmosis concentration of press liquid from orange juice solid wastes: Flux decline mechanisms. J. Food Eng. 2011, 106, 199–205. [Google Scholar] [CrossRef]
  52. Cassano, A.; Marchio, M.; Drioli, E. Clarification of blood orange juice by ultrafiltration: Analyses of operating parameters, membrane fouling and juice quality. Desalination 2007, 212, 15–27. [Google Scholar] [CrossRef]
  53. Nguyen, T.A.; Yoshikawa, S.; Karasu, K.; Ookawara, O. A simple combination model for filtrate flux in cross-flow ultrafiltration of protein suspension. J. Membr. Sci. 2012, 403, 84–93. [Google Scholar] [CrossRef]
  54. Wang, F.; Tarabara, V.V. Pore blocking mechanisms during early stages of membrane fouling by colloids. J. Colloid Interface Sci. 2008, 328, 464–469. [Google Scholar] [CrossRef]
  55. Jafarzadeh, Y.; Yegani, R.; Sedaghat, M. Preparation, characterization and fouling analysis of ZnO/polyethylene hybrid membranes for collagen separation. Chem. Eng. Res. Des. 2015, 94, 417–427. [Google Scholar] [CrossRef]
  56. Heidari, S.; Etemadi, H.; Yegani, R. A comprehensive analysis of membrane fouling in microfiltration of complex linear macromolecules based on theoretical modeling and FESEM images. J. Chem. Technol. Biotechnol. 2021, 96, 360–373. [Google Scholar] [CrossRef]
  57. Akbari, A.; Yegani, R.; Pourabbas, B.; Behboudi, A. Fabrication and study of fouling characteristics of HDPE/PEG grafted silica nanoparticles composite membrane for filtration of Humic acid. Chem. Eng. Res. Des. 2016, 109, 282–296. [Google Scholar] [CrossRef]
Figure 1. Lab scale plant for the ultrafiltration experiments.
Sustainability 13 13682 g001
Figure 2. (a) Time course of the permeate flux; (b) time course of the normalized permeate flux, J/J0; (c) evolution of the normalized permeate flux with cumulative permeate volume. Experimental conditions: feed solution concentration, 0.4%; temperature, 25 °C; TMP, 2 bar; flow rate, 220 L/h.
Sustainability 13 13682 g002
Figure 3. (a) Time course of the volume retention factor; (b) influence of volume retention factor on rejection index. Experimental conditions: feed solution concentration, 0.4%; temperature, 25 °C; TMP, 2 bar; flow rate, 220 L/h.
Sustainability 13 13682 g003
Figure 4. Application of blocking mechanisms to experimental data for L#2, L#3 and L#4 membranes: (a) complete pore blocking; (b) standard pore blocking; (c) intermediate pore blocking; (d) cake filtration. (Experimental conditions: feed solution concentration, 0.4%; temperature, 25 °C; TMP, 2 bar; flow rate, 220 L/h.)
Sustainability 13 13682 g004aSustainability 13 13682 g004b
Figure 5. Experimental data and expected values of flux as a function of the Hermia’s mechanism considered: (a) membrane L#2; (b) membrane L#3; (c) membrane L#4. (Experimental conditions: feed solution concentration, 0.4%; temperature, 25 °C; TMP, 2 bar; flow rate, 220 L/h.)
Sustainability 13 13682 g005
Figure 6. Experimental data and expected values of flux as a function of the combined Hermia mechanisms: (a) membrane L#2; (b) membrane L#3; (c) membrane L#4. CFCPB, Cake Filtration—Complete Pore Blocking; CPIPB, Cake Filtration—Intermediate Pore Blocking; CPSPB, Cake Filtration—Standard Pore Blocking; CPBSPB, Complete Pore Blocking—Standard Pore Blocking; IPBSPB, Intermediate Pore Blocking—Standard Pore Blocking. (Experimental conditions: feed solution concentration, 0.4%; temperature, 25 °C; TMP, 2 bar; flow rate, 220 L/h.)
Sustainability 13 13682 g006aSustainability 13 13682 g006b
Table 1. Characteristics of the commercial membranes used.
Ref.PES (%) 1PEG (%) 1DMA (%) 1Temperature (°C)
L#218--8220
L#31538220
L#41538227
1 percentage expressed in w/w.
Table 2. Hermia flux decline mechanisms (adapted from [17,50,51,52]).
Flux Decline MechanismnEquation
Complete pore blocking (CPB)2.0 L n J = L n J 0 K c b · t (8)
Standard pore blocking (SPB)1.5 1 J 1 2 = 1 J 0 1 2 + K s b · t (9)
Intermediate pore blocking (IPB) 1.0 1 J = 1 J 0 + K i b · t (10)
Cake filtration (CF)0.0 1 J 2 = 1 J 0 2 + K c f · t (11)
Table 3. Water permeabilities for commercial (C#1 and C#2) and laboratory-made (L#2–L#4) membranes.
C#1C#2L#2L#3L#4
Permeability (m/s·bar)5.8 × 10−63.5 × 10−56.9 × 10−59.5 × 10−61.7 × 10⁻⁵
Resistance (s·bar/m)1.72 × 1052.86 × 1041.45 × 1041.05 × 1055.88 × 104
Cut-off (kDa)330n.d.n.d.n.d.
MaterialPESPESPESPES/PEGPES/PEG
n.d.: Not determined.
Table 4. Regression coefficients and fouling constants for the membranes L#2, L#3 and L#4 according to Hermia’s mechanisms.
CPBSPBIPBCF
L#2R2 = 0.960R2 = 0.964R2 = 0.966R2 = 0.966
Kcb = 0.00004 s−1Ksb = 0.0032 m−1Kib = 1.0344 m−1Kcf = 54,156 s m−2
L#3R2 = 0.925R2 = 0.937R2 = 0.948R2 = 0.965
Kcb = 0.000030 s−1Ksb = 0.0035 m−1Kib = 1.5699 m−1Kcf = 163,602 s m−2
L#4R2 = 0.913R2 = 0.924R2 = 0.934R2 = 0.950
Kcb = 0.0000205 s−1Ksb = 0.0017 m−1Kib = 0.5457 m−1Kcf = 29,153 s m−2
Table 5. Combined flux decline models based on the Hermia’s mechanisms [55,56,57].
Flux Decline MechanismEquationFitted
Parameters
CFCPB V = J 0 K c b · 1 exp K c b K c f · J 0 2 · 1 + 2 · K c f · J 0 2 · t 1 Kcf (s·m−2);
Kcb (s−1)
(12)
CFIPB V = 1 K i b · l n 1 + K i b K c f · J 0 · 1 + 2 · K c f · J 0 2 · t 1 Kcf (s·m−2);
Kib (m−1)
(13)
CFSPB V = 2 K s b · β   c o s 2 · π 3 1 3 a r c c o s α + 1 3 α = 8 27 · β 3 + 4 · K s b 3 · β 3 · K c f · J 0 4 · K s b 2 · t 3 · β 3 · K c f β = 4 9 + 4 · K s b 3 · K c f · J 0 + 2 · K s b 2 · t 3 · K c f Kcf (s·m−2);
Ksb (m−1)
(14)
CPBSPB V = J 0 K c b · 1 exp 2 · K c b 2 + K s b · J 0 · t Kcb (s−1);
Ksb (m−1)
(15)
IPBSPB V = 1 K i b · l n 1 + 2 · K i b · J 0 2 2 + K s b · J 0 · t Kib (m−1);
Ksb (m−1)
(16)
Table 6. Fouling parameters and SSE for the membranes L#2, L#3 and L#4 according to three different combined models.
L#2L#3L#4
Cake Filtration—Complete Pore Blocking, CFCPBSSE = 4.32 × 10⁻⁵SSE = 2.46 × 10⁻⁷SSE = 2.71 × 10⁻⁷
Kcf = 8.44 × 10⁸ s·m−2Kcf = 3.13 × 10¹⁰ s·m−2Kcf = 3.93 × 10⁹ s·m−2
Kcb = 1 × 10⁻¹³ s−1Kcb = 0.00010 s−1Kcb = 0.00010 s−1
Cake Filtration—Intermediate Pore Blocking, CFIPBSSE = 9.60 × 10⁻⁵SSE = 1.34 × 10⁻⁶SSE = 5.65 × 10⁻⁶
Kcf = 0.0460 s·m−2Kcf = 0.2000 s·m−2Kcf = 0.2000 s·m−2
Kib = 1294.236 m−1Kib = 10,786.366 m−1Kib = 3357.282 m−1
Cake Filtration—Standard Pore Blocking, CFSPBSSE = 2.68 × 10⁻⁵SSE = 2.49 × 10⁻⁷SSE = 2.75 × 10⁻⁷
Kcf = 0.00254 s·m−2Kcf = 0.13158 s·m−2Kcf = 0.0166 s·m−2
Ksb=9.42 × 10⁶ m−1Ksb=9.57 × 10⁶ m−1Ksb=9.54 × 10⁶ m−1
Complete Pore Blocking—Standard Pore Blocking, CPBSPBSSE = 1.48 × 10⁻⁴SSE = 2.10 × 10⁻⁶SSE = 1.48 × 10⁻⁴
Kcb = 10−7 s−1Kcb = 0.0318 s−1Kcb = 0.0017
Ksb = 422.61 m−1Ksb = 403.78 m−1Ksb = 1008.75 m−1
Intermediate Pore Blocking—Standard Pore Blocking, IPBSPBSSE = 1.48·10−4SSE = 2.07·10−6SSE = 9.81 × 10⁻⁶
Kib = 0.0210 m−1Kib = 0.0200 m−1Kib = 0.0210 m−1
Ksb = 422.59 m−1Ksb = 2997.98 m−1Ksb = 1045.74 m−1
Publisher’s Note: MDPI stays neutral with regard to jurisdictional claims in published maps and institutional affiliations.

