Article

Green Hydrogen Value Chain in the Sustainability for Port Operations: Case Study in the Region of Valparaiso, Chile

by
Yunesky Masip Macía
1,*,
Pablo Rodríguez Machuca
2,
Angel Alexander Rodríguez Soto
1 and
Roberto Carmona Campos
1
1
Escuela de Ingeniería Mecánica, Quilpué, Pontificia Universidad Católica de Valparaíso, Valparaíso 2430120, Chile
2
Departamento de Geografía, Facultad de Ingeniería, Universidad de Santiago de Chile, Santiago de Chile 9170020, Chile
*
Author to whom correspondence should be addressed.
Sustainability 2021, 13(24), 13681; https://doi.org/10.3390/su132413681
Submission received: 7 November 2021 / Revised: 25 November 2021 / Accepted: 7 December 2021 / Published: 10 December 2021
(This article belongs to the Section Energy Sustainability)

Abstract

:
The paper presents a complete value chain for the use of green hydrogen in a port facility. The main objective was to propose the sizing of the main components that make up green hydrogen to ensure the supply of 1 MWe in replacing the diesel generator. The energy demand required for the port was determined by establishing the leading small and large-scale conventional energy-consuming equipment. Hence, 60 kgH2 was required to ensure the power supply. The total electrical energy to produce all the hydrogen was generated from photovoltaic solar energy, considering three-generation scenarios (minimum, maximum and the annual average). In all cases, the energy supply in the electrolyzer was 3.08 MWe. In addition, the effect of generating in the port facility using a diesel generator and a fuel cell was compared. The cost of 1 kgH2 could be 4.09 times higher than the cost of 1 L of diesel, meaning that the output kWh of each system is economically similar. In addition, the value of electrical energy through a Power Purchase Agreement (PPA) was a maximum of 79.79 times the value of a liter of diesel. Finally, the Levelized Cost of Energy (LCOE) was calculated for two conditions in which the MWe was obtained from the fuel cell without and with the photovoltaic solar plant.

1. Introduction

The decarbonization of the energy sector requires urgent action on a global scale while a global energy transition is taking place [1]. Therefore, it is crucial to take more actions to reduce carbon emissions and mitigate the effects of climate change. Based on this, renewable energy and energy efficiency measures can potentially achieve 90% of the required carbon reductions [2,3].
One of the global players, the International Renewable Energy Agency (IRENA), has evaluated the decarbonization pathways through REmap [4]. This plan is to determine the potential of countries, regions and the world to expand renewable energy. In addition, it supports and accelerates the energy transition by providing the necessary knowledge, tools and support to member countries as they increase the share of renewables in their energy sectors.
In the specific case of Chile, during the last decade, the energy system has undergone a profound transformation due to the impact of two factors: the increase in energy demand due to rapid economic growth and changes in climatic conditions. It was reflected during 2020 through the gross electricity generation of the National Electric System (SEN), where approximately 35% was produced from coal plants, which, since the 2000s, have substantially increased their participation in the electricity production of Chile [5]. In addition, the irruption of Renewable Energy Systems (RES), mainly solar and wind, which began to be exploited in the 2010s, in 2020 represented more than 20% of the total energy generation of the SEN [6]. Thus, an upward trend that promises to reduce the emission of Greenhouse Gases (GHG) in the energy sector, the emission factor of the SEN was 0.3905 tCO2eq/MWh for the year 2020.
According to the last available energy balance [7], primary and secondary energy carriers consumptions were distributed according to the graph shown in Figure 1. In this, it was observed that the transportation sector and the industrial and mining sector represent 75% of the total energy consumed in the country. In addition, the transportation sector has large consumptions for ground and maritime transport, representing 85% of all consumption. Meanwhile, in the industry and mining sector, more than 50% of the energy consumed in this sector corresponds to copper and pulp-paper. It should be noted that Chile imports almost all of the energy it consumes, where oil accounts for 98%, coal for 91% and natural gas for 81%. These numbers show that Chile is an energy-dependent country and, during the current COVID-19 pandemic, this was reflected more strongly. Therefore, this has prompted the government and business sector of the country to search for new strategies for development and energy future. At that point, the “National Green Hydrogen Strategy in Chile” [8] has come to play a fundamental role.
In this sense, for hydrogen (H2) development as an energy vector, RES resources play a crucial role in the transition towards a clean and sustainable energy system [9,10,11]. The main challenge in the transition to 100% RES is a variable and intermittent nature [12,13,14]. It requires technical adaptation, particularly balancing variable supply and variable demand for energy [15]. The increased penetration of renewable energies in current energy systems raises the need for large-scale energy storage systems to cope with the variability and intermittency of renewable energy sources [16,17].
Based on this, H2 plays an essential role in the future of the energy system worldwide, constituting a pillar of the path towards energy transformation and the decarbonization objectives [18]. The conversion of electricity to H2 represents a viable way to reduce the impacts of so-called renewable electricity in electricity grids [19]. H2 allows the integration of renewable electricity in sectors difficult to electrify, such as heat and industry [20,21,22]. In addition, it provides energy storage capacity, showing competitiveness for other technologies for reliability reasons or large storage volumes [23,24]. It is worth mentioning that this H2 produced from renewable energy sources is called green hydrogen (green H2) [25].
To a large extent, the techno-economic viability of green H2 production depends on the country’s specific resources and the characteristics of the energy market, which play a fundamental role in determining cost competitiveness [26,27]. Therefore, the estimation and projection of costs for the green H2 must be carried out with care to obtain precise values [28,29]. Furthermore, the transport route, mode and carrier significantly affect the overall structure of the supply chain and the levelized cost of hydrogen (LCOH). Each step for the development and future of this technology in the country is highly complex to model [30,31], hence the care that must be taken when offering certain costs and energy indicators associated with green H2 [32,33].
Recently, studies by [23,34,35,36,37] place Chile as one of the largest producers of green H2 worldwide, as well as one of the international strategic routes for the commercialization of H2 together with other producers, such as Argentina, Australia, North Africa (Morocco, Algeria), the Middle East (Saudi Arabia, Iran). Hence, the analysis and evaluation of the green H2 in Chile have gained significant strength in recent times [8]. However, most studies in Chile have focused on the viability of green H2 production [18,30,34,38,39,40]. However, the main problem in this value chain is storage [41,42,43,44,45] since it must be defined very carefully according to the conditions of each application.
Other studies provide detailed information on a step in the supply chain, such as electrolysis [28,29], ammonia conversion [46] or the transport and distribution phases [36,47], emissions of CO2 and other GHGs [48], without considering the complete supply chain or applications from a comprehensive point of view. In the case of the study [49], the authors investigated the complete supply chain of green H2 in the Atacama Desert region, but only based on solar energy for 2018 and the projected scenarios for 2025–2030. This study used hourly electrical profile data from several years of photovoltaic plants in actual operation and simulated concentration solar plants (CSP) with thermal energy storage (TES), as well as the commercial value of electricity. Additionally, analyses have been carried out based on Chile [50,51,52], although most focus on determining the cost of renewable energy production and do not fully evaluate the distribution and transportation phase of storage with LH2 and NH3, the fuel cell technologies to be used and the GHG emissions.
The works of [53,54] have determined the increase in GHG emissions in port facilities, which gives it significant importance within the transport sector, responsible for approximately 37% of the consumption of all the countries energy. The energy demand of international shipping, including seaports, has increased by 1.6% per year between 2000 and 2015 [55]—increasing demand for energy results in higher energy costs, pollutants and GHG emissions. Energy costs can represent a significant overhead for ports and terminals, and reducing these could bring valuable savings to the company [56]. Similarly, reducing emissions contributes directly to the sustainability and ecological perspective of ports [57]. In these studies, the most conflictive areas from the GHG point of view in port operations were also identified, which goes hand in hand with the Terminal Pacífico Sur Valparaíso (TPS) study [58,59,60].
For this reason, the main objective of the article is to propose a complete value chain for the potential use of green H2 produced from renewable energy (solar) in the activities of a port, that is, those that are under control from the port in order to reduce GHG emissions (CO2eq). In addition, a comparison was made of the use of electrical energy demanded in a port facility using a fuel cell concerning that supplied by a diesel generator.
The originality and novelty lie both in the object of study and in the theoretical and methodological frameworks. Unfortunately, studies on a complete value chain proposal for green H2 produced in Chile are scarce. For this reason, this study focuses on evaluating the consequences, effects, and short-term challenges for the final use of green H2 in the country, through a specific application in strategic consumers of port facilities, which contributes to the country energy transition to face climate change.

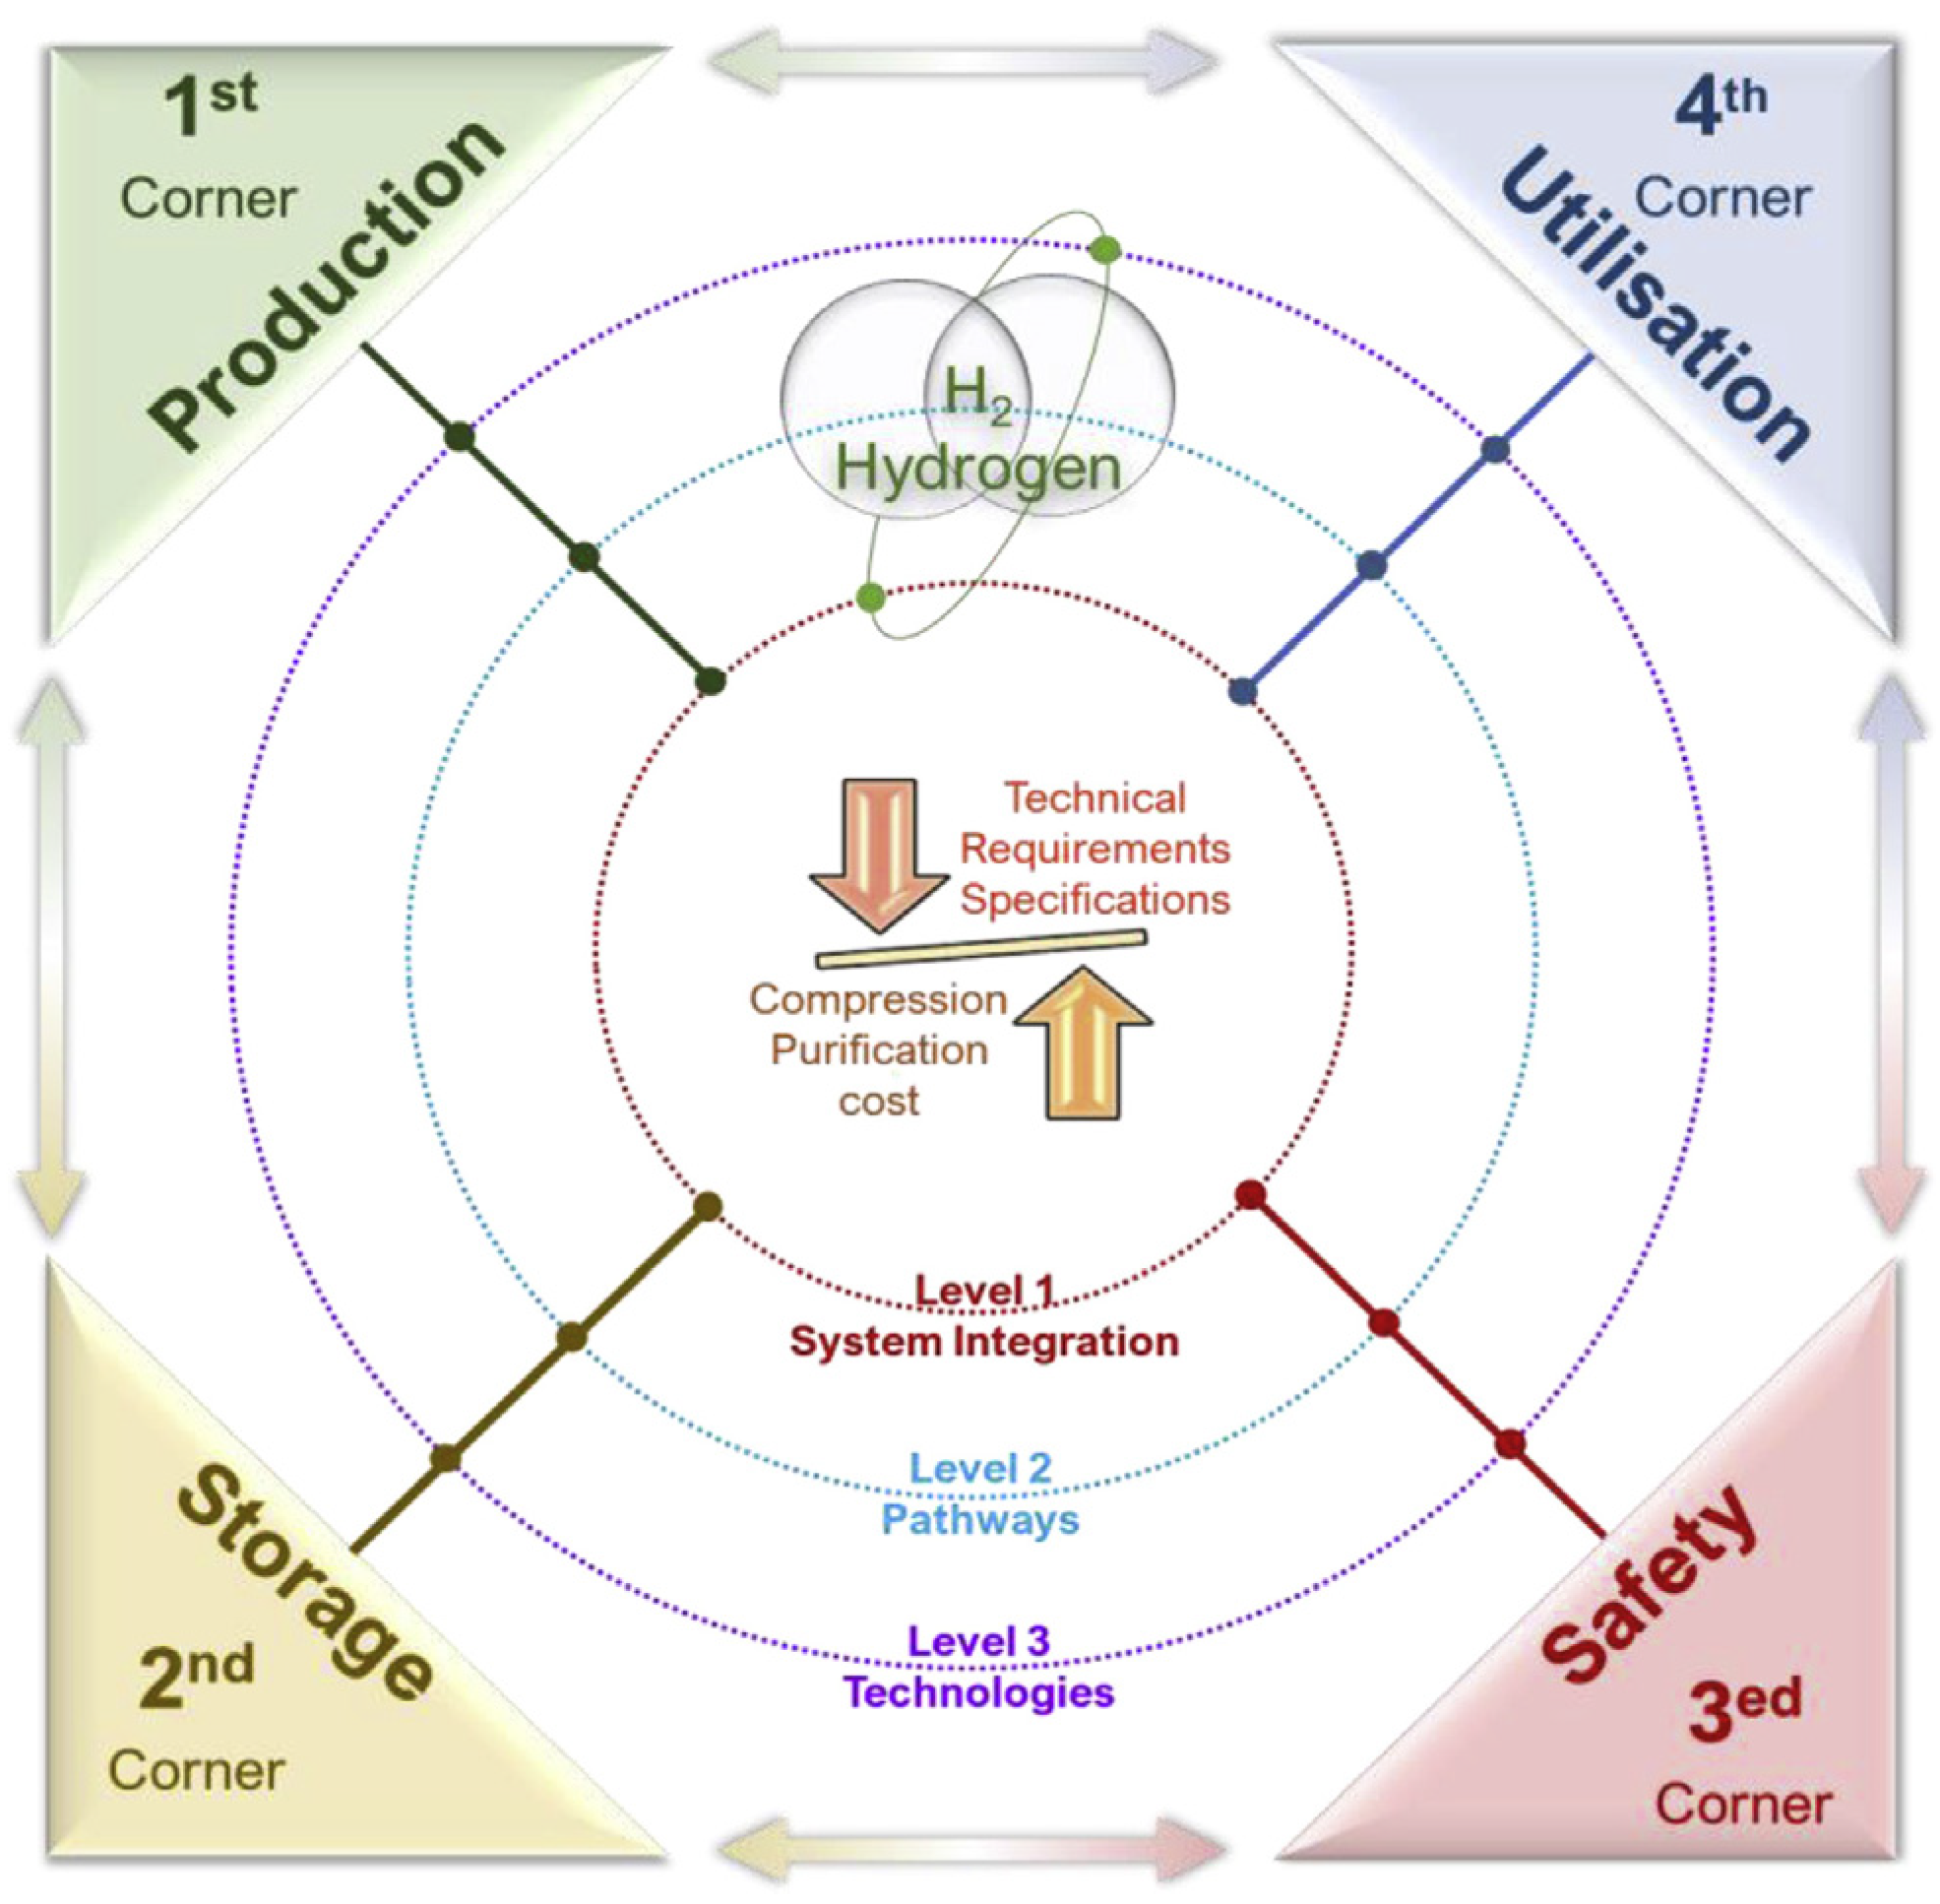
2. H2 as an Energy Vector
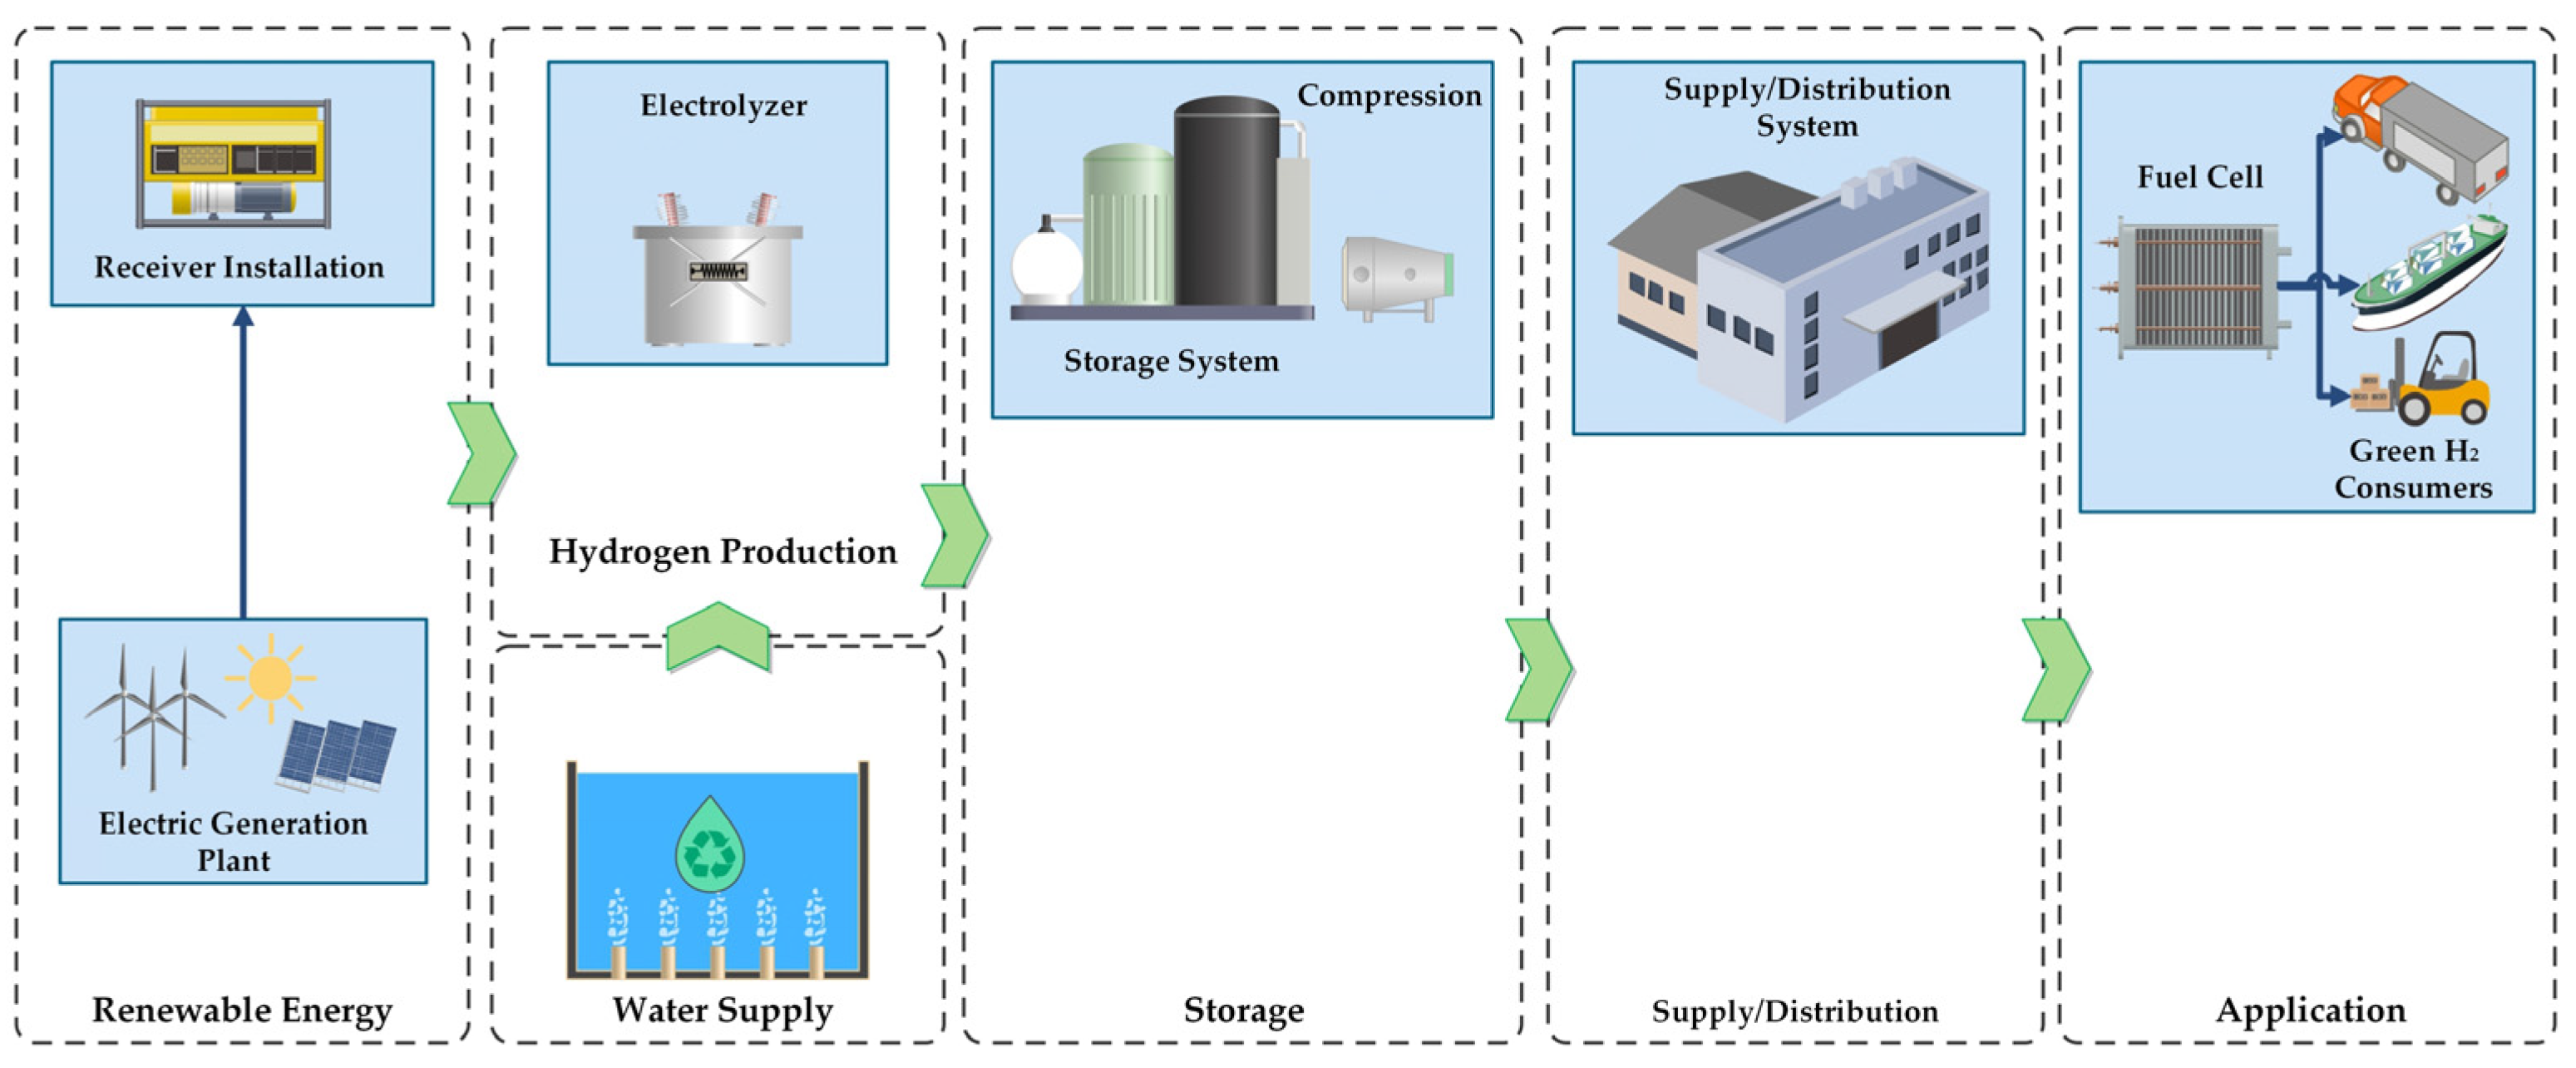
The potential of H2 as a fuel with the highest energy density per unit mass makes it great for application in all sectors that require energy [25]. H2 is produced from a wide range of resources using different raw materials, pathways, and technologies, including fossil fuels and renewable energy [61,62,63,64,65]. The classical method consists of breaking or reforming fossil fuels as a profitable H2 production pathway for industrial use, which was estimated (globally) at 85 million tons in 2016 (more than 600 billion Nm3/year) [66]. Therefore, the energy value of H2 and the clean energy index were not the main factors to consider in its use at an industrial level [67,68]. Industrial H2 was used for the production of fertilizers [69,70], petrochemical refining [71,72], metalworking [73], food processing [74,75,76], cooling of generators of power plant energy and semiconductor manufacturing [67].
Meanwhile, with increasing attention to reducing GHG emissions, renewable energy resources are rapidly beginning to gain potential as a clean source to produce green H2 as a carbon-free energy vector [69]. Green H2 creates the link between RES resources and the modernization of energy supply, transport, industry, and renewable energy export [71,77]. Moreover, a H2-based power system is no less resilient than a conventional fossil fuel-based system, as H2 can be used as a direct fuel (pure H2 or in a mixture of fuels) or converted into other liquid/gaseous fuels [78,79].
The literature review identified that the H2-based energy system mainly comprises four main stages, which are interconnected and interdependent [30,80,81]. These four stages are the production, storage, safety and use of H2, which is seen graphically in the recently presented study [25], which proposed a four-corner model, called H2 Square (HydS), as shown in Figure 2. The proposed innovative HydS model illustrates the interdependence of each stage on the other stages, and was considered in any selection of a pathway or value chain for green H2.
Considering the above, green H2 can play a fundamental role in port operations, not only because of its potential to reduce GHG emissions. Studies in Japan, the United States and Germany [48,82,83] have shown that the adoption of H2 eliminates the need to designate a significant interior space for battery charging and storage rooms, which allows efficient use of space, higher performance and higher productivity. Similarly, H2 fuel cells have been observed to supply constant voltage until the fuel tanks are depleted. It means that fuel cell-driven devices do not experience performance degradation during the shift under normal operating conditions, operate at full speed, and reduce wear on some parts and pieces.

3. Methodology

In this study, the case study was established in the Valparaíso Region to investigate and evaluate a complete green H2 value chain to generate the energy required in port station systems. As described below, the country’s central regions play a fundamental role in the economic sector to import and export goods by sea. A review of standards and regulations around H2 analyzed the scale of the development of this technology in port facilities. In this way, the critical aspects of introducing green H2 as an energy vector within the installation were identified. Another critical aspect of the study is analyzing and identifying the systems or equipment used in port station operations to determine an energy demand that H2 must supply.
Calculating the potential for electricity generation through a renewable energy plant is essential in the green H2 value chain through the calculation tools of the Ministry of Energy for RES sources [84]. In particular, the size of the solar photovoltaic (PV) plant and the required electricity generation are quantified. The plant was located strategically for H2 production. In this sense, the electrolyzer was defined according to the established operating conditions, as shown below. A Proton Exchange Membrane Electrolyzer (PEM) for H2 production (kgH2) was defined due to its operational flexibility and the costs of such technology at the country level [85].
At the same time, the alternatives for the H2 distribution storage system must be considered, which may include a compression system or the alternative of storage in metal hydrides. This last alternative makes it possible to eliminate a compression process. Furthermore, this technology operates only with adequate thermodynamic control of the ponds. Hence, enough H2 will be stored on-site to power the fuel cells for the required days. H2 storage units require high pressure to achieve a short refueling time, and high-pressure refueling requires an on-site compression system.
Notwithstanding the preceding, it is clear that the analysis to be carried out does not consider the storage characteristics at the point of consumption. Because it is necessary to be sure of the operation of each piece of equipment to optimize the amount of H2 to be stored at optimal pressures, for these purposes (300 to 700 bar).
Finally, the proposal for the final use of H2 was made in equipment such as forklifts, cranes, small vehicles, and others, powered by fuel cells and comparing this same electricity supply using a diesel generator. In addition, the complete value chain for green H2 was established, sizing each of the elements that compose it and some costs and the LCOE for implementation are referenced. The latter is relevant for the company because many of the technologies, which have been studied for years, have higher investment costs than conventional ones. In this way, a complete value chain can be established for green H2 in industrial applications in the country. Figure 3 shows the referential scheme of a value chain for the green H2.

4. Results and Discussion: Case Study
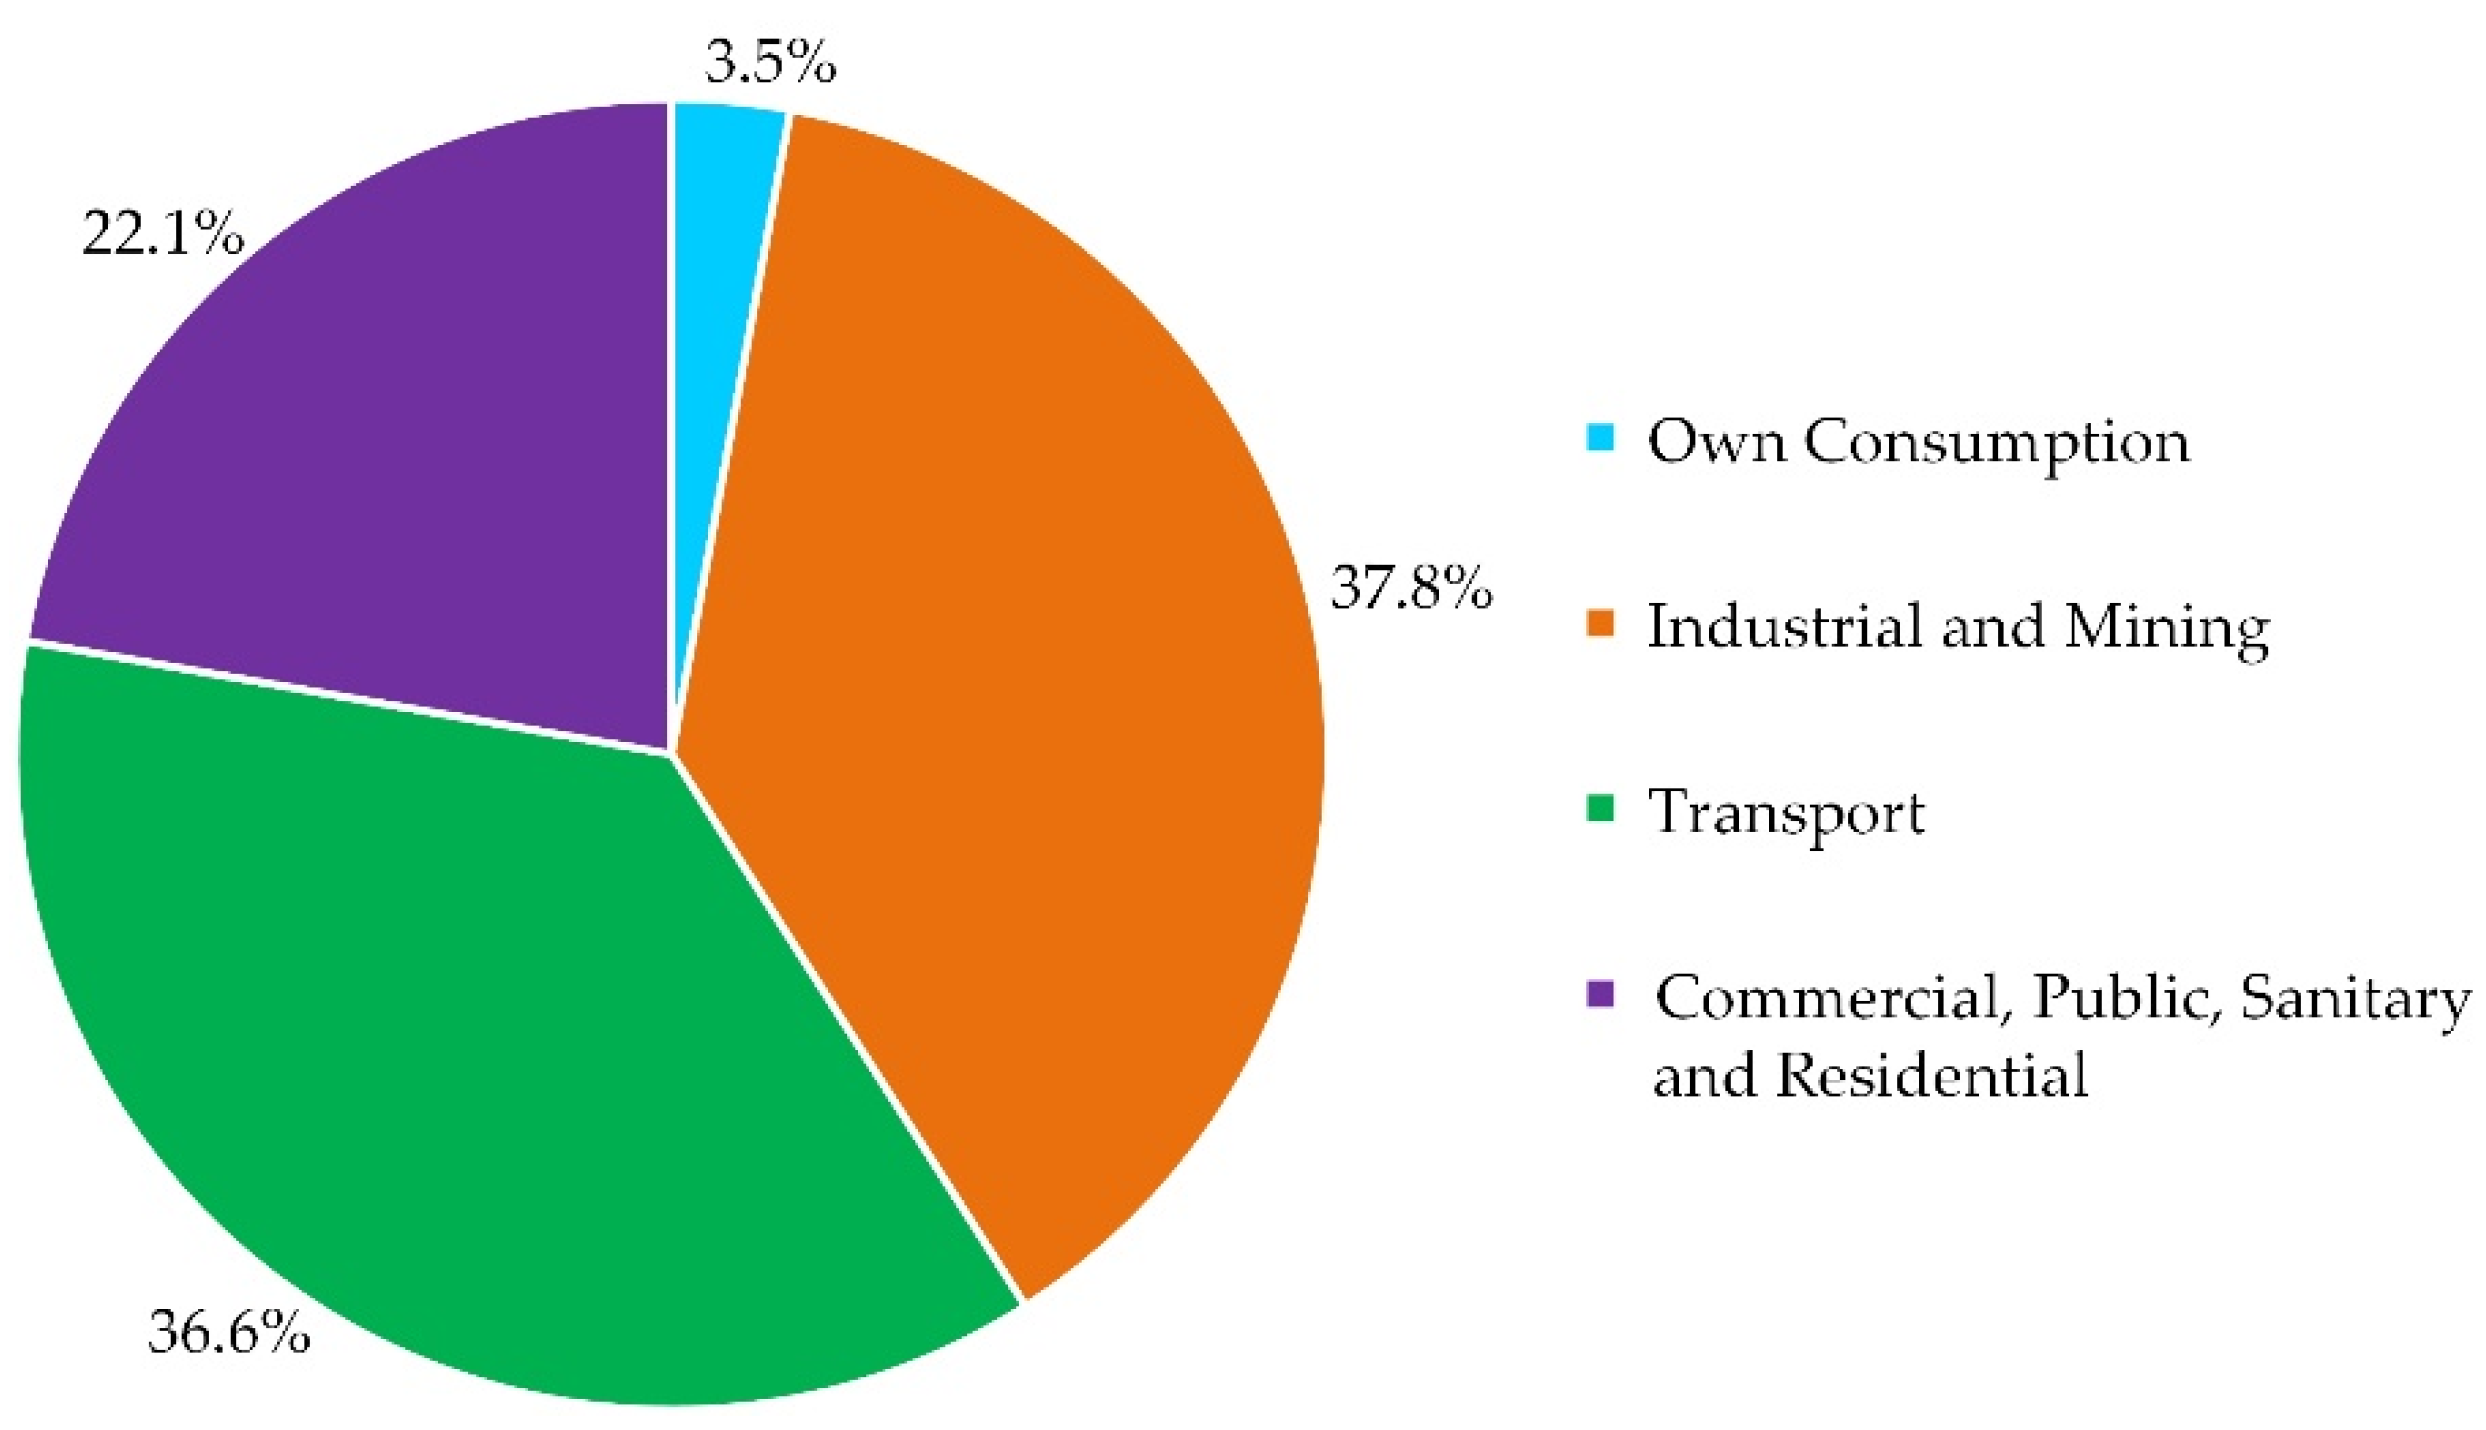
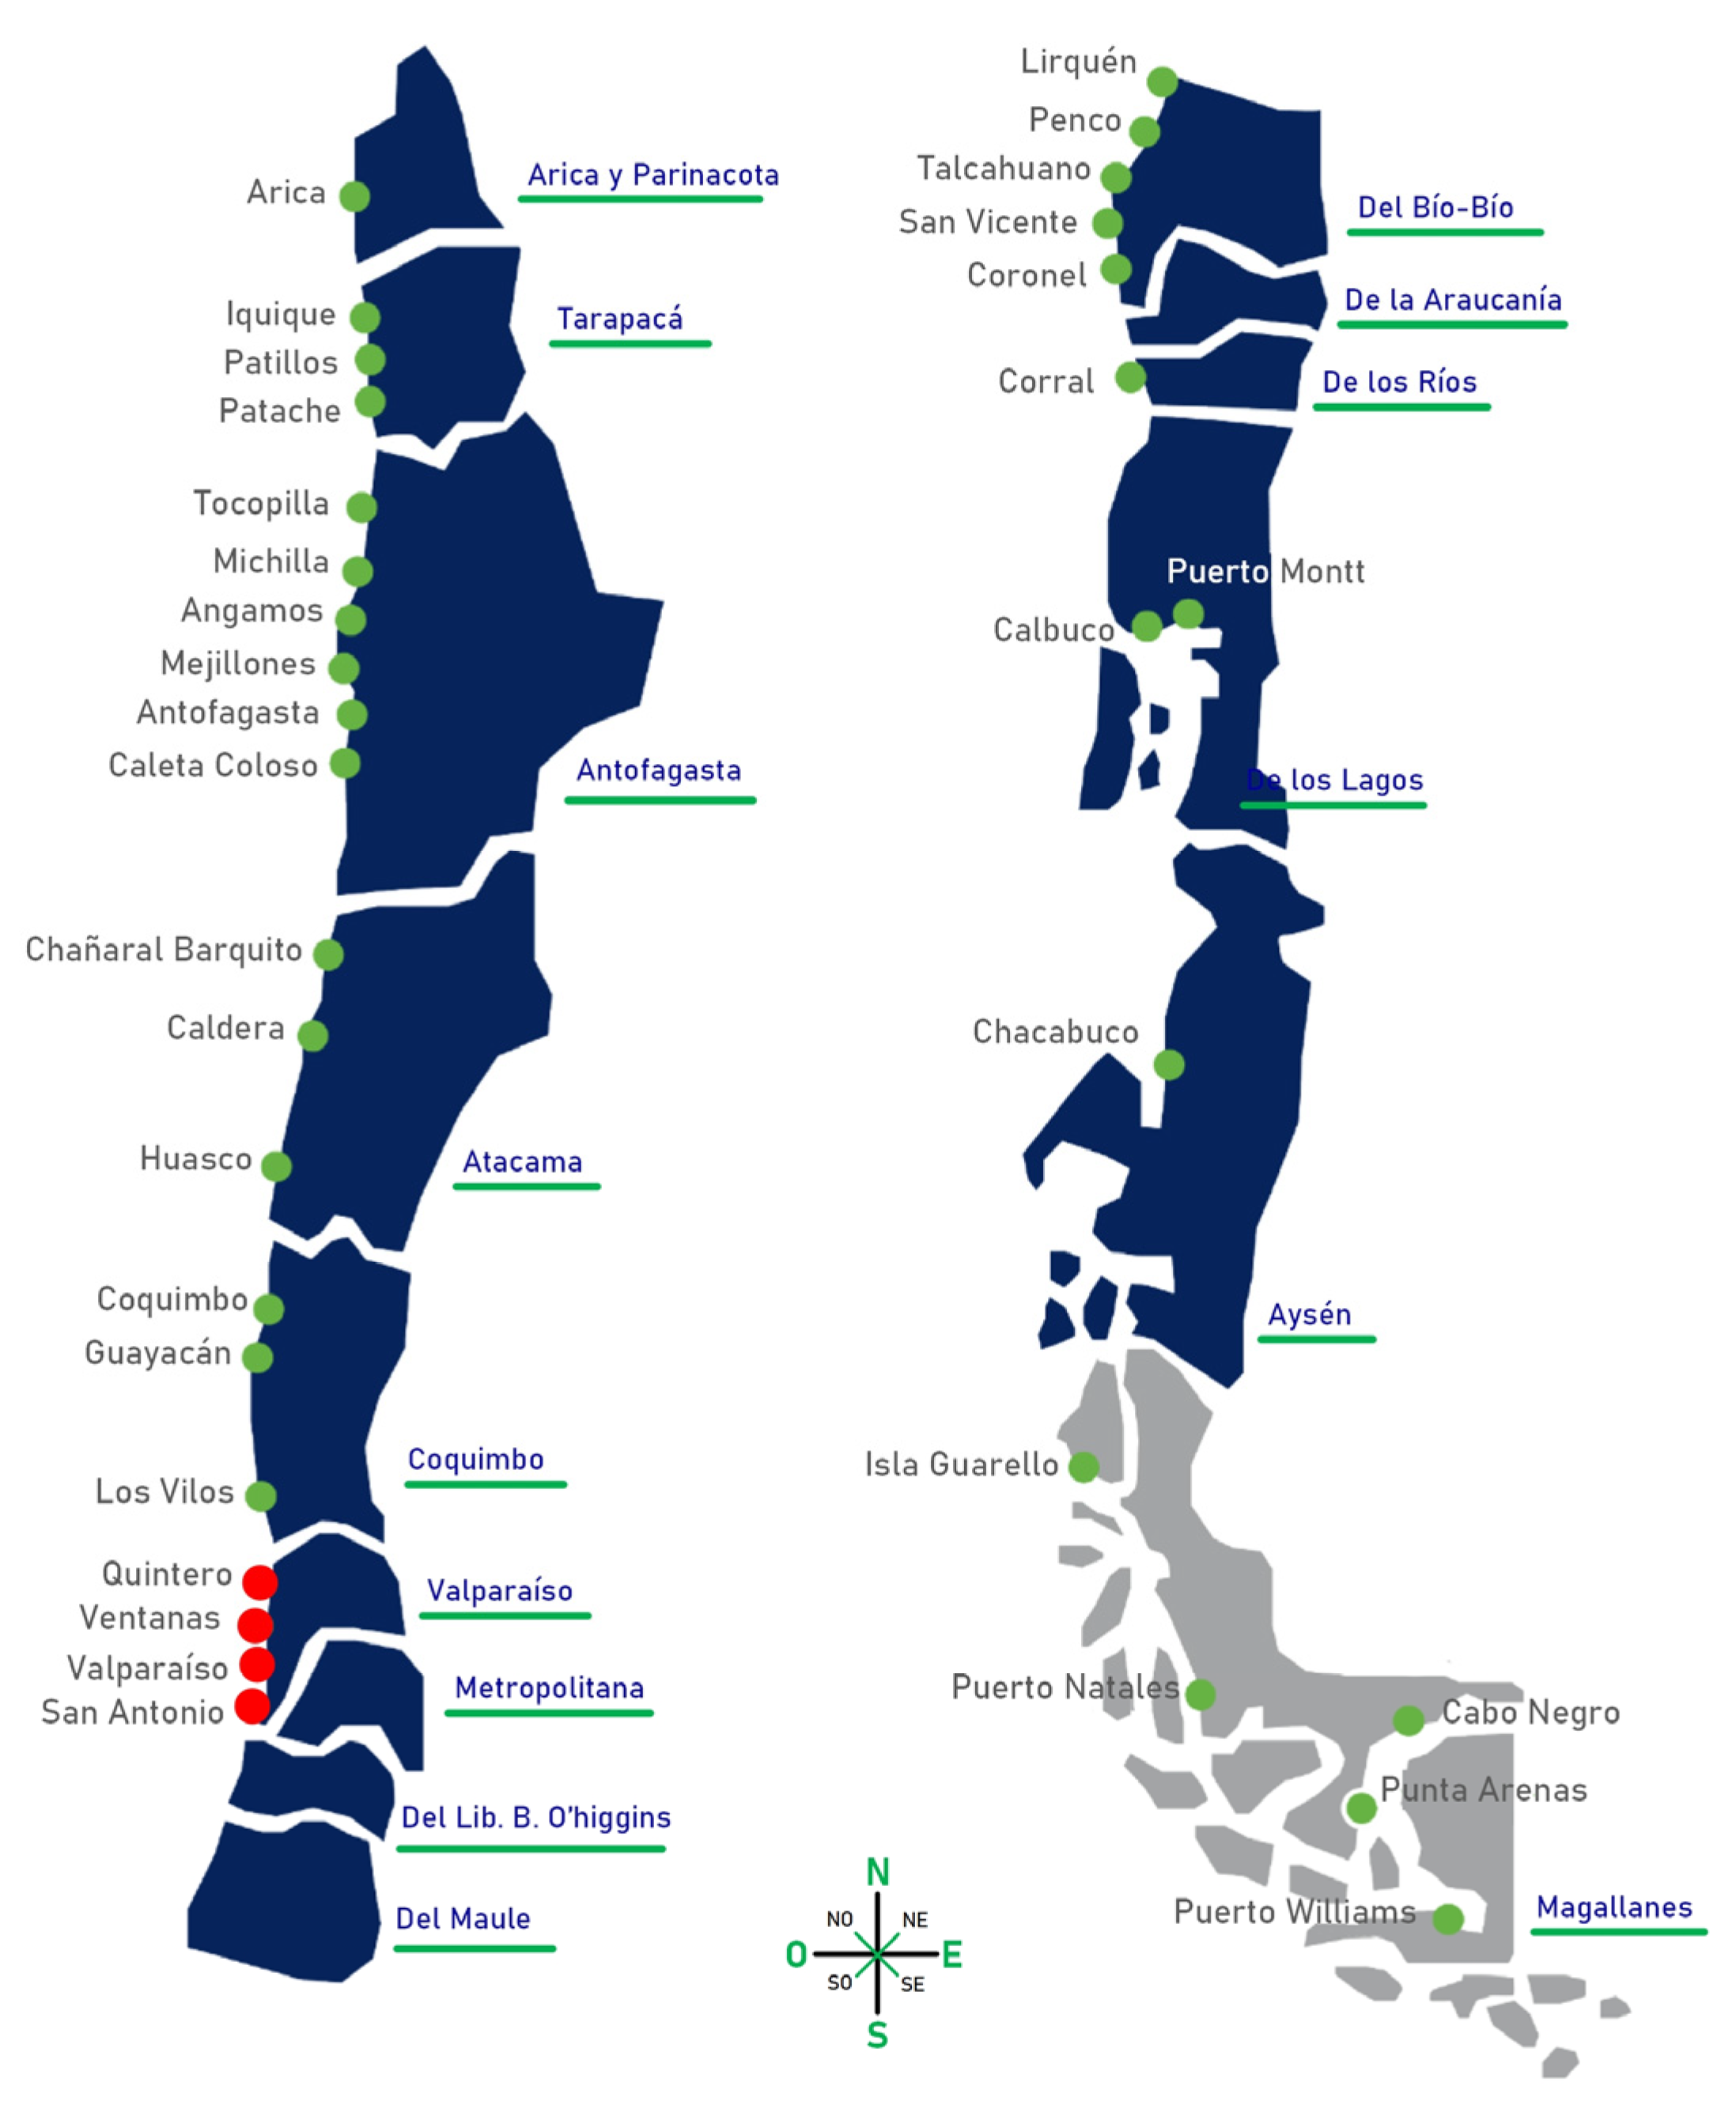
4.1. Study Port

This study considers the strategic role that ports play within the economies of the countries [53]. In addition, the development of exports and the final consumption of green H2 in Chile, as shown in the reviewed literature [49,57,86,87]. Therefore, it is attractive to turn these facilities into final consumers of green H2.
Recently, data of the National Port System of Chile [88] have indicated that 77 port terminals exist: 13 state terminals for public use (grouped into ten state-owned port companies), 17 private ones for public use and 47 private ones for private use. In addition, multiple minor terminals are necessarily added for connectivity and fishing activities. Within these facilities, conventional energy-consuming equipment has been identified that can be replaced by energy from H2. Specifically for port activities or those under port control, such as cargo handling equipment and power generation for own consumption. Among the critical energy consumers for green H2 [89,90], the most common in a port are defined in Table 1 along with, in each of these end consumers, the attractive characteristics for the use of green H2.
One of the options for this study lies in the ports of the Central Zone of Chile, specifically in the Valparaíso Region, as two of the leading cargo ports in Chile are located in this region. The data from these facilities show that their participation in trade for exports and imports differentiated by the type of cargo represents 29.7% of the national total, 48.3% general cargo and containers, 32.3% liquid bulk, 14.8% solid bulk and 77.8% in reefers, see References [91,92]. Figure 4 shows the main ports of the country and the main port facilities located in the Valparaíso Region are highlighted in red.
As can be seen in the previous figure, Chile has a strategic and fundamental port infrastructure for economic growth, which includes considerable consumption from an energy point of view [7,93]. Furthermore, as the work of ports is a fundamental activity, the analysis that this article proposes and develops is scalable in many cases. Although it is known that not all ports have the same purpose and the same energy consumers, the proposal results in proposing a value chain for the end-use of green H2 in similar facilities, and that is replicable in others despite these differences.

4.2. Load/Demand Assessment and Resources

The study proposed in this work results from developing a pre-feasibility project to implement green H2 in Chile. In this case, due to a Non-Disclosure Agreement (NDA) signed between the parties that collaborate in said project, it is not possible to specifically mention the installation worked. Hence, this installation is referred to in a generic way as “Case of Study”. Therefore, the load demanded by the total end consumers of the green H2 within the Case of Study was established generically, which can be extended if necessary. The proposal is to determine the dimension of the systems that make up the value chain (electric power supply, electrolyzer, fuel cell) for a green H2 installation necessary to provide a stable amount of electric energy of 1 MWhe (megawatt hour electric) at all times to the Case of Study.

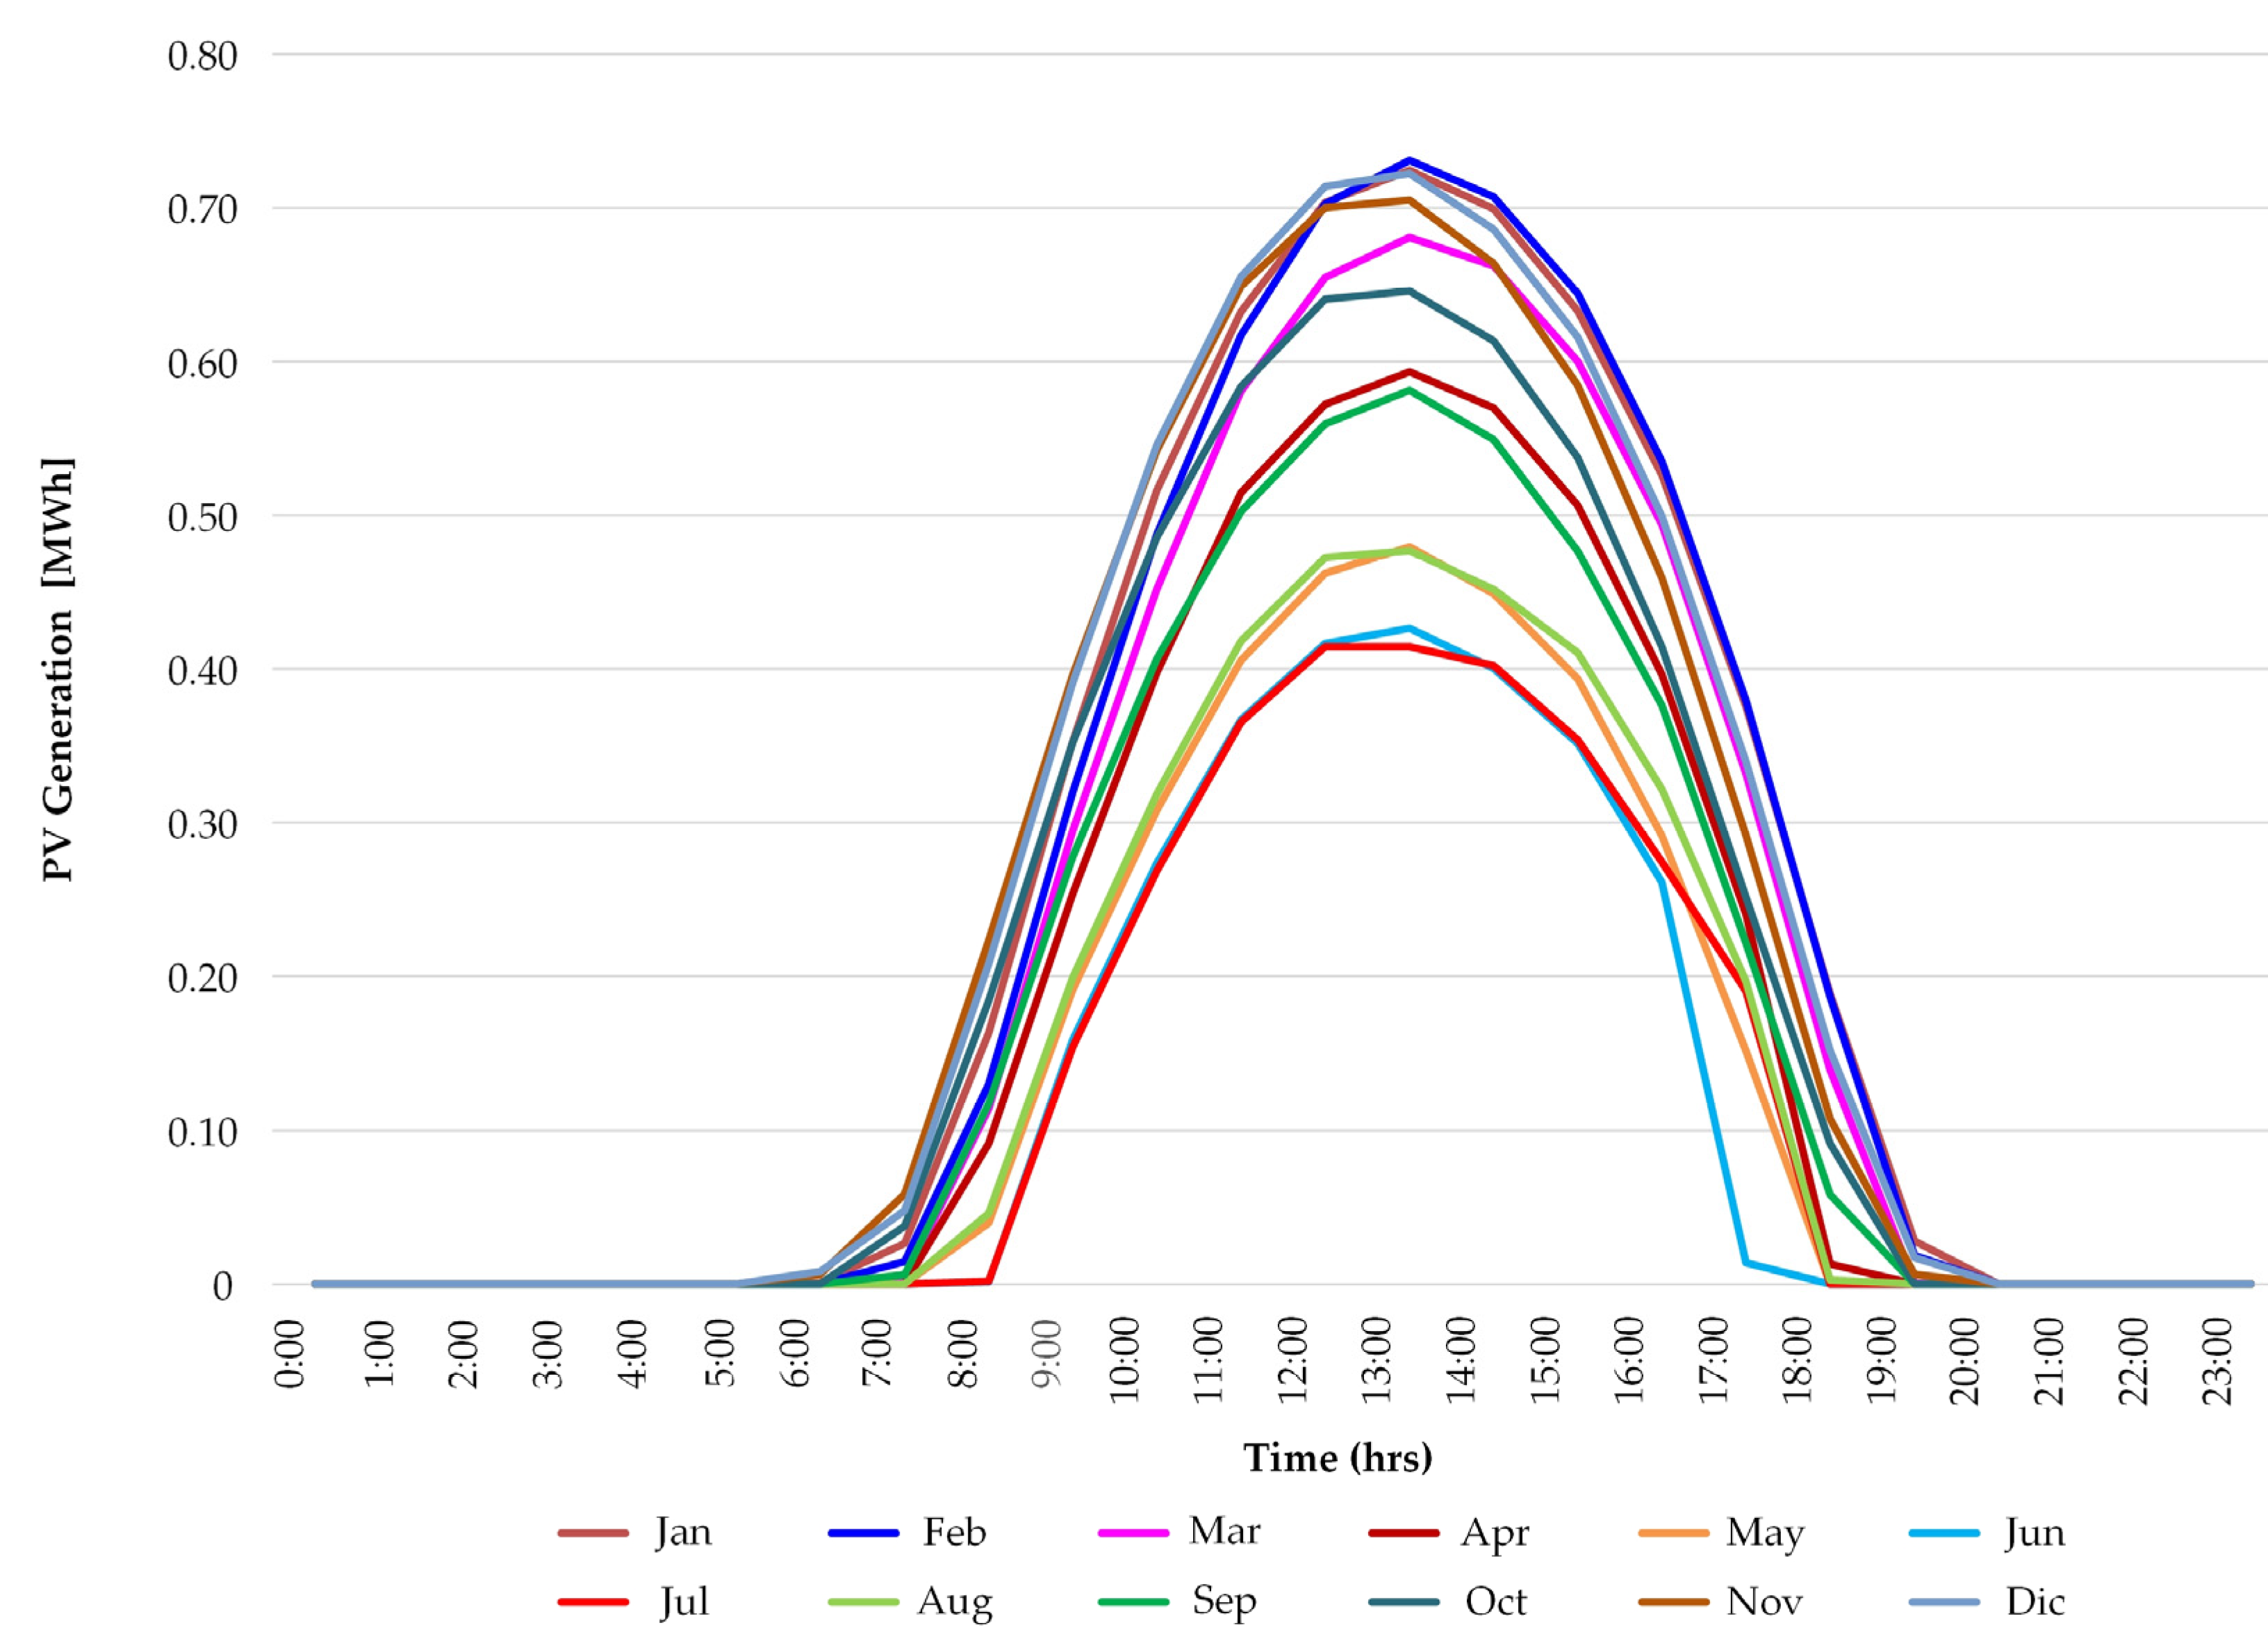
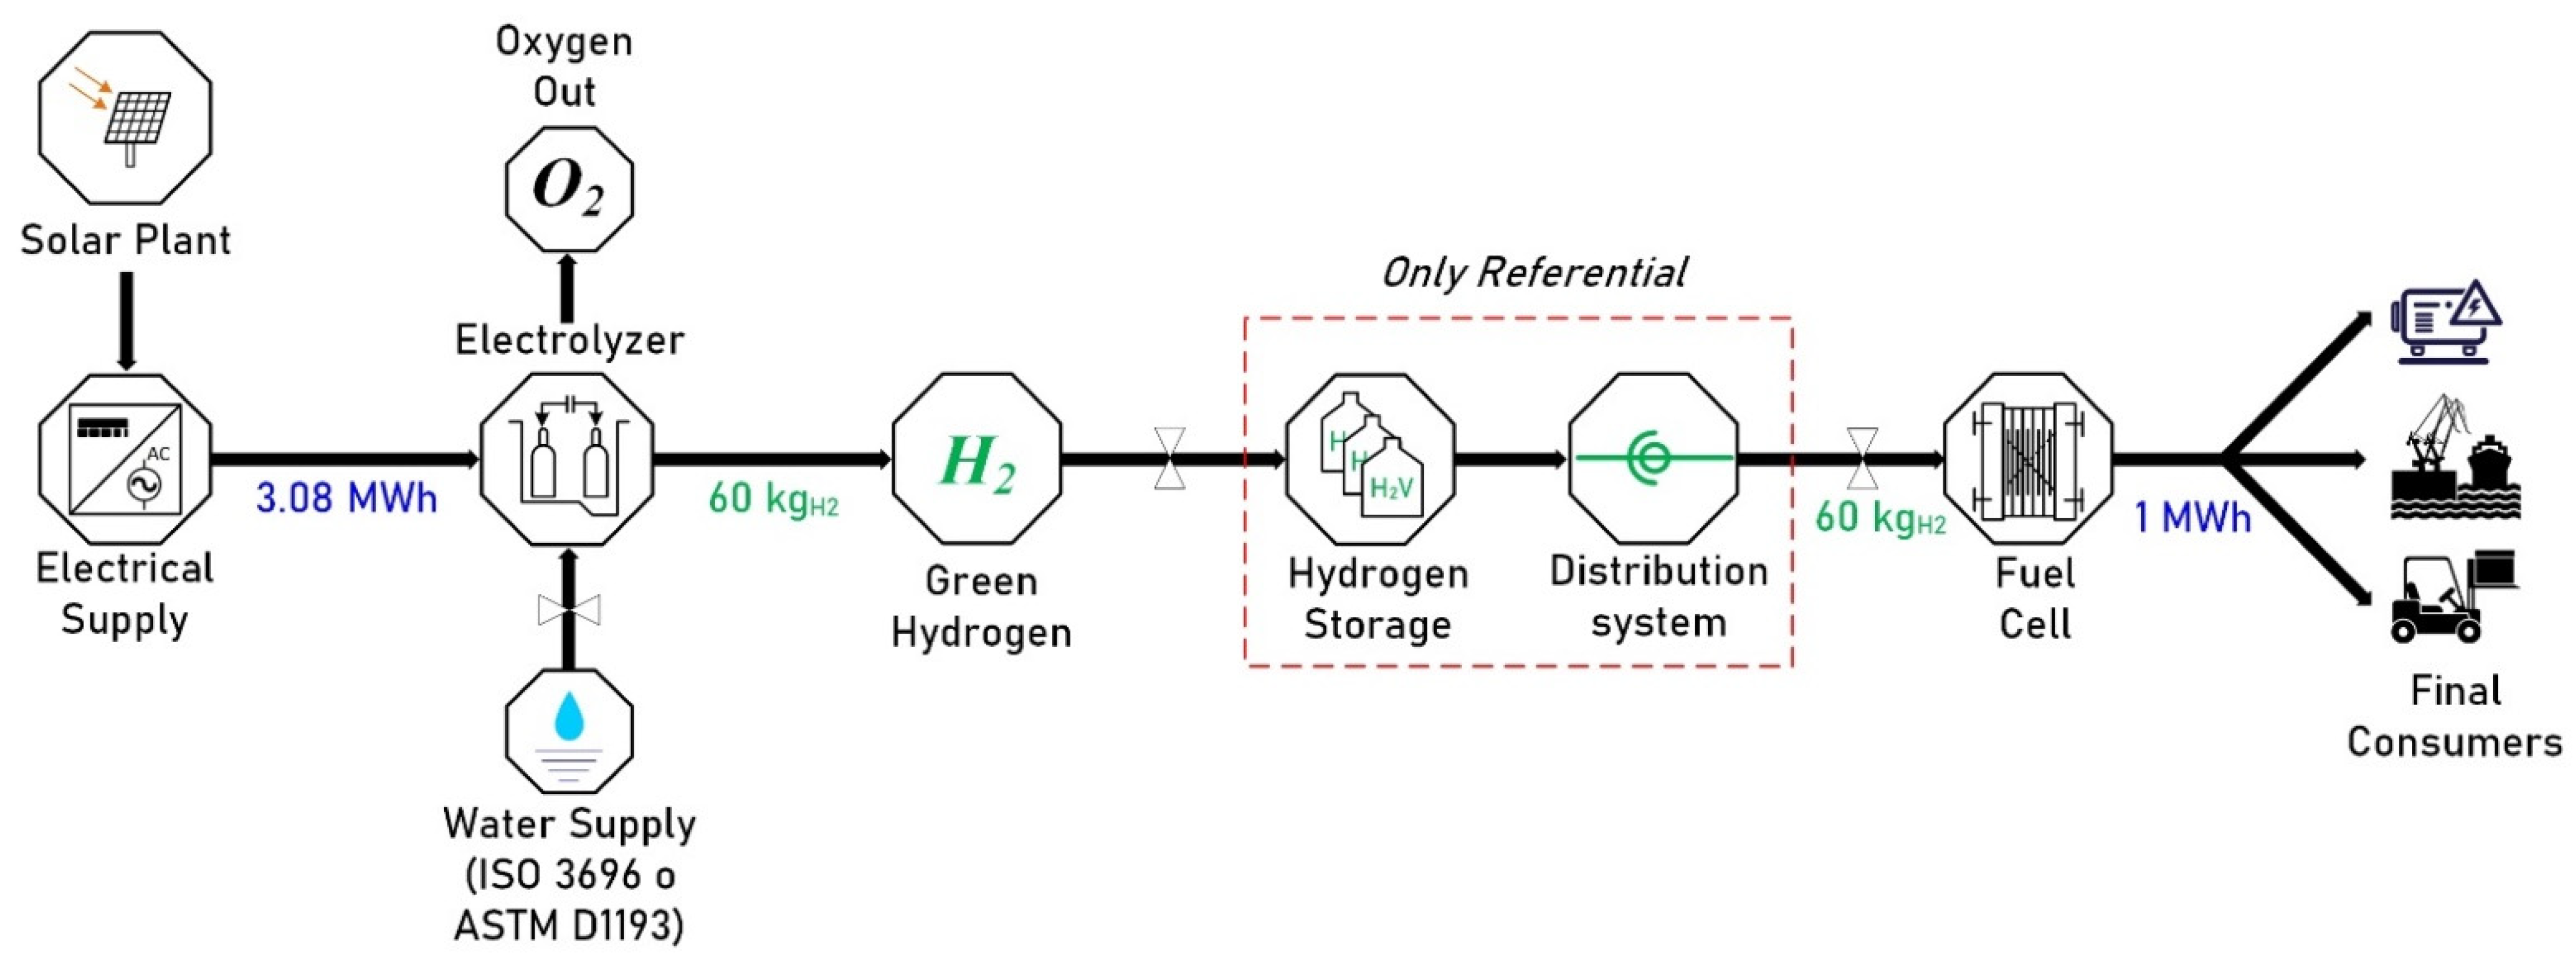
4.2.1. Sizing of H2 Line and Photovoltaic Plant

The photovoltaic generation was calculated using the model proposed by the Solar Explorer of the Ministry of Energy of Chile [94] in a central zone of the Valparaíso Region, supplying the next peak PV generation configured for 1 MWp (megawatt peak). The results consider an inverter power in Direct Current (DC) and a totalized power in photovoltaic panels of 1 MW, with the configuration shown in Table 2.
According to the photovoltaic generation model results, Figure 5 shows said average energy generated throughout the day in the other months of the year. The graph shows the points of maximum and minimum generation. Moreover, the monthly electricity generation in Alternating Current (AC) is shown in Table 3.
Through these values, a total of 1584.69 MWh of electric power generation per year was quantified. Based on 1 MWp, the annualized base indicator was IBA.PV = 1584.69 MWh/MWp. Both this last annualized generation indicator and the months of highest (IBMax.PV) and lowest (IBMin.PV) generation allow the estimation of different configurations of photovoltaic plants addressing the problem of producing 1 MWhe:
  • IBA.PV = 1584.69 MWh/MWp;
  • IBMax.PV = 5.60 MWh/MWp (month December);
  • IBMin.PV = 2.67 MWh/MWp (month June).
This type of indicator (IB: MWh/MWp) is valid to determine different sizes of photovoltaic plants in different scenarios. From this, various solutions have been determined to achieve 1 MWhe from a Fuel Cell (FC) and compare it with the same amount of energy produced from a Diesel Generator (DG). Therefore, it is necessary to set typical operating parameters for these technologies, as shown in Table 4.
Considering that the objective is to generate 1 MWhe from the FC, and using Equation (1), the efficiency of the system is obtained [95]:
η F C = E o u t , F C E i n ,   F C = E o u t , F C   [ kWh ] L H V H 2 [ kWh kg H 2 ] × m H 2 [ kg H 2 ] ,
where Eout,FC is the electrical energy at the outlet of the FC. Therefore, solving the previous equation for the mass of H2 (mH2), it is obtained that the FC input to generate 1 MWhe is:
m H 2 = E o u t , F C η F C × L H V H 2 = 1000   [ kWh ] 0.5 × 33.33   [ kWh kg H 2 ] = 60.01   [ kg H 2 ] ,
Then, to determine the electrical energy requirement in an electrolyzer (ELZ) obtaining the requirement in kgH2, the following Equation (2) is used [97]:
η E L Z = E o u t , E L Z E i n , E L Z = L H V H 2 [ kWh kg H 2 ] × m H 2 [ kg H 2 ] E i n [ kWh ] ,
where Ein,ELZ corresponds to the electrical energy that was supplied to the electrolyzer. This energy was determined for the efficiencies already indicated, which represents the electrical energy required for the electrolyzer to dissociate the water molecule and produce 60.01 kgH2:
E i n , E L Z = m H 2   [ kg H 2 ] × L H V H 2 [ kWh kg H 2 ]   η E L Z = 60   [ kg H 2 ] × 33.33 [ kWh kg H 2 ]     0.65 = 3.08   [ MWh e ] ,
It is essential to highlight that the technology of PEM Electrolyzers is adequately coupled to a photovoltaic system, as has been demonstrated in the literature [97,98]. Since these respond quickly to the variations in power that the equipment receives, based on these results, different scenarios were determined in which the photovoltaic plant produces the minimum energy necessary to generate 3.08 MWhe in one day of operation through which 60.01 kgH2 are obtained and these, when supplied to an FC, finally produce 1 MWhe (in DC).
Therefore, to obtain the effect of generation through the photovoltaic solar plant, the configured scenarios are given by:
  • Scenario 1: Month with the minimum indicator of power generation from the photovoltaic system: IBMin.PV;
  • Scenario 2: Month with the maximum power generation indicator from the photovoltaic system: IBMax.PV;
  • Scenario 3: For annual average power generation: IBA.PV.
Additionally, a cost indicator in United States dollars (USD) of 0.75 USD$/Wp was considered, which allows the estimation of the cost of the photovoltaic system (Turnkey Project) from [99]. Finally, based on the electric power generation, the PV plant referential cost [USD$] was determined for each described scenario in Table 5.
Finding 1:
Based on these results, it was determined that to achieve parity of the price of energy (MWh) produced by a DG and FC, assuming that the costs of the equipment are “Sunk Costs”, the cost of 1 kgH2 can reach 4.09 times higher than the cost of 1 L of diesel. It was demonstrated as follows:
  • 1 l diesel = 1 USD$;
  • 1 kgH2 = 4.09 USD$.
Therefore, electricity generation from diesel equipment:
  • 1 l diesel = 0.846 kgD;
  • HHVD = 12.67 kWh/kgD;
  • η D G = E o u t ,   D G E i n , D G 0.38 = E o u t , D G E i n , D G 0.38 = 1000   [ kWh ] E i n , D G   E i n , D G = 2630   [ kWh DG ] ;
  • m D [ kg D ] = E i n , D G   H H V D   = 2630   [ kWh ] 12.67 [ kWh kg D ] = 207.58   [ kg D ] .
Therefore, starting from this, the number of liters of diesel consumed (X) is determined as:
  • 0.846   [ kg l ] = 207.58   k g D   X   [ l D ] X   [ l D ] = 245.36   [ l D ] .
At a value of 1 USD$ per liter of diesel, it was obtained that the cost of generating (c/diesel) a 1 MWhD is USD$245.
Now calculating through electricity generation from FC:
  • LHVH2 = 33.33 kWh/kgH2;
  • η F C = E o u t , F C E i n , F C 0.5 = 1000   [ kWh ] E i n , F C   E i n , F C = 2000   [ kWh ];
  • m H 2 [ kg H 2 ] = E i n , F C   L H V H 2 = 2000   [ kWh ] 33.33 [ kWh kg H 2 ] = 60.01   [ kg H 2 ] ;
At a value of USD 4.09 per kgH2, the cost of generating 1 MWhe of energy using FC is determined to be USD$245. This result represents that the cost of 1 kgH2 could be up 4.09 times higher than the cost of 1 L of diesel so that the output MWh of each system is economically similar.
Finally, with the different photovoltaic plant configurations and the calculated data, the respective green H2 production can be estimated, obtaining the results shown in Table 6.

4.2.2. Cost Estimation and Comparison Assuming Green H2 Production

In estimating costs for the three scenarios studied, where H2 is competitive against the in-situ production of H2 or where the purchase of energy is made through a PPA to feed an electrolyzer, it is necessary to make assumptions of operation and costs of the system according to the studies of [23,31,49,100]. Hence, the data obtained are:
  • Hours of Operation per day Electrolyzer (ELZ): 8 h;
  • Hours of Operation per day Fuel Cell (FC): 8 h;
  • ELZ: 1.6 USD$/W;
  • FC: 1.6 USD$/W.
Therefore, for the above requirements of H2 and electrical energy from the FC, the following installed powers are required:
  • Power FC: 0.125 MW;
  • Power ELZ: 0.38 MW.
Starting from the unit costs of FC, ELZ and the respective powers, the investment of these two major teams in:
  • FC of 0.125 MW: USD$200,000;
  • ELZ of 0.38 MW: USD$615,385;
  • Lifetime FC: 100,000 h;
  • Lifetime ELZ: 100,000 h.
Regarding these parameters, necessary H2 production was ensured to finally have 1 MWhe from the outlet of the FC in 8 h of operation. Therefore, the following question was answered:
What maximum value can energy be purchased in a PPA to have an equivalent economic value of energy (USD$/MWh) produced from a diesel generator?
According to the previous results, a maximum energy purchase value was estimated, which can be indexed to the price of a liter of diesel, solving the following Equation (3):
P P A   V a l u e   [ USD $ MWh ] = 4.09   [ l D kg H 2   ] × D i e s e l   C o s t   [ USD $ l D ] × m H 2     [ kg H 2 ] E i n , E L Z   [ MWh ] ,
substituting values is obtain that,
P P A   V a l u e   [ USD $ MWh ] = 4.09   [ l D kg H 2   ] × D i e s e l   C o s t   [ USD $ l D ] × 60.01     [ kg H 2 ] 3.08   [ MWh ] ,
P P A   V a l u e   [ USD $ MWh ] = 79.79   [ l D MWh ] × D i e s e l   C o s t   [ USD $ l D ] ,
Finding 2:
The value of energy in a PPA can be a maximum of 79.79 times the value of the liter of diesel, with the ultimate goal is that the value (USD$/MWh) generated by a FC is equivalent to the DG.

4.2.3. LCOE Estimation (Simplified)

Finally, the parameters already delivered and the production and prorate deduction, an LCOE was estimated. However, it should be pointed out that the storage and compression have not been considered according to the calculations. Therefore, according to the data shown in Table 7, the simplified LCOE calculation was performed.
Hence, LCOE1: of MWhe from the FC. Without PV plant was caudated from Equation (4),
L C O E 1 = P r o r a t e   F C [ USD $ MWh ] + ( P r o r a t e   E L Z   [ USD $ kWh eq , H 2 ] · 1000 ) + P P A   [ USD $ MWh ] ,
then,
L C O E 1 = 40.62 ( USD $ MWh ) + P P A   ( USD $ MWh ) ,
LCOE2: by MWhe from FC. With PV plant, for the month of minimum generation Scenario 1 (largest PV plant) the Equation (5) was calculated:
L C O E 2 = 40.62   [ USD $ MWh ] + P r o r a t e   P V   ( J u n e ) ,
L C O E 2 = 40.62   [ USD $ MWh ] + 18.93   [ USD $ MWh ] = 59.55 [ USD $ MWh ] ,
Finding 3:
Therefore, from the LCOE results, it is concluded that a PPA is higher than the pro rata of the photovoltaic plant, that is, more significant than 18.93 (USD$/MWh), would imply that it is more profitable to incorporate the photovoltaic project than to buy energy from a third.
Finally, based on the results, Figure 6 shows a referential scheme of the complete value chain that was used in the Study Case of a port facility for a final supply of 1 MWh of electric energy. However, it should be mentioned that the calculated costs do not consider the prorate and operation of storage and compression. Therefore, the position of these systems in the figure is representative. Furthermore, it should be noted that the same proposed procedure must be followed in the case of higher consumptions. However, the technology costs vary due to the economy of scale and the negotiations between consumer companies and companies supplying the technologies green H2 at the time of purchase.

5. Conclusions

This study presents a complete value chain for green H2 in port facilities based on a case study for the Valparaíso Region in Chile. The green H2 value chain includes electricity generation using photovoltaic solar energy and inverters, electrolyzers for H2 production, on-site storage and fuel cells. This study determined potential green H2 consumers in a port facility, including RTG crane, forklift, manlift, container handler, container reach stackers, yard tractors and straddle carriers. Most of these teams have a diesel fuel consumption, making the analysis more attractive to implement the green H2. The analysis determined that, for demand of 1 MWe, the system must supply approximately 60 kgH2 to the fuel cell with a 50% yield. This requirement was covered by a 65% efficient electrolyzer whose energy consumption is 3.08 MWhe, which was supplied by a photovoltaic solar plant. This photovoltaic plant was sized for three scenarios, the first for the month with the minimum power generation indicator from the photovoltaic system (June) of 2.67 MWh/MWp, the second for the month with the maximum generation indicator of energy from the photovoltaic system (December) of 5.60 MWh/MWp and the last one for the annual average energy generation of 1584.69 MWh/MWp. This analysis shows that the proposed power system provides all the electrical power required for the port facility and offers good penetration of renewable resources for port applications.
Solutions to achieve 1 MWe from a fuel cell were determined and compared with the same energy produced from a diesel generator. Hence, to achieve parity of the energy price produced by the diesel generator and the fuel cell, it was obtained that the cost of 1 kgH2 could be up to 4.09 times higher than the cost of 1 L of diesel to generate the same MWhe in each system. Furthermore, in the present study, it was determined that the energy value in a Power Purchase Agreement could be a maximum of 79.79 times the value of a liter of diesel.
Finally, we analyzed the Levelized Cost of Energy for two different conditions than in the generation of green H2, when having the photovoltaic plant and without the photovoltaic plant. We determined that with a Power Purchase Agreement greater than the pro rata of the photovoltaic plant, and more significant than 18.93 (USD$/MWh), implies that it is more profitable to incorporate the photovoltaic project than to buy energy from a third party. Hence, a large amount of electrical energy can be produced using photovoltaic solar energy to serve the port cargo and generate enough H2 to power fuel cells. It is relevant for the National Hydrogen Strategy in Chile, which is attractive for the end-users of this renewable fuel. This study shows that in the short term, part of the green H2 produced in-situ using photovoltaic solar energy is implemented in port applications through a complete value chain, reducing CO2eq emissions in such processes and improving productivity and sustainability indicators.

Author Contributions

Conceptualization, Y.M.M. and P.R.M.; methodology, Y.M.M., P.R.M. and A.A.R.S.; software, P.R.M. and R.C.C.; validation, Y.M.M., P.R.M. and A.A.R.S.; formal analysis, Y.M.M. and R.C.C.; investigation, P.R.M., A.A.R.S. and R.C.C.; writing—original draft preparation, Y.M.M. and P.R.M.; writing—review and editing, P.R.M., A.A.R.S. and R.C.C.; supervision, Y.M.M.; project administration, Y.M.M. All authors have read and agreed to the published version of the manuscript.

Funding

This research was funded by Agencia Nacional de Investigación y Desarrollo: Proyecto ACT210050 SCIA-ANID. The APC was funded by Project DI Consolidado PUCV 2021, COD. Project: 039.384/2021.

Institutional Review Board Statement

Not applicable.

Informed Consent Statement

Not applicable.

Data Availability Statement

Not applicable.

Acknowledgments

The researchers gratefully acknowledge the ANID PIA ACT210050 fund for financial support of this study and the Project DI Consolidado PUCV 2021, COD. Project: 039.384/2021. In addition, the School of Mechanical Engineering at the Pontificia Universidad Católica de Valparaíso (PUCV) and the Universidad de Santiago de Chile (USACH) for their support during the execution of this research.

Conflicts of Interest

The authors declare no conflict of interest.

References

  1. Markard, J. The next phase of the energy transition and its implications for research and policy. Nat. Energy 2018, 3, 628–633. [Google Scholar] [CrossRef]
  2. Kuzemko, C.; Bradshaw, M.; Bridge, G.; Goldthau, A.; Jewell, J.; Overland, I.; Scholten, D.; Van de Graaf, T.; Westphal, K. COVID-19 and the politics of sustainable energy transitions. Energy Res. Soc. Sci. 2020, 68, 101685. [Google Scholar] [CrossRef]
  3. Ram, M.; Aghahosseini, A.; Breyer, C. Job creation during the global energy transition towards 100% renewable power system by 2050. Technol. Forecast. Soc. Chang. 2019, 151, 119682. [Google Scholar] [CrossRef]
  4. REmap—Renewable Energy Roadmaps. Available online: https://www.irena.org/remap (accessed on 26 January 2021).
  5. Generación Eléctrica en Chile. Available online: http://generadoras.cl/generacion-electrica-en-chile (accessed on 25 January 2021).
  6. Comisión Nacional de Energía. Generación de Energía Eléctrica—Energía Abierta. Available online: http://energiaabierta.cl/visualizaciones/generacion-de-energia-electrica/ (accessed on 25 January 2021).
  7. Comisión Nacional de Energía. Balance Nacional de Energía—Energía Abierta. Available online: http://energiaabierta.cl/visualizaciones/balance-de-energia/ (accessed on 25 January 2021).
  8. Ministerio de Energía. Estrategia Nacional de Hidrógeno Verde. Available online: https://energia.gob.cl/h2/Estrategia-nacional-de-hidrogeno-verde (accessed on 25 January 2021).
  9. Gielen, D.; Boshell, F.; Saygin, D.; Bazilian, M.D.; Wagner, N.; Gorini, R. The role of renewable energy in the global energy transformation. Energy Strategy Rev. 2019, 24, 38–50. [Google Scholar] [CrossRef]
  10. Parra, D.; Valverde, L.; Pino, F.J.; Patel, M.K. A review on the role, cost and value of hydrogen energy systems for deep decarbonisation. Renew. Sustain. Energy Rev. 2018, 101, 279–294. [Google Scholar] [CrossRef]
  11. Masip, Y.; Gutierrez, A.; Morales, J.; Campo, A.; Valín, M. Integrated Renewable Energy System based on IREOM Model and Spatial–Temporal Series for Isolated Rural Areas in the Region of Valparaiso, Chile. Energies 2019, 12, 1110. [Google Scholar] [CrossRef] [Green Version]
  12. Kötter, E.; Schneider, L.; Sehnke, F.; Ohnmeiss, K.; Schröer, R. The future electric power system: Impact of Power-to-Gas by interacting with other renewable energy components. J. Energy Storage 2016, 5, 113–119. [Google Scholar] [CrossRef]
  13. Pleßmann, G.; Erdmann, M.; Hlusiak, M.; Breyer, C. Global Energy Storage Demand for a 100% Renewable Electricity Supply. Energy Procedia 2014, 46, 22–31. [Google Scholar] [CrossRef] [Green Version]
  14. Colbertaldo, P.; Agustin, S.B.; Campanari, S.; Brouwer, J. Impact of hydrogen energy storage on California electric power system: Towards 100% renewable electricity. Int. J. Hydrogen Energy 2019, 44, 9558–9576. [Google Scholar] [CrossRef]
  15. Lu, B.; Blakers, A.; Stocks, M. 90–100% renewable electricity for the South West Interconnected System of Western Australia. Energy 2017, 122, 663–674. [Google Scholar] [CrossRef]
  16. Schuetze, T.; Lee, J.-W.; Lee, T.-G. Sustainable Urban (re-)Development with Building Integrated Energy, Water and Waste Systems. Sustainability 2013, 5, 1114–1127. [Google Scholar] [CrossRef] [Green Version]
  17. Microgrids Enter the Mainstream—Renewable Energy Focus. Available online: http://www.renewableenergyfocus.com/view/43345/microgrids-enter-the-mainstream/ (accessed on 25 January 2021).
  18. Global Renewables Outlook: Energy Transformation 2050. Available online: https://www.irena.org/publications/2020/Apr/Global-Renewables-Outlook-2020 (accessed on 25 January 2021).
  19. Lew, D.; Piwko, D.; Miller, N.; Jordan, G.; Clark, K.; Freeman, L. How Do High Levels of Wind and Solar Impact the Grid? The Western Wind and Solar Integration Study; NREL/TP-5500-50057, 1001442; National Renewable Energy Laboratory (NREL): Golden, CO, USA, 2010.
  20. Fuel Cells and Hydrogen Joint Undertaking. Hydrogen Roadmap Europe: A Sustainable Pathway for the European Energy Transition; Publications Office of the European Union: Luxembourg, 2019. [Google Scholar]
  21. Chehade, Z.; Mansilla, C.; Lucchese, P.; Hilliard, S.; Proost, J. Review and analysis of demonstration projects on power-to-X pathways in the world. Int. J. Hydrogen Energy 2019, 44, 27637–27655. [Google Scholar] [CrossRef]
  22. Götz, M.; Lefebvre, J.; Mörs, F.; McDaniel Koch, A.; Graf, F.; Bajohr, S.; Reimert, R.; Kolb, T. Renewable Power-to-Gas: A technological and economic review. Renew. Energy 2016, 85, 1371–1390. [Google Scholar] [CrossRef] [Green Version]
  23. Bourne, S. The future of fuel: The future of hydrogen. Fuel Cells Bull. 2012, 2012, 12–15. [Google Scholar] [CrossRef]
  24. Reuß, M.; Grube, T.; Robinius, M.; Preuster, P.; Wasserscheid, P.; Stolten, D. Seasonal storage and alternative carriers: A flexible hydrogen supply chain model. Appl. Energy 2017, 200, 290–302. [Google Scholar] [CrossRef]
  25. Dawood, F.; Anda, M.; Shafiullah, G. Hydrogen production for energy: An overview. Int. J. Hydrogen Energy 2020, 45, 3847–3869. [Google Scholar] [CrossRef]
  26. Sharma, S.; Ghoshal, S.K. Hydrogen the future transportation fuel: From production to applications. Renew. Sustain. Energy Rev. 2015, 43, 1151–1158. [Google Scholar] [CrossRef]
  27. Morgan, E.; Manwell, J.; McGowan, J. Wind-powered ammonia fuel production for remote islands: A case study. Renew. Energy 2014, 72, 51–61. [Google Scholar] [CrossRef]
  28. Proost, J. State-of-the art CAPEX data for water electrolysers, and their impact on renewable hydrogen price settings. Int. J. Hydrogen Energy 2018, 44, 4406–4413. [Google Scholar] [CrossRef]
  29. Schmidt, O.; Gambhir, A.; Staffell, I.; Hawkes, A.; Nelson, J.; Few, S. Future cost and performance of water electrolysis: An expert elicitation study. Int. J. Hydrogen Energy 2017, 42, 30470–30492. [Google Scholar] [CrossRef]
  30. Reuß, M.; Grube, T.; Robinius, M.; Stolten, D. A hydrogen supply chain with spatial resolution: Comparative analysis of infrastructure technologies in Germany. Appl. Energy 2019, 247, 438–453. [Google Scholar] [CrossRef]
  31. Armijo, J.; Philibert, C. Flexible production of green hydrogen and ammonia from variable solar and wind energy: Case study of Chile and Argentina. Int. J. Hydrogen Energy 2019, 45, 1541–1558. [Google Scholar] [CrossRef]
  32. Hydrogen Tools. Basic Hydrogen Properties Chart. Available online: https://h2tools.org/tools (accessed on 25 January 2021).
  33. Cardella, U.; Decker, L.; Klein, H. Roadmap to economically viable hydrogen liquefaction. Int. J. Hydrogen Energy 2017, 42, 13329–13338. [Google Scholar] [CrossRef]
  34. Chapman, A.J.; Fraser, T.; Itaoka, K. Hydrogen import pathway comparison framework incorporating cost and social preference: Case studies from Australia to Japan. Int. J. Energy Res. 2017, 41, 2374–2391. [Google Scholar] [CrossRef]
  35. Al-Sharafi, A.; Sahin, A.Z.; Ayar, T.; Yilbas, B.S. Techno-economic analysis and optimization of solar and wind energy systems for power generation and hydrogen production in Saudi Arabia. Renew. Sustain. Energy Rev. 2016, 69, 33–49. [Google Scholar] [CrossRef]
  36. Yoshino, Y.; Harada, E.; Inoue, K.; Yoshimura, K.; Yamashita, S.; Hakamada, K. Feasibility Study of “CO2 Free Hydrogen Chain” Utilizing Australian Brown Coal Linked with CCS. Energy Procedia 2012, 29, 701–709. [Google Scholar] [CrossRef] [Green Version]
  37. Noussan, M.; Raimondi, P.; Scita, R.; Hafner, M. The Role of Green and Blue Hydrogen in the Energy Transition—A Technological and Geopolitical Perspective. Sustainability 2020, 13, 298. [Google Scholar] [CrossRef]
  38. Vásquez, R.; Salinas, F. Tecnologías del Hidrógeno y Perspectivas para Chile, 1st ed.; Deutsche Gesellschaft für Internationale Zusammenarbeit (GIZ) GmbH: Bonn, Germany, 2018. [Google Scholar]
  39. Chardonnet, C.; Giordano, V.; De Vos, L.; Bart, F.; De Lacroix, T. Study on Early Business Cases for H2 in Energy Storage and More Broadly Power to H2 Applications; FCH-JU: Brussels, Belgium, 2017. [Google Scholar]
  40. Sharma, A.; Arya, S.K. Hydrogen from algal biomass: A review of production process. Biotechnol. Rep. 2017, 15, 63–69. [Google Scholar] [CrossRef] [PubMed]
  41. Pellegrino, S.; Lanzini, A.; Leone, P. Techno-economic and policy requirements for the market-entry of the fuel cell micro-CHP system in the residential sector. Appl. Energy 2015, 143, 370–382. [Google Scholar] [CrossRef]
  42. Walker, S.B.; Mukherjee, U.; Fowler, M.; Elkamel, A. Benchmarking and selection of Power-to-Gas utilizing electrolytic hydrogen as an energy storage alternative. Int. J. Hydrogen Energy 2015, 41, 7717–7731. [Google Scholar] [CrossRef]
  43. Mohamed, B.; Ali, B.; Ahmed, B.; Ahmed, B.; Salah, L.; Rachid, D. Study of hydrogen production by solar energy as tool of storing and utilization renewable energy for the desert areas. Int. J. Hydrogen Energy 2016, 41, 20788–20806. [Google Scholar] [CrossRef]
  44. Amirante, R.; Cassone, E.; Distaso, E.; Tamburrano, P. Overview on recent developments in energy storage: Mechanical, electrochemical and hydrogen technologies. Energy Convers. Manag. 2017, 132, 372–387. [Google Scholar] [CrossRef]
  45. Lamb, K.E.; Dolan, M.D.; Kennedy, D.F. Ammonia for hydrogen storage; A review of catalytic ammonia decomposition and hydrogen separation and purification. Int. J. Hydrogen Energy 2019, 44, 3580–3593. [Google Scholar] [CrossRef]
  46. Ikäheimo, J.; Kiviluoma, J.; Weiss, R.; Holttinen, H. Power-to-ammonia in future North European 100% renewable power and heat system. Int. J. Hydrogen Energy 2018, 43, 17295–17308. [Google Scholar] [CrossRef]
  47. Takaoka, Y.; Kagaya, H.; Saeed, A.; Nishimura, M. Introduction to a Liquefied Hydrogen Carrier for a Pilot Hydrogen Energy Supply Chain (HESC) Project in Japan; Kawasaki Heavy Industries: Tokyo, Japan, 2017. [Google Scholar]
  48. Elgowainy, A.; Gaines, L.; Wang, M. Fuel-cycle analysis of early market applications of fuel cells: Forklift propulsion systems and distributed power generation. Int. J. Hydrogen Energy 2009, 34, 3557–3570. [Google Scholar] [CrossRef]
  49. Gallardo, F.I.; Ferrario, A.M.; Lamagna, M.; Bocci, E.; Garcia, D.A.; Baeza-Jeria, T.E. A Techno-Economic Analysis of solar hydrogen production by electrolysis in the north of Chile and the case of exportation from Atacama Desert to Japan. Int. J. Hydrogen Energy 2020, 46, 13709–13728. [Google Scholar] [CrossRef]
  50. Chile Wants to Fuel a Green Hydrogen Boom with $300 Million Fund. Available online: https://www.bloomberg.com/news/articles/2021-05-04/chile-wants-to-fuel-a-green-hydrogen-boom-with-300-million-fund (accessed on 4 May 2021).
  51. Zolezzi, J.; Garay, A.; Reveco, M. Large scale hydrogen production from wind energy in the Magallanes area for consumption in the central zone of Chile. J. Power Sources 2010, 195, 8236–8243. [Google Scholar] [CrossRef]
  52. Bilbao, D.C. Valorization of the waste heat given off in a system alkaline electrolyzer-photovoltaic array to improve hydrogen production performance: Case study Antofagasta, Chile. Int. J. Hydrogen Energy 2021, 46, 31108–31121. [Google Scholar] [CrossRef]
  53. Iris, Ç.; Lam, J.S.L. A review of energy efficiency in ports: Operational strategies, technologies and energy management systems. Renew. Sustain. Energy Rev. 2019, 112, 170–182. [Google Scholar] [CrossRef]
  54. Chang, Y.-T.; Song, Y.; Roh, Y. Assessing greenhouse gas emissions from port vessel operations at the Port of Incheon. Transp. Res. Part D Transp. Environ. 2013, 25, 1–4. [Google Scholar] [CrossRef]
  55. Secretariat UNCTAD. Review of Maritime Transport 2016. Available online: https://unctad.org/system/files/official-document/rmt2016_en.pdf (accessed on 25 January 2021).
  56. Acciaro, M.; Vanelslander, T.; Sys, C.; Ferrari, C.; Roumboutsos, A.; Giuliano, G.; Lam, J.S.L.; Kapros, S. Environmental sustainability in seaports: A framework for successful innovation. Marit. Policy Manag. 2014, 41, 480–500. [Google Scholar] [CrossRef]
  57. Lam, J.S.L.; Notteboom, T. The Greening of Ports: A Comparison of Port Management Tools Used by Leading Ports in Asia and Europe. Transp. Rev. 2014, 34, 169–189. [Google Scholar] [CrossRef]
  58. Terminal Pacífico Sur Valparaíso (TPS). Cuidado Del Medio Ambiente. Available online: https://www.tps.cl/medio-ambiente/tps/2013-08-05/173136.html (accessed on 25 January 2021).
  59. Styhre, L.; Winnes, H.; Black, J.; Lee, J.; Le-Griffin, H. Greenhouse gas emissions from ships in ports—Case studies in four continents. Transp. Res. Part D Transp. Environ. 2017, 54, 212–224. [Google Scholar] [CrossRef]
  60. Marin, J.; Raga, G.B.; Arévalo, J.; Baumgardner, D.; Córdova, A.M.; Pozo, D.; Calvo, A.; Castro, A.; Fraile, R.; Sorribas, M. Properties of particulate pollution in the port city of Valparaiso, Chile. Atmos. Environ. 2017, 171, 301–316. [Google Scholar] [CrossRef]
  61. Preuster, P.; Alekseev, A.; Wasserscheid, P. Hydrogen Storage Technologies for Future Energy Systems. Annu. Rev. Chem. Biomol. Eng. 2017, 8, 445–471. [Google Scholar] [CrossRef]
  62. Dicks, A.; Rand, D.A.J. Fuel Cell Systems Explained; Wiley Online Library: Chichester, UK, 2018; Volume 479. [Google Scholar]
  63. Silveira, J.L. Sustainable Hydrogen Production Processes: Energy, Economic and Ecological Issues. In Green Energy and Technology; Springer: Cham, Switzerland, 2017; ISBN 978-3-319-41614-4. [Google Scholar]
  64. El-Shafie, M.; Kambara, S.; Hayakawa, Y. Hydrogen Production Technologies Overview. J. Power Energy Eng. 2019, 07, 107–154. [Google Scholar] [CrossRef] [Green Version]
  65. Saithong, N.; Authayanun, S.; Patcharavorachot, Y.; Arpornwichanop, A. Thermodynamic analysis of the novel chemical looping process for two-grade hydrogen production with CO2 capture. Energy Convers. Manag. 2019, 180, 325–337. [Google Scholar] [CrossRef]
  66. Smolinka, T. Water Electrolysis: Status and Potential for Development; Fraunhofer: Freiburg, Germany, 2014. [Google Scholar]
  67. Hydrogen Production Technologies; Sankir, M.; Sankir, N.D. Advances in Hydrogen Production and Storage; Wiley: Hoboken, NJ, USA, 2017; ISBN 978-1-119-28364-5. [Google Scholar]
  68. Walker, S.B.; van Lanen, D.; Fowler, M.; Mukherjee, U. Economic analysis with respect to Power-to-Gas energy storage with consideration of various market mechanisms. Int. J. Hydrogen Energy 2016, 41, 7754–7765. [Google Scholar] [CrossRef]
  69. dos Santos, K.G.; Eckert, C.T.; De Rossi, E.; Bariccatti, R.A.; Frigo, E.P.; Lindino, C.A.; Alves, H.J. Hydrogen production in the electrolysis of water in Brazil, a review. Renew. Sustain. Energy Rev. 2017, 68, 563–571. [Google Scholar] [CrossRef]
  70. Bruce, S.; Temminghoff, M.; Hayward, J.; Schmidt, E.; Munnings, C.; Palfreyman, D.; Hartley, P. National Hydrogen Roadmap; Commonwealth Scientific and Industrial Research Organisation (CSIRO): Canberra, Australia, 2018. [Google Scholar]
  71. Palmer, G. Australia’s Hydrogen Future 2018; Energy Transition Hub: Melbourne, Australia, 2018. [Google Scholar]
  72. Chen, Y.-T.; Hsu, C.-W. The key factors affecting the strategy planning of Taiwan’s hydrogen economy. Int. J. Hydrogen Energy 2018, 44, 3290–3305. [Google Scholar] [CrossRef]
  73. Marchi, C.S.; Hecht, E.; Ekoto, I.; Groth, K.; LaFleur, C.; Somerday, B.; Mukundan, R.; Rockward, T.; Keller, J.; James, C. Overview of the DOE hydrogen safety, codes and standards program, part 3: Advances in research and development to enhance the scientific basis for hydrogen regulations, codes and standards. Int. J. Hydrogen Energy 2016, 42, 7263–7274. [Google Scholar] [CrossRef] [Green Version]
  74. Boudries, R.; Khellaf, A.; Aliane, A.; Ihaddaden, L.; Khida, F. PV system design for powering an industrial unit for hydrogen production. Int. J. Hydrogen Energy 2014, 39, 15188–15195. [Google Scholar] [CrossRef]
  75. Abdalla, A.M.; Hossain, S.; Nisfindy, O.B.; Azad, A.T.; Dawood, M.; Azad, A.K. Hydrogen production, storage, transportation and key challenges with applications: A review. Energy Convers. Manag. 2018, 165, 602–627. [Google Scholar] [CrossRef]
  76. Acar, C.; Dincer, I. Review and evaluation of hydrogen production options for better environment. J. Clean. Prod. 2019, 218, 835–849. [Google Scholar] [CrossRef]
  77. Ghaib, K.; Ben-Fares, F.-Z. Power-to-Methane: A state-of-the-art review. Renew. Sustain. Energy Rev. 2018, 81, 433–446. [Google Scholar] [CrossRef]
  78. Guandalini, G.; Campanari, S.; Romano, M.C. Power-to-gas plants and gas turbines for improved wind energy dispatchability: Energy and economic assessment. Appl. Energy 2015, 147, 117–130. [Google Scholar] [CrossRef]
  79. Kadam, R.; Panwar, N.L. Recent advancement in biogas enrichment and its applications. Renew. Sustain. Energy Rev. 2017, 73, 892–903. [Google Scholar] [CrossRef]
  80. Hirscher, M. Handbook of Hydrogen Storage: New Materials for Future Energy Storage; Wiley-VCH: Weinheim, Germany, 2010; ISBN 978-3-527-32273-2. [Google Scholar]
  81. Töpler, J.; Lehmann, J. Hydrogen and Fuel Cell; Springer: Berlin/Heidelberg, Germany, 2016; ISBN 978-3-662-44971-4. [Google Scholar]
  82. Yokohama partnership to test green hydrogen supply chain. Fuel Cells Bull. 2016, 2016, 12–13. [CrossRef]
  83. Facchini, F.; Mummolo, G.; Mossa, G.; Digiesi, S.; Boenzi, F.; Verriello, R. Minimizing the carbon footprint of material handling equipment: Comparison of electric and LPG forklifts. J. Ind. Eng. Manag. 2016, 9, 1035. [Google Scholar] [CrossRef] [Green Version]
  84. Geofísica, Facultad de Ciencias Físicas y Matemáticas Universidad de Chile Explorador Solar Chile—Manual de Usuario Versión 2016; Ministerio de Energía del Gobierno de Chile: Santiago de Chile, Chile, 2016.
  85. Ayodele, T.; Munda, J. Potential and economic viability of green hydrogen production by water electrolysis using wind energy resources in South Africa. Int. J. Hydrogen Energy 2019, 44, 17669–17687. [Google Scholar] [CrossRef]
  86. Winnes, H.; Styhre, L.; Fridell, E. Reducing GHG emissions from ships in port areas. Res. Transp. Bus. Manag. 2015, 17, 73–82. [Google Scholar] [CrossRef] [Green Version]
  87. Chaube, A.; Chapman, A.; Shigetomi, Y.; Huff, K.; Stubbins, J. The Role of Hydrogen in Achieving Long Term Japanese Energy System Goals. Energies 2020, 13, 4539. [Google Scholar] [CrossRef]
  88. Ministerio de Transporte y Telecomunicaciones Desarrollo Logistico. Available online: http://www.logistica.mtt.cl/areas/1/desarrollo-portuario (accessed on 14 October 2021).
  89. Hydrogen and Fuel Cells in the Ports Workshop Report 2017; California Hydrogen Business Council: Yorba Linda, CA, USA, 2017.
  90. Plug Power. Applications: Sustainable Fuel Cell Solutions for an Electrified World. Available online: https://www.plugpower.com/applications/ (accessed on 14 October 2021).
  91. Principales Puertos de Carga en Chile para el Transporte Marítimo de Mercancías. Available online: https://lamaignere.com/es/noticias/ficha/principales-puertos-de-carga-en-chile-para-el-transporte-maritimo-de-mercancias (accessed on 14 October 2021).
  92. Estadísticas de la Cámara Marítima y Portuaria de Chile. Available online: https://www.camport.cl/estadisticas/ (accessed on 14 October 2021).
  93. Guerra, C.F.; Reyes-Bozo, L.; Vyhmeister, E.; Caparrós, M.J.; Salazar, J.L.; Clemente-Jul, C. Technical-economic analysis for a green ammonia production plant in Chile and its subsequent transport to Japan. Renew. Energy 2020, 157, 404–414. [Google Scholar] [CrossRef]
  94. Explorador Solar. Available online: http://solar.minenergia.cl/exploracion (accessed on 14 October 2021).
  95. Barbir, F. PEM Fuel Cells: Theory and Practice; Academic Press: Cambridge, MA, USA, 2012; ISBN 0-12-387710-5. [Google Scholar]
  96. Wheeler, K.R. Efficient Operation of Diesel Generator Sets in Remote Environments. Master’s Thesis, Virginia Polytechnic Institute and State University, Blacksburg, VA, USA, 2017. [Google Scholar]
  97. Ghenai, C.; Bettayeb, M.; Brdjanin, B.; Hamid, A.K. Hybrid solar PV/PEM fuel Cell/Diesel Generator power system for cruise ship: A case study in Stockholm, Sweden. Case Stud. Therm. Eng. 2019, 14, 100497. [Google Scholar] [CrossRef]
  98. Jamshidi, M.; Askarzadeh, A. Techno-economic analysis and size optimization of an off-grid hybrid photovoltaic, fuel cell and diesel generator system. Sustain. Cities Soc. 2018, 44, 310–320. [Google Scholar] [CrossRef]
  99. Global Energy Review 2020. Available online: https://www.iea.org/reports/global-energy-review-2020 (accessed on 26 January 2020).
  100. Renewable Power Generation Costs in 2020. Available online: https://www.irena.org/publications/2021/Jun/Renewable-Power-Costs-in-2020 (accessed on 28 October 2021).
Figure 1. Representation of energy consumption by economic sector in Chile, created from data of the energy balance of 2019 [7].
Sustainability 13 13681 g001
Figure 2. Four-stage model for green H2. Reproduced with permission from [25], International Journal of Hydrogen Energy, published by Elsevier, 2020.
Sustainability 13 13681 g002
Figure 3. Representation of a complete value chain scheme for the end-use of green H2.
Sustainability 13 13681 g003
Figure 4. Chile port system in 2021. Points in red represent the main ports of the Valparaíso Region. Adapted from [92].
Sustainability 13 13681 g004
Figure 5. Power generation in the PV plant.
Sustainability 13 13681 g005
Figure 6. Final chain value for green H2 used in the Case of Study (Port Application).
Sustainability 13 13681 g006
Table 1. Consumers and attractive characteristics for the use of green H2 in port operations.
Primary Consumers in the PortAttractive Characteristics for Using Green H2
RTG Crane
Diesel generator
Forklift
Manlift
Container Handler
Container Reach Stackers
Yard Tractors
Straddle Carrier
Use of fossil fuels
A large percentage of port assets
Intensive use in cargo handling and conditioning
High energy intensity
Inability to pause operations to charge batteries, in the case of equipment with the technology
Space available for storage of batteries and fuels
Table 2. Data on the Solar Energy Explorer for Chile [94] for in the Case Study strategic location.
Location
Initial Date Data1 July 2004
End Date Data30 December 2016
Latitude−32.78727048
Length−70.95353415
Height [m]426 m
Photovoltaic Panel Parameters
Arrangement TypePermanent
Inclination [°]27
Azimuth [°]−7
Installed Capacity [MW]1
CoverageGlass
Mounting Typeopen_rack_cell_glassback
Temperature coefficient [%/°C]−0.45
Loss factor [%]14
Investor Efficiency0.96
Table 3. Monthly electric power generation based on PV plant.
MonthIndicator [MWh/MWp]Days of Each MonthMonthly PV Generation [MWh]
January5.5731172.71
February5.4728153.29
March5.0131155.28
April4.1530124.50
May3.173198.37
June2.673080.13
July2.843188.08
August3.3231102.78
September4.1330124.01
October4.8431150.00
November5.3930161.84
December5.6031173.70
Table 4. Energy system parameters for H2 and diesel were obtained based on the studies of References [38,95,96].
H2 SystemDG System
ParameterValueUnitParameterValueUnit
Fuel cell efficiency (ηFC)0.5-Efficiency (ηDG)0.38-
Electrolyzer efficiency (ηELZ)0.65-Diesel Density846[kg/m3]
Lower Heating Value of H2 (LHVH2)33.3[kWh/kgH2]Higher Heating Value of Diesel (HHVD)12.67[kWh/kgD]
Table 5. Electric power generation (Gx = Ein,ELZ) and PV plant costs for the scenarios studied.
ScenariosPower from the PV Plant [MWp]Gx 1 Typical Day June
[MWh]
Gx Month June
[MWh]
Gx 1 Typical Day December
[MWh]
Gx Month December
[MWh]
Gx Annual
[MWh]
PV Plant Cost
[USD$]
(1) June 1.153.0892.316.45200.11825$863,949
(2) December0.551.4744.003.0895.4870$411,855
(3) Annual average 0.711.8956.713.97122.91121$530,744
Table 6. Green H2 was generated for the three scenarios.
ScenariosPower from the PV Plant
[MWp]
June
[kgH2/day]
June
[kgH2/day]
December
[kgH2/day]
December
[kgH2/month]
[kgH2/year]
(1) June 1.15601800126390235,600
(2) December0.552985860186016,971
(3) Annual average 0.7137110677239721,870
Table 7. Data required to estimate the simplified LCOE for the green H2 value chain.
VariableValueUnit
LT 1 for PV Plant25year
ELZ: H2 production in LT750,075kgH2
FC: Electric Power Production in LT12,500MWh
Prorate FC16USD$/MWh
Prorate ELZ0.82USD$/kgH2
Prorate ELZeq = (Prorate ELZ/LHVH2)0.02USD$/kWheq,H2
Prorate PV (June)18.93USD$/MWh
1 LT: Lifetime.
Publisher’s Note: MDPI stays neutral with regard to jurisdictional claims in published maps and institutional affiliations.

