Article

Sensitivity of Irrigation Water Requirement to Climate Change in Arid and Semi-Arid Regions towards Sustainable Management of Water Resources

by
Fouad H. Saeed
1,2,
Mahmoud S. Al-Khafaji
3 and
Furat A. Mahmood Al-Faraj
4,*
1
Civil Engineering Department, University of Technology, Baghdad 10096, Iraq
2
Ministry of Water Resources, Baghdad 10061, Iraq
3
Civil Engineering Department, Al-Nahrain University, Baghdad 10070, Iraq
4
School of Engineering, University of Bolton, Bolton BL3 5AB, UK
*
Author to whom correspondence should be addressed.
Sustainability 2021, 13(24), 13608; https://doi.org/10.3390/su132413608
Submission received: 7 November 2021 / Revised: 2 December 2021 / Accepted: 6 December 2021 / Published: 9 December 2021
(This article belongs to the Special Issue Sustainable Water Resources Management and Sustainable Environment)

Abstract

:
This study aimed to assess the spatiotemporal sensitivity of the net irrigation water requirement (NIWR) to changes in climate, for sixteen crops widely cultivated in four irrigation projects located in arid and semi-arid regions of Iraq. Using LARS-WG and five GCMs, the minimum and maximum temperature and precipitation were projected for three periods from 2021–2080 with 20-year steps (P1, P2, and P3) under representative concentration pathways (RCPs) 2.6, 4.5, and 8.5. Weather data available for a reference period from 1990–2019 in four representatives’ meteorological stations were used. The climate variables and other required data were inserted into the CROPWAT 8 NIWR tool. Findings revealed that the increase in the NIWR for the considered crops due to climate change falls in the range 0.1–42.4%, 1.8–44.5%, 1.2–25.1%, and 0.7–14.7% for the North Jazeera Irrigation Project (NJIP), Kirkuk Irrigation Project (KRIP), Upper Khalis Irrigation Project (UKIP), and Dalmaj Irri-gation Project (DLIP), respectively. Barley is more susceptible to changes in climate, whereas maize, potato, soybean, and millet are found to withstand changes in climate better than others. The novel outcomes of this study support optimal spatiotemporal allocation of irrigation water requirement and the sustainable management of water resources in a changing climate in arid and semi-arid regions.

1. Introduction

Irrigated agriculture remains the largest user of surface and ground water, particularly in arid and semi-arid regions where the user rate around 70% [1,2,3]. The irrigation water requirement of specific crop is largely depending on climate conditions [4,5,6]. Therefore, changes in climate patterns related to global warming play crucial roles in determining future agriculture water demand [7,8,9]. Increased surface air temperature related to climate change leads to increased evapotranspiration [10] and depilates soil moisture in the root zone [11,12,13]. Furthermore, plants tend to demand more water to maintain their biomass [14]. In arid and semi-arid regions, the temperature is a primary factor affecting the irrigation water demand in a changing climate [15].
Guo and Shen [16] found that the irrigation water need in the arid region of northwestern China will increase by around 4–6 billion m3 in the next 60 years due to an increase in surface air temperature. The negative impact of climate change on the agricultural sector in Middle East is the extreme decline in crop yield [17]. Zhang et al. [18] pointed out a significant increase in warm days and decrease in cold days recorded in the Middle East during the period from 1950 to 2003. Ouarda et al. and Lelieveld et al. [19,20] stated that drought spells in the Middle East will increase in duration, frequency, and intensity. Waha et al. [21] indicated that projected annual water discharge tends to decline by 15–45%, and extreme hot weather is expected to affect about one-third of Middle East region. The water availability in Iraq will be stressed by 2025 due to climate change and population growth [22]. The northern region of Iraq suffered from frequent severe drought events during the period from 1937 to 2010 [23]. Salman et al. [24] indicated that there is an increase in irrigation water demand in Iraq during the period from 1961 to 2013.
CROPWAT software has been successfully applied to predict referenced evapotranspiration (ET0), crop evapotranspiration (ETc), and irrigation water demand for various crops planted in arid and semi-arid regions of Iraq [25,26,27] and in different locations and climate conditions worldwide [28,29,30]. A few studies were focused on the spatiotemporal sensitivity of the irrigation requirement of crops in a changing climate. This sensitivity is expected to influence the operation of current irrigation projects due to changes in the demands of irrigation water. Therefore, it is essential to investigate the future irrigation water needs for various crops in a changing climate to sustainably manage irrigation projects. Mondal et al. [31] considered that the irrigation requirement for winter crops was significantly sensitive to mean temperature in November, December, and January. This paper was designed to explore how the NIWR of crops respond to the expected change in climate variables, considering sixteen crops planted in arid and semi-arid regions of Iraq. Then, the paper presents an overall assessment of projected irrigation water demand based on various scenarios of greenhouse emissions.
The main aim of this paper is to assess the spatiotemporal sensitivity of irrigation water requirements in a changing climate considering various scenarios of greenhouse emissions. Sixteen crops, commonly cultivated in four irrigation projects, which are in arid and semi-arid regions of Iraq, are selected. The observed minimum and maximum temperatures and precipitation for four representatives’ meteorological stations located within or near the four irrigation projects are considered for a reference period (RP) from 1990–2019. Three future projected periods are examined: 2021–2040 (P1), 2041–2060 (P2), and 2061–2080 (P3) under RCP 2.6, RCP 4.5, and RCP 8.5 along with five GCMs utilizing LARS-WG model. The future climate data were introduced into CROPWAT 8 to predict and analyze ET0, NIWR, and the required discharge for four irrigation projects in Iraq.

2. Materials and Methods
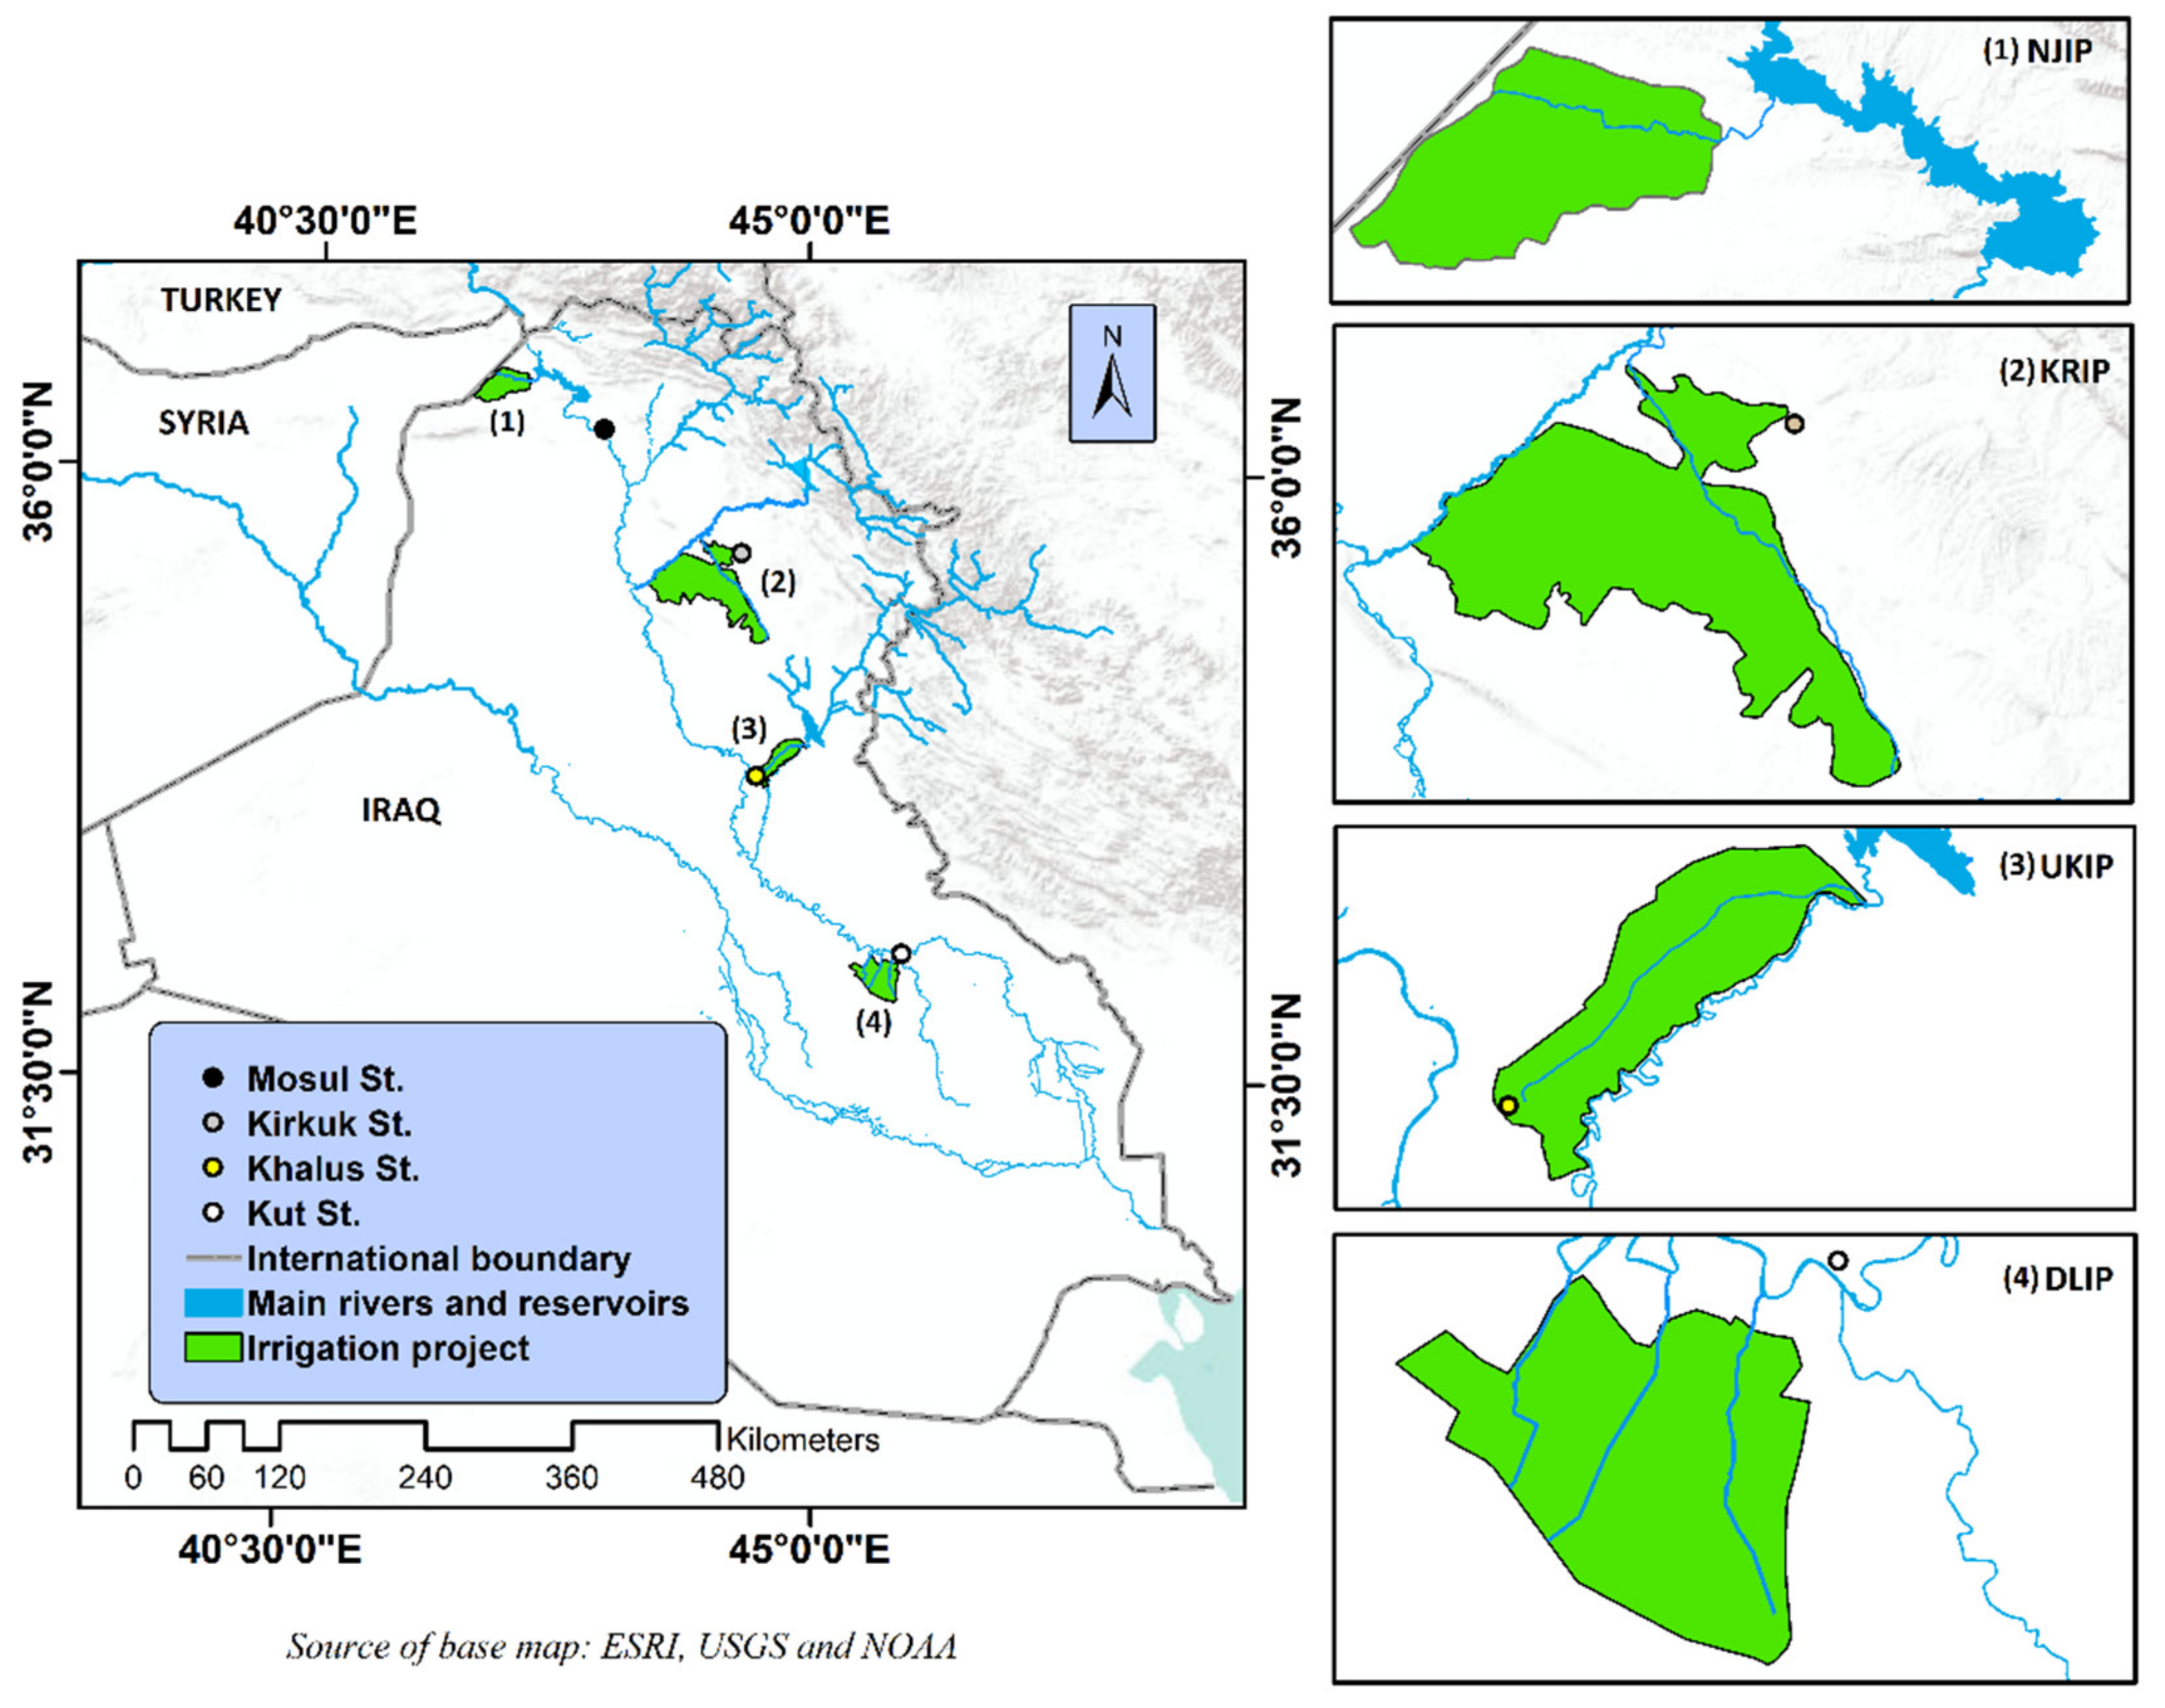
2.1. Study Area

Iraq is located between the latitudes 29.5° to 37.22° N and longitudes 38.45° to 48.45° E. The north of Iraq is extended over the semi-arid continental region of the Middle East, which has warm–dry days with a mean temperature in summer ranging from 39 to 43 °C and cool–rainy winter days with a mean temperature of 7–13 °C [32]. The average annual precipitation ranged between 1000 mm in high altitude and less than 300 mm in western parts. Most of precipitation occurs in winter between November and April [23]. The region extended in the center of Iraq is characterized by arid to semi-arid climate conditions with a cool–wet winter and a hot–dry summer. Rainfall spans from November to April and ranges between 100 and 970 mm/year (500 mm/year on average) [33]. The cultivable area represents 22% of the total area of Iraq with 43.7 million hectares (×106 ha) [34]. Wheat, barley, maize, sorghum, and other spring (such as beet, onion, garlic, and peppers) and autumn small vegetations (such as turnip, cauliflower, carrot, and lettuce) are the conventional crops planted in Iraq [35].
For this study, four reclaimed irrigation projects located in arid and semi-arid regions of Iraq were selected; these projects were named the North Jazeera Irrigation Project (NJIP), Kirkuk Irrigation Project (KRIP), Upper Khalis Irrigation Project (UKIP), and Dalmaj Irrigation Project (DLIP), which operated in the 1980s. The location of these projects is shown in Figure 1. The net irrigated areas of NJIP, KRIP, UKIP, and DLIP are 58, 145, 47, and 65 (×103) ha, respectively [36]. For NJIP, the water is pumped from the Mosul Dam reservoir on the Tigris River with an operation discharge of 42 m3/s. The irrigation water conveyance system consists of lined main and secondary canals, which distribute irrigation water into a linear wheel moving sprinkler system. Using leveled basins as a method of irrigation, the KRIP, UKIP, and DLIP are designed with an operation discharge of 176 (from the Lesser Zab River, which is one of the Tigris River’s main tributaries), 33 (from Diyala River, which is one of the Tigris River’s main tributaries), and 52 m3/s (from the Tigris River), respectively. These projects are strategic projects supporting food security in Iraq by providing strategic crops such as grains and vegetables.

2.2. Modeling

2.2.1. LARS-WG

LARS-WG is a single site stochastic weather generator model used for hydrologic applications, environment management, and agricultural risk assessment [37]. The model provides daily synthetic weather based on reference weather variables including precipitation, minimum and maximum temperatures, and solar radiation. LARS-WG implemented semi-empirical distribution (SED) for the extend of daily precipitation, daily solar radiation, and frequency of dry and wet periods.
Considering a stochastic process, LARS-WG predicts the minimum and maximum temperatures based on daily mean and daily standard deviation, which are related to the wet and dry conditions of a day. LARS-WG version 6 can project precipitation, solar radiation, and minimum and maximum temperatures optionally from 2011 to 2100 in 20-year steps. LARS-WG version 6 considers the various general circulation for different Coupled Model Inter-comparison Project Phase 5 (CMIP5) under four Representative Concentration Pathways (RCP 2.6, RCP 4.5, RCP 6, and RCP 8.5) [37].

2.2.2. CROPWAT 8

CROPWAT 8 is a software developed by FAO to calculate crop water requirements based on crop, climate, and soil data [38]. The software calculates the referenced evapotranspiration (ET0) based on the Penman–Monteith method (Equation (1)). For ET0 calculations, CROPWAT 8 required the minimum temperature, maximum temperature, relative humidity, wind speed, and sunshine hours as input data for specific climate stations. The crop coefficient (Kc) represents a factor of crop development stages, and CROPWAT 8 calculates the crop evapotranspiration (ETc) based on ET0 and Kc, as shown in Equation (2).
In this study, the effective rainfall (Re) was calculated based on the USDA soil conservation service method (Equation (3), [39]). Furthermore, the net irrigation water requirement (NIWR) was calculated by subtracting Re from ETc (Equation (4)). The gross irrigation water requirement (GIWR) calculated by Equation (5) in liter/second per hectare based on NIWR, soil, and crop patterns defined by the user.
ET 0 = 0.408   Δ   Rn G + 900   γ   U 2 e s e a T + 273 Δ + γ 1 + 0.34   U 2
where ET0 is the reference evapotranspiration (mm/day); Rn is the net radiation at the crop surface (MJ.m2/day); G is the soil heat flux density (MJ.m2/day); T is the mean daily air temperature at 2 m height (°C); U2 is the wind speed at 2 m height (m/s); es is the mean Saturation vapor pressure (KPa); ea is the actual vapor pressure (KPa); ∆ is the slope of saturation vapor pressure curve (KPa/°C); and γ is the psychrometric constant (KPa/°C).
ETc = ET0 × Kc
where ETc is the crop evapotranspiration (mm/day), and Kc is the crop coefficient (dimensionless), which is calculated based on [38] with no water stress considered.
Re = R (125 − 0.2 R)/125 for R ≤ 250 mm
Re = 125 + 0.1R for R > 250 mm
where Re is effective rainfall (mm) and R total rainfall (mm).
NIWR = ETc − Re
where NIWR is the net irrigation water requirement (mm).
GIWR = (NIWR + Lr)/Ea × 100
where GIWR is the gross irrigation water requirement (mm), Ea is the application efficiency (fraction) [40], and Lr is the leaching requirement (mm), which is calculated by Lr = f × NIWR, where f ranges from 5–12% based on available soil salinity [41].

2.3. Data

The daily recorded precipitation data for the period from 1 January 1990 to 31 December 2019 (RP) were provided by the Iraqi Metrological Organization and Seismology (IMOS) for the four examined climate stations. The minimum and maximum temperatures, relative humidity, and wind speed data were downloaded from https://globalweather.tamu.edu (accessed on 14 June 2021) [41,42,43].
The monthly sunshine hours were taken from https://www.weather-atlas.com (accessed on 12 July 2021).
The soil types in CROPWAT 8 were defined based on world soil data produced by FAO [44,45]. The data related to studied irrigation projects were provided by the Ministry of Water Resources [36], and these data include the total and net irrigated areas, irrigation method, operation discharge, and crop patterns in each irrigation project.

2.4. Methodology

Firstly, the minimum and maximum temperatures and precipitation recorded in the four specified metrological stations for the RP were projected using LARS-WG for three future periods; Period 1 (P1) from 2021 to 2040, Period 2 (P2) from 2041 to 2060, and Period 3 (P3) from 2061 to 2080. LARS-WG version 6 was implemented under five Global Circulation Models (GCMs), which are The Beijing Climate Centre Institute of Atmospheric Physics (BCC-CSM1), The Canadian Earth System Second Generation Model (CanESM2), Australia’s Commonwealth Scientific and Industrial Research Organization (CSIRO-MK36), Hadley Centre Global Environment Model Version 2 (HadGEM2-ES), and The Norwegian Earth System Model (NorESM1) for RCP 2.6, RCP 4.5, and RCP 8.5 climate change scenarios. Secondly, the recorded and projected weather data were aggregated into average monthly data for RP, P1, P2, and P3 and then inserted into CROPWAT 8 to calculate ET0 and Re. The soil data, crop patterns, and dates of planting were defined for CROPWAT 8 to determine ETc and NIWR for 16 crops, which are wheat, barley, spring maize, sunflower, cotton, spring potato, spring small vegetables, soybean, small grains, millet, tomato, sorghum, autumn maize, autumn potato, autumn small vegetables, and alfalfa. The relative humidity and the wind speed for P1, P2, and P3 were assumed to be same as in RP [46]. Furthermore, many researchers [47,48] did not consider these climate variables in projected irrigation demand. The NIWR of each crop and the irrigation demand of each project were projected under RCP 2.6, RCP 4.5, and RCP 8.5 for P1, P2, and P3 using CROPWAT 8. The NIWR was transformed into irrigation demand (discharge required for irrigation) based on the irrigated area and the overall efficiency of the irrigation system. Finally, the projected ET0, Re, NIWR, and irrigation demand were evaluated and analyzed based on the impact of climate change on these variables.

3. Results

3.1. Minimum and Maximum Temperature and Precipitation in RP

The mean monthly data of climate variables extracted from the LARS-WG model were validated with corresponding variables in RP. The coefficient of determination (R-squared) and Nash–Sutcliffe Efficiency (NSE) as statistical measures were used to validate the LARS-WG model. Table 1 shows that the model performed very well for three examined variables, which are minimum temperature, maximum temperature, and precipitation. For precipitation, the R-squared (NSE) ranged between the minimum value of 0.933 for the Khalis station (0.85 for Kut station) and the maximum value of 0.98 (0.95) for the Mosul station. Concerning minimum and maximum temperatures, the R-squared (NSE) are 0.99 (0.99) for Kirkuk, Khalis, and Kut stations, while the corresponding values for Mosul station are 0.99 (0.96) and 0.99 (0.94), respectively.
The ranges of lowest minimum temperature (observed in January) and warmest maximum temperature (recorded in July) were found to be 3.0–44.2, 3.8–43.9, 5.4–46, and 6.6–47.1 °C for Mosul, Kirkuk, Khalis, and Kut stations, respectively (Figure 2a–d). For Mosul station, the simulated annual ET0 for RP is 1864.5 mm/year with highest and lowest rates of 286.2 and 39.6 mm in July and January, respectively (Figure 2a). Concerning Kirkuk station, results showed that simulated annual ET0 is 2163 mm/year in the RP with highest and lowest rates found in July and January with 317.7 and 53.4 mm, respectively (Figure 2b). The annual ET0 for Khalis station was found to be 2566.9 mm/year in RP with maximum and minimum monthly values of 380 and 69 mm in July and January, respectively (Figure 2c). The simulated annual ET0 in Kut station reached 2678 mm/year in RP with maximum and minimum monthly values in July and December of 376.8 and 87.9 mm, respectively (Figure 2d).
For Mosul station, (Figure 2a) the long-term mean annual precipitation during RP was 555.2 mm/year, the maximum value of 102.5 mm was recorded in April, and minimum values of 1.4, 0.1, and 6.5 mm were observed in July, August, and September, respectively. For Kirkuk station (Figure 2b), the long-term mean annual precipitation is 322.7 mm/year. The maximum value of 62 mm was measured in January, whereas rainfall value of less than 1 mm was reported in July, August, and September. Concerning Khalis station, the long-term mean annual precipitation is 159.6 mm/year, the maximum value of 33.3 mm occurred in January, and a trace of precipitation occurred from June to September (Figure 2c). The long-term mean annual precipitation for Kut station (Figure 2d) was 126.1 mm/year with a maximum value of 27.5 mm detected in January. No precipitation was observed during June, July, and August.
Table 2 shows the aridity index (AI) according to UNESCO classification [49], which is computed based on considered scenarios. The table shows that Mosul City is in semi-arid region, whereas Kirkuk, Khalis, and Kut Cities are located in arid regions. The projected AI indicated that the four examined metrological stations tend to become more dryer compared with RP. The highest increase in dry condition could be found under RCP 8.5 and P3. Nevertheless, no major change was found in AI zones for the studied stations.

3.2. Future Trend in Minimum and Maximum Temperatures

The results extracted from LARS-WG model showed that the rise in temperature is proportional to consecration of greenhouse emissions.
For Mosul station (Figure 3a), under RCP 2.6 (RCP 8.5), the highest rate of change in minimum temperature tends to increase in January by 15% (30.6%), 32% (53.3%), and 23% (86.6%) for P1, P2, and P3, respectively. Under RCP 4.5, the highest rates of change in minimum temperature were found to be 22.2% (in February), 38.3%, and 48.3% (both in January) for P1, P2, and P3, respectively. On the other hand, under RCP 2.6, the lowest rates of increase in minimum temperature were found to be 5.1%, 5.7% (both in July), and 5.9% (in May) for P1, P2, and P3, respectively. Under RCP 4.5, this rate reached 5.1% (in May), 8.3% (in July), and 9.9% (in June) for P1, P2, and P3, respectively. Under RCP 8.5, the lowest rate of increase observed in May with 5%, 12%, and 18.5%, for P1, P2, and P3, respectively.
Figure 3b shows the future trend in minimum temperature for Kirkuk station. Under RCP 2.6, the highest rate of increase 15.3%, 20.2% (both in February), and 16.3% (in December). Under RCP 4.5 (RCP 8.5) this rate was found to be 20.3% (21.5%) in February and 34.6% (51.8%) and 54.8% (80.4%), both in January, for P1, P2, and P3, respectively. On the other hand, the lowest increase in minimum temperature was found in August for all scenarios (except RCP 2.6 for P2 in September) with, respectively, in P1, P2, and P3, 2.3%, 5.5%, and 5.3% under RCP 2.6; 3.8%, 7.5%, and 9.9% under RCP 4.5; and 5.3%, 11.6%, and 18.6% under RCP 8.5.
The highest rate of increase in minimum temperature for Khalis station (Figure 3c) tend to occur in winter. Under RCP 2.6, this rate is up to 14.1% (in March), 9.2%, and 17.1% (both in February) for P1, P2, and P3, respectively. The highest rate of increase under RCP 4.5 (RCP 8.5) was 14.3% (16.2%) in March, 21.9% (25.7%) in February, and 27.4% (49.1%) in January for P1, P2, and P3, respectively. However, under RCP 2.6, the lowest increase in minimum temperature could be 2.7% (in June), 0.2% (in September), and 3.6% (in August) for P1, P2, and P3, respectively. Under RCP 4.5 (RCP 8.5), this rate could reach 3.3% (3.6%) in August, 6.3% (8.9%) in June, and 8.2% in August (13.1% in June) for P1, P2, and P3, respectively.
Under RCP 2.6 (RCP 4.5), the highest rate of increase in minimum temperature for Kut station (Figure 3d) was up to 12.5% (13.3%) and 15.4% (15.4%), both in March, and 24% (23.5%) in February for P1, P2, and P3, respectively. Under RCP 8.5, this rate can reach 14.5% (in March), 22.8% (in February), and 39.7% (in January) for P1, P2, and P3, respectively. On the other hand, the lowest increase in minimum temperature under RCP 2.6 was 2.6% (in September) and 4.3% and 4.4% (both in August). This increase was observed in August under RCP 4.5 (RCP 8.5) by 3.1% (3.4%), 4.7% (7.7%), and 7.3% (12.9%) for P1, P2, and P3, respectively.
For Mosul station, Figure 4a shows that the highest rate of increase in maximum temperature under RCP 2.6 was up to 8.3% (in December) and 12.6% and 11.3% (both in January) for P1, P2, and P3, respectively. Under RCP 4.5 (RCP 8.5), this positive trend was found in January (except RCP 4.5 for P2 in February), which can reach 9.3% (11.1%) in January, 13.8% in February (21.2% in January), and 19.6% (32.9%) in January for P1, P2, and P3, respectively. However, the lowest rates of increase in maximum temperature under RCP 2.6 were 2.6% (in May), 3.6% (in April), and 3.5% (in May) for P1, P2, and P3, respectively. Under RCP 4.5 (RCP 8.5), this trend was around 2.9% (3.5%) in May, 4.4% in May (7.2% in July), and 6.3% in August (10% in July) for P1, P2, and P3, respectively.
Concerning Kirkuk station (Figure 4b), under RCP 2.6 (RCP 4.5), the highest rate of increase in maximum temperature was found in January with 7.4% (9.9%), 9.6% (15.5%), and 9.5% (20.8%) for P1, P2, and P3, respectively. Under RCP 8.5, the highest rate of increase is expected to reach 12.3% (in February), 21.1% and 34.5% (both in January) for P1, P2, and P3, respectively. On the other hand, under RCP 2.6, the lowest increase was found in September with 0.6%, 2.4%, and 2.7% for P1, P2, and P3, respectively. Under RCP 4.5 (RCP 8.5), the lowest increase reached 2.9% (3.9%) in October, 5.7% (7.3%) in August, and 7.3% (11.3%) also in August for P1, P2, and P3, respectively.
The projected maximum temperature in Khalis station (Figure 4c) showed that the highest rate of increase under RCP 2.6 is 4.9% (in February), 7.9% (in January), and 8.8% (in February) for P1, P2, and P3, respectively. Under RCP 4.5 (RCP 8.5), this increase was found to be 6.4% (6.6%) in February, 9.8% in February (12% in January), and 14.5% in January (19.8% in January) for P1, P2, and P3, respectively. However, under RCP 2.6, the lowest rate of increase is expected to occur with 0.7% (in September), 0.7% (in April), and 2.2% (in September) for P1, P2, and P3, respectively. The lowest rate of increase under RCP 4.5 (RCP 8.5) was found to be 1.5% in September (2 in May), 3.2% (4.7) in May, and 4.8% in May (7.9% in June) for P1, P2, and P3, respectively.
Changes in maximum temperature of Kut station are shown in Figure 4d. For all RCPs and projected periods, it can be noticed that the highest rate of increase tends to occur in January for P1, P2, and P3, by 5.5%, 8.4%, and 14.2% (under RCP 2.6); 6.7%, 8.4% and 14.8% (under RCP 4.5); and 6.4%, 12.4%, and 19.8% (under RCP 8.5), respectively. On the other hand, for RCP 2.6, the lowest rate of increase in maximum temperature was found to be 0.3% and 1.1% (both in May) and 4% (in September) for P1, P2, and P3, respectively. For RCP 4.5, the corresponding values were found in January of 1.3%, 2.2%, and 4.2% for P1, P2, and P3, respectively. Moreover, under RCP 8.5, the lowest rates of increase in maximum temperature were 1.4% and 4.1% (both in May) and 7% (in June) for P1, P2, and P3, respectively.

3.3. Future Trend in ET0

Results showed in Figure 5a indicated that the highest rate of increase in ET0 was about 5% for Mosul station, which occurred in January and December under RCP 2.6 for the three projected periods. Under RCP 4.5, the highest rate of increase was found to be 4.6%, 7.2% (both in February) and 9.1% (in January) for P1, P2, and P3, respectively. Under RCP 8.5, the highest rate of increase was found to be 5.8% (in December) and 9.8% and 15.9% (both in January) for P1, P2, and P3, respectively. On the other hand, the lowest rate of increase in ET0 was observed in July (except RCP 2.6 for P1 was found in May), respectively for P1, P2, and P3, with 1.8%, 2.4%, and 2.3% (under RCP 2.6); 1.9%, 3.1%, and 4.1% (under RCP 4.5); and 2.4%, 4.6%, and 6.3% (under RCP 8.5).
For Kirkuk station, Figure 5b displayed that under RCP 2.6, the highest rate of increase in ET0 occurred in March with 4.4%, 5.4%, and 4.9% for P1, P2, and P3, respectively. Under RCP 4.5, the highest rate of increase was found to be 6.1% (in March) and 8.4% and 11.6% (both in February) for P1, P2, and P3, respectively. The highest rate of increase under RCP 8.5 is expected to reach 7.1% (in March), 10.4% (in February) and 18% (in January) for P1, P2, and P3, respectively. The lowest rate of increase in ET0 was noticed in September with 0.5%, 1.9%, and 2% under RCP 2.6 for P1, P2, and P3, respectively. Under RCP 4.5 (RCP 8.5) corresponding values were observed in August of 2.1% (2.6%), 3.9% (5.1%), and 5% (7.6%) for P1, P2, and P3, respectively.
As far as Khalis station is concerned, Figure 5c showed that under RCP 2.6, the highest rate of increase in ET0 is expected to occur with 3.8% (in November), 4.2% (in February), and 5.6% (in March) for P1, P2, and P3, respectively. Under RCP 4.5, the highest increases are 3.9% and 6.3% (both in February) and 8.8% (in December) for P1, P2, and P3, respectively. This trend under RCP 8.5 was found to be 3.8% (in March) and 7.9% and 13% (both in December) for P1, P2, and P3, respectively. On the other hand, under RCP 2.6, the lowest rates of increase in ET0 were up to 0.7% (in September), 0.4% (in April), and 1.5% (in June) for P1, P2, and P3, respectively. Under RCP 4.5, the corresponding values were 1.2% (in September), 2.6% (in June), and 3.7% (in May) for P1, P2, and P3, respectively. In the same context, under RCP 8.5, the lowest rate of increase would occur up to 1.6% (in June), 3.5% (in May) and 5.8% (in June) for P1, P2, and P3, respectively.
Figure 5d illustrated that, under RCP 2.6, the highest rate of increase in ET0 for Kut station is expected to occur in June with 3.4% and 4.4% (both in November) and 8.3% (in February) for P1, P2, and P3, respectively. Under RCP 4.5 (RCP 8.5), the highest rates of increase were found in January with 3.7% (3.4), 4.8% (7.5), and 8.8% (12.6%) for P1, P2, and P3, respectively. On the other hand, the lowest rates of increase were noticed in June with 0.4%, 1.3%, and 3.0% (under RCP 2.6); 1.1%, 1.9%, and 3.3% (under RCP 4.5); and 1.1%, 3.2%, and 4.9% (under RCP 8.5) for P1, P2, and P3, respectively.
For Mosul station, Figure 6a illustrated that the average annual projected ET0 at the end of 2080 is expected to be 1954.5, 1995.9, and 2060.7 mm/year under RCP 2.6, RCP 4.5, and RCP 8.5, respectively. Figure 6b showed an increase in the average annual projected ET0 in Kirkuk station with 2273, 2362, and 2445 mm/year by 2080 under RCP 2.6, RCP 4.5, and RCP 8.5, respectively. The projected values of average annual ET0 in Khalis station at the end of P3 were found to be 2685, 2746.5, and 2817.6 mm/year under RCP 2.6, RCP 4.5, and RCP 8.5, respectively (Figure 6c). At the end of 2080s, the projected average annual ET0 for Kut station tends to increase up to 2889.3, 2901.6, and 2974.5 mm/year under RCP 2.6, RCP 4.5, and RCP 8.5, respectively (Figure 6d).

3.4. Future Trend in Precipitation and Effective Rainfall

For Mosul station, (Figure 7a) results showed that the projected annual precipitation tends to decline (except RCP 2.6 and P2), respectively, for P1, P2, and P3, by 552.2, 557.8, and 548.4 mm/year (under RCP 2.6); 548.7, 544.7, and 527.1 mm/year (under RCP 4.5); and 551.6, 536.2, and 523.9 mm/year (under RCP 8.5). Furthermore, Figure 8a showed that the annual Re tends to change, respectively, for P1, P2, and P3, by 0.0%, 0.9%, and −0.9% (under RCP 2.6); −0.5%, −1.1%, and −3.1% (under RCP 4.5); and −0.9%, −2.4%, and −2.8% (under RCP 8.5). Under RCP 2.6, the highest rate of decline in Re was found in May, which could reach 3.1%, 3.7%, and 5.3% for P1, P2, and P3, respectively. Under RCP 4.5, the highest decrease is expected to reach 4.2% and 5.3% (both in January) and 5.3% (in May) for P1, P2, and P3, respectively. Under RCP 8.5, precipitation significantly declined, with the highest reductions of 7.7% (in October), 13.1% (in November), and 9.2% (in December) for P1, P2, and P3, respectively.
The precipitation in Kirkuk station (Figure 7b) is expected to decrease, respectively, for P1, P2, and P3, (except RCP 2.6 and P2) by 316.5, 325.1, and 320.2 mm/year (under RCP 2.6); 319.5, 319.9, and 302 mm/year (under RCP 4.5); and 316.5, 312, and 300.5 mm/year (under RCP 8.5). Consequently, the annual Re (Figure 8b) tends to change, respectively, for P1, P2, and P3, by −0.7%, 0.8%, and −0.8% (under RCP 2.6); 0.0%, −0.3%, and −4.1% (under RCP 4.5); and −0.7%, −1.9%, and −3.5% (under RCP 8.5). The maximum reduction rate under RCP 2.6 was observed in May with 6.3%, 10.2%, and 6.8% for P1, P2, and P3, respectively. Under RCP 4.5, the highest rate of decrease tends to occur with 4.3%, 4.1% (both in January), and 11.3% (in April) for P1, P2, and P3, respectively. Under RCP 8.5, the highest rates of decrease were found to be 6.3% (in May), 9.9% (in November), and 12% (in April) for P1, P2, and P3, respectively.
The projected precipitation in Khalis station (Figure 7c) tends to change, respectively, for P1, P2, and P3, by up to 155.8, 158.4, and 159 mm/year (under RCP 2.6); 156.7, 157, and 143.5 mm/year (under RCP 4.5); and 157.1, 156.8, and 148.1 mm/year (under RCP 8.5). Figure 8c shows that, under RCP 2.6, the highest decline in Re is expected to occur in May by 17.9%, 50%, and 39.3% for P1, P2, and P3, respectively. Under RCP 4.5, the highest reductions were found of 14.3% (in May), 6.8% (in April), and 43% (in May) for P1, P2, and P3, respectively. Under RCP 8.5, the maximum decline in projected Re was found to be 6.7% (in October), 7.1% (in April), and 15.3% (in May) for P1, P2, and P3, respectively. In spite of the decline in annual precipitation, an increase could occur in October under RCP 2.6 with 12%, 15.5%, and 11% for P1, P2, and P3, respectively. Under RCP 8.5 and P1, precipitation tends to increase by 59.3% in May, and no significant increase was found in other simulations.
Results revealed an uneven trend in annual projected precipitation for Kut station (Figure 7d). Under RCP 2.6, a positive trend is expected in precipitation with 129.8, 129.3 and 127.9 mm/year for P1, P2, and P3, respectively. Under RCP 4.5 (RCP 8.5), the annual precipitation tends to decrease by 123.7 (121.7), 126.1 (119.7) and 112.5 mm/year (120 mm/year) for P1, P2, and P3, respectively. Under RCP 2.6, the highest rates of increase in Re are expected to occur with 36% (in October), 49.5% (in April), and 11% (in March) for P1, P2, and P3, respectively (Figure 8d). In spite of the increase in annual Re under RCP 2.6, a reduction is expected in some months with highest rates of 9.3% and 16% (both in February) and 8% (in January) for P1, P2, and P3, respectively. Under RCP 4.5, the highest decline was found to be 11%, 5.9% (both in February), and 38.1% (in May) for P1, P2, and P3, respectively. An increase is expected under this scenario with 10.4% (in March), 4.5% (in May), and 5.5% (in October) for P1, P2, and P3, respectively. Under RCP 8.5, the most reduction was found to be 30.8% (in April), 22% (in February), and 46.2% (in April) for P1, P2, and P3, respectively, and an increase is expected to be 36.4%, 10.9% (both in May), and 26.7% (in October) for P1, P2, and P3, respectively.

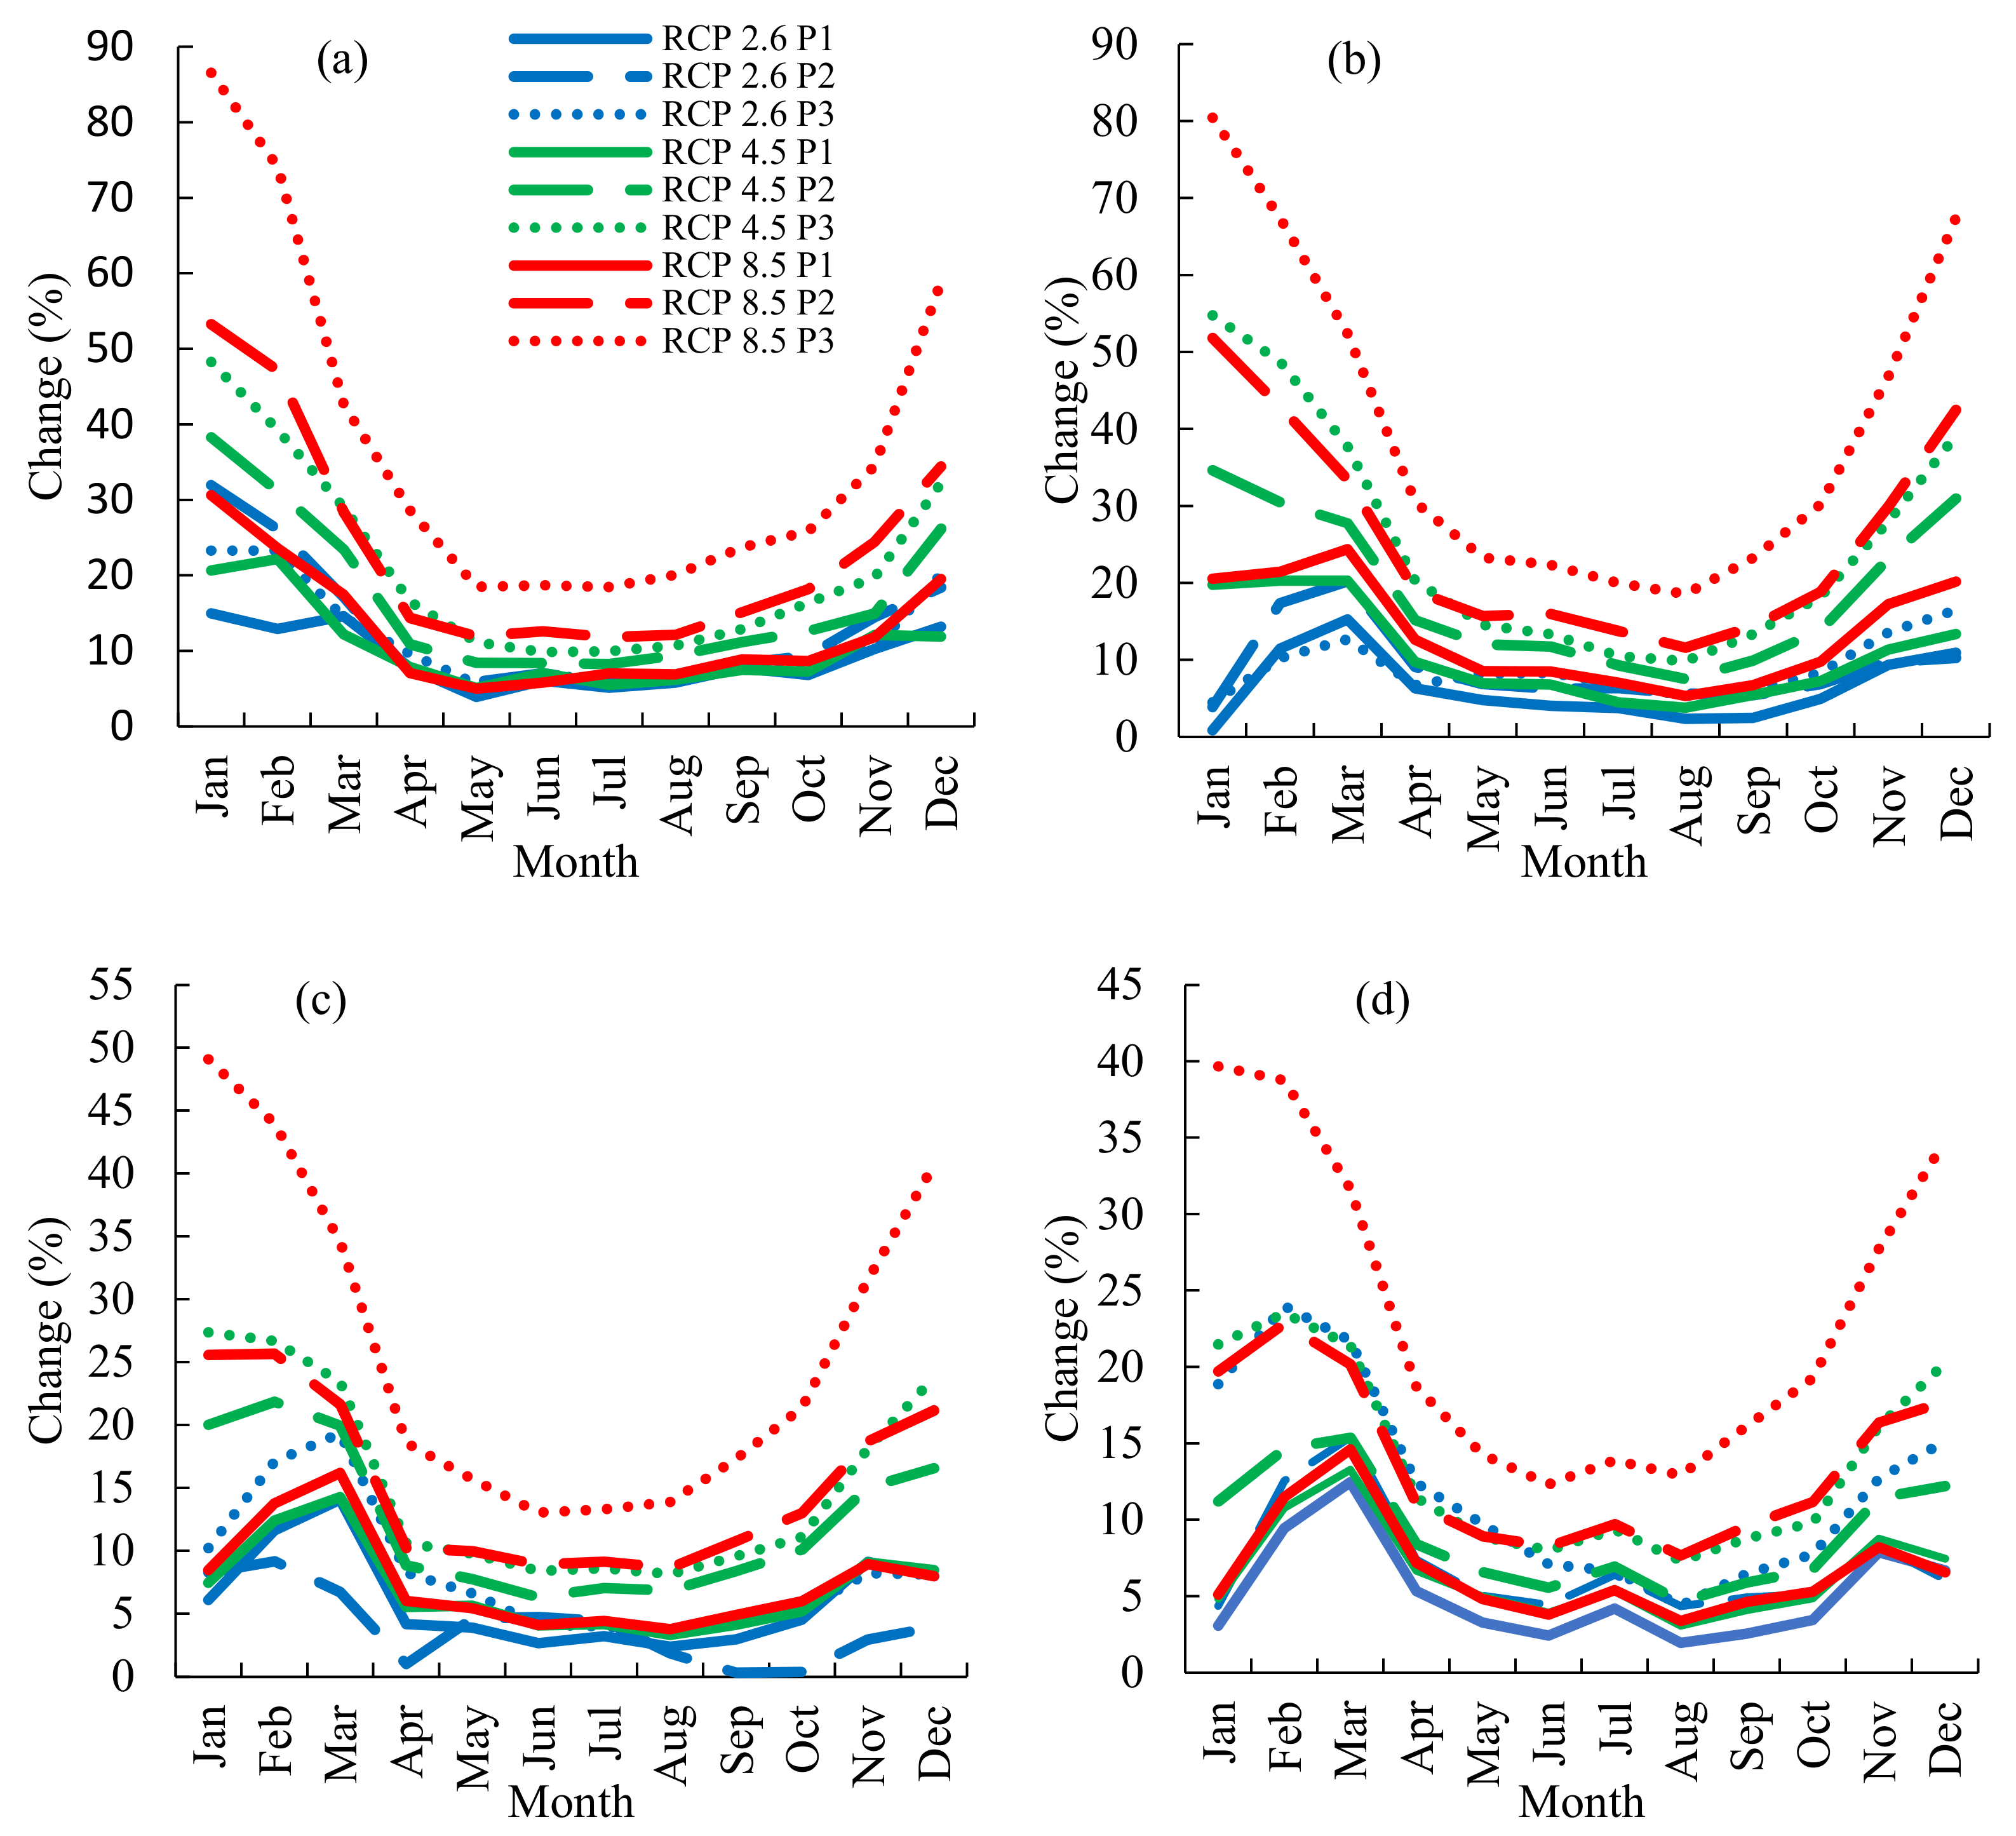
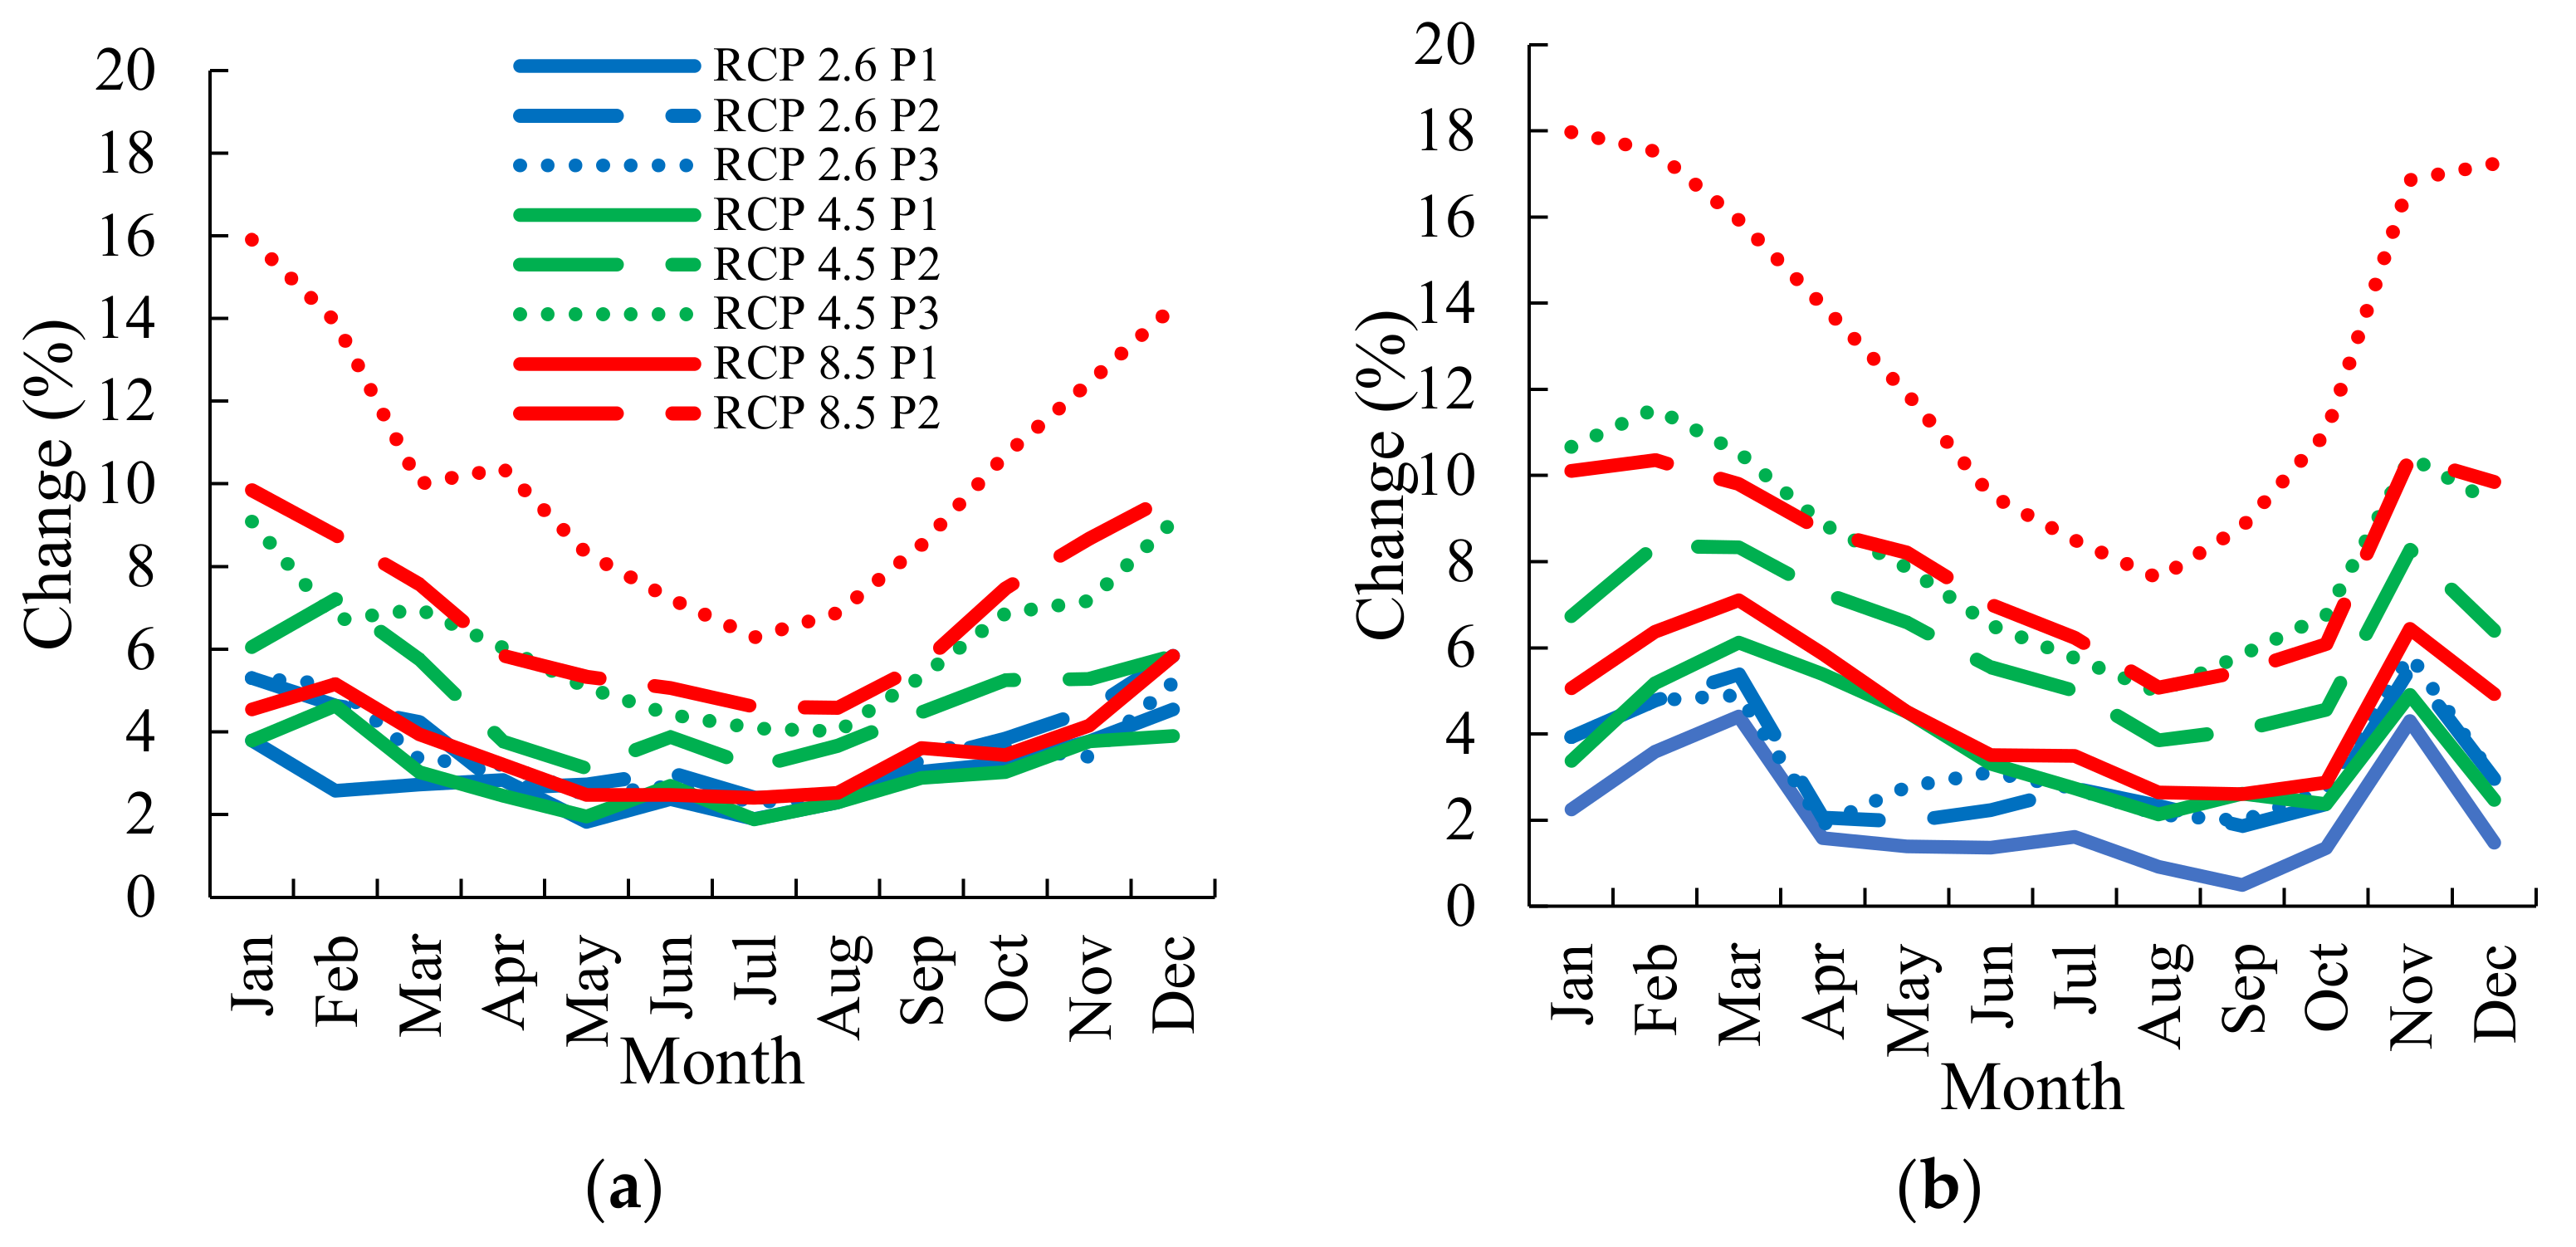
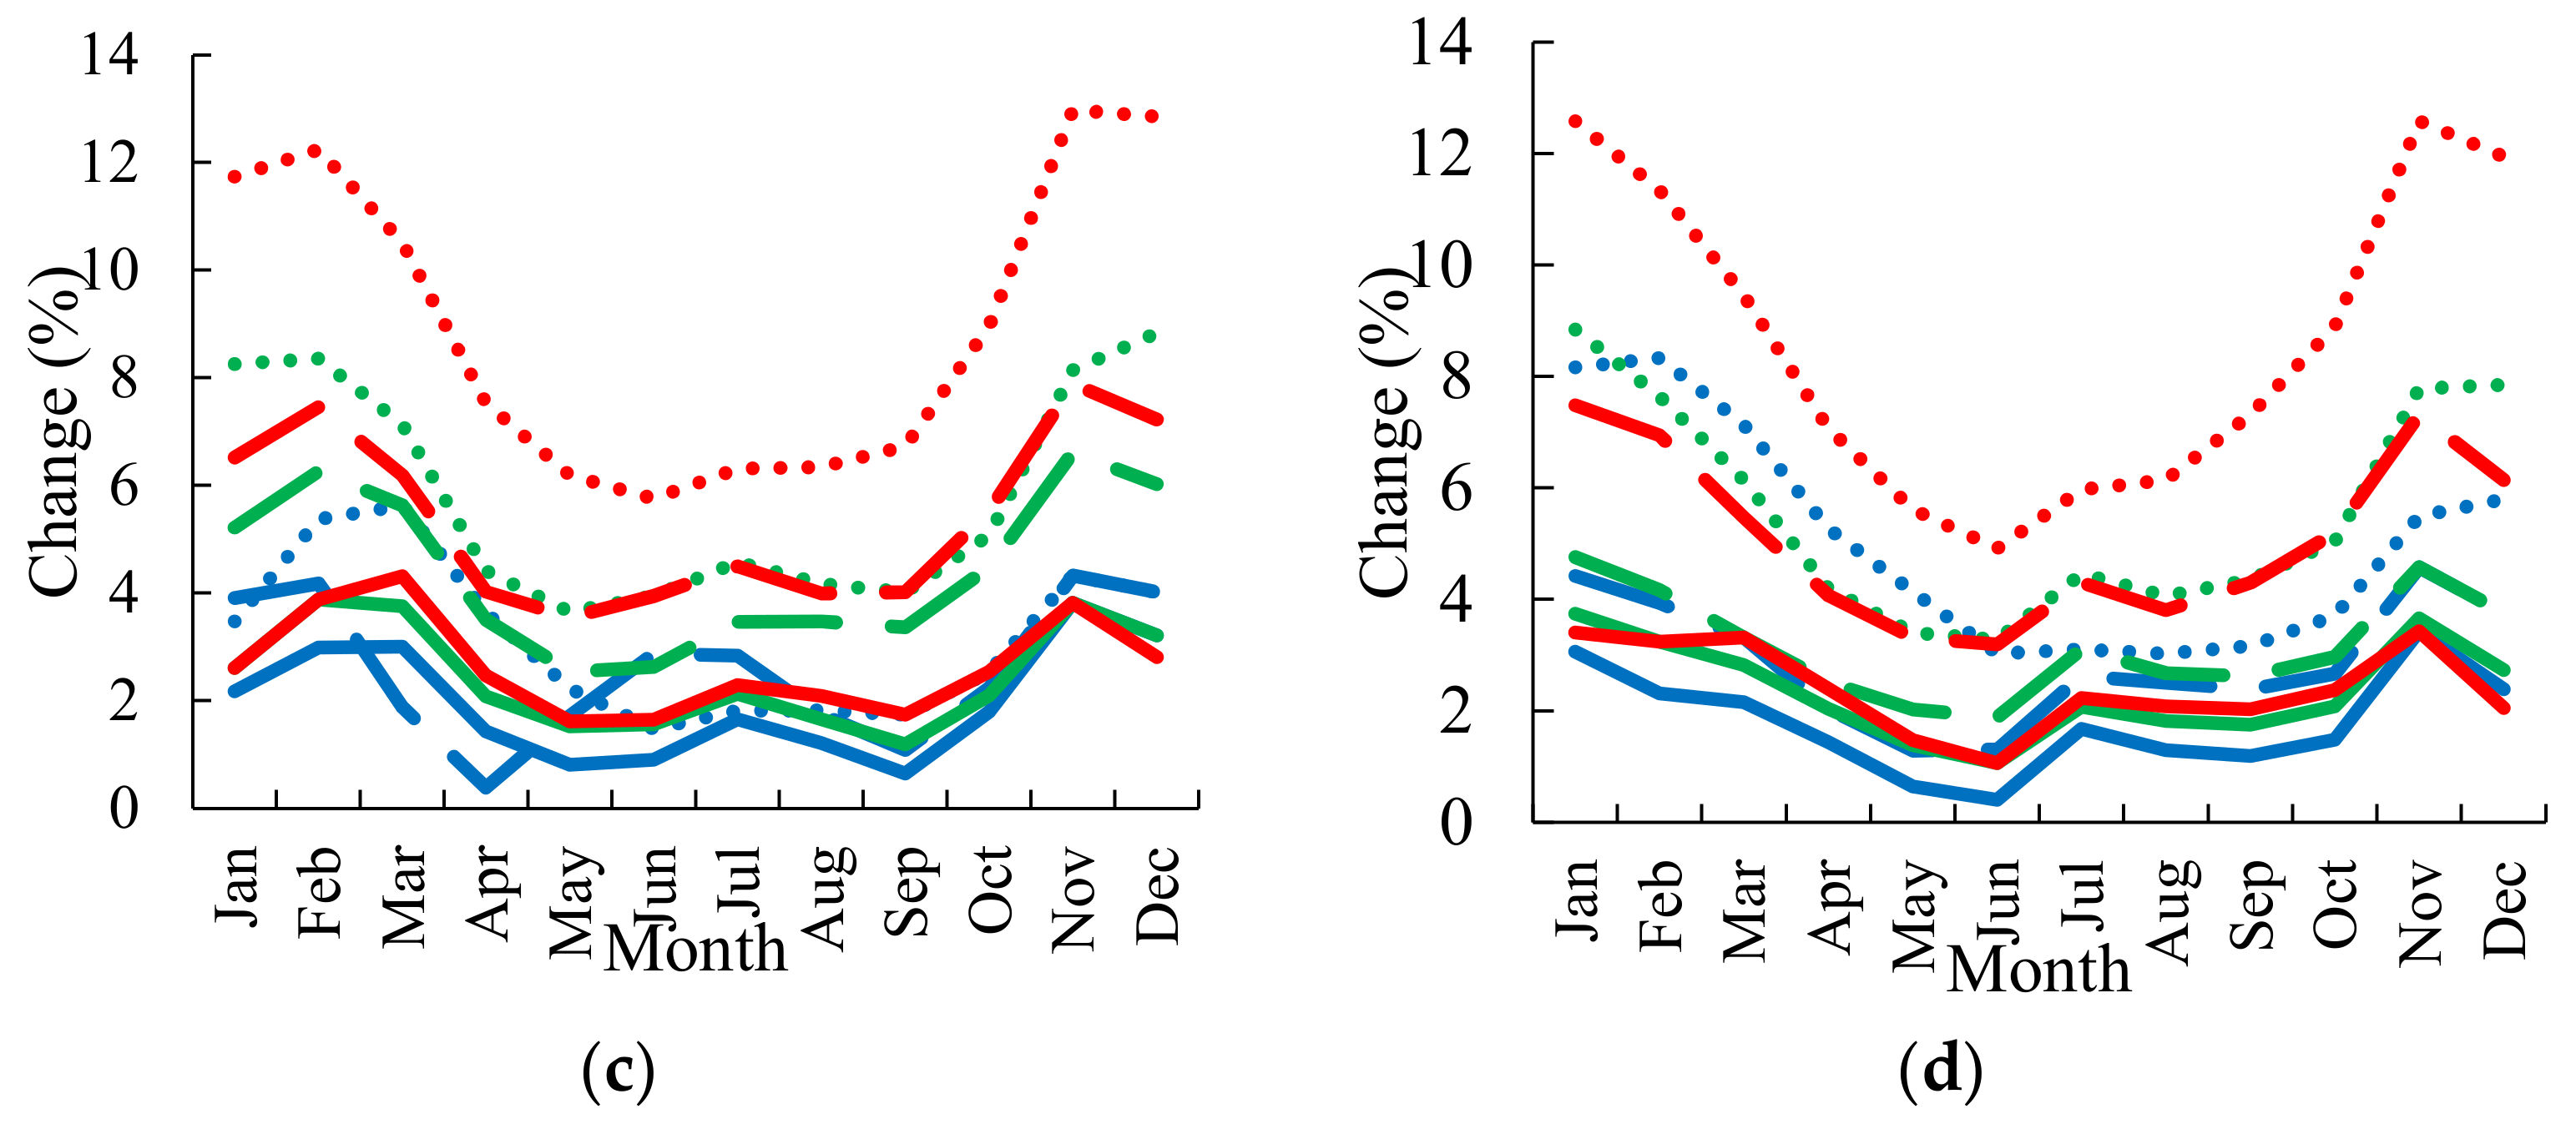
3.5. Future Trends in NIWR

Table 3 indicates that the NIWR for NJIP, which ranged from 33 (for barley) to 844 mm (for small grains). Under RCP 2.6, the spring small vegetations are the most sensitive crop to the climate change with increases in NIWR of 2.2%, 4.7%, and 4.7% for P1, P2, and P3, respectively. Barley is the most sensitive crop under RCP 4.5 (RCP 8.5) with increases of 3.5% (6.1), 12.1% (33.3), and 27.3% (42.4%) for P1, P2, and P3, respectively. On the other hand, small grains showed the lowest sensitivity under RCP 2.6 and P1 with an increase in NIWR of 0.1%. Autumn potato showed the lowest sensitivity under this scenario with a positive trend up to 1.4% for both P2 and P3. Under RCP 4.5, small grains showed lowest sensitivity to the climate change with an increase in NIWR of 0.1% for P1, spring maize of 1.3%, and autumn maize of 5.1% for P2 and P3, respectively. In the same context, for RCP 8.5, autumn maize tends to be a less sensitive crop to climate change with an increase in NIWR of 1.4%, 4.6%, and 8.8% for P1, P2, and P3, respectively.
For KRIP, the NIWR for RP ranged from 122 (for autumn small vegetations) to 1577 mm (for alfalfa) (Table 4). The table shows that barley (followed by autumn small vegetations) is the most sensitive crop to the climate change with an increase in NIWR of 11.7% (9.7%), 13.3% (11.5%), and 14.1% (11.7%) under RCP 2.6; 10.2% (10%), 17.2% (13.9%), and 28.9% (24.6%) under RCP 4.5; and 14.1% (12.3%), 26.6% (22.1%), and 44.5% (36.1%) under RCP 8.5 for P1, P2, and P3, respectively. In contrast, millet showed less sensitivity of NIWR to climate change with an increase by 1.8%, 3.4%, and 3.8% under RCP 2.6 for P1, P2, and P3, respectively; 2.4% and 4.1% under RCP 4.5 for P1 and P2, respectively; and 2.8% and 5.9% under RCP 8.5 for P1 and P2, respectively. Autumn maize showed less sensitivity of NIWR under RCP 4.5 and RCP 8.5 at P3 with an increase of 6% and 9.2%, respectively.
For UKIP, the NIWR in RP ranged from 175 mm for barley to 1808 mm for alfalfa (Table 5). Under RCP 2.6 for P1 and P2, the NIWR for barley is more sensitive to climate change than the other crops with an increase of 7.4% and 9.1%. NIWR for autumn small vegetations showed highest sensitivity under RCP 2.6 and P3 with an increase of 9.9%. Under RCP 4.5, NIWR for barley showed the highest sensitivity to climate change with an increase of 7.5%, 11.4%, and 18.9% for P1. P2, and P3, respectively. In the same context, under RCP 8.5, the NIWR for barley is expected to increase higher than other crops with 8%, 13.7%, and 25.1% for P1, P2, and P3, respectively.
On the other hand, soybean showed less sensitivity to climate change with an increase in NIWR by 1.2% (2.9%) and 2.2% (4.6%) under RCP 2.6 for P1 and P2, respectively (under RCP 4.5 for P2, and P3, respectively). The increase in NIWR for autumn potato and spring potato are less than other crops under RCP 2.6 for P3 and RCP 4.5 for P1 with an increase by 4.1% and 2.3%, respectively. Under RCP 8.5, soybean showed less sensitivity to climate change with an increase in NIWR by 1.6%, 4.1%, and 6.3% during P1, P2, and P3, respectively.
For DLIP, Table 6 shows that the NIWR during RP ranged from 267 mm (for autumn small vegetations) to 2171 mm (for alfalfa). Under all RCPs and projected periods, the NIWR of barley is the most sensitive crop to climate change, which showed the highest rate of increase in NIWR compared with other crops planted in this region.
Under RCP 2.6, the NIWR of barley is expected to increase by 3.5%, 5.6%, and 5.9% for P1, P2, and P3, respectively. Under RCP 4.5 (RCP 8.5), the NIWR tends to increase by up to 5.3% (5.3%), 5.9% (9.4%), 10.6% (14.7%) for P1, P2, and P3, respectively. On the other hand, under RCP 2.6 (RCP 4.5), cotton showed less sensitivity to climate change with increases in NIWR of 0.7% (1.5%), 1.7% (2.3%), and 1.9% (4.5%) for P1, P2, and P3, respectively. Results showed that tomato was a less sensitive crop under RCP 8.5 with increases by 1.8%, 3.8%, and 6.1% for P1, P2, and P3, respectively.

3.6. Trend in Irrigation Water Demand

For NJIP, Figure 9a shows that the project depends on rainfed RP with no need for irrigation during January, February, and December; this condition is expected to continue for January, but in February, the project demand would increase for up to 0.5 m3/s under RCP 4.5 for P2, and P3 and RCP 8.5 for P1 and P2. This demand would reach 1 m3/s under RCP 8.5 for P3. For December, the irrigation demand would be around 0.5 m3/s under RCP 2.6 and RCP 4.5 for P3 and under RCP 8.5 for P1 and P2. Moreover, the maximum demand was found in June with 41 m3/s in RP, which tends to increase at the end of P3 by 42.5, 43.5, and 44.9 m3/s under RCP 2.6, RCP 4.5, and RCP 8.5, respectively.
Results shown in Figure 9b indicate that the minimum irrigation demand was found in January, which is expected to increase from 3.4 (in RP) to 5.1, 6.8, and 10.2 m3/s at the end of P3 under RCP 2.6, RCP 4.5, and RCP 8.5, respectively. The maximum irrigation demand was found in June, which ranged between 150.2 in RP to 155.4, 160.5, and 165.6 m3/s in P3 under RCP 2.6. RCP 4.5, and RCP 8.5, respectively.
The minimum irrigation demand for UKIP (Figure 9c) occurred in January with 4.8 m3/s in RP; this demand tends to increase at the end of P3 by 5.4, 5.7, and 6 under RCP 2.6, RCP 4.5, and RCP 8.5, respectively. The maximum irrigation demand was found in June with a range from 32.1 m3/s in RP, which would reach 32.7, 33.3, and 33.9 m3/s at the end of 2080s under RCP 2.6, RCP 4.5, and RCP 8.5, respectively.
The minimum irrigation demand for DLIP (Figure 9d) was found in December with 12.1 m3/s in RP. This magnitude tends to increase by 15.5, 16.5, and 16.9 m3/s at the end of the 2080s under RCP 2.6, RCP 4.5, and RCP 8.5, respectively. The maximum irrigation demand for was found in April with 47.4 for RP, which is up to 45, 46, and 46.5 m3/s under RCP 2.6, RCP 4.5, and RCP 8.5, respectively. It can be noticed that the maximum irrigation demand for DLIP is exceptional compared to other projects; that is because of the high rate of ET0 and lower rate of Re in this month.

4. Discussion

The results shown in Figure 3a,d and Figure 4a,d indicated that the highest and lowest rate of increase are expected in winter and summer months, respectively. Due to climate change, the trend in temperature for (Middle East and North Africa) MENA for the period 1950–2003 showed that the variability of temperature in winter is much higher than summer [18]. Results of this study showed that minimum and maximum temperatures of Mosul and Kirkuk stations tend to increase more than Khalis and Kut stations. The warming is accelerated in northern regions in Iraq with an increase in temperature by 0.04–0.05 °C/year, while this trend was 0.03–0.04 °C/year in the southern regions in Iraq [50].
The results of this study indicated that precipitation tend to decrease in Mosul station (north of Iraq), and a small increase was found in the south station (Kut). The precipitation of Iraq during the 21st century tends to decrease in northern regions, and a small increase is expected in southern regions due to climate change [51,52]. A northward shifting of the inter-tropical convergence zone under climate change conditions that carry more moisture to the southern parts of Arabian Peninsula that would generate more fluctuation in precipitation patterns in this region [21]. The expected future change in precipitation patterns over Iraq required a parallel change in planning and management of water resources systems, especially in the northern regions where rainfall represents the main contribution of irrigation water.
For NJIP, under RCP 4.5 and P2, the increase in NIWR for spring maize, sunflower, cotton, spring potato, and small grains is less than the increase under RCP 2.6 and P2; that is because the reduction in Re under RCP 4.5 and P2 for spring months (March, April, and May) was found 0.5% which is less than the reduction under RCP 2.6 and P2 of 0.6% (Figure 8a). In spite of an increase in ET0 (consequently ETc) for KRIP under RCP 4.5 and P1 compared with RCP 2.6 and P1 (Figure 5b), the NIWR under RCP 4.5 and P1 for wheat, barley, spring maize, soybean, tomato, sorghum, and autumn potato is less than the NIWR of these crops under RCP 4.5 and P1, as shown in Table 4; that is because there is no reduction in annual Re under RCP 4.5 and P1 compared with a decline by 0.7% under RCP 2.6 and P1 (Figure 8b). For DLIP, the NIWR shown in Table 6 indicated to insignificant sensitivity to the increase in Re (Figure 8d), because the high rate of ET0 (consequently ETc) in DLIP is a crucial factor controlled by NIWR (Equation (4)) rather than Re. The ET0 and Re in RP were 2678 and 126.1 mm/year, respectively; under RCP 2.6 and P1 (the scenario of lowest increase in ET0 and an increase in Re by 2.9%), the ET0 would increase by 130.9 mm and Re would tend to increase rainfall by 3.7 mm. The study showed that ET0 is significantly controlled by NIWR in arid regions (southern region of Iraq), with even a small increase in Re in some scenarios because a high rate of ET0 depletes soil moisture faster than in the semi-arid region (northern region of Iraq).
The results of this study concerning the increase in NIWR, which is related to climate change and its sensitivity for different crops, are agreed with results found in the literature. Haskett et al. [14] found that plants tend to increase NIWR under climate change conditions to maintains the crop’s biomass. Lu et al. [53] concluded that additional water is required to reduce drying conditions and improve energy flux for irrigated plants. Hong et al. [54] compared NIWR for barley with other 29 crops. The results showed that NIWR for barley is less, and it is more sensitive to climate change than other crops. The NIWR of barley is sensitive to climate change with an increase in NIWR by 38–79% compared with an increase for maize by 0.2–1.4% under RCP 2.6 and RCP 8.5 [55].
The study found that the response of various crops in terms of NIWR to climate change is quite different. Therefore, the impact of climate change must be well-considered in the design, operation, planning, and management of water resources. It is worth mentioning that the studied irrigation projects and other similar irrigation projects should be reassessed considering the operation discharge, method of irrigation, and management of the irrigation system. The study focused on only the irrigation water needs for plant growing; other factors such crop yield were not considered. Furthermore, increased surface air temperature is expected to change the age of the crop and consequently the crop yield. Under arid and semi-arid climate conditions, which have limited water resources, it is preferred to apply water stress for crop growth to save more water and expand the irrigated area [56,57].
In this study, the water stress was not considered, which can be considered as a limitation for the research. Moreover, the results of this study are limited to arid and semi-arid climate zones, considered crops, and projected period to 2080. It is recommended for future research to consider water stress in the calculation of sensitivity NIWR for a crop under climate change condition. However, the application efficiency of irrigation water in limited water resources regions such as Iraq must be improved to achieve sustainable water resources and food security under climate change conditions and an expected increase in population growth.

5. Conclusions

In this paper, the spatiotemporal sensitivity of projected ET0, Re, NIWR, and irrigation demand were analyzed using CROPWAT 8 in four cultivated areas located in arid and semi-arid climate zones of Iraq for three future periods (P1, P2, and P3) based on three scenarios (RCP 2.6, RCP 4.5, and RCP 8.5) of global warming induced greenhouse emissions implemented by the LARS-WG model.
The results pointed out that the studied regions tend to become hotter and drier due to the increase in temperature and decline in precipitation, which refer to the increase in irrigation water. Moreover, they showed an accelerated increase in minimum (maximum) temperature in northern regions (Mosul and Kirkuk) with around 80% (35%) of increase compared with less increase in southern regions (Khalis and Kut) of around 40% (20%) under RCP 8.5 and P3. This implies more irrigation water is needed in regions currently irrigated by rainfall. The highest rate of increase in minimum and maximum temperatures were detected in winter months for all meteorological stations. Consequently, the rate of increase in ET0 showed the highest positive trend in northern regions compared with southern regions with a maximum increase in winter for all stations. A high fluctuation was found in Re along projected periods on southern stations with −50% to +57.1% (for Khalis station) and −46.2% to +49.5% (for Kut station) compared less fluctuation in northern regions with −13.1% to +6% (for Mosul station) and −11.9% to +9.2% (for Kirkuk station), which is because of the impact of extending the inter-tropical climate zone to the north.
Results revealed that the NIWR for barley and autumn small vegetations has the highest increase compared to other crops. Therefore, these crops are considered the most sensitive crops to climate change. The NIWR for small grains, potato, maize (in NJIP), millet (in KRIP), soybean (in UKIP), and cotton (in DLIP) disclosed the lowest response to the climate change. In spite of the small increase in magnitude of Re in southern stations for some scenarios and projected periods (such as RCP 8.5 and P1 for Khalis station and RCP 2.6 and P2 for Kut station), the NIWR stays in a positive trend due to the high rate of evapotranspiration in these regions. Therefore, in general, the irrigation demand has a positive trend in all scenarios and projected periods. Results showed minimum (maximum) irrigation demand for NJIP, KRIP, and UKIP in January (June), while for DLIP, it was found in December (April). These demands tend to increase within various magnitudes based on the contribution of Re in the irrigation process. The study emphasizes the significant importance of irrigation efficiency improvement for KRIP, UKIP, and DLIP in order to maintain a sustainable supply of irrigation water under the impact of climate change. The novel outcomes of this study can support and contribute to the development of a set of reasonable scenarios for a better allocation of irrigation water demand while maintaining a healthy agricultural sector in arid and semi-arid regions. This study also highlights the necessity and urgency of applying sustainability principles taking into consideration the spatiotemporal sensitivity of irrigation water requirements to climate change in arid and semi-arid regions towards sustainable management of water resources.

Author Contributions

Conceptualization, F.H.S., M.S.A.-K. and F.A.M.A.-F.; methodology, F.H.S., M.S.A.-K. and F.A.M.A.-F.; software, F.H.S.; validation, F.H.S.; formal analysis, F.H.S., M.S.A.-K. and F.A.M.A.-F.; investigation, F.H.S., M.S.A.-K. and F.A.M.A.-F.; resources, F.H.S., M.S.A.-K. and F.A.M.A.-F.; data curation, F.H.S.; writing—original draft preparation, F.H.S.; writing—review and editing, F.H.S., M.S.A.-K. and F.A.M.A.-F.; visualization, F.H.S., M.S.A.-K. and F.A.M.A.-F.; supervision, M.S.A.-K. and F.A.M.A.-F.; project administration, M.S.A.-K. All authors have read and agreed to the published version of the manuscript.

Funding

This research received no external funding.

Institutional Review Board Statement

Not applicable.

Informed Consent Statement

Not applicable.

Data Availability Statement

The data used in this study are confidential due to policy of organizations which provided these data.

Acknowledgments

This work is for the benefit of the National Center for Water Resources Management (NCWRM) of the Ministry of Water Resources (MoWR), Iraq under contract number 4–2021. The authors would like to thank the Iraqi Metrological Organization and Seismology (IMOS) for providing metrological data. The authors are also grateful to the technical and faculty staff of the Civil Engineering Department at the University of Technology, Iraq, for the valuable support and scientific assistance.

Conflicts of Interest

The authors declare no conflict of interest.

References

  1. Fischer, G.; Tubiello, F.N.; van Velthuizen, H.; Wiberg, D. Climate change impacts on irrigation water requirements: Effects of mitigation, 1990–2080. Technol. Forecast. Soc. Chang. 2007, 74, 1083–1107. [Google Scholar] [CrossRef] [Green Version]
  2. Schultz, B.; Tardieu, H.; Vidal, A. Role of water management for global food production and poverty alleviation. Irrig. Drain. 2009, 58, S3–S21. [Google Scholar] [CrossRef]
  3. FAO. The State of the World’s Land and Water Resources: Managing Systems at Risk; FAO by Earthscan: Abingdon, UK, 2011. [Google Scholar]
  4. Shalhevet, J.; Bielorai, H. Crop water requirement in relation to climate and soil. Soil Sci. 1978, 125, 240–247. [Google Scholar] [CrossRef]
  5. Kang, Y.; Khan, S.; Ma, X. Climate change impacts on crop yield, crop water productivity and food security—A review. Prog. Nat. Sci. 2009, 19, 1665–1674. [Google Scholar] [CrossRef]
  6. Konzmann, M.; Gerten, D.; Heinke, J. Impacts climatiques selon 19 MCG sur les besoins globaux en irrigation simulés par un modèle d’hydrologie et de végétation. Hydrol. Sci. J. 2013, 58, 88–105. [Google Scholar] [CrossRef]
  7. Zhu, X.; Zhao, A.; Li, Y.; Liu, X. Agricultural irrigation requirements under future climate scenarios in China. J. Arid Land 2014, 7, 224–237. [Google Scholar] [CrossRef] [Green Version]
  8. Islam, Z.; Gan, T.Y. Future Irrigation Demand of South Saskatchewan River Basin under the Combined Impacts of Climate Change and El Niño Southern Oscillation. Water Resour. Manag. 2015, 29, 2091–2105. [Google Scholar] [CrossRef]
  9. Gorguner, M.; Kavvas, M.L. Modeling impacts of future climate change on reservoir storages and irrigation water demands in a Mediterranean basin. Sci. Total Environ. 2020, 748, 141246. [Google Scholar] [CrossRef]
  10. Abtew, W.; Melesse, A. Evaporation and Evapotranspiration: Measurements and Estimations; Springer Science: Dordrecht, The Netherlands, 2013; pp. 1–206. ISBN 9789400747. [Google Scholar] [CrossRef]
  11. Holsten, A.; Vetter, T.; Vohland, K.; Krysanova, V. Impact of climate change on soil moisture dynamics in Brandenburg with a focus on nature conservation areas. Ecol. Model. 2009, 220, 2076–2087. [Google Scholar] [CrossRef]
  12. Leng, G.; Tang, Q.; Huang, M.; Leung, L.-Y.R. A comparative analysis of the impacts of climate change and irrigation on land surface and subsurface hydrology in the North China Plain. Reg. Environ. Chang. 2015, 15, 251–263. [Google Scholar] [CrossRef]
  13. Hauser, M.; Orth, R.; Seneviratne, S.I. Role of soil moisture versus recent climate change for the 2010 heat wave in western Russia. Geophys. Res. Lett. 2016, 43, 2819–2826. [Google Scholar] [CrossRef] [Green Version]
  14. Haskett, J.; Pachepsky, Y.; Acock, B. Effect of climate and atmospheric change on soybean water stress: A study of Iowa. Ecol. Model. 2000, 135, 265–277. [Google Scholar] [CrossRef]
  15. Wang, X.-J.; Zhang, J.-Y.; Ali, M.; Shahid, S.; He, R.-M.; Xia, X.; Jiang, Z. Impact of climate change on regional irrigation water demand in Baojixia irrigation district of China. Mitig. Adapt. Strat. Glob. Chang. 2014, 21, 233–247. [Google Scholar] [CrossRef]
  16. Guo, Y.; Shen, Y. Agricultural water supply/demand changes under projected future climate change in the arid region of northwestern China. J. Hydrol. 2016, 540, 257–273. [Google Scholar] [CrossRef]
  17. Misra, A.K. Climate change and challenges of water and food security. Int. J. Sustain. Built Environ. 2014, 3, 153–165. [Google Scholar] [CrossRef] [Green Version]
  18. Zhang, X.; Aguilar, E.; Sensoy, S.; Melkonyan, H.; Tagiyeva, U.; Ahmed, N.; Kutaladze, N.; Rahimzadeh, F.; Taghipour, A.; Hantosh, T.H.; et al. Trends in Middle East climate extreme indices from 1950 to 2003. J. Geophys. Res. Space Phys. 2005, 110, 1–12. [Google Scholar] [CrossRef]
  19. Ouarda, T.B.M.J.; Charron, C.; Kumar, K.N.; Phanikumar, D.V.; Molini, A.; Basha, G. Nonstationary warm spell frequency analysis integrating climate variability and change with application to the Middle East. Clim. Dyn. 2019, 53, 5329–5347. [Google Scholar] [CrossRef]
  20. Lelieveld, J.; Hadjinicolaou, P.; Kostopoulou, E.; Chenoweth, J.; El Maayar, M.; Giannakopoulos, C.; Hannides, C.; Lange, M.A.; Tanarhte, M.; Tyrlis, E.; et al. Climate change and impacts in the Eastern Mediterranean and the Middle East. Clim. Chang. 2012, 114, 667–687. [Google Scholar] [CrossRef] [Green Version]
  21. Waha, K.; Krummenauer, L.; Adams, S.; Aich, V.; Baarsch, F.; Coumou, D.; Fader, M.; Hoff, H.; Jobbins, G.; Marcus, R.; et al. Climate change impacts in the Middle East and Northern Africa (MENA) region and their implications for vulnerable population groups. Reg. Environ. Chang. 2017, 17, 1623–1638. [Google Scholar] [CrossRef]
  22. Sowers, J.; Vengosh, A.; Weinthal, E. Climate change, water resources, and the politics of adaptation in the Middle East and North Africa. Clim. Chang. 2010, 104, 599–627. [Google Scholar] [CrossRef]
  23. Awchi, T.A.; Kalyana, M.M. Meteorological drought analysis in northern Iraq using SPI and GIS. Sustain. Water Resour. Manag. 2017, 3, 451–463. [Google Scholar] [CrossRef]
  24. Salman, S.A.; Shahid, S.; Afan, H.A.; Shiru, M.S.; Al-Ansari, N.; Yaseen, Z.M. Changes in Climatic Water Availability and Crop Water Demand for Iraq Region. Sustainability 2020, 12, 3437. [Google Scholar] [CrossRef] [Green Version]
  25. Ewaid, S.H.; Abed, S.A.; Al-Ansari, N. Crop Water Requirements and Irrigation Schedules for Some Major Crops in Southern Iraq. Water 2019, 11, 756. [Google Scholar] [CrossRef] [Green Version]
  26. Abdulhadi, J.S.; Alwan, H.H. Evaluation of the scheduling of an existing drip irrigation network: Fadak Farm, Karbala, Iraq. IOP Conf. Ser. Mater. Sci. Eng. 2021, 1067, 012024. [Google Scholar] [CrossRef]
  27. Al-Shammari, M.H.J.; Algretawee, H.; Al-Aboodi, A.H. Using Eight Crops to Show the Correlation between Paucity Irrigation and Yield Reduction of Al-Hussainiyah Irrigation Project in Karbala, Iraq. J. Eng. 2020, 2020, 4672843. [Google Scholar] [CrossRef]
  28. Tsakmakis, I.D.; Zoidou, M.; Gikas, G.D.; Sylaios, G.K. Impact of Irrigation Technologies and Strategies on Cotton Water Footprint Using AquaCrop and CROPWAT Models. Environ. Process. 2018, 5, 181–199. [Google Scholar] [CrossRef]
  29. Abedinpour, M.; Sarangi, A.; Rajput, T.B.S.; Singh, M. Prediction of maize yield under future water availability scenarios using the AquaCrop model. J. Agric. Sci. 2014, 152, 558–574. [Google Scholar] [CrossRef]
  30. Moseki, O.; Murray-Hudson, M.; Kashe, K. Crop water and irrigation requirements of Jatropha curcas L. in semi-arid conditions of Botswana: Applying the CROPWAT model. Agric. Water Manag. 2019, 225, 105754. [Google Scholar] [CrossRef]
  31. Mondal, P.; Jain, M.; Robertson, A.W.; Galford, G.; Small, C.; DeFries, R.S. Winter crop sensitivity to inter-annual climate variability in central India. Clim. Chang. 2014, 126, 61–76. [Google Scholar] [CrossRef] [Green Version]
  32. Rasul, A.; Balzter, H.; Smith, C. Spatial variation of the daytime Surface Urban Cool Island during the dry season in Erbil, Iraqi Kurdistan, from Landsat 8. Urban Clim. 2015, 14, 176–186. [Google Scholar] [CrossRef] [Green Version]
  33. Al-Faraj, F.A.M.; Scholz, M.; Tigkas, D. Sensitivity of Surface Runoff to Drought and Climate Change: Application for Shared River Basins. Water 2014, 6, 3033–3048. [Google Scholar] [CrossRef]
  34. Food and Fgriculture Organization of the United Nations. Medium-Term Strategy for Fao Assistance to Iraq; FAO: Amman, Jordan, 2008. [Google Scholar]
  35. Jaradat, A.A. Agriculture in Iraq: Resources, Potentials, Constraints, Research Needs and Priorities. J. Food Agric. Environ. 2003, 1, 160–166. [Google Scholar]
  36. Japan International Cooperation Agency. Data Collection Survey on Water Resource Management and Agriculture Irrigation in the Republic of Iraq; NTC International Co., Ltd.: Tokyo, Japan, 2016; p. 125. [Google Scholar]
  37. Semenov, M.A.; Barrow, E.M. LARS-WG: A Stochastic Weather Generator for Use in Climate Impact Studies Version 3. User Manual; Rothamsted Research: Hertfordshire, UK, 2002; p. 27. [Google Scholar]
  38. Allen, R.G.; Pereira, L.S.; Raes, D.; Smith, M. FAO Irrigation and drainage paper No. 56. Irrig. Drain. 1998, 56, e156. [Google Scholar]
  39. Helms, D. Readings in the History of the Soil Conservation Service; US Department of Agriculture, Soil Conservation Service, Economics and Social Sciences Division: Washington, DC, USA, 1991; Volume 16, pp. 24–28. Available online: https://www.nrcs.usda.gov/Internet/FSE_DOCUMENTS/stelprdb1043484.pdf (accessed on 20 August 2021).
  40. Howell, T.A. Irrigation System Efficiencies; United States Department of Agriculture (USDA): Washington, DC, USA, 2002. Available online: https://www.ksre.k-state.edu/irrigate/oow/p02/Howell02.pdf (accessed on 2 October 2021).
  41. Rai, R.K.; Singh, V.P.; Upadhyay, A. Chapter 12—Irrigation Scheduling. In Planning and Evaluation of Irrigation Projects; Academic Press: Cambridge, MA, USA, 2017; pp. 385–412. Available online: http://www.sciencedirect.com/science/article/pii/B9780128117484000121 (accessed on 5 September 2021).
  42. Weiland, F.C.S.; Tisseuil, C.; Dürr, H.H.; Vrac, M.; van Beek, L.P.H. Selecting the optimal method to calculate daily global reference potential evaporation from CFSR reanalysis data for application in a hydrological model study. Hydrol. Earth Syst. Sci. 2012, 16, 983–1000. [Google Scholar] [CrossRef] [Green Version]
  43. Tolera, M.B.; Chung, I.M.; Chang, S.W. Evaluation of the Climate Forecast System Reanalysis Weather Data for Watershed Modeling in Upper Awash Basin, Ethiopia. Water 2018, 10, 725. [Google Scholar] [CrossRef] [Green Version]
  44. Batjes, N.H. A world dataset of derived soil properties by FAO?UNESCO soil unit for global modelling. Soil Use Manag. 1997, 13, 9–16. [Google Scholar] [CrossRef]
  45. Reynolds, C.A.; Jackson, T.J.; Rawls, W.J. Estimating soil water-holding capacities by linking the Food and Agriculture Organization Soil map of the world with global pedon databases and continuous pedotransfer functions. Water Resour. Res. 2000, 36, 3653–3662. [Google Scholar] [CrossRef]
  46. Wang, W.; Yu, Z.; Zhang, W.; Shao, Q.; Luo, Y.; Jiao, X.; Xu, J. Responses of rice yield, irrigation water requirement and water use efficiency to climate change in China: Historical simulation and future projections. Agric. Water Manag. 2014, 146, 249–261. [Google Scholar] [CrossRef]
  47. Zamani, R.; Akhond-Ali, A.-M.; Roozbahani, A.; Fattahi, R. Risk assessment of agricultural water requirement based on a multi-model ensemble framework, southwest of Iran. Theor. Appl. Clim. 2017, 129, 1109–1121. [Google Scholar] [CrossRef]
  48. Brouziyne, Y.; Abouabdillah, A.; Hirich, A.; Bouabid, R.; Zaaboul, R.; Benaabidate, L. Modeling sustainable adaptation strategies toward a climate-smart agriculture in a Mediterranean watershed under projected climate change scenarios. Agric. Syst. 2018, 162, 154–163. [Google Scholar] [CrossRef]
  49. UNESCO. Map of the World Distribution of Arid Regions: Explanatory Note; United Nations: Paris, France, 1979; Volume 7. [Google Scholar]
  50. Wasimi, S. Climate change in the Middle East and North Africa (MENA) region and implications for water resources project planning and management. Int. J. Clim. Chang. Strat. Manag. 2010, 2, 297–320. [Google Scholar] [CrossRef]
  51. Evans, J.P. 21st century climate change in the Middle East. Clim. Chang. 2008, 92, 417–432. [Google Scholar] [CrossRef]
  52. Chenoweth, J.; Hadjinicolaou, P.; Bruggeman, A.; Lelieveld, J.; Levin, Z.; Lange, M.A.; Xoplaki, E.; Hadjikakou, M. Impact of climate change on the water resources of the eastern Mediterranean and Middle East region: Modeled 21st century changes and implications. Water Resour. Res. 2011, 47, 1–18. [Google Scholar] [CrossRef]
  53. Lu, Y.; Jin, J.; Kueppers, L. Crop growth and irrigation interact to influence surface fluxes in a regional climate-cropland model (WRF3.3-CLM4crop). Clim. Dyn. 2015, 45, 3347–3363. [Google Scholar] [CrossRef] [Green Version]
  54. Hong, E.-M.; Nam, W.-H.; Choi, J.-Y.; Pachepsky, Y. Projected irrigation requirements for upland crops using soil moisture model under climate change in South Korea. Agric. Water Manag. 2016, 165, 163–180. [Google Scholar] [CrossRef] [Green Version]
  55. Mirgol, B.; Nazari, M.; Eteghadipour, M. Modelling Climate Change Impact on Irrigation Water Requirement and Yield of Winter Wheat (Triticum aestivum L.), Barley (Hordeum vulgare L.), and Fodder Maize (Zea mays L.) in the Semi-Arid Qazvin Plateau, Iran. Agriculture 2020, 10, 60. [Google Scholar] [CrossRef] [Green Version]
  56. Bouazzama, B.; Xanthoulis, D.; Bouaziz, A.; Ruelle, P.; Mailhol, J.C. Effect of water stress on growth, water consumption and yield of silage maize under flood irrigation in a semi-arid climate of Tadla (Morocco). Biotechnol. Agron. Soc. Environ. BASE 2012, 16, 468–477. [Google Scholar]
  57. Kirnak, H.; Dogan, E. Effect of seasonal water stress imposed on drip irrigated second crop watermelon grown in semi-arid climatic conditions. Irrig. Sci. 2009, 27, 155–164. [Google Scholar] [CrossRef]
Figure 1. Location map for NJIP, KRIP, UKIP, and DLIP.
Sustainability 13 13608 g001
Figure 2. Climate data in RP for (a) Mosul station, (b) Kirkuk station, (c) Khalis station, and (d) Kut station. 1 referred to precipitation, 2 referred to minimum temperature, and 3 referred to maximum temperature.
Sustainability 13 13608 g002
Figure 3. Change rate of minimum temperature (a) Mosul station, (b) Kirkuk station, (c) Khalis station, and (d) Kut station.
Sustainability 13 13608 g003
Figure 4. Change rate of maximum temperature: (a) Mosul station, (b) Kirkuk station, (c) Khalis station, and (d) Kut station.
Sustainability 13 13608 g004
Figure 5. Change rate of projected monthly ET0: (a) Mosul station, (b) Kirkuk station, (c) Khalis station. and (d) Kut station.
Sustainability 13 13608 g005aSustainability 13 13608 g005b
Figure 6. Projected annual ET0 trend: (a) Mosul station, (b) Kirkuk station, (c) Khalis station, and (d) Kut station.
Sustainability 13 13608 g006
Figure 7. Future trend in precipitation: (a) Mosul station, (b) Kirkuk station, (c) Khalis station, and (d) Kut station.
Sustainability 13 13608 g007aSustainability 13 13608 g007b
Figure 8. Change rate of Re: (a) Mosul station, (b) Kirkuk station, (c) Khalis station, and (d) Kut station.
Sustainability 13 13608 g008
Figure 9. Trend in irrigation demand (Irri. demand); (a) NJIP, (b) KRIP, (c) UKIP, and (d) DLIP.
Sustainability 13 13608 g009
Table 1. Validation of the LARS-WG.
Climate VariableMosulKirkukKhalisKut
Minimum temperature0.99 1 (0.96) 20.99 (0.99)0.99 (0.99)0.99 (0.99)
Maximum temperature0.99 (0.94)0.99 (0.99)0.99 (0.99)0.99 (0.99)
Precipitation 0.98 (0.95)0.94 (0.86)0.933 (0.93)0.935 (0.85)
1 indicated to R-squared; 2 indicated to Nash–Sutcliffe Efficiency.
Table 2. Future trend in AI for Mosul, Kirkuk, Khalis, and Kut stations.
ScenarioMosulKirkukKhalisKut
RP0.290.150.060.05
RCP 2.6 P10.280.140.060.05
RCP 2.6 P20.290.140.060.05
RCP 2.6 P30.280.140.060.04
RCP 4.5 P10.280.140.060.04
RCP 4.5 P20.280.140.060.04
RCP 4.5 P30.260.130.050.04
RCP 8.5 P10.280.140.060.04
RCP 8.5 P20.270.130.060.04
RCP 8.5 P30.250.120.050.04
UNESCO range0.2–0.50.03–0.20.03–0.20.03–0.2
UNESCO classificationSemi-aridAridAridArid
Table 3. Change rate of NIWR for NJIP.
CropP 1–H 2 DatesNIWR 3P1RCP 2.6
P2
P3P1RCP 4.5
P2
P3P1RCP 8.5
P2
P3
Wheat1/11–23/64060.5 103.03.41.55.29.43.28.916.7
Barley10/10–30/5330.63.03.43.512.127.36.133.342.4
S. maize 41/4–1/106250.22.42.50.51.35.31.45.410.1
Sunflower1/3–5/84370.23.03.20.51.67.11.86.613.9
Cotton1/4–14/910620.02.63.10.41.95.62.45.710.7
S. Potato 515/3–10/73750.33.53.21.12.78.82.77.716.8
S. S. V. 615/2–20/51292.24.74.70.24.715.53.910.926.9
Soybean1/5–7/94420.22.72.90.92.75.41.85.79.5
Small grains15/3–29/78440.12.52.80.11.55.32.05.610.2
Millet1/7–15/103820.32.12.40.82.36.01.05.09.4
Tomato15/3–10/77160.12.52.90.32.75.62.25.711.0
Sorghum1/4–7/95360.22.82.60.42.95.81.55.811.0
A. Maize 715/6–31/106800.31.81.80.41.95.11.44.68.8
A. Potato 812/8–29/113450.61.41.41.42.67.51.57.212.1
A. S. V. 915/10–29/7460.82.22.238.719.64.323.925.5
AlfalfaAll seasons8290.12.33.01.13.66.92.96.311.6
1 referred to planting date; 2 referred to harvesting date; 3 referred to net irrigation water requirement in (mm); 4 referred to spring maize; 5 referred to spring potato; 6 referred to spring small vegetations; 7 referred to autumn maize; 8 referred to autumn potato; 9 referred to autumn small vegetations; 10 indicated the rate of change in NIWR (%).
Table 4. Change rate of NIWR for KRIP.
CropP–H DatesNIWRP1RCP 2.6
P2
P3P1RCP 4.5
P2
P3P1RCP 8.5
P2
P3
Wheat1/11–29/56097.29.79.97.110.516.48.014.424.1
Barley15/10–6/512811.713.314.110.217.228.914.126.644.5
S. maize1/4–15/87224.76.36.94.67.59.85.79.115.1
Sunflower1/3–15/77574.66.26.84.67.79.95.79.215.1
Cotton1/4–26/812884.26.26.54.37.08.65.08.513.1
S. Potato15/2–21/67235.17.67.95.18.010.76.19.816.2
S. S. V.15/2–20/53856.59.29.56.59.6147.512.220.8
Soybean15/4–20/94845.47.47.75.28.111.26.29.916.9
Small grains1/3–1/79574.46.56.94.47.29.25.38.914.0
Millet15/6–1/106151.83.43.82.44.16.22.85.99.4
Tomato15/3–10/711224.05.45.83.96.68.34.88.112.6
Sorghum1/4–13/88113.95.75.93.76.58.44.98.112.8
A. Maize20/6–10/108982.13.13.92.44.26.03.15.99.2
A. Potato22/8–20/124563.75.05.43.56.110.34.89.415.4
A. S. V.15/10–29/71229.711.511.710.013.924.612.322.136.1
AlfalfaAll seasons15773.95.35.74.16.48.74.58.112.2
Table 5. Change rate of NIWR for UKIP.
CropP–H DatesNIWRP1RCP 2.6
P2
P3P1RCP 4.5
P2
P3P1RCP 8.5
P2
P3
Wheat1/11–29/512022.12.83.72.74.57.12.95.710.1
Barley15/10–6/51757.49.19.67.511.418.98.013.725.1
S. maize1/4–15/811431.52.42.91.53.35.02.04.56.6
Sunflower5/3–15/710091.42.42.51.63.55.52.14.67.1
Cotton1/4–31/818791.22.32.91.63.44.72.04.36.5
S. Potato15/2–21/69571.62.52.61.63.85.92.44.87.9
S. S. V.15/2–20/55572.02.93.32.74.57.03.15.69.7
Soybean15/4–25/98241.22.23.22.62.94.61.64.16.3
Small grains1/3–1/714831.52.62.81.53.44.92.14.56.5
Millet15/6–1/106521.22.93.11.53.85.12.34.67.4
Tomato15/3–10/714001.42.42.71.63.45.02.14.46.8
Sorghum1/4–17/810171.62.73.21.73.45.22.14.66.7
A. Maize20/6–25/1010631.22.83.11.63.64.72.24.46.7
A. Potato15/8–19/116542.03.54.12.34.76.62.95.89.8
A. S. V.15/10–29/72195.06.49.96.08.712.85.510.017.8
Alfalfaall seasons18081.72.63.12.64.06.02.55.08.5
Table 6. Change rate of NIWR for DLIP.
CropP–H DatesNIWRP1RCP 2.6
P2
P3P1RCP 4.5
P2
P3P1RCP 8.5
P2
P3
Wheat1/11–29/512022.12.83.72.74.57.12.95.710.1
Barley15/10–6/51757.49.19.67.511.418.98.013.725.1
S. maize1/4–15/811431.52.42.91.53.35.02.04.56.6
Sunflower5/3–15/710091.42.42.51.63.55.52.14.67.1
Cotton1/4–31/818791.22.32.91.63.44.72.04.36.5
S. Potato15/2–21/69571.62.52.61.63.85.92.44.87.9
S. S. V.15/2–20/55572.02.93.32.74.57.03.15.69.7
Soybean15/4–25/98241.22.23.22.62.94.61.64.16.3
Small grains1/3–1/714831.52.62.81.53.44.92.14.56.5
Millet15/6–1/106521.22.93.11.53.85.12.34.67.4
Tomato15/3–10/714001.42.42.71.63.45.02.14.46.8
Sorghum1/4–17/810171.62.73.21.73.45.22.14.66.7
A. Maize20/6–25/1010631.22.83.11.63.64.72.24.46.7
A. Potato15/8–19/116542.03.54.12.34.76.62.95.89.8
A. S. V.15/10–29/72195.06.49.96.08.712.85.510.017.8
Alfalfaall seasons18081.72.63.12.64.06.02.55.08.5
Publisher’s Note: MDPI stays neutral with regard to jurisdictional claims in published maps and institutional affiliations.

