1. Introduction
Designing the perfect home for its resident has been architects’ ambition for centuries, aesthetic perfection, functionality, which responds to the consumer’s market. Today, the residential sector is experiencing a paradigm shift due to the changes in needs of its inhabitants: the incorporation of technology in spaces [
1], remote working trends [
2,
3], workforce intercity and intercountry relocation and fluidity. Additionally, an unaffordable urban housing market [
4] that makes houses non-accessible for part of the population and an increase in loneliness [
5,
6,
7] are factors that are driving people towards diverse rental typologies with more shared spaces and innovative plug-and-play solutions, like coliving [
8]. This is a trend that has been accelerated by the COVID-19 pandemic [
9,
10].
Before COVID-19, Europeans spent around 55%–66% of their time at home—home indoors—[
11]; these ratios have increased during the pandemic, when we spent a considerably larger amount of time at home due to restrictions. In 2021, a new normality has brought new routines and evolving requirements for residential spaces.
COVID-19 has led to a redefinition of the way we live, how we use our residential spaces, our behavior and home responsibilities [
12]. Loneliness, once said to be the illness of the XXI century, has risen exponentially, partly due to the regulations imposed by governments in response to pandemic [
5,
6,
13]. According to the United Nations, community actions to reinforce social cohesion and reduce loneliness are needed to reduce the mental health consequences of the pandemic [
14].
Coliving is an emerging residential typology, a “top down, modern form of housing where residents share spaces, activities, values, and/or intentions” [
1,
8]. These shared living solutions have shown ways of fostering human relationships and close networks that improve daily lifestyle, without imposing sharing behavior or patterns, simply by enabling users to choose what spaces to occupy and the levels of camaraderie they want to engage with. Monitoring and evaluating the use of these spaces has become essential to improving the future of spaces and promoting sustainable housing, tracking the factors of environmental, social, and financial sustainability [
15,
16]. Post-COVID-19 housing resiliency is related to flexibility, adaptability, reducing risk infection and ensuring user well-being [
17,
18], and has turned even more human-centered.
HCD defines a design based on human needs and experience [
1]. HCD puts the end-users, humans, at the center of the design [
19]; psychology and technology are implicit in its initial planning [
1,
20,
21]—the human factor of buildings. Research that connected architectural design and behavioral patterns [
18] has grown exponentially thanks to smart technologies and sensors [
22].
The level of digitalization of buildings is also growing exponentially [
23]; as buildings become smarter and more connected, the Architects, Engineers and Constructors (AEC) industry must adapt [
1]. Smart buildings are living entities capable of adapting to the changing needs of the users and reporting to practitioners to improve the future design of spaces.
This research aimed to generate a methodology of spatial analysis using Post-Occupancy Evaluation (POE) of the spaces’ performance and user behavior patterns based on the available technology infrastructure.
There were two primary objectives: the first was to identify the data provided from existing data sources that will offer valuable information for HCD spaces, and the second was to generate data-driven Space Profiles (SP) based on the methodology generated that can help AEC experts improve the design of future coliving spaces based on data-driven techniques.
The innovation of the current research also relied on the methodology fully performed remotely due to COVID-19, in real time and relying on the existing IT infrastructure of Coliving without adding other sensors.
1.1. Coliving
The residential sector is transforming quickly, accelerated by the COVID-19 crisis. Factors such as densification of cities, population growth, affordability, housing supply, demand dichotomy, rising prices [
24] and lack of regulations [
25] have impacted house prices and facilitated the evolution of new housing typologies. Coliving offers a more flexible leasing structure and increased engagement with the household to form more meaningful connections with housemates and the general community—regardless of the duration of stay [
26].
Coliving operators, property managers and real estate investors have highlighted that their formula of success relies on providing the creation of fluid communities and neo-tribes [
27], which are related to a state of mind and a lifestyle more than a membership or lineage [
28,
29]. Coliving also provides a variety of shared spaces mutualized by the whole community otherwise unavailable and unaffordable in a traditional way of living. Characteristics that made them have grown exponentially across Europe and other areas (
Figure 1). For the new creative class, home means also an ideal place of work: it is mobile and social [
30] with the communal spaces being key for the users [
27]; additionally, the need for exterior and communal spaces, core spaces of coliving buildings, has also multiplied due to the COVID-19 crisis [
18,
31].
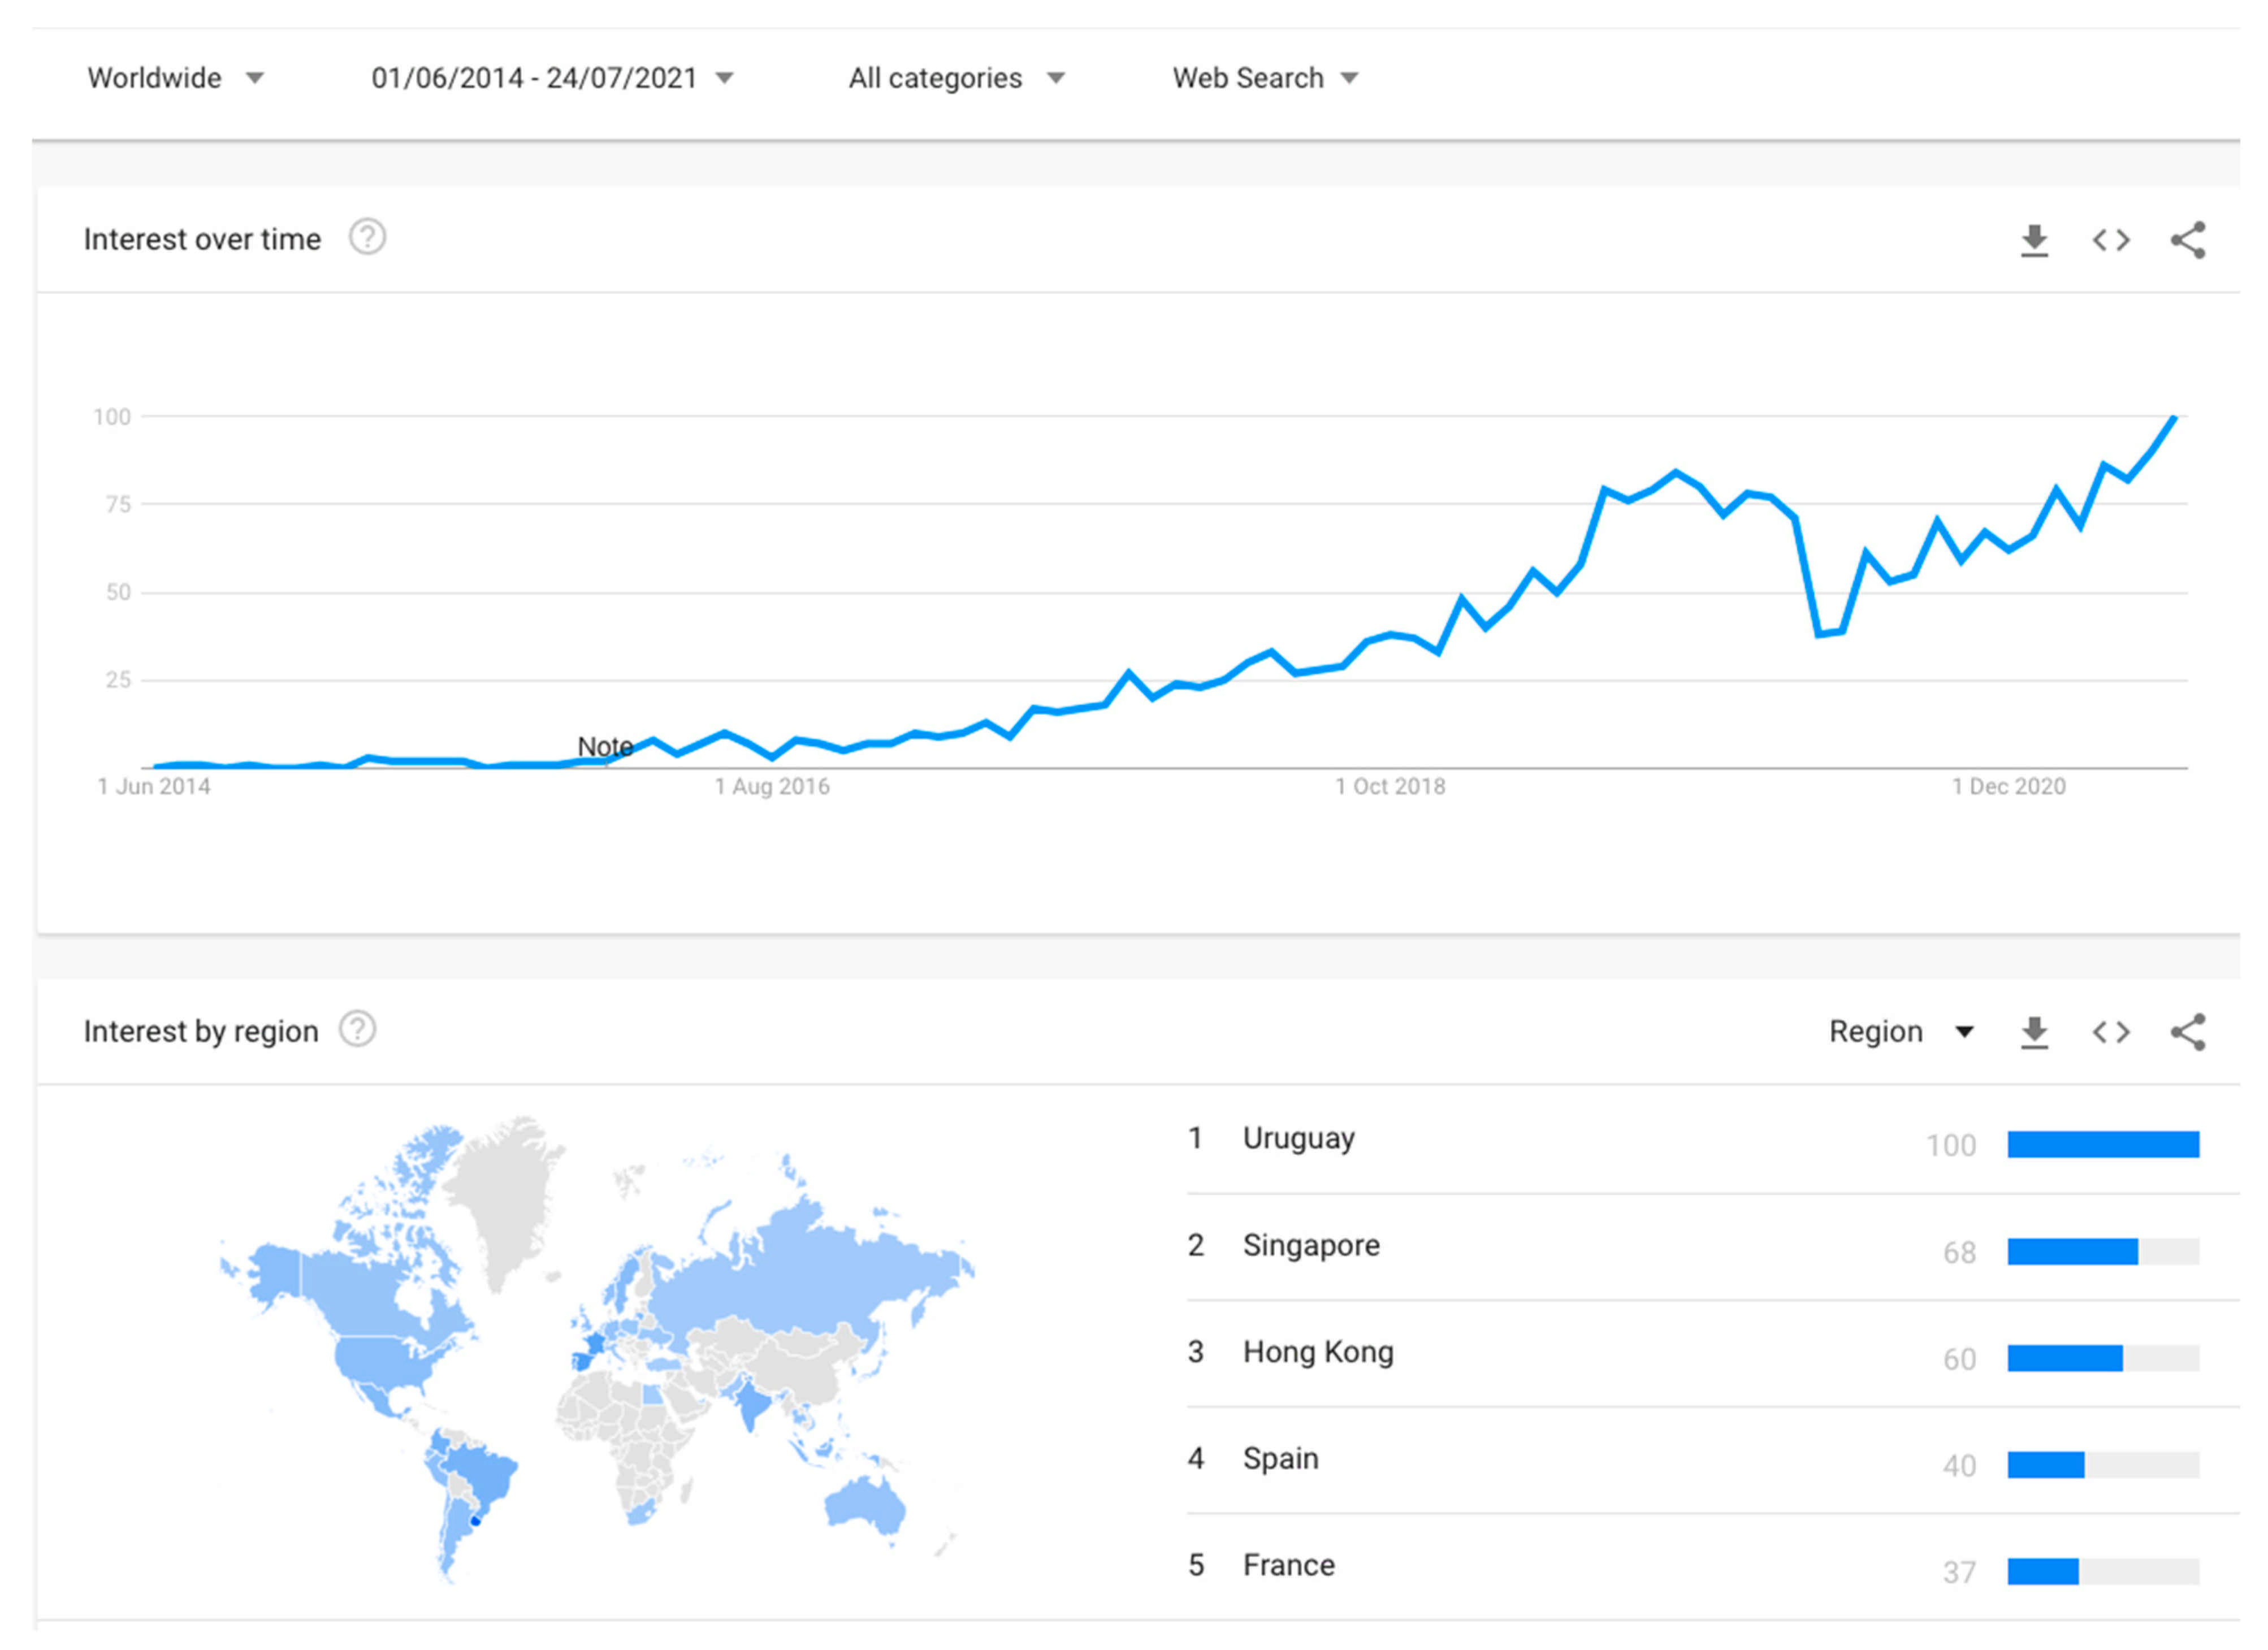
The rise in searches for the term ‘coliving’ in 2015 was likely due to an increase of these facilities in New York City and companies beginning to expand this typology outside of the tech world [
33]. Spain is now the country with the fourth highest interest globally, according to Google, and the first in Europe. The current research was performed at Urban Campus, a coliving operator in Spain and France with several assets being operated under coliving and coworking and with a strong strategy for monitoring and optimizing buildings performance and user wellbeing.
One of the spatial strategies to encourage community is incrementing the shared amenities [
34,
35] and sharing these spaces with the whole community. The incidence of these spaces outside of the private room has promoted informal interactions, which in turn enhanced familiarity among residents and community [
36].
Nevertheless, little architectural or interior design research is available to describe this emerging typology and scattered best-practices or guiding principles are appearing to aid designers in making informed decisions when designing or evaluating coliving spaces [
8]. There has also been limited exploration into the houses to understand HCD approaches and climate adaptability of smart housing to meet user needs [
1,
37].
1.2. State of the Art Data-Driven Design through Post-Occupancy Evaluation (POE)
Using data for building design is not new ([
38,
39,
40]). But incorporating qualitative and quantitative data in decision-making processes is a practice that has been recently incorporated into spatial design [
41,
42]. Post-Occupancy Evaluation (POE) is the methodology of obtaining feedback on the use of spaces in a building and its performance for the users [
43,
44].
Within this changing paradigm, a need for more advanced, digital methods to understand the use of space and improve its design has risen [
45,
46]; POE and other methods [
47,
48] are becoming essential to analyzing the current use of spaces, predict performance and ensure housing resiliency [
17,
49,
50,
51,
52,
53]. Recent studies have shown how POE could improve electricity performance predicted during the design of non-residential spaces [
54]; a similar method has been applied for coliving residential spaces.
The POE is generally carried out a minimum of one year after the building is fully occupied [
55] and includes several methodologies to perform holistic research of the building. The research studied a method of integrating technology and Internet of Things (IOT) data analysis as an added real-time assessment of end-users’ electricity consumption patterns [
56]. Remote comfort and well-being tracking systems and sensors enabled to collect and analyze data with little human intervention [
28,
57].
Innovation and new technologies facilitate a faster and more accurate understanding of the occupancy of and interaction with space [
58,
59]. IOT integrated entities of the physical world by making them addressable through the Internet and making the Internet accessible through physical objects. [
60]. New ways of monitoring and data analysis have already provided real-time feedback as shown in different spaces like workplaces [
46,
61,
62]. This paper reflects how residential spaces like coliving can undergo a similar transformation by incorporating in-built technology infrastructure POE data analysis to assess use of space.
Within this changing paradigm, a need for more advanced digital methods to understand the use of space and improve its design arose [
45,
46]; POE and other methods [
47,
48] are becoming essential to analyze the current use of spaces, predict performance and ensure housing resiliency [
17,
49,
50,
51,
52,
53]. Recent studies have shown how POE could improve electricity performance predicted during the design of non-residential spaces [
54]; a similar method has been applied for coliving residential spaces.
Innovation and new technologies facilitate a faster and more accurate understanding of occupancy of and the interaction with space [
58,
59]. IOT integrated entities of the physical world by making them addressable through the Internet and making the Internet accessible through physical objects. [
60]. New ways of monitoring and data analysis have already provided real-time feedback, as shown in different spaces like workplaces [
46,
61]. This paper examined how residential spaces are undergoing a similar transformation, with a special focus on managed solutions like coliving.
2. Materials and Methods
The study relied on available digital infrastructure designed for Urban Campus Colivings (smart locks, Wi-Fi, and electricity consumption devices) as data sources for operating coliving, defined as Post-Occupancy Evaluation (POE). The coliving spatial assessment evaluation framework in
Table 1 sets a basis to understanding behavioral performance of spaces and to making informed decisions towards future sustainable and Human-Centered Design (HCD) of spaces. Behavioral patterns in space, experience, environmental consumption, and well-being were assessed.
In
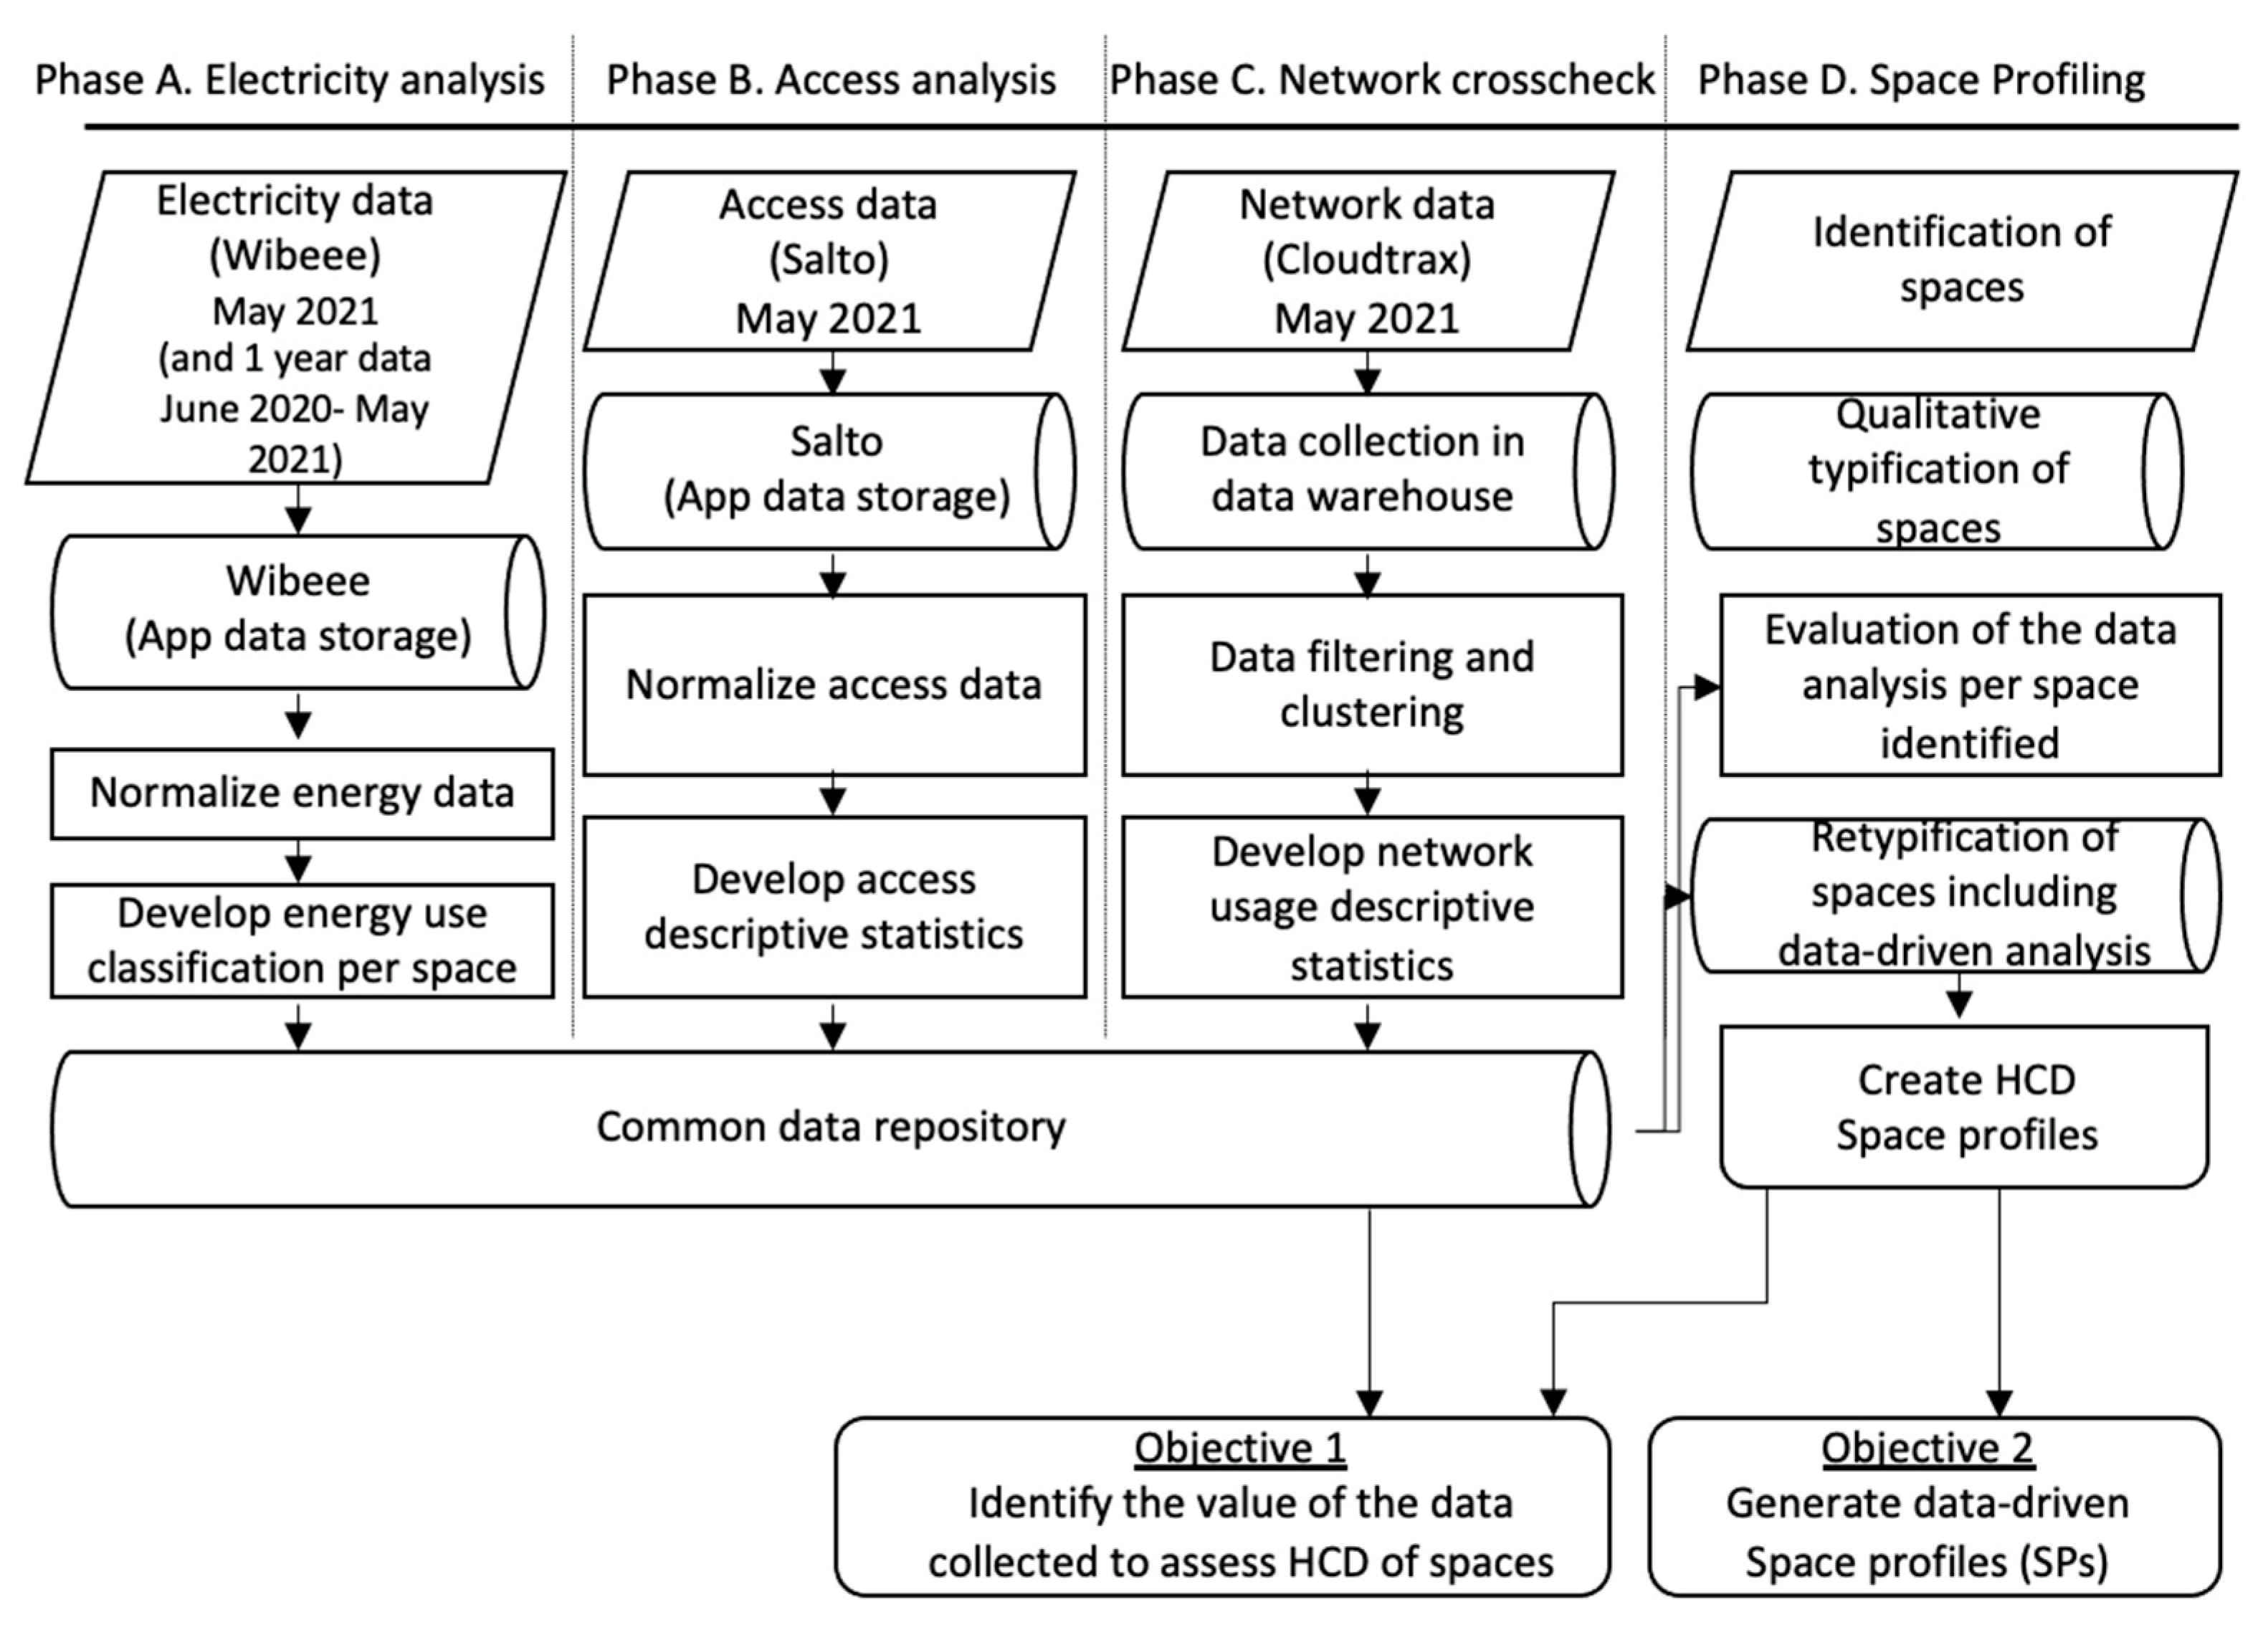
Figure 2, the 4 methodological stages were mapped based on the available IT infrastructure piloted in the study: (A) Electricity analysis, (B) Access analysis, (C) Network crosscheck, (D) Spaces profiling study. The mixing methods theory [
76,
77] was used to combine quantitative and qualitative inputs and was implemented during phase (D) to generate the SPs.
The data sample of the coliving spaces were collected during a 31-day period (1 May 2021–1 June 2021). Additional data were collected retroactively for the Electricity analysis for 1 year (1 June 2020–1 June 2021) in order to demonstrate the applicability of the methodology to explore and compare the use of spaces across different times and seasons. The data were extracted, cleaned, processed, and represented the data through PowerBI—a business analytics platform from Microsoft enabling user friendly visualization and interactions for behavioral analysis and sustainability decision making.
The subject group of study included the 72 residents of the coliving space with an age range of 25–40 years and coming from multiple nationalities including local Spanish colivers. For the current study, full authorization was granted by the residents and the data were treated in full compliance with the EU General Data Protection Regulation, (GDPR), being aggregated and anonymized accordingly to regulations. The analysis was performed in accordance with the principles outlined in the Declaration of Helsinki.
2.1. Spatial Definition
The current study analyzed a 3000 m
2 coliving residence in Madrid. The building has been operated as a Coliving by Urban Campus since 2019; the methodology that enabled the carrying out of remote research developed was fully compliant with regulations and COVID-19 restrictions in place in May 2021. Four different typologies of spaces in the Coliving were categorized into
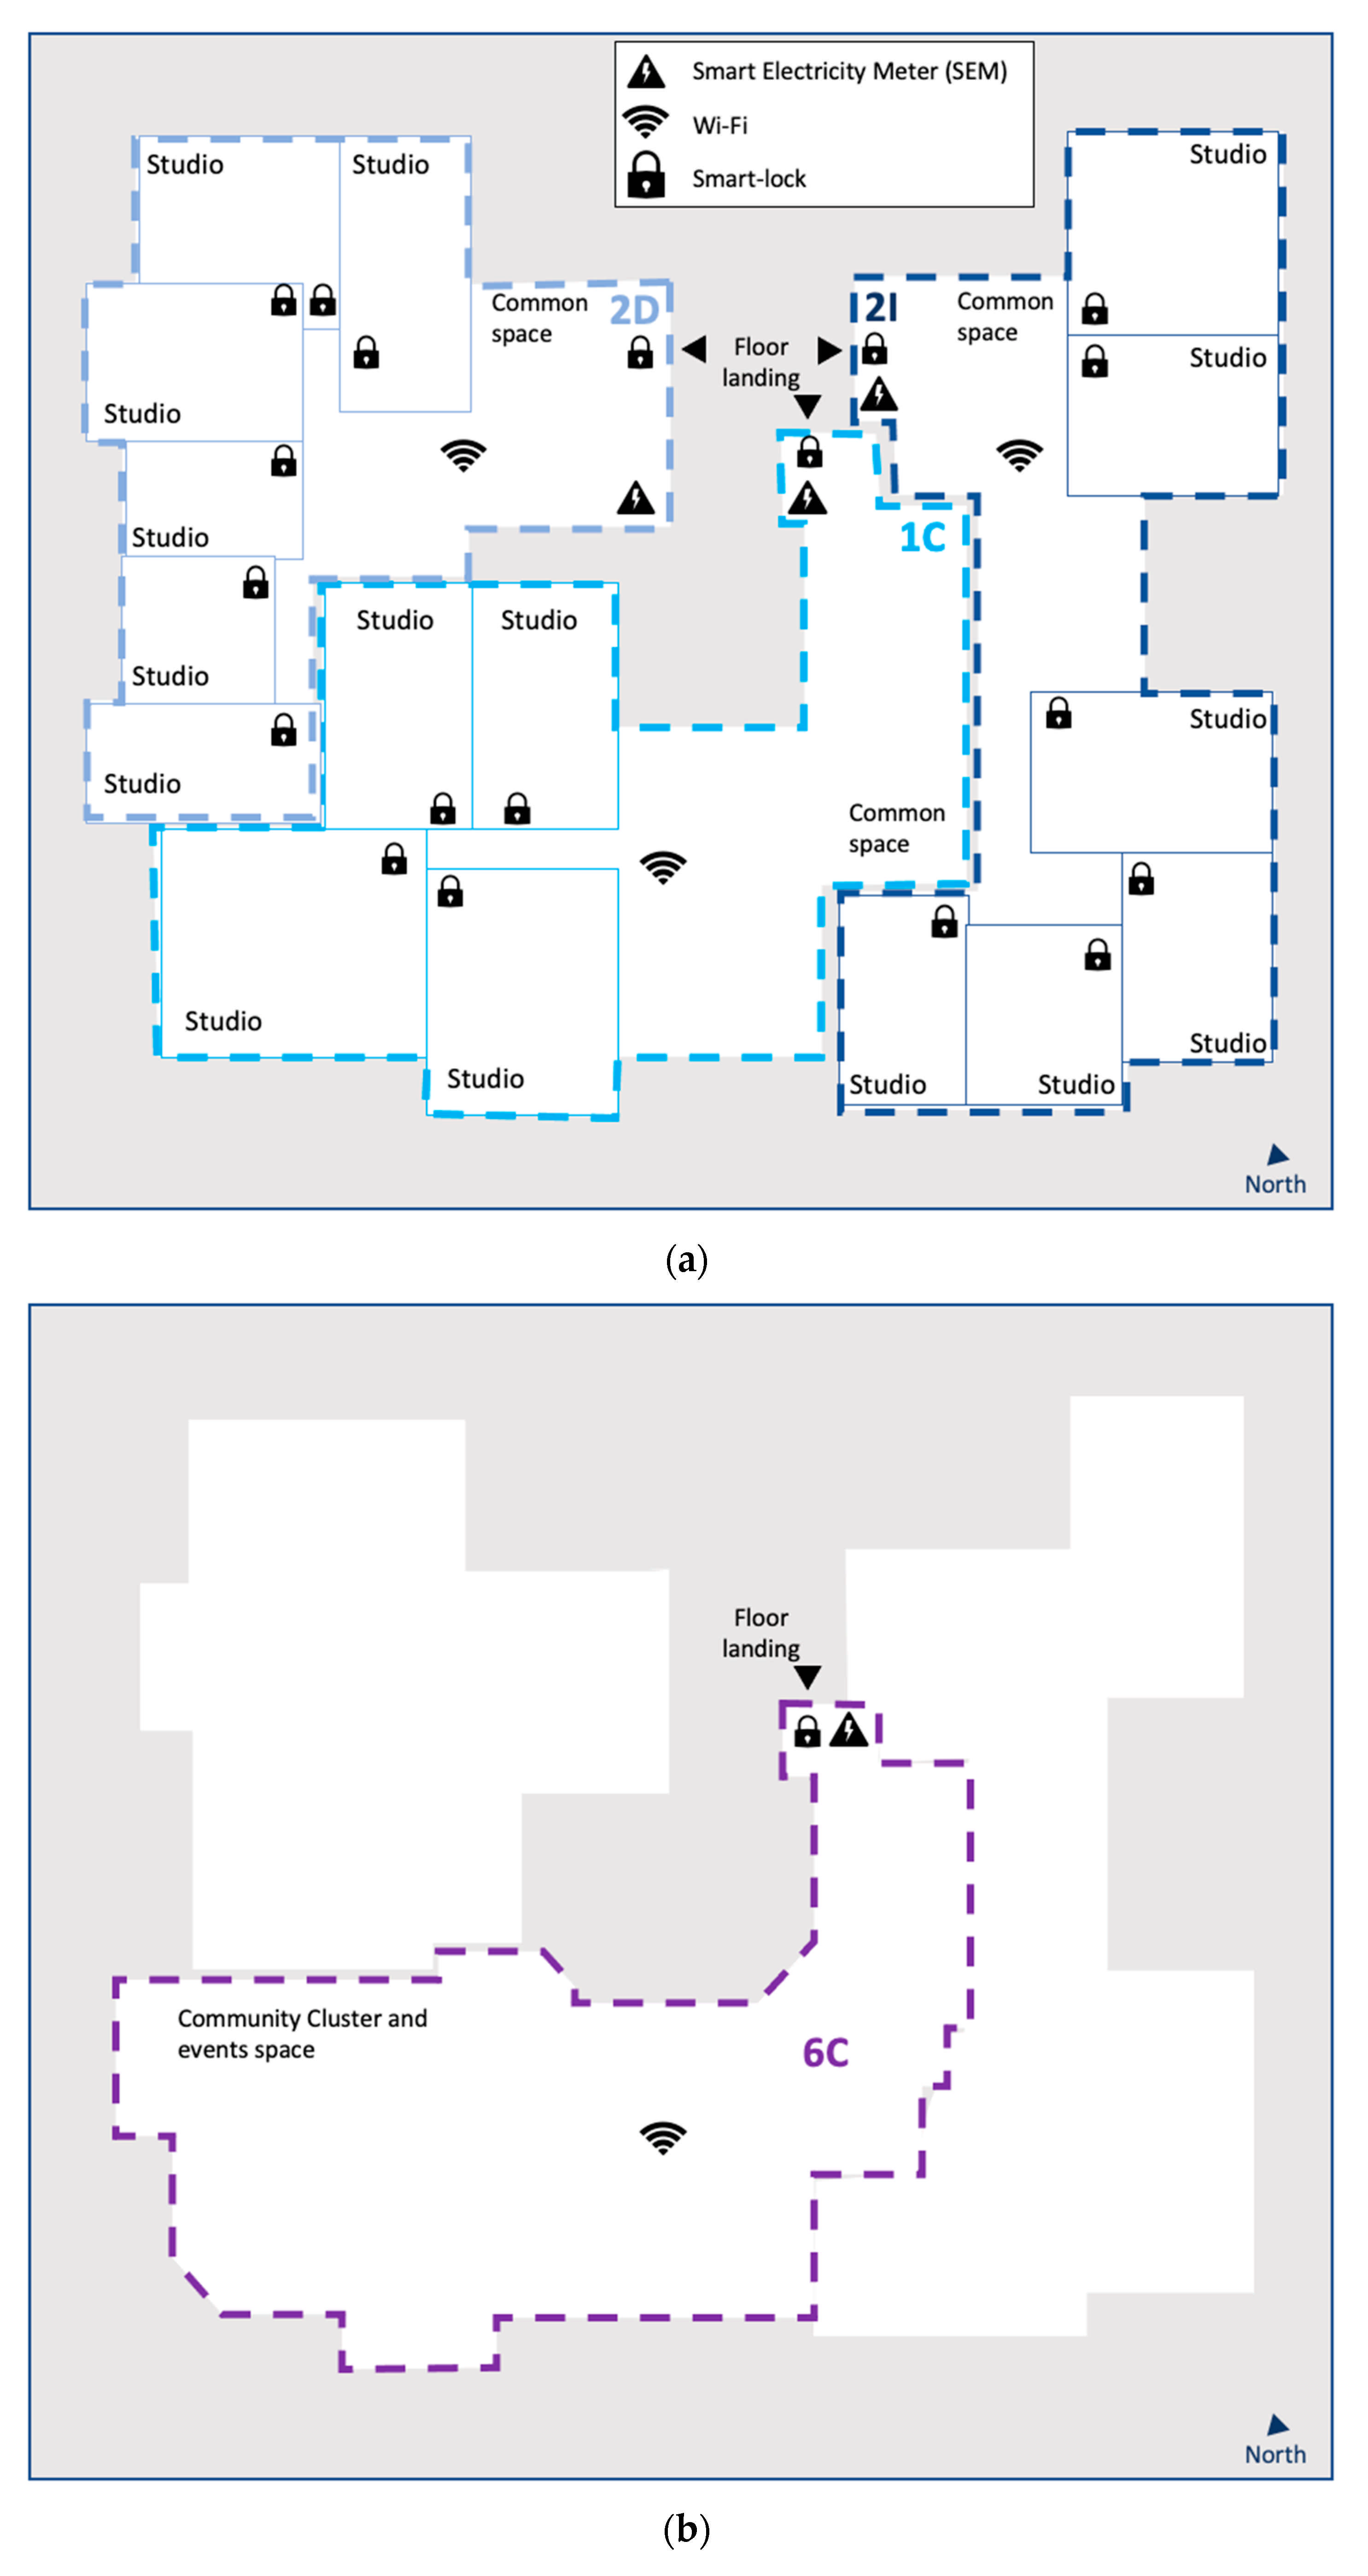
Table 2. There were three cluster spaces; a cluster is a shared flat consisting of individual or double studios with a private bathroom and a shared space with a shared kitchen and living room. Both the entrance door to the cluster and the door that separates the common cluster spaces from the private studio had a digital smart lock that managed entry permissions (see
Figure 3). The shared kitchens and living rooms of all the clusters were open to the entire community from 07:00–23:59 and remain accessible only to cluster inhabitants during the night.
2.2. Phase A: Electricity Analysis
Smart Electricity Meters (SEM), clamp-connected devices that measure the electricity consumption per apartment (cluster) and smartly classify the data of different appliances [
56], were an essential adoption to guiding the transition towards sustainable use of resources such as water, electricity, and gas in residential spaces [
78]. The innovation of the current research is that the information was collected to understand behavioral patterns and use of space, not only consumption dynamics. The data were then stored in a cloud platform designed for the visualization of the electricity consumption in almost real time. For the study, the data were extracted from the platforms and filtered by days and clusters selected to the study (I, C, D), community spaces and gym (0I).
Afterwards, the SEM were trained by the Urban Campus and IT teams to identify the different domestic appliances according to the SEM patterns for identifying appliances (Air-Conditioning (AC), home appliances, lights and plugs). The isolated use of each device and electricity consumption was collected in real time and transmitted through the Application Programming Interface (API) during the night.
2.3. Phase B: Access Analysis
The smart locks (from Salto) were connected to the digital network through Wi-Fi enabling remote opening of doors and transferring information of door status (open vs. closed) and entry times in real time and retroactively from the Salto platform. The research analyzed the patterns of aggregated users’ digital trails and visiting of spaces in the building. The various doors—building main entrance, access to cluster doors and common spaces doors and individual doors to private studios—were configured with different accessibility permissions depending on the use of space and privacy. Central apartments were accessible to all residents (ex: tenant living in 1I has access to 1C, 2C, 3C, …), while side apartments were accessible to all residents living on a floor (tenant living in 1C has access to 1I, 1C and 1D but not 2I or 2D).
Table 3 shows the 3 types of locks and the credentials according to the space works as follows.
The data were downloaded from the Salto platform. The data were presented in charts that assess the use of space routines; the access analysis method enabled understanding of the use and entries but not occupancy as it does not provide information on different members accessing a space at the same time or exit time.
2.4. Phase C: Network Cross-Check
The Wi-Fi network connection structure was built using Cloudtrax software. There was one network, “Service Set Identifier” (SSID) with 1 or 2 Access Point (AP) per cluster space and per Community space—a total of 20 SSIDs in the building. Data from 5 SSIDs were analyzed (two Lateral Cluster spaces 2I and 2D, one Central Cluster space 1C and 2 Community Spaces: 1 Community Coworking (6C) and Gym (0I). The location of the APs in this study relied on original infrastructure and networks available and the places located.
The Wi-Fi network worked as a digital trail of any device that is present in the spaces and is identified by the APs without the need to be connected to the Wi-Fi. The current method implied identification of the members of the coliving space and association to the digital devices they own; each coliver has on average 2–3 devices and is then anonymized and aggregated according to GDPR laws. Analysis of any device that was not assigned to a person and mobile in space was eliminated, keeping laptops, tablets, smartphones, and smartwatches. Other devices like Chromecast and SEM were dismissed. The data collected enabled to identify patterns of use based on traffic data, number of devices connected and routines that served also as a cross-check for Phase A and Phase B.
2.5. Phase D: Space Profiling (SP)
Once the Electricity, Access, and Network analysis were concluded, the Space Profiles (SPs) were developed. An SP is a dynamic flashcard that integrates the description of spaces together with inputs from real time use of this space and users’ behavior obtained through users’ digital trails collected from the existing built-in IT infrastructure. The process relied on the mixing methods theory extracted from Phases A, B and C learning to conform the assessment. For the current paper, 4 SPs were developed: (A) Cluster Central (B) Cluster Lateral and (C) Community Space profiles. Assigning features and characteristics to the 3 profiles developed based on the previous phases enabled to understand how Coliving spaces worked. The potential of the SP was to understand the identity of spaces as an active space, that responds in different ways depending the user’s needs and its specific design features. This methodology was tailored to the different spaces and local needs to be able to reproduce the best experience for colivers, for example reducing electricity consumption and therefore optimizing cost [
79].
According to Williams [
80], interaction between physical, personal and social factors has an impact on behavior, that can be used to evaluate the physical profile of shared housing facilities. The characteristics he identified include size, density, proximity, surveillance, ratio of private to communal spaces and affordances within each, and non-spatial factors such as formal and informal social factors.
The SPs were the HCD interpretation of space, adding the analyzed digital trail features to the traditional spatial space definition and working as an interface between users and spaces. For example, it is broadly understood that modifying the size of the bed or the capacity of a wardrobe changes the experience of a space; likewise, interfering with the digital network, access permissions or AC parameters also alters the experience and behavior of a coliver. Residential spaces have become something other than a bed and a kitchen; the digital dimension and how it shapes users’ performance must be considered when defining spaces taxonomy.
Following Williams [
80], the interaction between users and spaces
Table 1 is needed to evaluate different typologies of spaces (
Table 4) in order to have a complete assessment of experience in the space and be able to design future spaces. The SPs represented the standards to replicate conditions for future spaces; they are also an example of interaction with real studies to test how modifications or interfering with these spaces modifies behavior and likewise interfering with behavior affects the way we use spaces. Studying these conditions helped to better understand the community. The definition of SPs for coliving and studying evolutions was essential to improving sustainable design in the present and future of coliving spaces.
3. Results
3.1. Phase A: Electricity Analysis
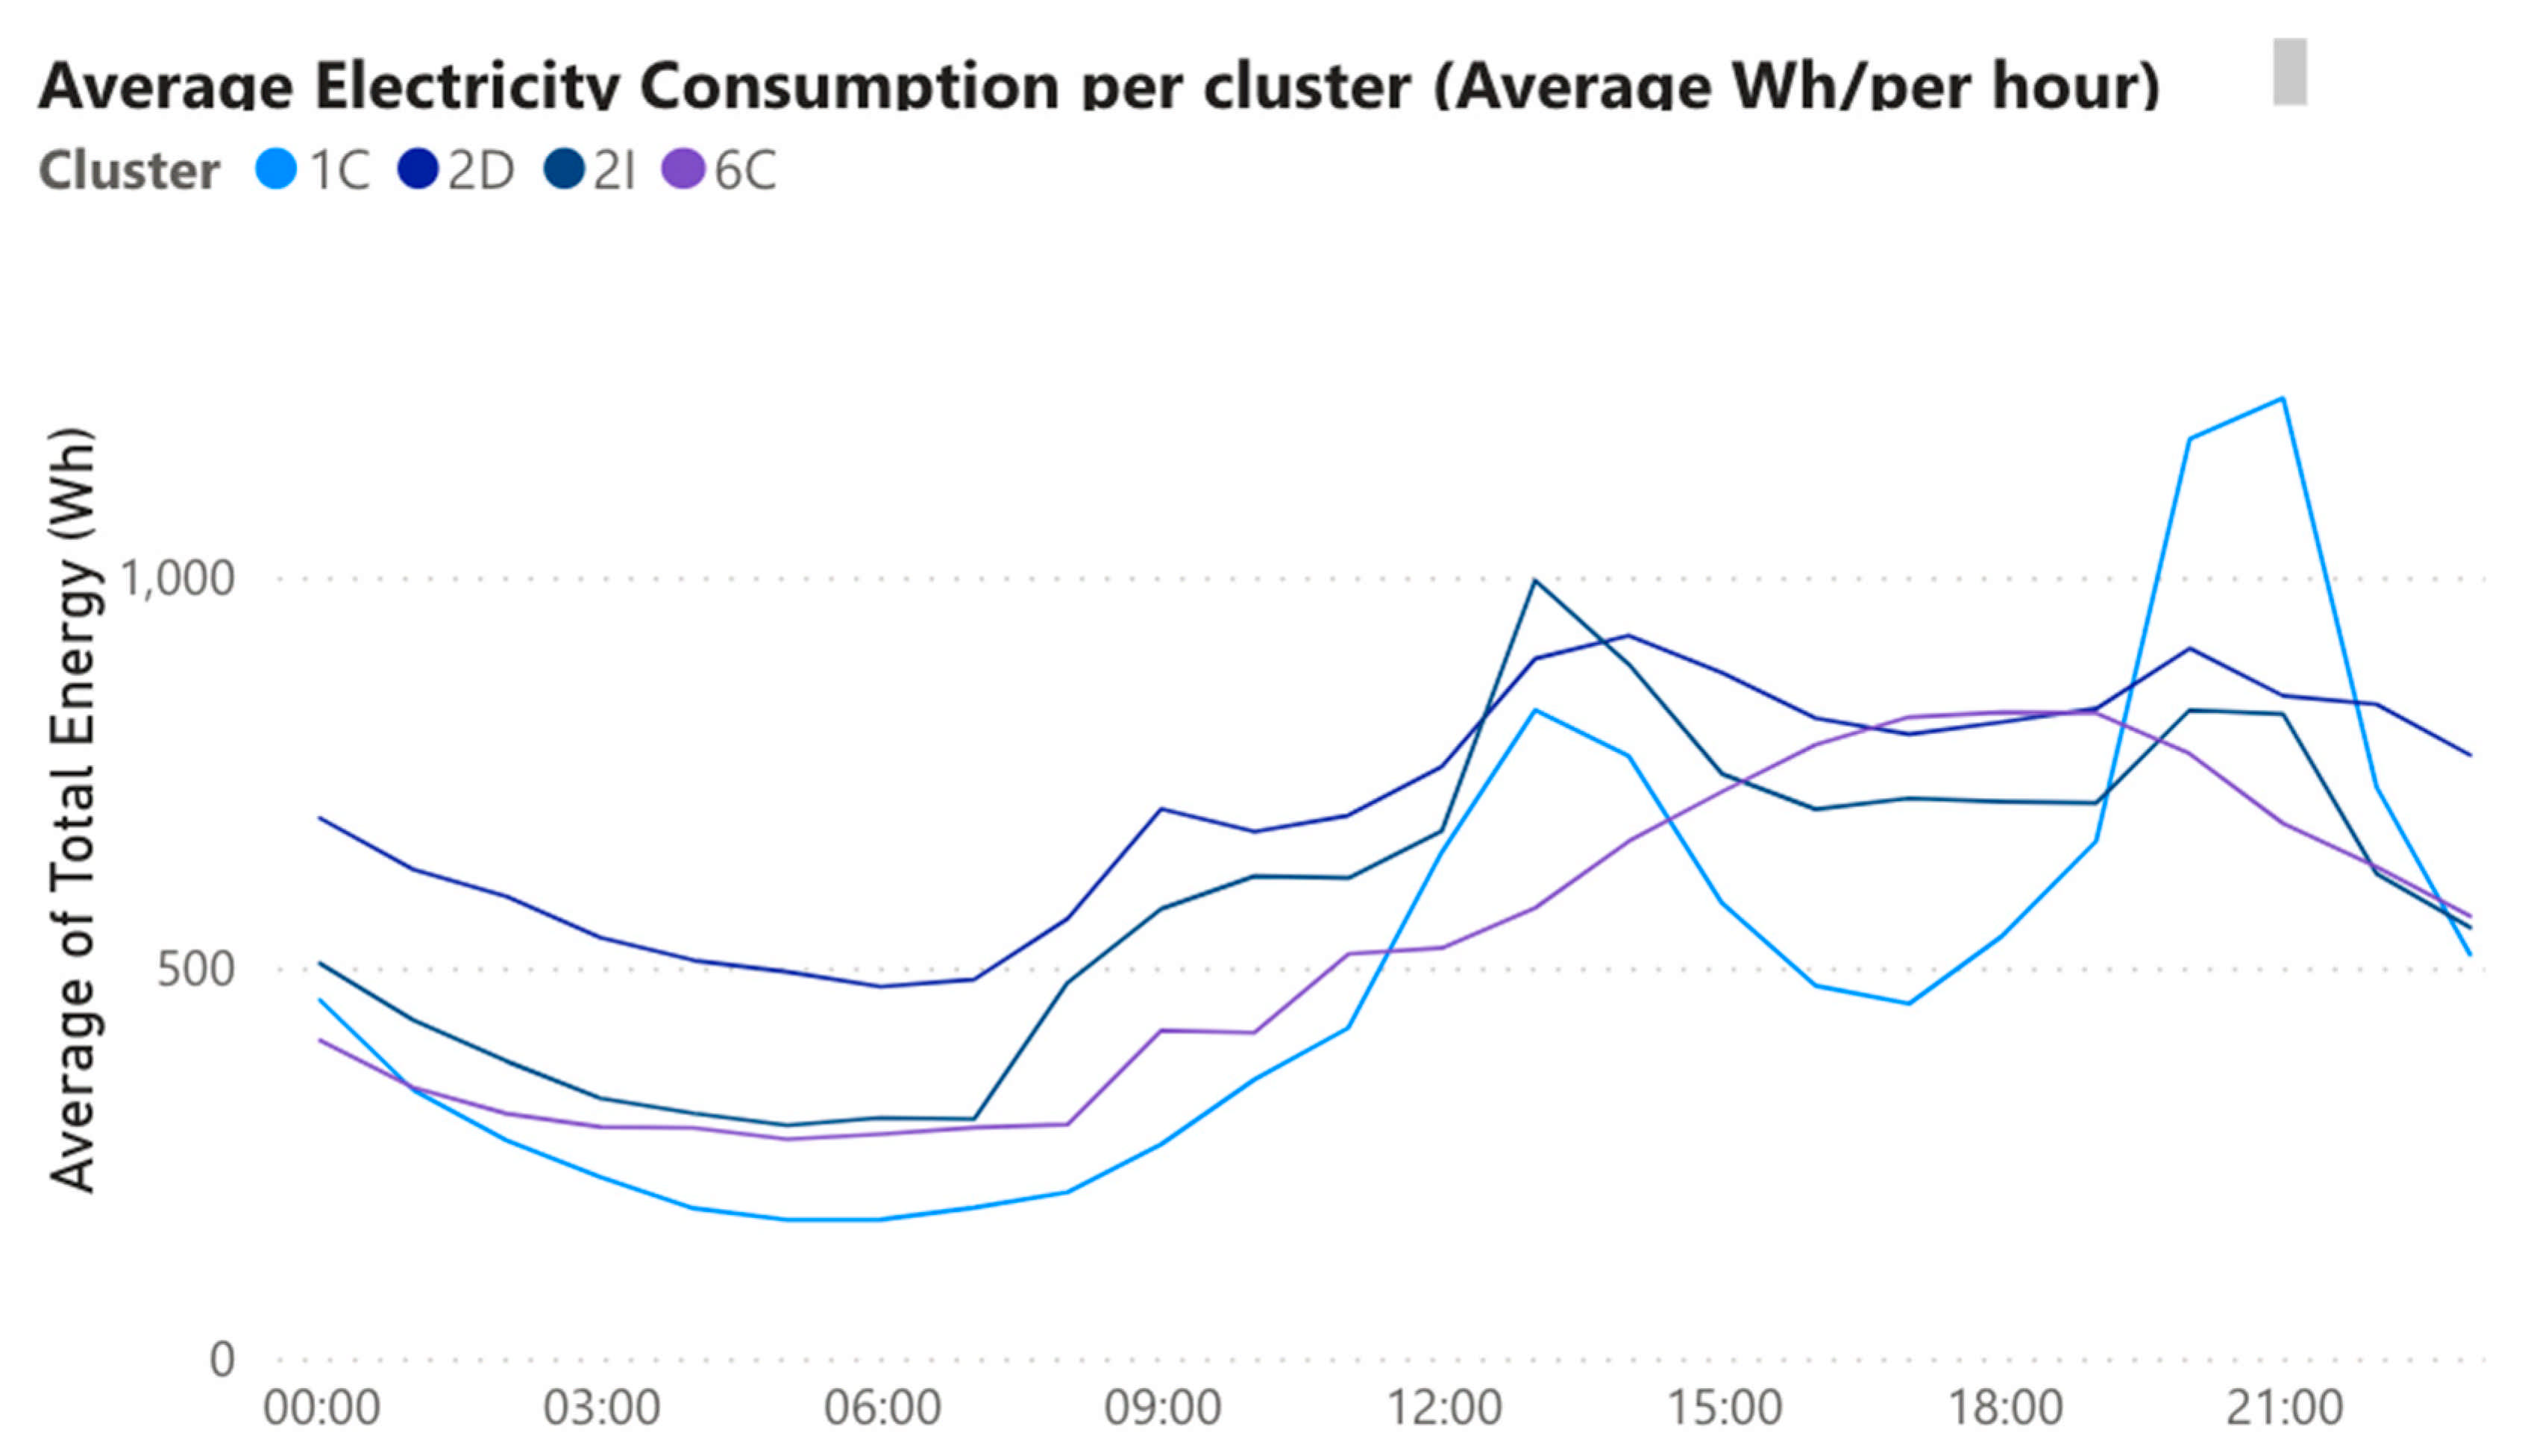
Four spaces with a total count of 1,047,498 inputs were assessed: 1C (central cluster), 2I, 2D (lateral clusters) and 6C (community space, coworking and social life).
Figure 4 shows the average electricity consumption per space: a clear difference in trends is highlighted for the cluster spaces (1C, 2D, 2I). The double peak linear trend showed an increase of the intensity during lunch and dinner times, particularly high in 1C. The Cluster Central was associated with having larger common spaces accessible to the whole community; colivers used this space for shared dinners with other colivers. Instead, the study identified that Community Coworking 6C showed a very different trend, with a single smooth one-lump shape with a peak at 6 pm that corresponded to a different use of this space.
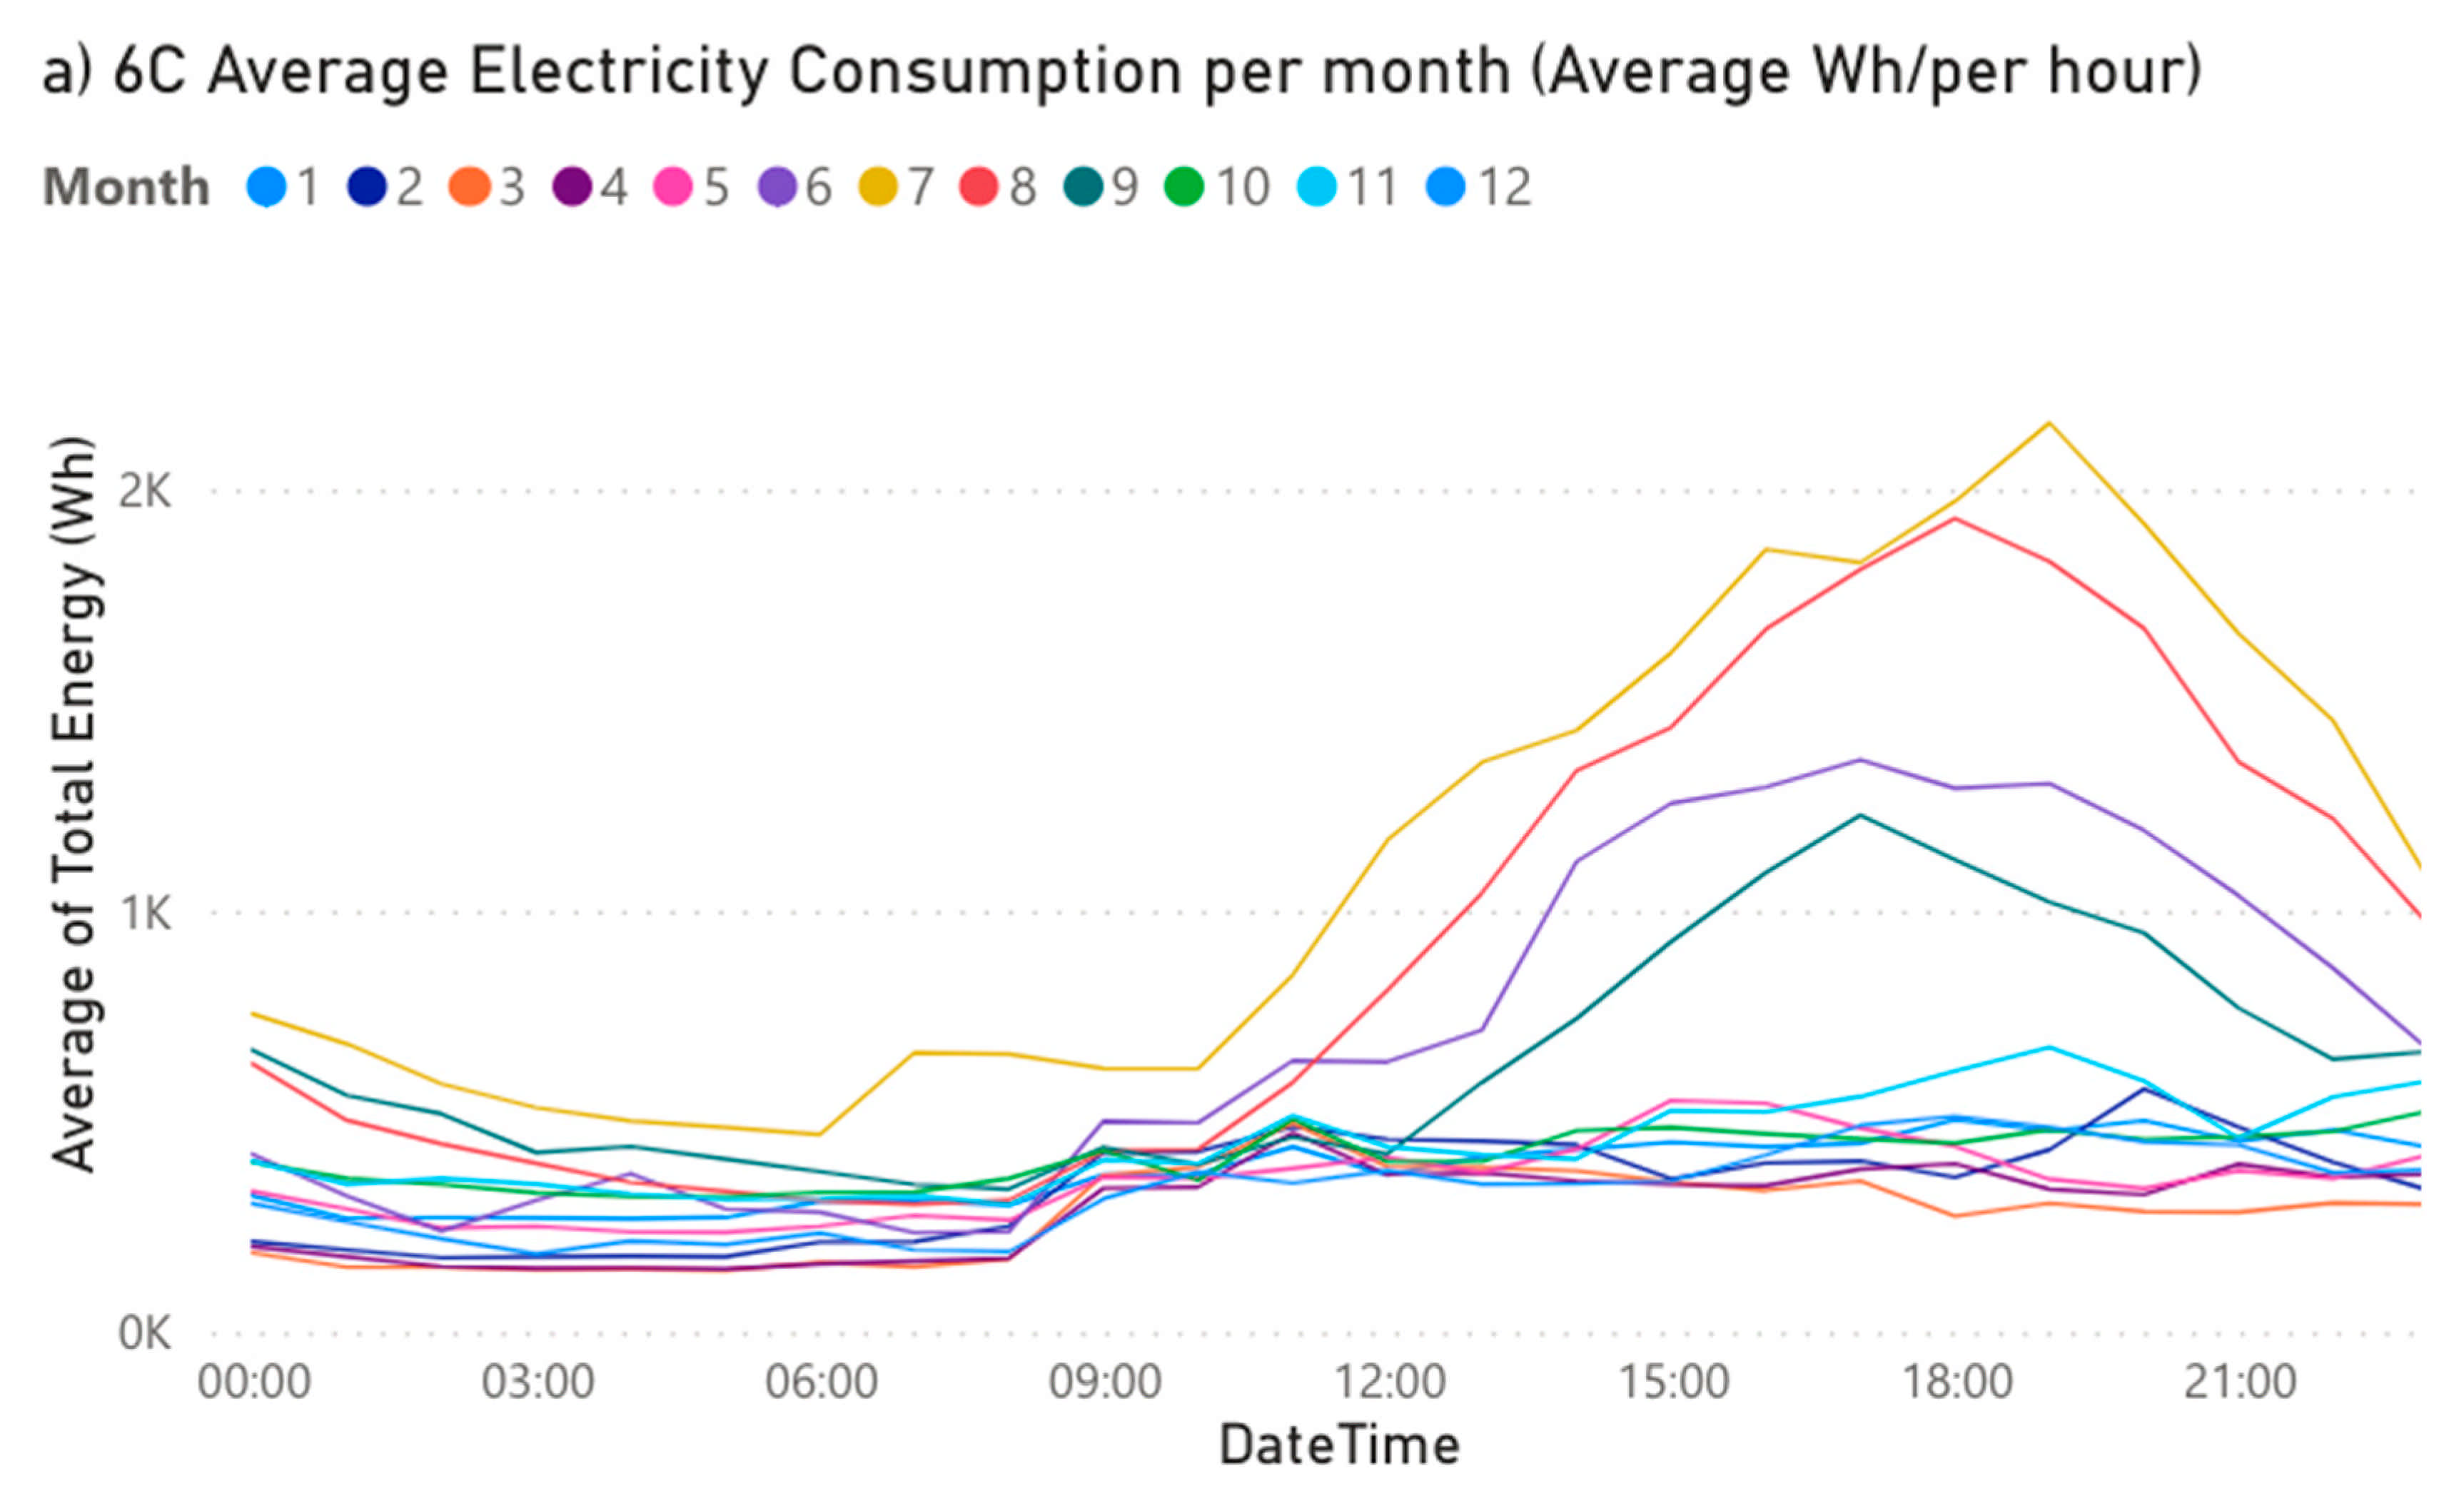
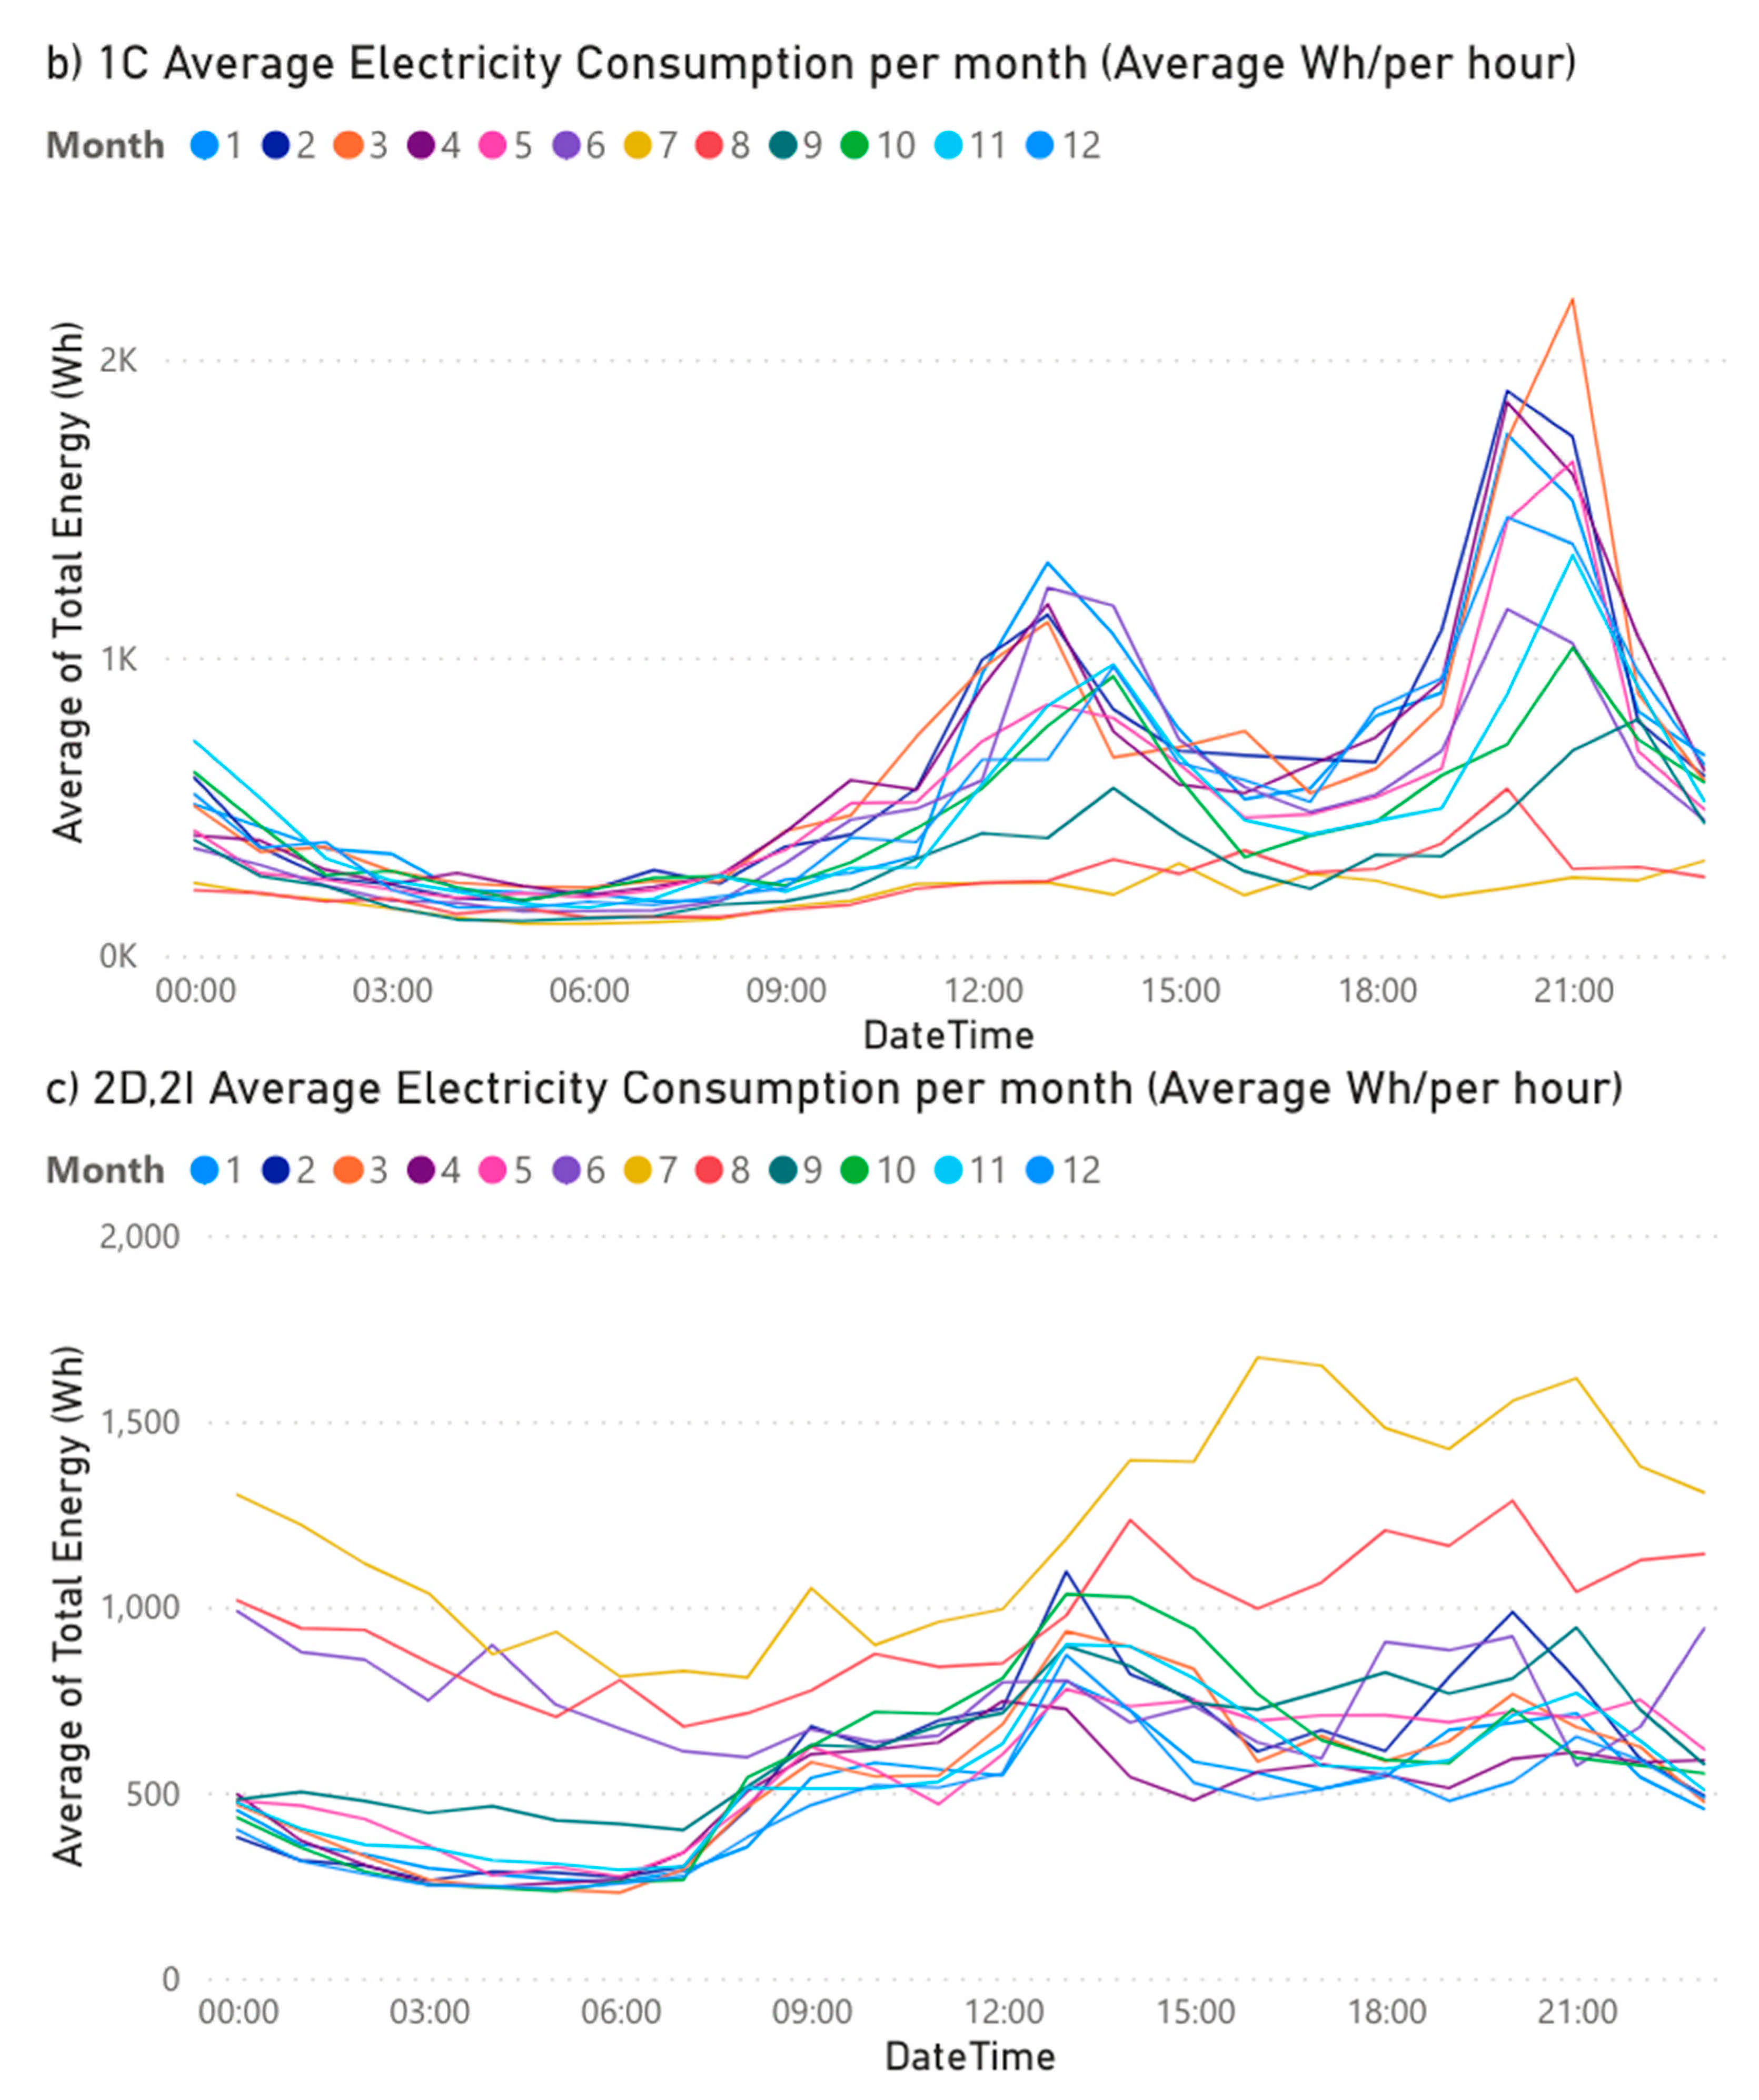
Figure 5 focused on 6C during the complete year: the electricity consumption shows a sensible increase from 9:00 to 23:00 in a plateau shape due to moderate electricity consumption related to use of laptops and lighting during autumn, winter, and spring seasons. During the summer season, the plateau shape stressed to a peak shape during the afternoons impacted by the use of air-conditioning (AC) because of the western orientation of the space that increased the temperature.
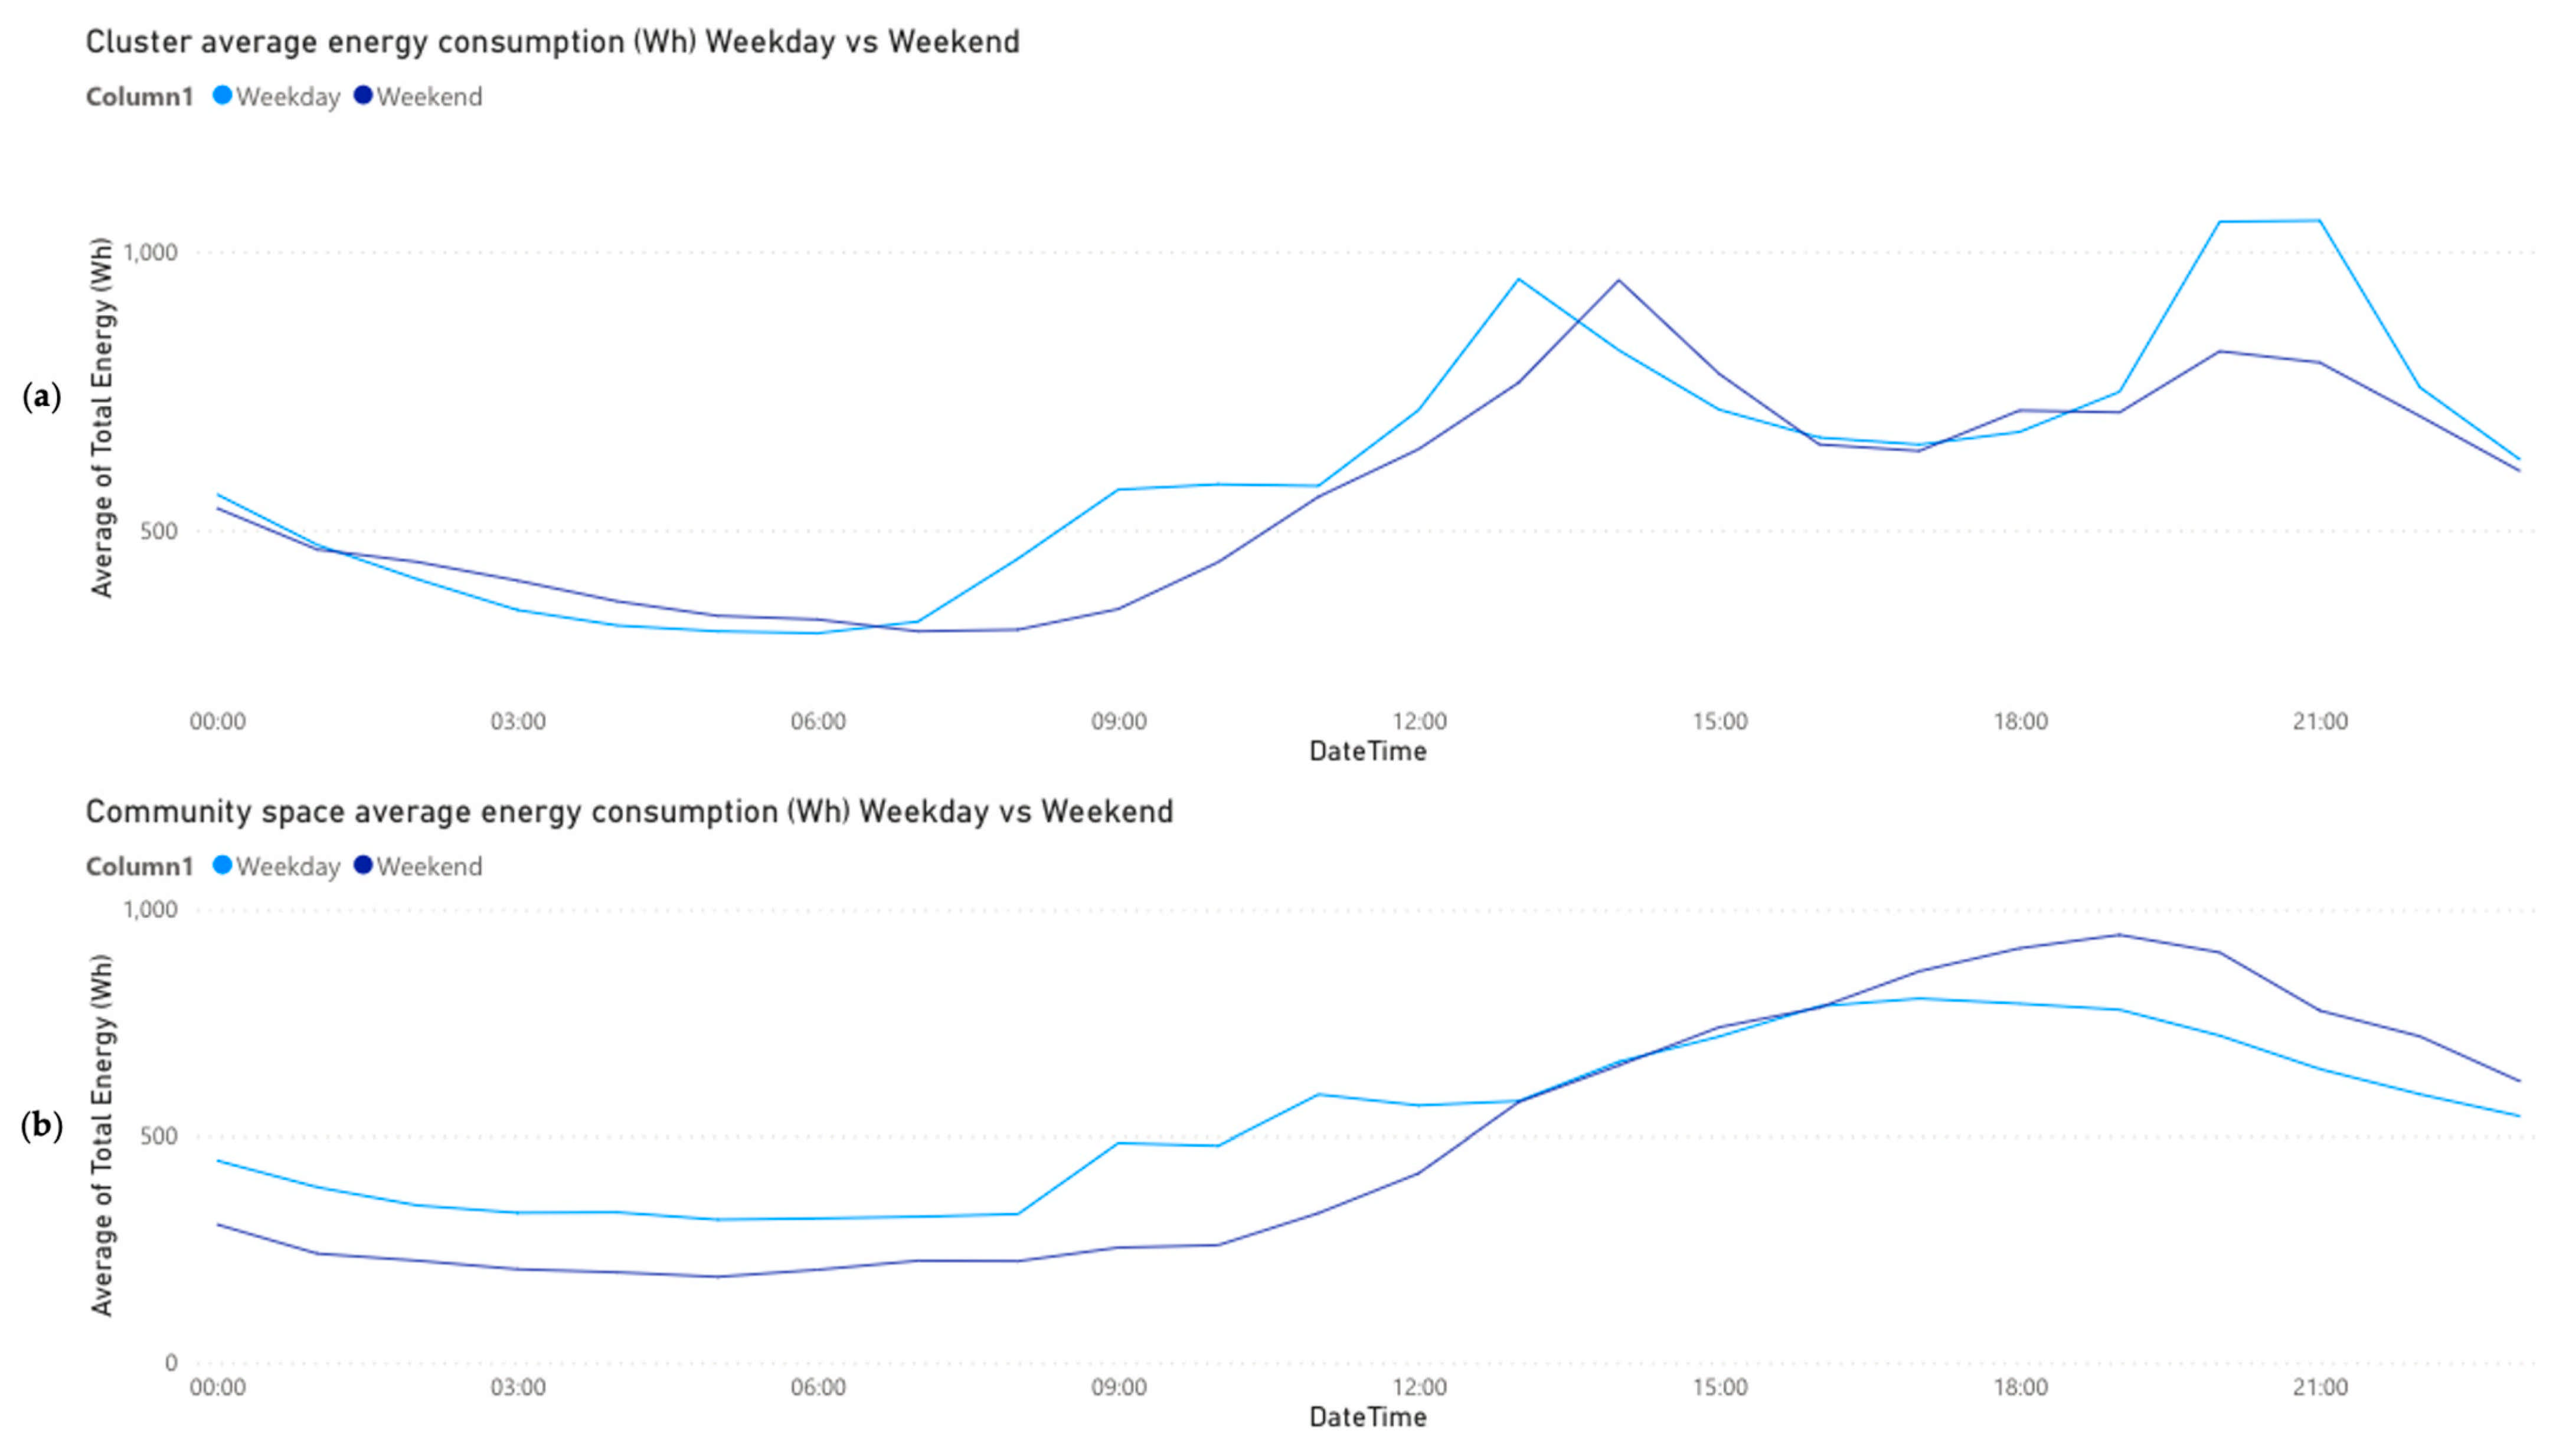
Figure 6 compares weekdays to weekend days. Cluster kitchens were being used more during weekdays than during weekends, especially dinners (Friday, Saturday, Sunday). Lateral clusters 2D and 2I and the Community Coworking 6C showed the only trend of a later start in activities from 9 h during the weekdays, up to 13 h during Saturday and Sunday.
3.2. Phase B: Access Analysis
In total, 75 different doors of the building (75 smart locks) were monitored; the spaces had different levels of access depending on the time of day (
Table 2). The data respond to the different spaces: 1C Central Cluster with common kitchen, 2D & 2I Lateral Cluster with small kitchen, 6C Community Coworking and the other community spaces were also considered for this filtering.
Data for 6C (community space for a coworking) were missing for Mondays, Tuesdays and Wednesday; this is a sample of colivers’ interaction with space as they decided to leave that door open during the day for its constant use as a coworking and meeting space.
Each coliver visits an average of 3.58 shared spaces (excluding private studios) from the coliving space, apart from their own studio, with a range that goes from one to eight shared spaces (median of 3) per coliver.
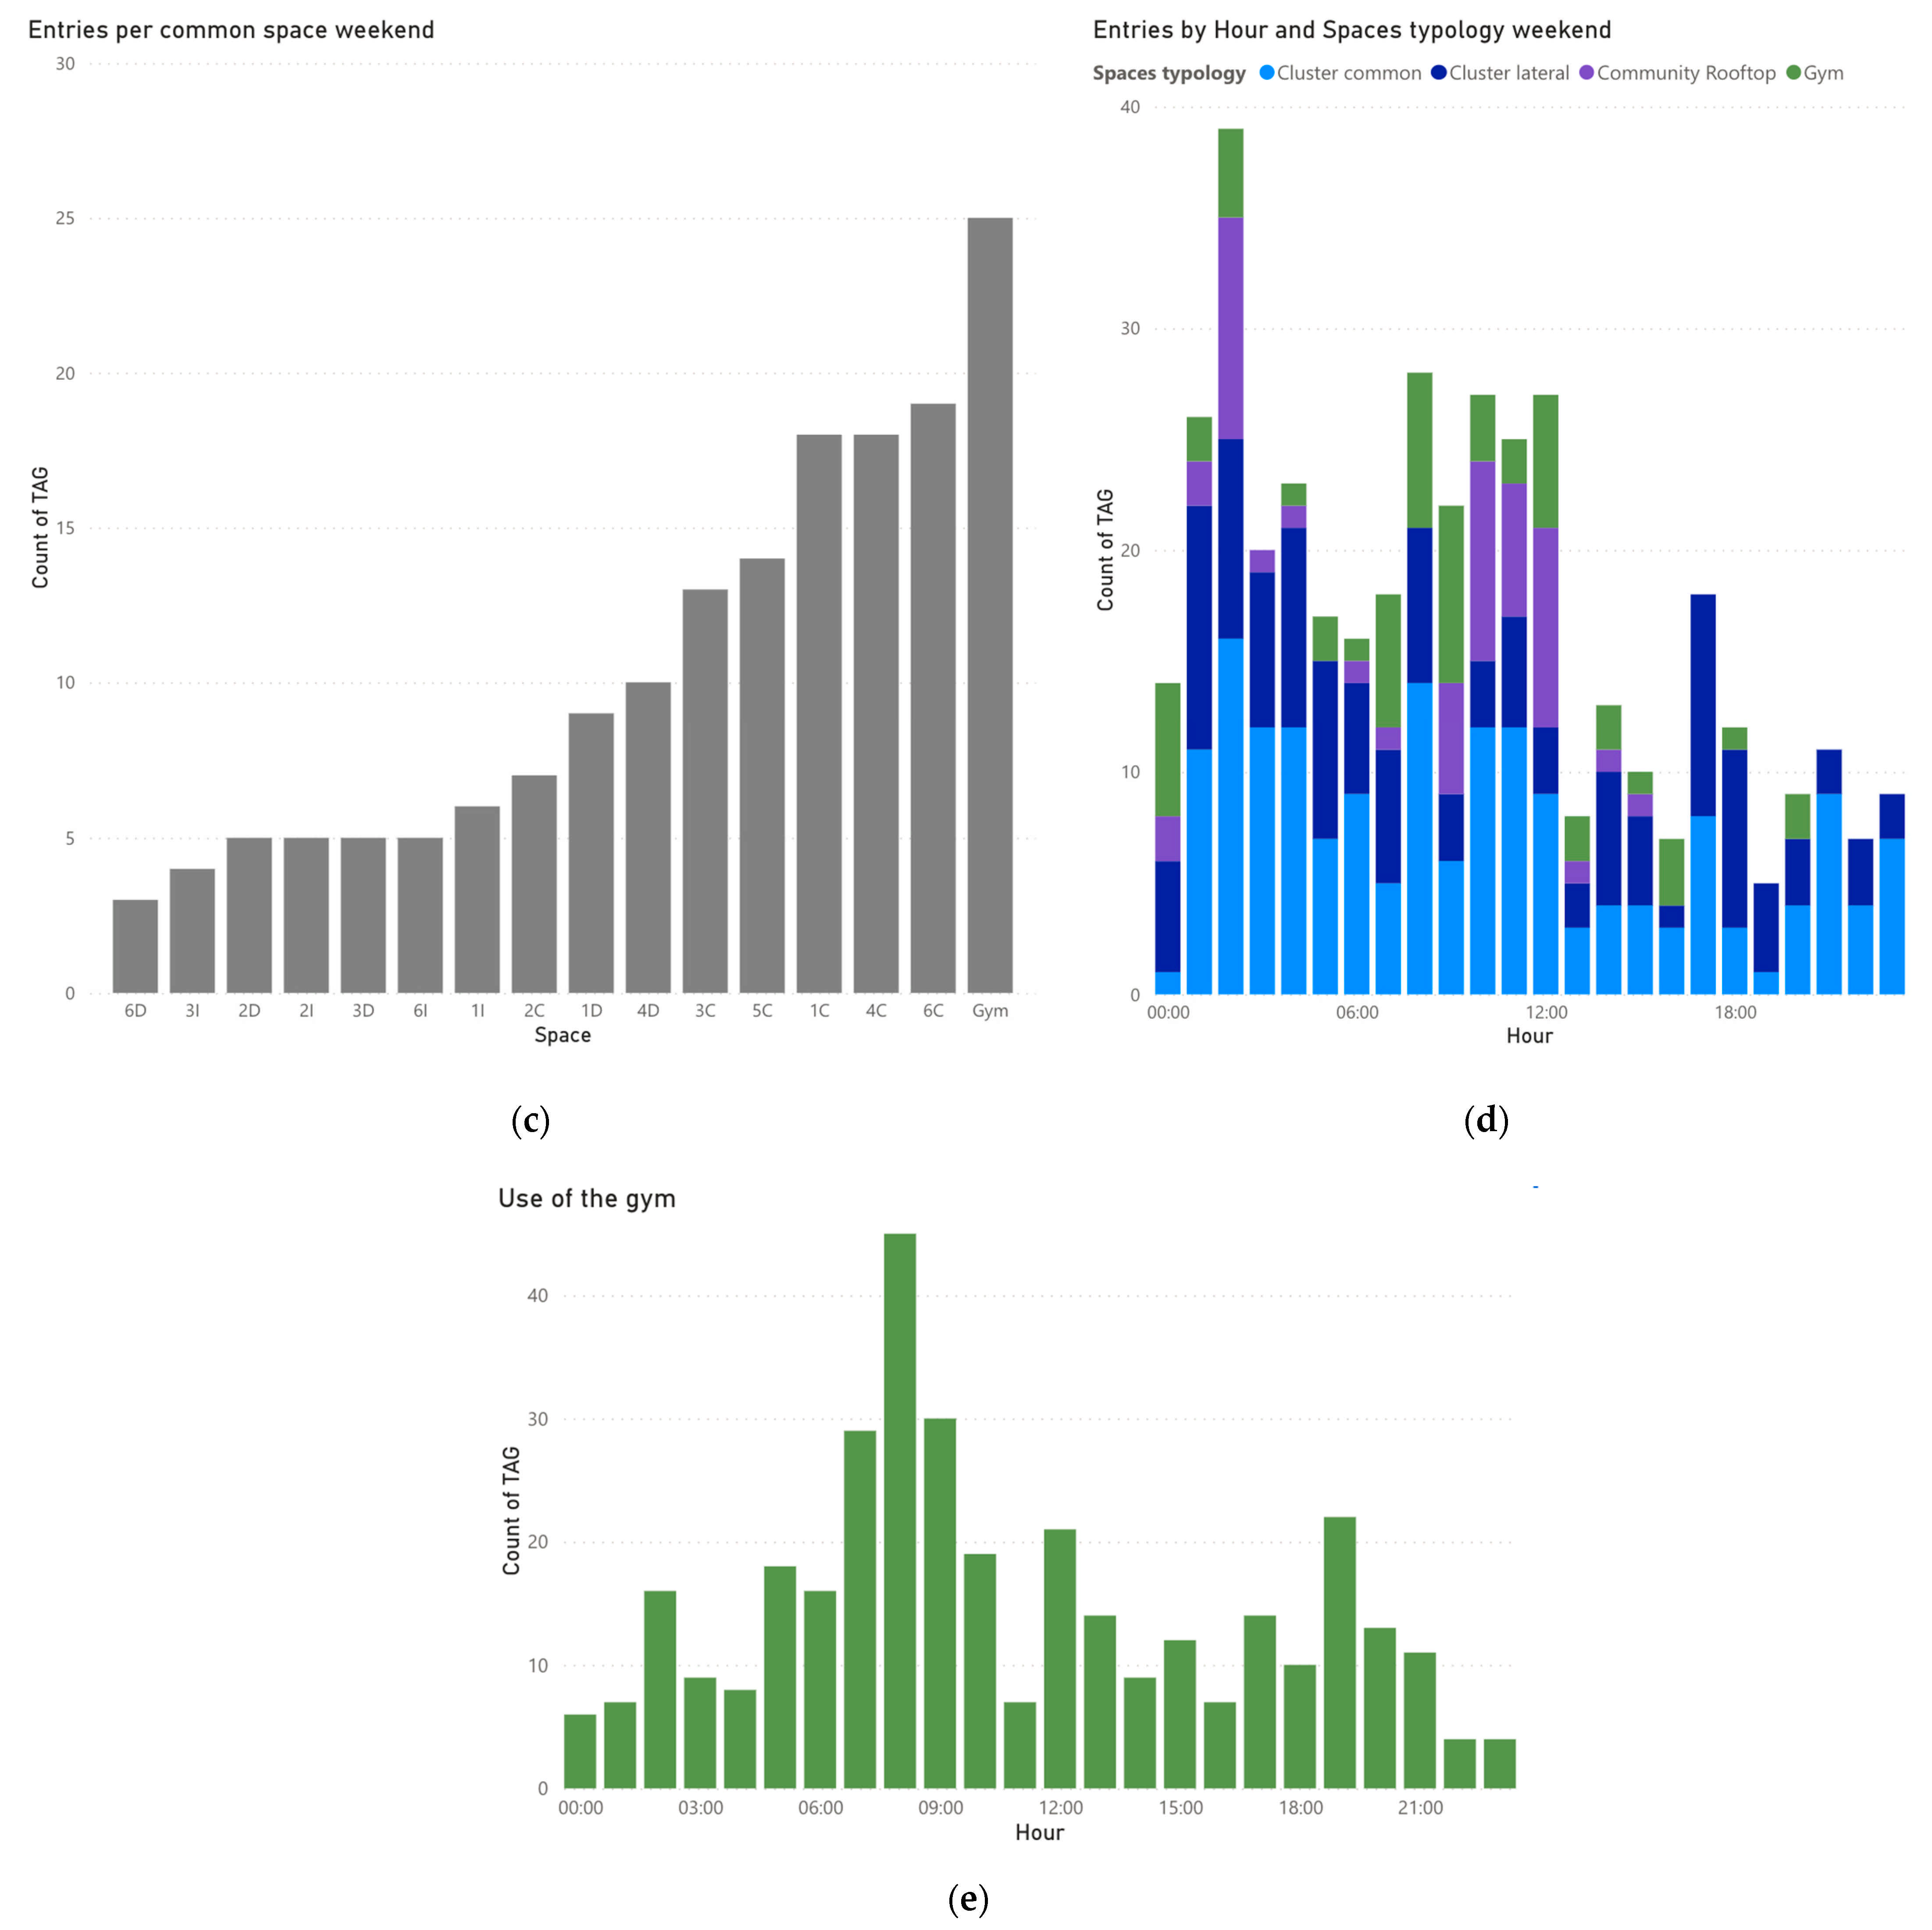
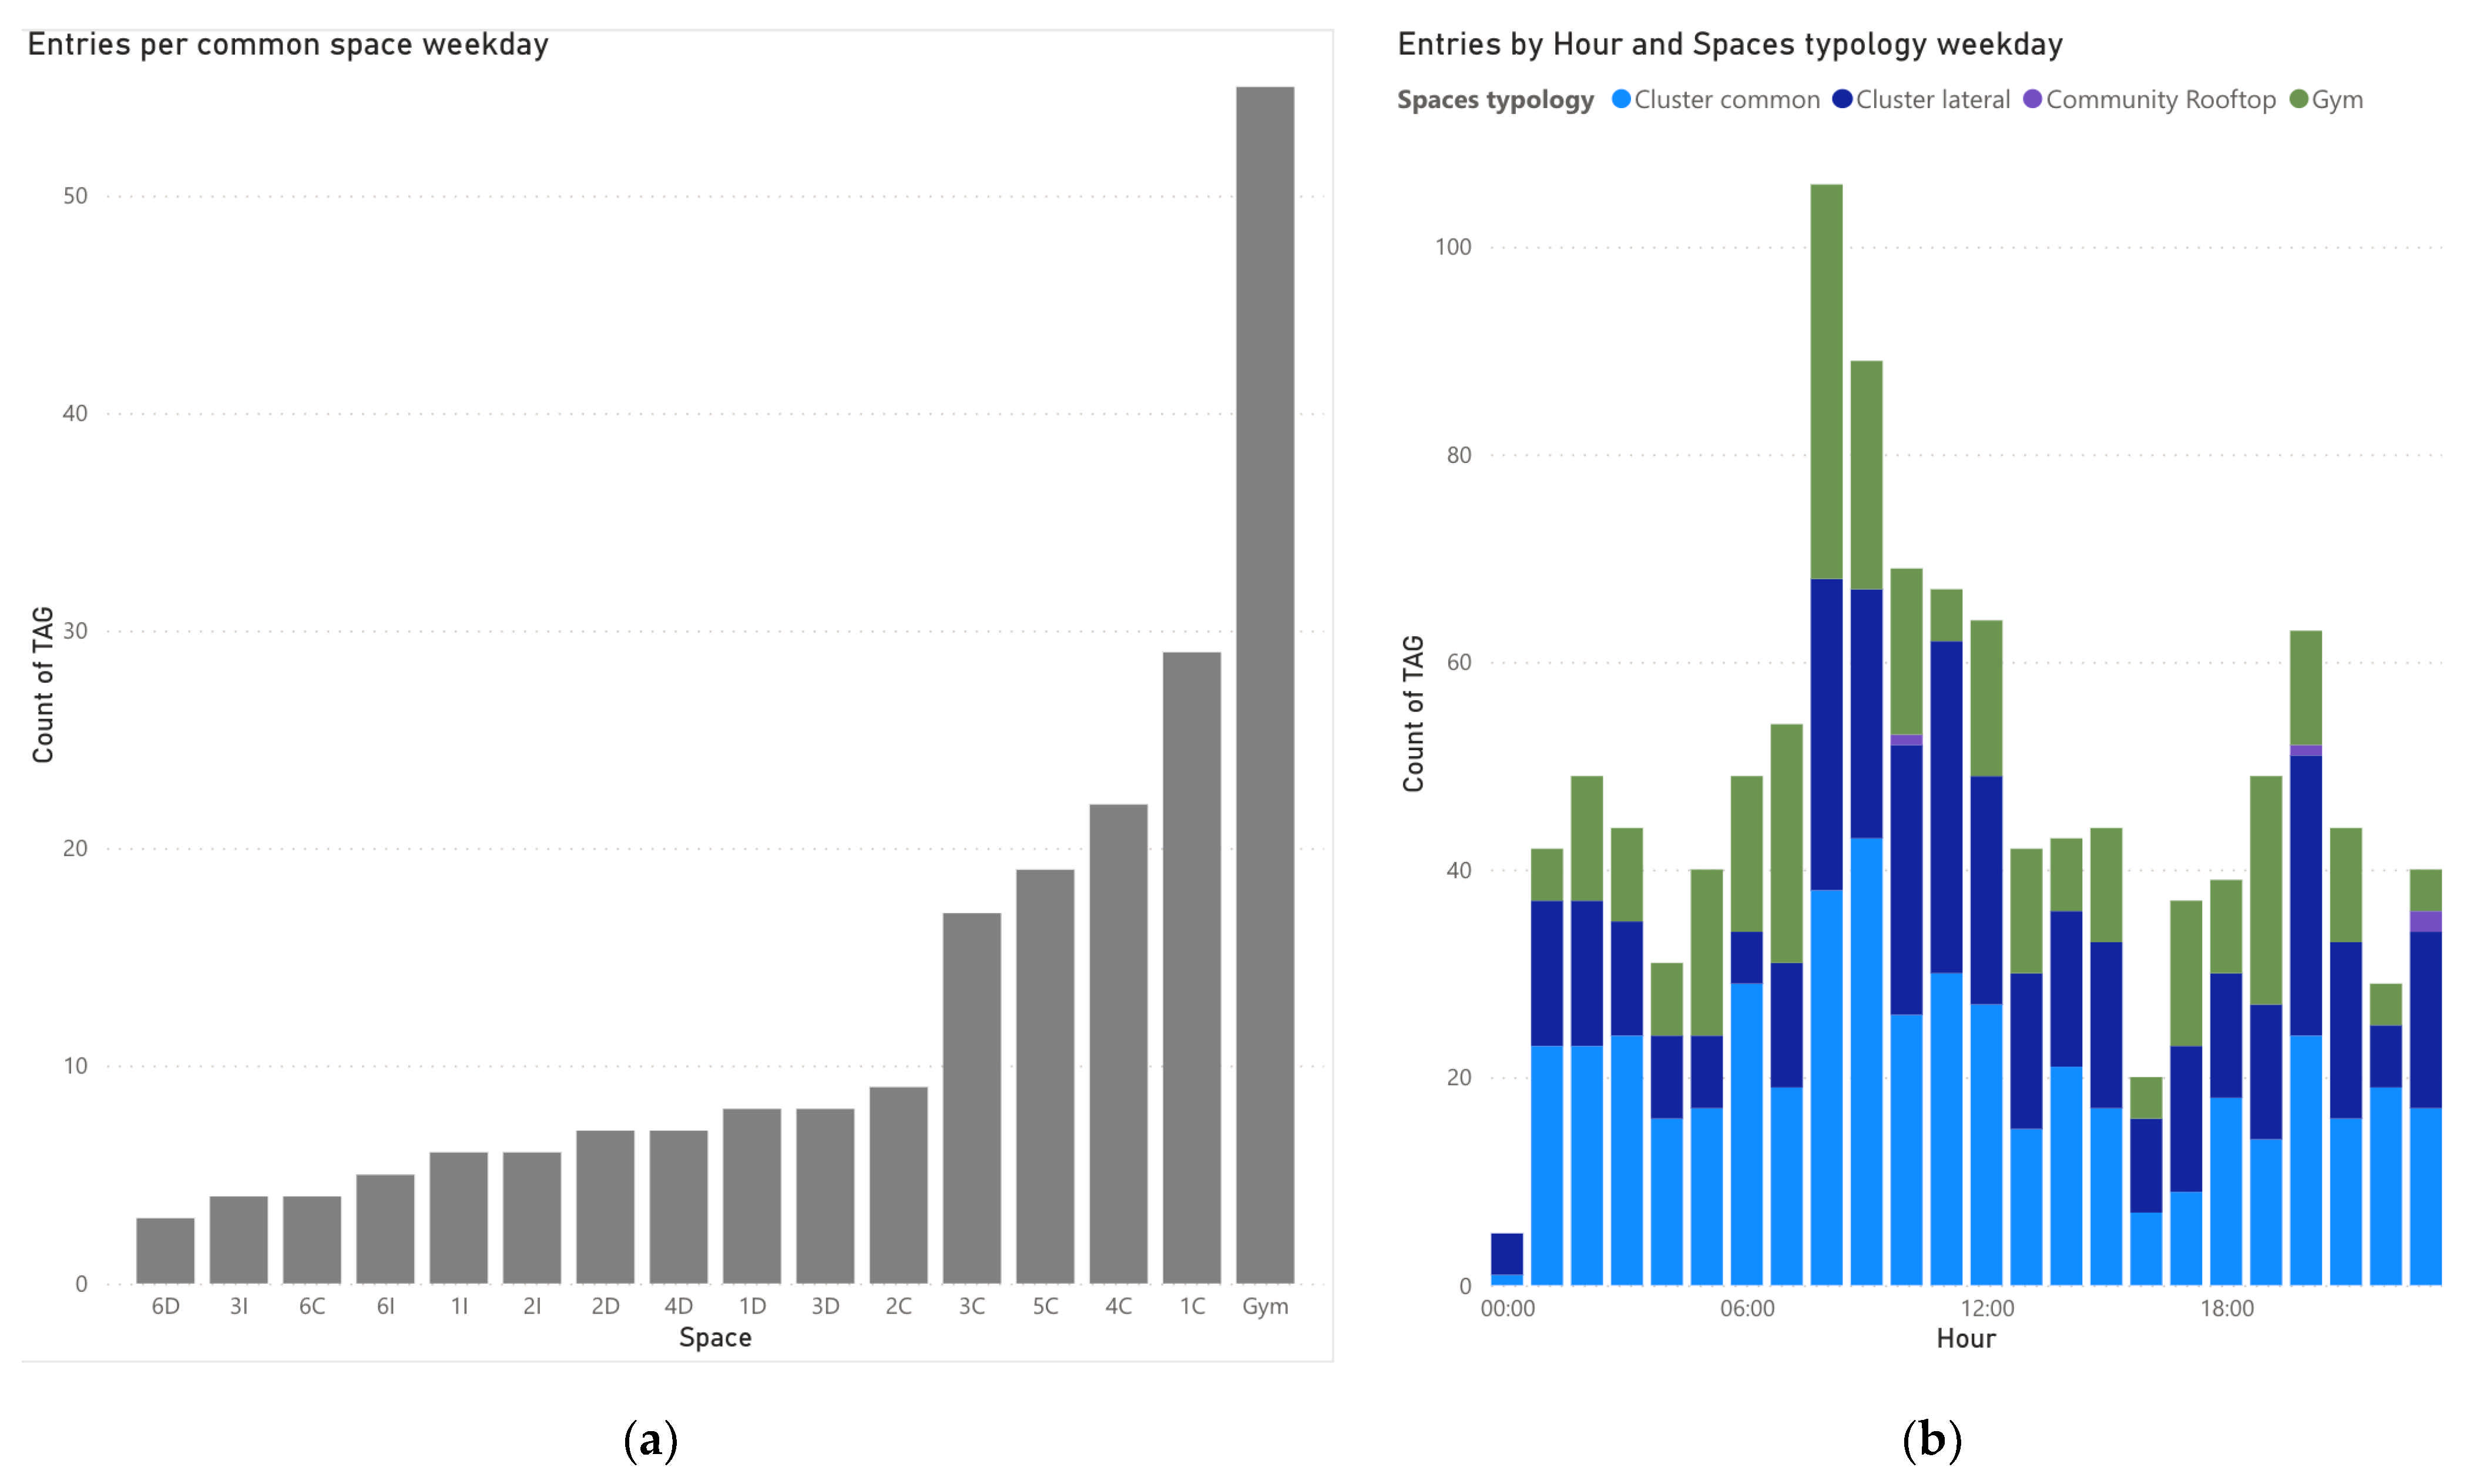
Table 5 shows that among all their favorite spaces, the most visited is the Gym(0I), being used by 68% of the inhabitants. After the gym, the central apartments (1C) are the most popular, despite hosting 25% of the private studios and colivers, visited by 67% members. These central apartments with larger kitchens and commons spaces act as a catalyst of communal activities such as dinners, reinforced in the electricity consumption records.
Table 6 shows the entries to the spaces. The number of colivers that share one cluster varies from 3 to 6. The most popular clusters visited were the central clusters “C” with the larger kitchens and living spaces. 1C was the most popular space with up to 31 colivers, 43% of the sample community visiting the space at least once—the average number of colivers that visit common spaces is 23% (1C, 2D, 2I).
Figure 7 shows the habits and patterns of the visits, when and what are the most visited spaces and the comparison between weekdays when mobility increases within the Coliving from 8 to 9 am and at 8 pm and especially at the gym(0I) and weekends when the overall activity decreases and is concentrated opposingly during night hours and late morning.
3.3. Phase C: Network Cross-Check
The Wi-Fi had the advantage of seamlessly capturing data visualization of the colivers mobile devices (laptop, mobile phone, tablet, watch) in each space, enabling the identification of different behavioral routines depending on the space.
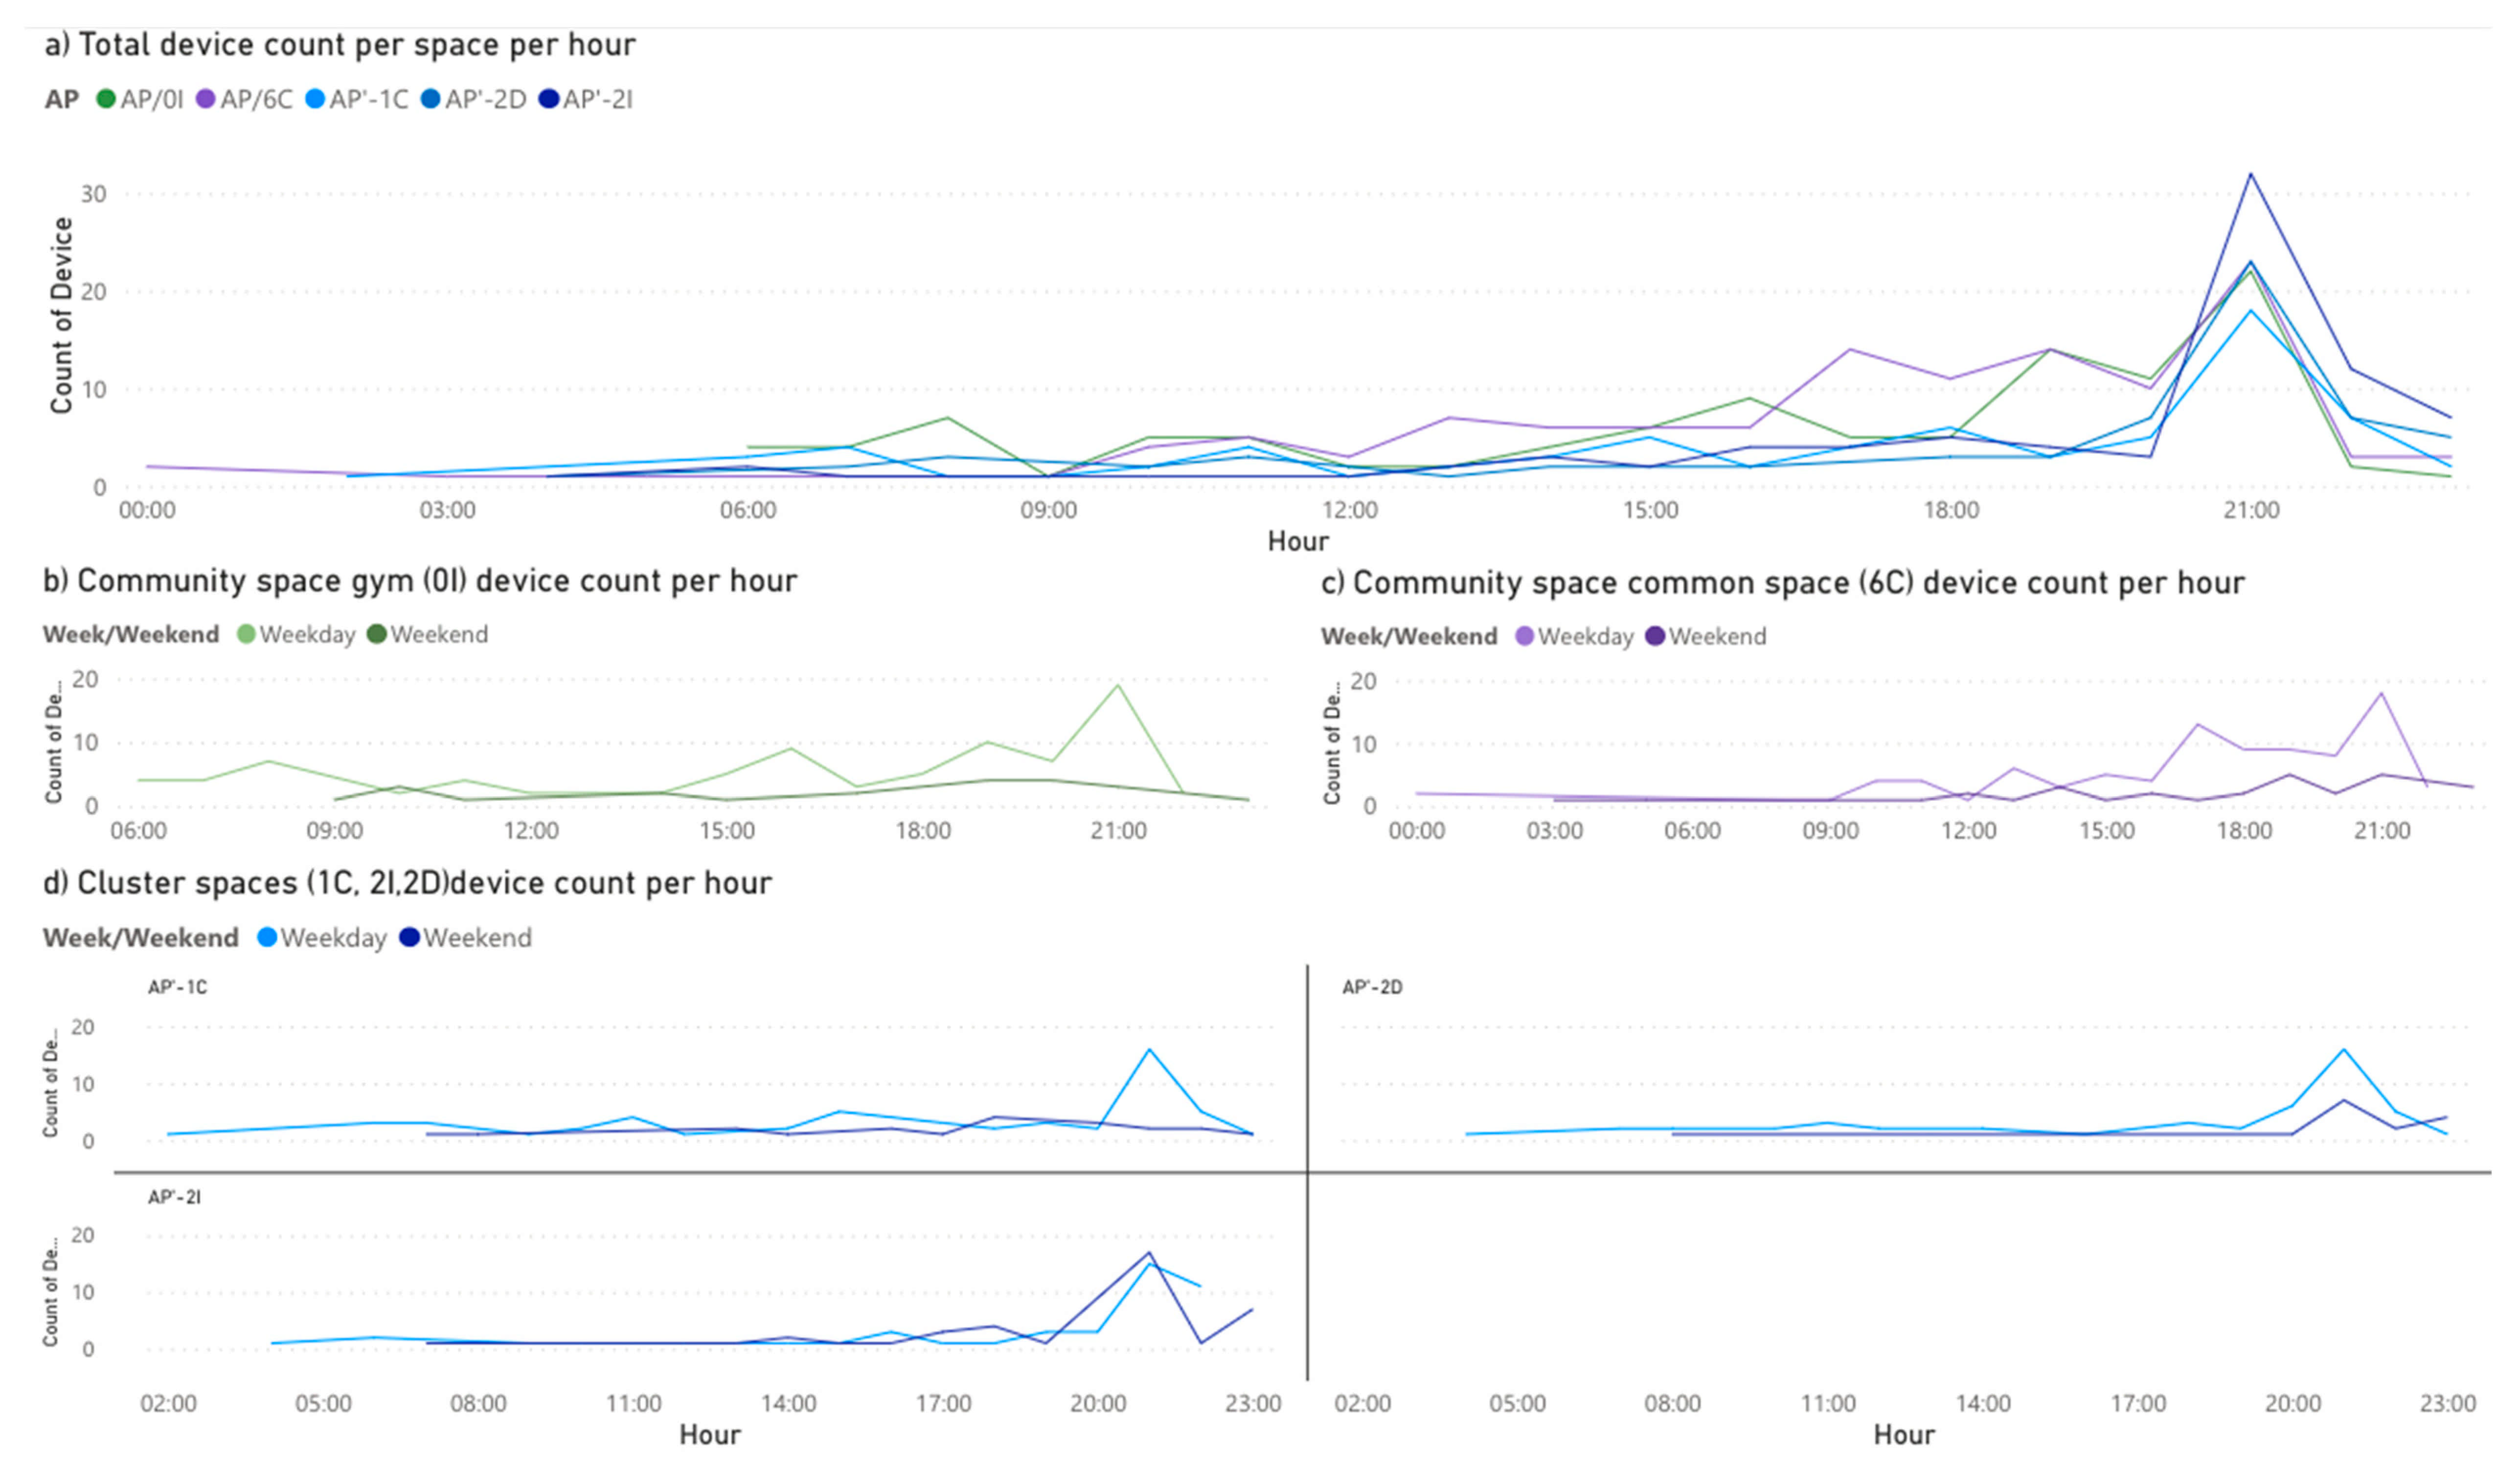
Figure 8 represents the devices seen per space and per hour as a daily average of the month. (a) shows the profile of all the spaces analyzed, (b) focused on the gym, with peak on activity at 1 pm and another peak the afternoon and evening during the weekdays (the night connections were also linked to the use of the common spaces next to the gym that had the Gym SSID as the closest network, highlighted by colivers, and cross-checked by the Access Analysis). (c) the Community Coworking area and events show a distributed activity starting at 12 pm until night in office working areas and dinner time more frequent during weekdays, but both charts were very different to (d) Cluster spaces 2I, 2D and 2I that all perform at low intensity during the day but peak between 9 pm and 11 pm during the weekdays, dinner and after dinner time, when colivers that are regularly active in their private spaces or common cluster spaces—this input is essential for the spaces profiling as it identifies the spaces clearly by the behavior within them. During the weekends, similarly to the access controls, there was considerably less use of internet and movement within the areas; 50% of connections in the coworking space 6C and even less in the Gym and surroundings and in the private spaces.
3.4. Phase D: Space Profiling
After concluding Phases A, B and C, the indicators of
Table 1 were crosschecked with the space classification
Table 4 and synthetized it to develop the SPs. The corresponding author developed the first SP and the co-authors, technology, head of local operations, IT expert, Chief of Operations and Head of Innovation reviewed and complemented the information. It was an iterative process complemented by adding details and helped understanding of the profiling
Figure 9.
4. Discussion
As buildings are made smarter, AEC practitioners must integrate the latest technologies to adapt to a rapidly changing society and respond to sustainable HCD spaces [
1]. The seamless Post-Occupancy Framework enabled to create a methodology to monitor and adapt the space to user needs over time. It is important to note that the SPs were not an objective itself, but a dynamic, interactive flashcard that provided inputs from the use of spaces. They are a means of dialogue between users and AEC practitioners to improve space design, iterate, modify physical characteristics of space, and analyze how it affected to colivers routines and the use of spaces through the digital trail of the users.
The SPs are therefore scalable and can be implemented globally, adapting to different buildings, locations and taking into consideration the different restrictions or regulations such as the COVID-19 restrictions in place during the time of study. The SPs are a powerful iterative, spatial tool to interact with residents use of space, and behavioral patterns to improve future design, optimize spaces and assess comfort and wellbeing.
Central Cluster spaces are visited by 14%–43%, an average of 29.7% (21.2 colivers), and the largest electricity consumption and visits are within weekdays at lunch and dinner hours, whereas the Lateral Clusters are visited by only 4%–17% of the community which meant an average of 10.3% (7.4 visitors from other clusters) and has a high consumption of internet at 21:00 h, mostly individual connections inside the private studios. Community Spaces like the gym had a visitor rate of up to 79% and coworking was preferred to be open without restricted access during the day.
Cluster spaces had a higher electricity consumption rate during lunchtime and dinner time mainly due to intensive use of appliances; community spaces like coworking spaces intensified electricity consumption gradually during the afternoon due to AC during the summer months—the rest of the months they encountered a plateau-shaped stable consumption trend. Central Cluster spaces acted as catalyzers of community, colivers visited an average of three to four common spaces, Central Clusters being frequented more by external visitors.
Our consultations with colivers were also essential to complementing and understanding their choices as key to HCD. Interviews and codesign to improve SPs is always recommended as a future line of research. For example, after identifying the electricity patterns and consumption habits of users, the results of the current research recommended modifying the electricity contract to be adjusted to match the peak hours of consumption of the Coliving in order to match their habits. In addition, other measures were suggested to improve wellbeing and use of spaces. Feedback also showed that colivers had a significant interest in the following: understanding building and performance, environmental sustainability, knowing how to improve performance and suggested visualization measures to reduce environmental impact. This interaction helped not only to improve the performance of current spaces but also to collaborate for a more conscious future society.
The use of space routine also differs depending on the day of the week: at weekends, the number of in-house common dinners was significantly reduced and mobility within the Coliving decreased and shifted towards late mornings and night-time rather than during the week when it is distributed more evenly along the day.
Colivers also showed different habits and patterns of use of space: more social colivers visit up to eight spaces apart from their private studios on average, others just one or two. After the study the Central Cluster spaces were recommended to colivers more interested in networking and community interaction and Lateral Clusters to others looking for more independence.
Future Lines of Research
In future lines of research, the researchers would complement and enhance the research by repeating the process in other buildings with a different typologies and other available data sources to be processed, such as open databases to track interaction with the city and sociodemographic data.
Including surveys to the colivers to enlightening colivers motivations for choosing coliving and their perception of the different spaces would be an additional value-added study for future research.
A post COVID-19 assessment of the building will also be performed to add additional feedback on the building and comparison of data during and post-COVID-19 crisis.
5. Limitations
Several limitations were encountered during the study: the first was to implement the study in a single building and geographic location in Madrid. Although colivers had an international background, the outputs and the SPs were therefore linked to the geographical context, target users and COVID-19 regulations. The methodology was designed to be iterated, replicated, and scaled to any kind of building and location, enabling the repetition of the process, the updating of the digital trail with the available data sources and replicating the SPs for other locations, users, and conditions.
At the beginning developing this methodology during the COVID-19 was a limitation due to difficulties to visit the space for data collection. This was transformed into an opportunity to take a step forward to POE analysis and adapt it to restrictions to develop a system that could be implemented fully remotely, which meant the process could be exported and scalated to other geographies, globally, without the need for geographic relocation; in addition, this methodology helped to understand the evolution of the use of spaces during and after the pandemic.
6. Conclusions
The current research demonstrated how POE techniques based on the digital trail can be employed to design a methodology for sustainable HCD Coliving spaces.
The infrastructure available in highly digitalized IOT-based buildings, like colivings, has proven to be a valuable resource to assess performance of spaces and behavioral patterns based on the already existing IT devices, without the need to install additional sensors, regarding the expected learnings.
The three SPs showed major differences in the use of spaces and enabled a comparative analysis of the use of spaces. The different data sources provided inputs to enable identification of the level of occupancy of the different spaces, average number of visitors and overall popularity of the spaces, differentiating between most occupied spaces and less occupied.
Data sources also provided insights into energy consumption and activities implemented in each space according to data consumption patterns.
A home is not a roof—walls and doors are physical divisions of space. This paper proved buildings go beyond the physical skeleton and shell, and strongly rely on digital networks and experience. The developed methodology and the use of SPs was essential for sustainable HCD interpretation of buildings to assess not only the behavioral patterns of the users but also the interaction of the building with the environment.
Author Contributions
Conceptualization, A.R. and A.G.-S.; methodology, A.R.; software, M.A. and C.L; validation, A.G.-S., M.A. and C.L.; formal analysis, A.R. and J.D.P.; investigation, A.R.; C.L.; resources, M.A.; data curation, A.R.; writing—original draft preparation, A.R.; writing—review and editing, A.R., A.G.-S., C.L.; M.A. and J.D.P. visualization, A.R.; supervision, A.G.-S.; project administration, A.G.-S. All authors have read and agreed to the published version of the manuscript.
Funding
This research received no external funding.
Informed Consent Statement
Informed consent was obtained from all subjects involved in the study.
Data Availability Statement
The data presented in this study are available on request from the corresponding author due to privacy.
Acknowledgments
The researchers of this project thank Urban Campus for their collaboration and access to the data as well as the community of colivers for their feedback and collaboration.
Conflicts of Interest
The authors declare no conflict of interests.
Abbreviations
The following abbreviations are used in this manuscript:
| AC | Air-conditioning |
| AEC | Architecture, engineering construction professionals |
| AP | Access Point |
| API | Application Programming Interface |
| HCD | Human-centered design |
| MDPI | Multidisciplinary Digital Publishing Institute |
| NUA | Net Usable Area |
| POE | Post-Occupancy Evaluation |
| SEM | Smart Electricity Meter |
| SP | Space Profiles |
| SSID | Service Set Identifier |
| TAG | Input entry by Coliver |
References
- Agee, P.; Gao, X.; Paige, F.; McCoy, A.; Kleiner, B. A Human-Centred Approach to Smart Housing. Build. Res. Inf. 2021, 49, 84–99. [Google Scholar] [CrossRef]
- Gdańsk University of Technology, Faculty of Management and Economics; Popowska, M. Co-Living or a “Sandpit” for Future Entrepreneurs. First Experience from Poland. Stud. Mater. Wydz. Zarządzania UW 2017, 1/2017, 7–13. [Google Scholar] [CrossRef]
- Cleaver, N.; Frearson, A. All Together Now: The Co-Working and Co-Living Revolution; Routledge: Abingdon, UK, 2021; ISBN 978-1-00-037531-2. [Google Scholar]
- Wetzstein, S. The Global Urban Housing Affordability Crisis. Urban Stud. 2017, 54, 3159–3177. [Google Scholar] [CrossRef]
- Miller, E.D. Loneliness in the Era of COVID-19. Front. Psychol. 2020, 11, 2219. [Google Scholar] [CrossRef] [PubMed]
- Smith, B.; Lim, M. How the COVID-19 Pandemic Is Focusing Attention on Loneliness and Social Isolation. Public Health Res. Pract. 2020, 30, 3022008. [Google Scholar] [CrossRef] [PubMed]
- Hertz, N. The Lonely Century Coming Together in a World That’s Pulling Apart; Sceptre: London, UK, 2020; ISBN 978-0-593-13584-6. [Google Scholar]
- Osborne, R. Best Practices For Urban Coliving Communities. Master’s Thesis, University of Nebraska, Lincoln, NE, USA, December 2018. [Google Scholar]
- Nanda, A.; Thanos, S.; Valtonen, E.; Xu, Y.; Zandieh, R. Forced Homeward: The COVID-19 Implications for Housing. Town Plan. Rev. 2021, 92, 25–31. [Google Scholar] [CrossRef]
- Browne, R.A.V.; Cabral, L.L.P.; Freire, Y.A.; Macêdo, G.A.D.; Oliveira, G.T.A.; Vivas, A.; Elsangedy, H.M.; Fontes, E.B.; Costa, E.C. Housing Type Is Associated with Objectively Measured Changes in Movement Behavior during the COVID-19 Pandemic in Older Adults with Hypertension: An Exploratory Study. Arch. Gerontol. Geriatr. 2021, 94, 104354. [Google Scholar] [CrossRef]
- Schweizer, C.; Edwards, R.D.; Bayer-Oglesby, L.; Gauderman, W.J.; Ilacqua, V.; Juhani Jantunen, M.; Lai, H.K.; Nieuwenhuijsen, M.; Künzli, N. Indoor Time–Microenvironment–Activity Patterns in Seven Regions of Europe. J. Expo. Sci. Environ. Epidemiol. 2007, 17, 170–181. [Google Scholar] [CrossRef] [PubMed] [Green Version]
- Del Boca, D.; Oggero, N.; Profeta, P.; Rossi, M. Women’s and Men’s Work, Housework and Childcare, before and during COVID-19. Rev. Econ. Househ. 2020, 18, 1001–1017. [Google Scholar] [CrossRef]
- Esteban-Gonzalo, S.; González-Pascual, J.L.; Caballero-Galilea, M.; Esteban-Gonzalo, L. Psychosocial Correlates of Mental Health and Well-Being During the COVID-19: The Spanish Case. Front. Psychol. 2020, 11, 609815. [Google Scholar] [CrossRef] [PubMed]
- United Nations Policy Brief: COVID-19 and the Need for Action on Mental Health. 2020. Available online: https://reliefweb.int/report/world/policy-brief-covid-19-and-need-action-mental-health-13-may-2020?gclid=CjwKCAiAm7OMBhAQEiwArvGi3FrgBMFye-ya-Rse-_7OMLJfjZmtSMeCzubce0yyyrAZ9rDFAT1BGRoCHLwQAvD_BwE (accessed on 25 April 2021).
- Golubchikov, O.; Badyina, A. Sustainable Housing for Sustainable Cities: A Policy Framework for Developing Countries; UN-HABITAT: Nairobi, Kenya, 2012; ISBN 978-92-1-132488-4. [Google Scholar]
- Prosperity of Cities; UN-Habitat (Ed.) The State of the World’s Cities; Routledge: New York, NY, USA, 2013; ISBN 978-0-415-83888-7. [Google Scholar]
- Takewaki, I. New Architectural Viewpoint for Enhancing Society’s Resilience for Multiple Risks Including Emerging COVID-19. Front. Built Environ. 2020, 6, 143. [Google Scholar] [CrossRef]
- Jens, K.; Gregg, J.S. The Impact on Human Behaviour in Shared Building Spaces as a Result of COVID-19 Restrictions. Build. Res. Inf. 2021, 49, 827–841. [Google Scholar] [CrossRef]
- Giacomin, J. What Is Human Centred Design? Des. J. 2014, 17, 606–623. [Google Scholar] [CrossRef] [Green Version]
- Norman, D. The Design of Everyday Things: Revised and Expanded Edition; Basic Books: New York, NY, USA, 2013; ISBN 0-465-07299-2. [Google Scholar]
- Holtzblatt, K.; Wendell, J.; Wood, S. Rapid Contextual Design: A How-To Guide to Key Techniques for User-Centered Design. In Ubiquity; Elsevier: Amsterdam, The Netherlands, 2004; p. 320. ISBN 0-12-354051-8. [Google Scholar] [CrossRef]
- İlçi, V.; Gülal, E.; Alkan, R.M. An Investigation of Different Wi-Fi Signal Behaviours and Their Effects on Indoor Positioning Accuracy. Surv. Rev. 2018, 50, 404–411. [Google Scholar] [CrossRef]
- Bashir, M.R.; Gill, A.Q. Towards an IoT Big Data Analytics Framework: Smart Buildings Systems. In Proceedings of the 2016 IEEE 18th International Conference on High Performance Computing and Communications; IEEE 14th International Conference on Smart City; IEEE 2nd International Conference on Data Science and Systems (HPCC/SmartCity/DSS), IEEE, Sydney, NSW, Australia, 12–14 December 2016; pp. 1325–1332. [Google Scholar]
- Glaeser, E.L.; Gyourko, J.; Saks, R. Why Is Manhattan So Expensive? Regulation and the Rise in Housing Prices. J. Law Econ. 2005, 48, 331–369. [Google Scholar] [CrossRef] [Green Version]
- Un-Habitat. Financing Urban Shelter: Global Report on Human Settlements; United Nations Human Settlements Programme, Ed.; Earthscan: London, UK; Sterling, VA, USA, 2005; ISBN 978-1-84407-211-8. [Google Scholar]
- Steding, D. Coliving: An Emerging Term without a Common Definition. 2019. Available online: http://www.diva-portal.org/smash/get/diva2:1371948/FULLTEXT01.pdf (accessed on 25 April 2021).
- Von Zumbusch, J.S.H.; Lalicic, L. The Role of Co-Living Spaces in Digital Nomads’ Well-Being. Inf. Technol. Tour. 2020, 22, 439–453. [Google Scholar] [CrossRef]
- Maffesoli, M. The Time of the Tribes: The Decline of Individualism in Mass Society; Theory, Culture & Society; Sage: London, UK; Thousand Oaks, CA, USA, 1996; ISBN 978-0-8039-8473-8. [Google Scholar]
- Hardy, A.; Gretzel, U.; Hanson, D. Travelling Neo-Tribes: Conceptualising Recreational Vehicle Users. J. Tour. Cult. Change 2013, 11, 48–60. [Google Scholar] [CrossRef]
- Bergan, T.L.; Gorman-Murray, A.; Power, E.R. Coliving Housing: Home Cultures of Precarity for the New Creative Class. Soc. Cult. Geogr. 2020, 22, 1204–1222. [Google Scholar] [CrossRef]
- Honey-Rosés, J.; Anguelovski, I.; Chireh, V.K.; Daher, C.; van den Bosch, C.K.; Litt, J.S.; Mawani, V.; McCall, M.K.; Orellana, A.; Oscilowicz, E.; et al. The Impact of COVID-19 on Public Space: An Early Review of the Emerging Questions—Design, Perceptions and Inequities. Cities Health 2020, 1–17. [Google Scholar] [CrossRef]
- Google. Coliving Search Term. Available online: https://trends.google.com/trends/explore?date=all&geo=ES&q=coliving. (accessed on 24 July 2021).
- Widdicombe, L. Happy Together: Why Give Up Dorm Life? The New Yorker: New York, NY, USA, 2016. [Google Scholar]
- Cox, H. Communal Living Moves Upmarket in London, New York and Hong Kong. 2016. Available online: https://www.ft.com/content/637dda40-07b0-11e6-9b51-0fb5e65703ce (accessed on 15 May 2021).
- Kadet, A. Co-Living Appeals to Renters Willing to Swap Space For Convenience; Trend, Where Renters Pay for Small Furnished Apartments with Amenities, Is Emerging in Several Cities. Wall Str. J. Online 2017. Available online: https://www.wsj.com/articles/co-living-appeals-to-renters-willing-to-swap-space-for-convenience-1493112601 (accessed on 18 May 2021).
- McAlone, N. The Truth about the ‘Dorms for Adults’ That $16 Billion WeWork Is Betting Its Future On. Bus. Insid. 2016. Available online: https://finance.yahoo.com/news/16-billion-weworks-hugeco151721085.html?guccounter=1&guce_referrer=aHR0cHM6Ly93d3cuZ29vZ2xlLmNvbS8&guce_referrer_sig=AQAAAFsbwfdsIWfa7ndnru7kmRrWn1CTTyEay5beGWPezU2hI0Dcuig9IFHmRFWPMJ9jLKC5B5Z_v0ZCDkt5hh3PqU_88HFacoQYuPQtR8lpZEjGkw0puB_eGHQfH2xcblpC1ydpXh2sCZnNQ0Kj2hEYRV6fZvonGEJwfF6PMe-tms (accessed on 18 May 2021).
- Rañeses, M.K.; Chang-Richards, A.; Wang, K.I.-K.; Dirks, K.N. Housing for Now and the Future: A Systematic Review of Climate-Adaptive Measures. Sustainability 2021, 13, 6744. [Google Scholar] [CrossRef]
- Schmitt, G.N. Information Architecture: Basis and Future of CAAD; Birkhäuser—Publishers for Architecture: Basel, Switzerland, 1999. [Google Scholar]
- Oechslin, W. CAAD Und Geschichte—Computus et Historia. In Architectura et Machina; Vieweg+Teubner: Wiesbaden, Germany, 1993. [Google Scholar]
- Binnekamp, R. Preference-Based Design in Architecture; Delft University Press: Amsterdam, The Netherlands, 2010; ISBN 978-1-60750-550-1. [Google Scholar]
- Loyola, M. Big Data in Building Design: A Review. J. Inf. Technol. Constr. 2018, 23, 259–284. [Google Scholar]
- Deutsch, R.; Aia; Leed, A.P. Leveraging Data Across the Building Lifecycle. Procedia Eng. 2015, 118, 260–267. [Google Scholar] [CrossRef] [Green Version]
- Hay, R.; Samuel, F.; Watson, K.J.; Bradbury, S. Post-Occupancy Evaluation in Architecture: Experiences and Perspectives from UK Practice. Build. Res. Inf. 2018, 46, 698–710. [Google Scholar] [CrossRef]
- Zimring, C.M.; Reizenstein, J.E. Post-Occupancy Evaluation: An Overview. Environ. Behav. 1980, 12, 429–450. [Google Scholar] [CrossRef]
- Candido, C.; Kim, J.; de Dear, R.; Thomas, L. BOSSA: A Multidimensional Post-Occupancy Evaluation Tool. Build. Res. Inf. 2016, 44, 214–228. [Google Scholar] [CrossRef]
- Pereira, P.F.; Ramos, N.M.M.; Simões, M.L. Data-Driven Occupant Actions Prediction to Achieve an Intelligent Building. Build. Res. Inf. 2020, 48, 485–500. [Google Scholar] [CrossRef]
- Whyte, J.; Gann, D.M. Closing the Loop between Design and Use: Post-Occupancy Evaluation. Build. Res. Inf. 2001, 29, 460–462. [Google Scholar] [CrossRef]
- Leaman, A.; Stevenson, F.; Bordass, B. Building Evaluation: Practice and Principles. Build. Res. Inf. 2010, 38, 564–577. [Google Scholar] [CrossRef]
- Cuerdo-Vilches, T.; Navas-Martín, M.Á.; Oteiza, I. Behavior Patterns, Energy Consumption and Comfort during COVID-19 Lockdown Related to Home Features, Socioeconomic Factors and Energy Poverty in Madrid. Sustainability 2021, 13, 5949. [Google Scholar] [CrossRef]
- Alonso, M.; Rubio, A.; Escrig, T.; Soto, T.; Serrano-Lanzarote, B.; Matarredona-Desantes, N. Identification of Measures to Strengthen Resilience in Homes on the Basis of Lockdown Experience during COVID-19. Sustainability 2021, 13, 6168. [Google Scholar] [CrossRef]
- Cuerdo-Vilches, T.; Navas-Martín, M.Á.; Oteiza, I. A Mixed Approach on Resilience of Spanish Dwellings and Households during COVID-19 Lockdown. Sustainability 2020, 12, 10198. [Google Scholar] [CrossRef]
- Monzón-Chavarrías, M.; Guillén-Lambea, S.; García-Pérez, S.; Montealegre-Gracia, A.L.; Sierra-Pérez, J. Heating Energy Consumption and Environmental Implications Due to the Change in Daily Habits in Residential Buildings Derived from COVID-19 Crisis: The Case of Barcelona, Spain. Sustainability 2021, 13, 918. [Google Scholar] [CrossRef]
- Tleuken, A.; Tokazhanov, G.; Guney, M.; Turkyilmaz, A.; Karaca, F. Readiness Assessment of Green Building Certification Systems for Residential Buildings during Pandemics. Sustainability 2021, 13, 460. [Google Scholar] [CrossRef]
- Menezes, A.C.; Cripps, A.; Bouchlaghem, D.; Buswell, R. Predicted vs. Actual Energy Performance of Non-Domestic Buildings: Using Post-Occupancy Evaluation Data to Reduce the Performance Gap. Appl. Energy 2012, 97, 355–364. [Google Scholar] [CrossRef] [Green Version]
- Dodd, N.; Cordella, M.; Traverso, M.; Donatello, S. Level(s)—A Common EU Framework of Core Sustainability Indicators for Office and Residential Buildings; Joint Research Centre (European Comission) JCR Technical Reports. 2017. Available online: https://apo.org.au/node/212346 (accessed on 15 May 2021).
- Martín-Lopo, M.M.; Boal, J.; Sánchez-Miralles, Á. A Literature Review of IoT Energy Platforms Aimed at End Users. Comput. Netw. 2020, 171, 107101. [Google Scholar] [CrossRef]
- Mohammed, M.N.; Desyansah, S.F.; Al-Zubaidi, S.; Yusuf, E. An Internet of Things-Based Smart Homes and Healthcare Monitoring and Management System: Review. J. Phys. Conf. Ser. 2020, 1450, 012079. [Google Scholar] [CrossRef]
- Kojo, I.; Nenonen, S. Typologies for Co-Working Spaces in Finland—What and How? Facilities 2016, 34, 302–313. [Google Scholar] [CrossRef]
- Sailer, K.; McCulloh, I. Social Networks and Spatial Configuration—How Office Layouts Drive Social Interaction. Soc. Netw. 2012, 34, 47–58. [Google Scholar] [CrossRef]
- Konomi, S.; Roussos, G.; Dwivedi, A. Enriching Urban Spaces with Ambient Computing, the Internet of Things, and Smart City Design; Advances in Human and Social Aspects of Technology; IGI Global: Hershey, PA, USA, 2016; ISBN 978-1-5225-0827-4. [Google Scholar]
- Daria, B.; Martina, C.; Alessandro, P.; Fabio, S.; Valentina, V.; Zennaro, I. Integrating Mocap System and Immersive Reality for Efficient Human-Centred Workstation Design. IFAC-Pap. 2018, 51, 188–193. [Google Scholar] [CrossRef]
- Spath, D.; Bauer, W.; Rief, S. Green Office: Ökonomische und Ökologische Potenziale Nachhaltiger Arbeits- und Bürogestaltung; Gabler, Springer-Verlag, Verlag/Springer Fachmedien Wiesbaden GmbH, Wiesbaden: Wiesbaden, Germany, 2010; ISBN 978-3-8349-8952-9. [Google Scholar]
- Bullee, J.-W.; Montoya, L.; Junger, M.; Hartel, P. Physical Location of Smart Key Activators—A Building Security Penetration Test. J. Corp. Real Estate 2018, 20, 138–151. [Google Scholar] [CrossRef] [Green Version]
- Canetti, R.; Krawczyk, H. Analysis of Key-Exchange Protocols and Their Use for Building Secure Channels; Springer: Berlin/Heidelberg, Germany, 2001; pp. 453–474. [Google Scholar]
- Hernández, J.L.; Moreno, M.V.; Jara, A.J.; Skarmeta, A.F. A Soft Computing Based Location-Aware Access Control for Smart Buildings. Soft Comput. 2014, 18, 1659–1674. [Google Scholar] [CrossRef] [Green Version]
- Minoli, D.; Sohraby, K.; Occhiogrosso, B. IoT Considerations, Requirements, and Architectures for Smart Buildings—Energy Optimization and Next-Generation Building Management Systems. IEEE Internet Things J. 2017, 4, 269–283. [Google Scholar] [CrossRef]
- Soheilian, M.; Fischl, G.; Aries, M. Smart Lighting Application for Energy Saving and User Well-Being in the Residential Environment. Sustainability 2021, 13, 6198. [Google Scholar] [CrossRef]
- Lee, A.D.; Chin, R.I.; Marden, C.L. Affordable Housing: Reducing the Energy Cost Burden; (No. PNL-10372); Pacific Northwest Lab.: Richland, WA, USA, January 1995. [Google Scholar]
- Parker, D.S. Research Highlights From A Large Scale Residential Monitoring Study In A Hot Climate. Energy Build. 2003, 35, 863–876. [Google Scholar] [CrossRef]
- Zhao, D.; McCoy, A.P.; Du, J.; Agee, P.; Lu, Y. Interaction Effects of Building Technology and Resident Behavior on Energy Consumption in Residential Buildings. Energy Build. 2017, 134, 223–233. [Google Scholar] [CrossRef]
- Thomas, W.D.; Duffy, J.J. Energy Performance of Net-Zero and near Net-Zero Energy Homes in New England. Energy Build. 2013, 67, 551–558. [Google Scholar] [CrossRef]
- De Blasio, G.; Quesada-Arencibia, A.; García, C.; Molina-Gil, J.; Caballero-Gil, C. Study on an Indoor Positioning System for Harsh Environments Based on Wi-Fi and Bluetooth Low Energy. Sensors 2017, 17, 1299. [Google Scholar] [CrossRef]
- Gao, S.; Prasad, S. Employing Spatial Analysis in Indoor Positioning and Tracking Using Wi-Fi Access Points. In Proceedings of the Eighth ACM SIGSPATIAL International Workshop on Indoor Spatial Awareness, Burlingame, CA, USA, 31 October 2016; Association for Computing Machinery: New York, NY, USA, 2016; pp. 27–34. [Google Scholar]
- Konsolakis, K.; Hermens, H.; Villalonga, C.; Vollenbroek-Hutten, M.; Banos, O. Human Behaviour Analysis through Smartphones. Proceedings 2018, 2, 1243. [Google Scholar] [CrossRef] [Green Version]
- Wang, Y.; Shao, L. Understanding Occupancy and User Behaviour through Wi-Fi-Based Indoor Positioning. Build. Res. Inf. 2018, 46, 725–737. [Google Scholar] [CrossRef]
- Jeng, T. Toward a Ubiquitous Smart Space Design Frame- Work. J. Inf. Sci. Eng. 2019, 25, 675–686. [Google Scholar]
- Walsh, I. Using Quantitative Data in Mixed-Design Grounded Theory Studies: An Enhanced Path to Formal Grounded Theory in Information Systems. Eur. J. Inf. Syst. 2015, 24, 531–557. [Google Scholar] [CrossRef]
- Fettermann, D.C.; Borriello, A.; Pellegrini, A.; Cavalcante, C.G.; Rose, J.M.; Burke, P.F. Getting Smarter about Household Energy: The Who and What of Demand for Smart Meters. Build. Res. Inf. 2021, 49, 100–112. [Google Scholar] [CrossRef]
- Jimenez-Moreno, P. Mass Customisation for Zero-Energy Housing. Sustainability 2021, 13, 5616. [Google Scholar] [CrossRef]
- Williams, J. Designing Neighbourhoods for Social Interaction: The Case of Cohousing. J. Urban Des. 2005, 10, 195–227. [Google Scholar] [CrossRef]
Figure 1.
Evolution trend for the term ‘coliving’ Worldwide in the past 7 years 2014–2021 [
32].
Figure 1.
Evolution trend for the term ‘coliving’ Worldwide in the past 7 years 2014–2021 [
32].
Figure 2.
Flow chart describing methodology and the objectives of the study.
Figure 2.
Flow chart describing methodology and the objectives of the study.
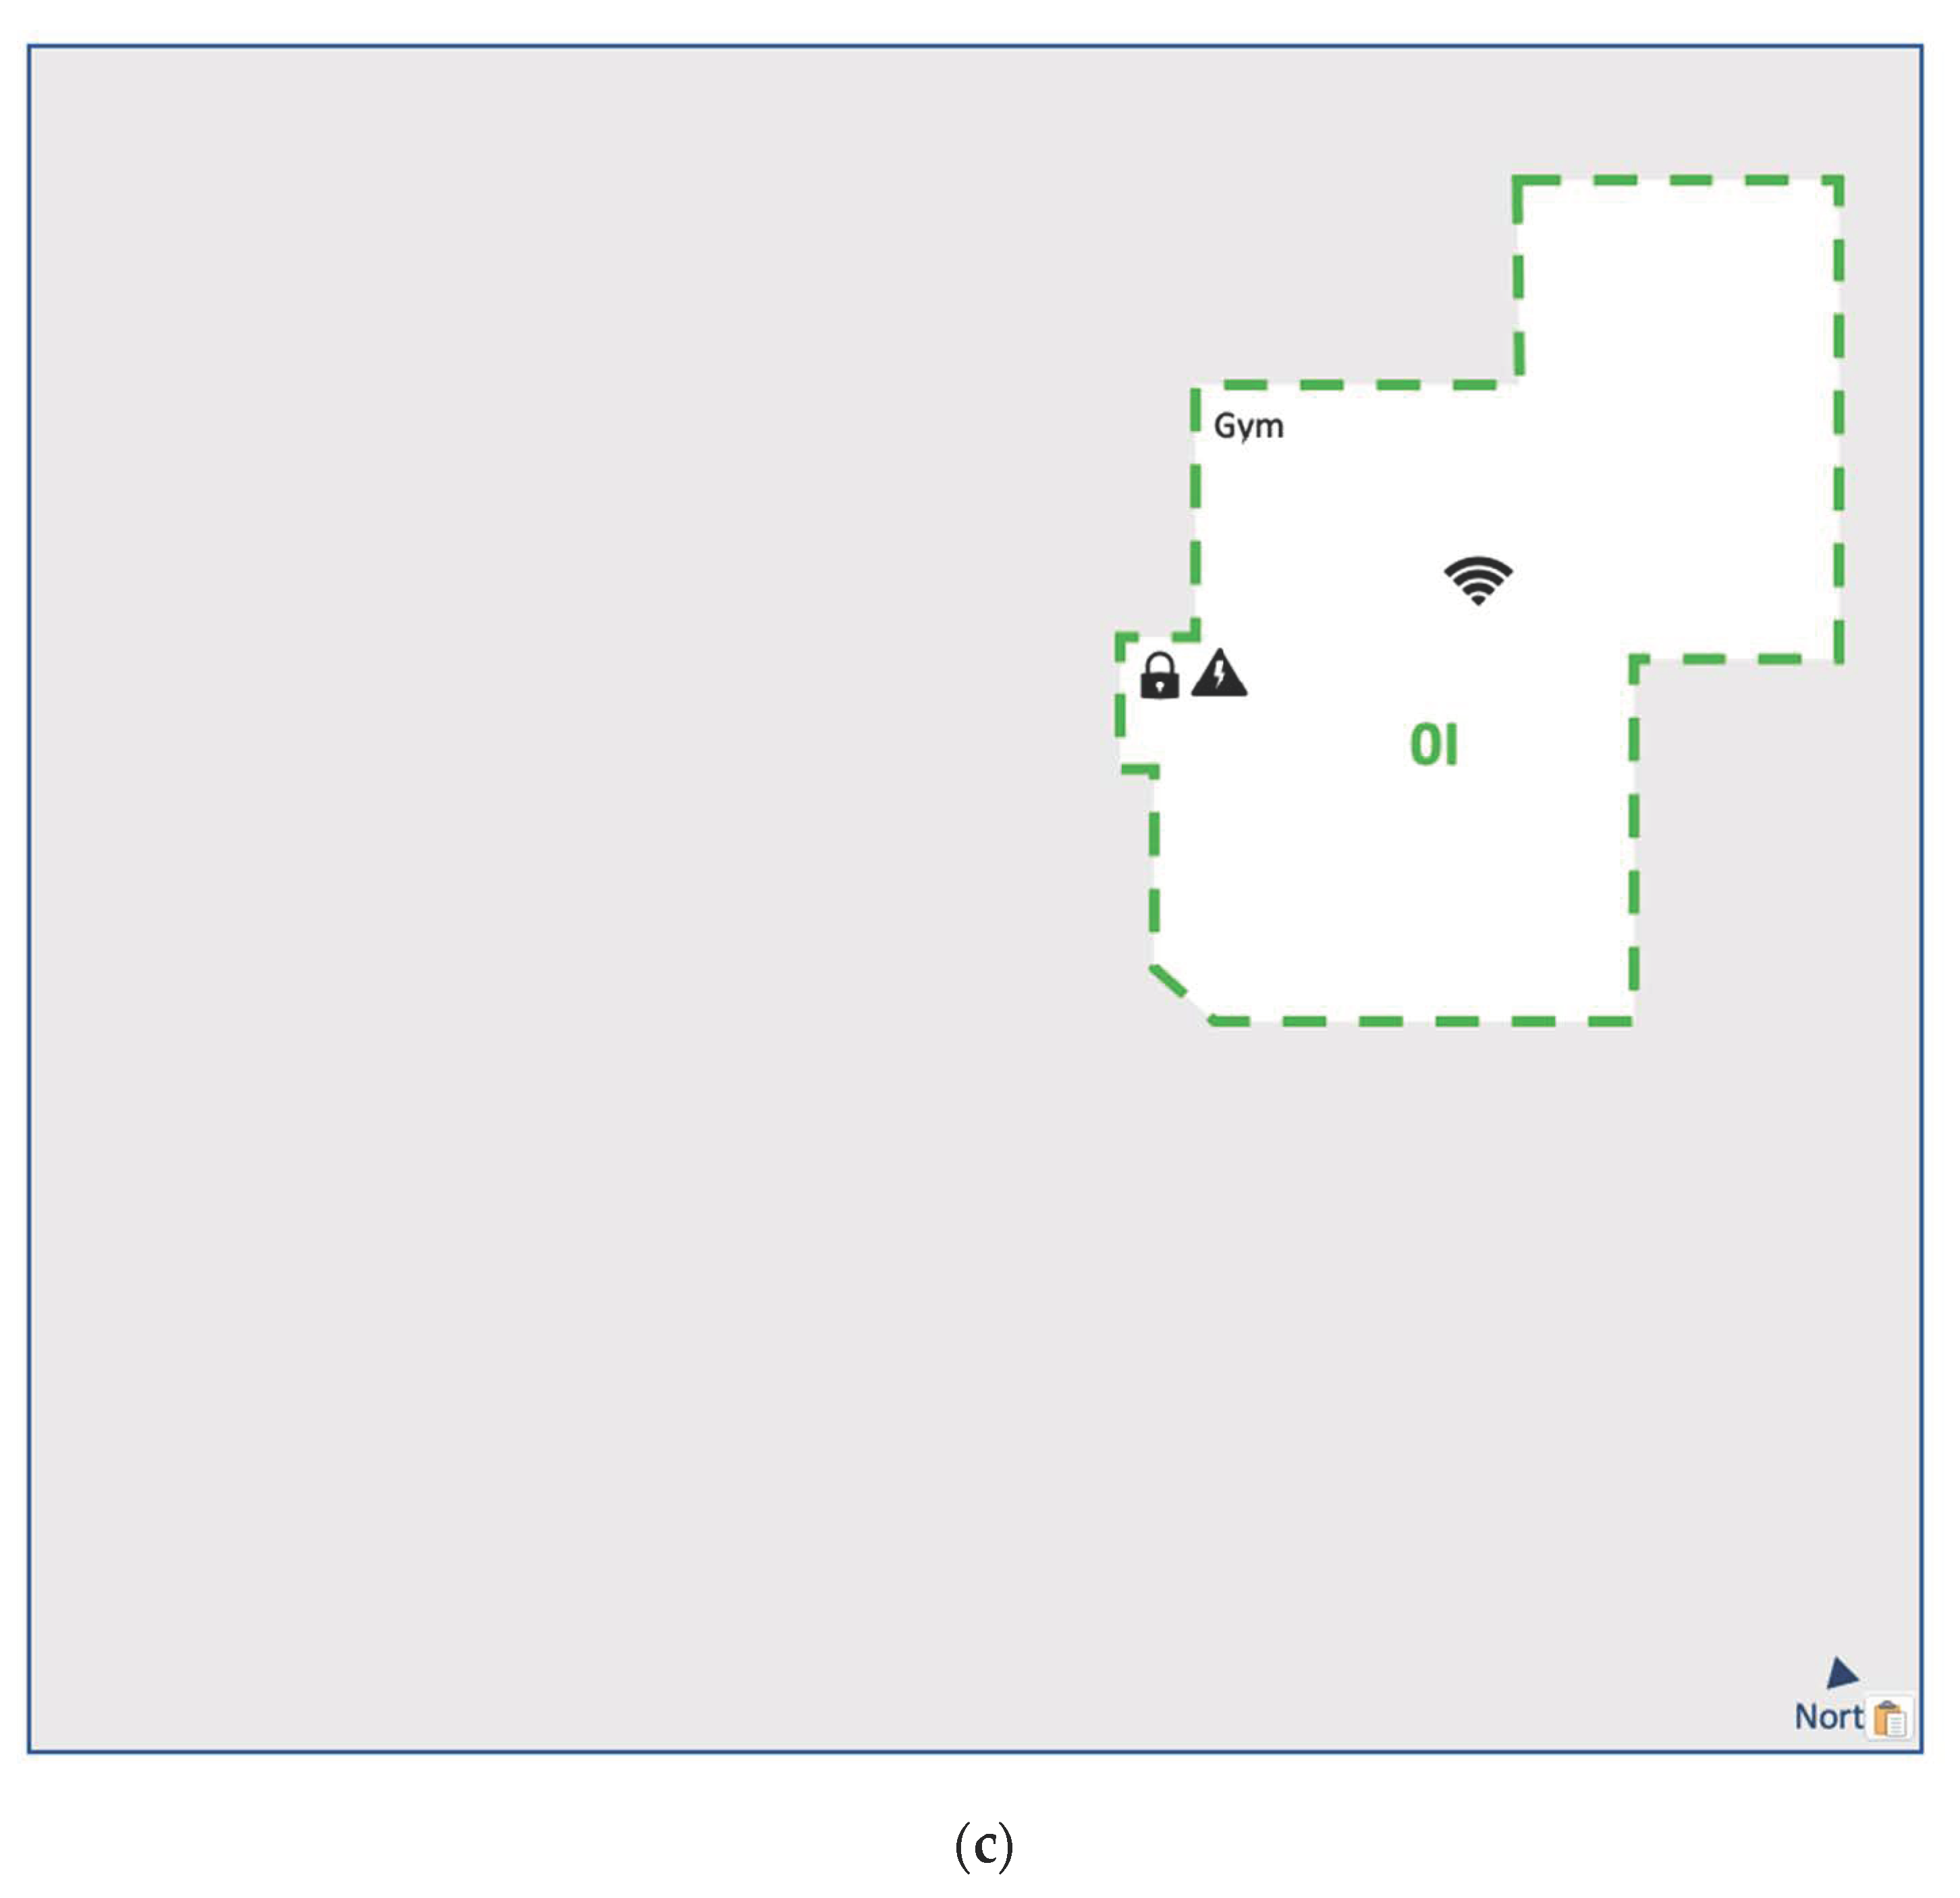
Figure 3.
Schemes of the different spaces studied: (a) Cluster apartments with studio subdivision 1C, 2I, 2D (b) Community Coworking space 6C; (c) Gym (0I).
Figure 3.
Schemes of the different spaces studied: (a) Cluster apartments with studio subdivision 1C, 2I, 2D (b) Community Coworking space 6C; (c) Gym (0I).
Figure 4.
Average yearly electricity consumption per cluster (Average Wh/per hour) data records from 1 June 2020 to 1 June 2021. Visualization with PowerBI.
Figure 4.
Average yearly electricity consumption per cluster (Average Wh/per hour) data records from 1 June 2020 to 1 June 2021. Visualization with PowerBI.
Figure 5.
Seasonal electricity consumption. Electricity consumption per month (a) Community Coworking 6C (b) 1C Cluster Central Space (c) 2D, 2I Cluster lateral spaces in Community Space 6C (Average Wh/per hour) data records from 1 June 2020 to 1 June 2021. Visualization with PowerBI.
Figure 5.
Seasonal electricity consumption. Electricity consumption per month (a) Community Coworking 6C (b) 1C Cluster Central Space (c) 2D, 2I Cluster lateral spaces in Community Space 6C (Average Wh/per hour) data records from 1 June 2020 to 1 June 2021. Visualization with PowerBI.
Figure 6.
Average yearly electricity consumption per weekday (Average Wh/per hour) data records from 1 June 2020 to 1 June 2021. Visualization with PowerBI. (a) 1C Central Cluster with common kitchen, (b) 2D & 2I Lateral Cluster with small kitchen, (c) 6C Community Coworking space.
Figure 6.
Average yearly electricity consumption per weekday (Average Wh/per hour) data records from 1 June 2020 to 1 June 2021. Visualization with PowerBI. (a) 1C Central Cluster with common kitchen, (b) 2D & 2I Lateral Cluster with small kitchen, (c) 6C Community Coworking space.
Figure 7.
(a) Number of visitors per common space weekdays. (b) Visiting routines weekdays. (c) Number of visitors per common space weekends (d) Visiting routines weekends. (e) Visiting routines of the gym. (TAG is every entry by a coliver) from 1 May 2021 to 1 June 2021. Visualization from PowerBI.
Figure 8.
The graphs represent the daily average total devices seen by the APs per hour in the different spaces. (a) Average daily total devices seen per AP. (b) Total devices seen at the gym (0I) per hour, (c) Total devices seen at the Community space Coworking and events (6C) per hour, (d) Total devices seen in the different cluster spaces (2D, 2I, 2I) per hour, Count of De… (Count of Device). From 1 May 2021 to 1 June 2021.Visualization developed with Power BI.
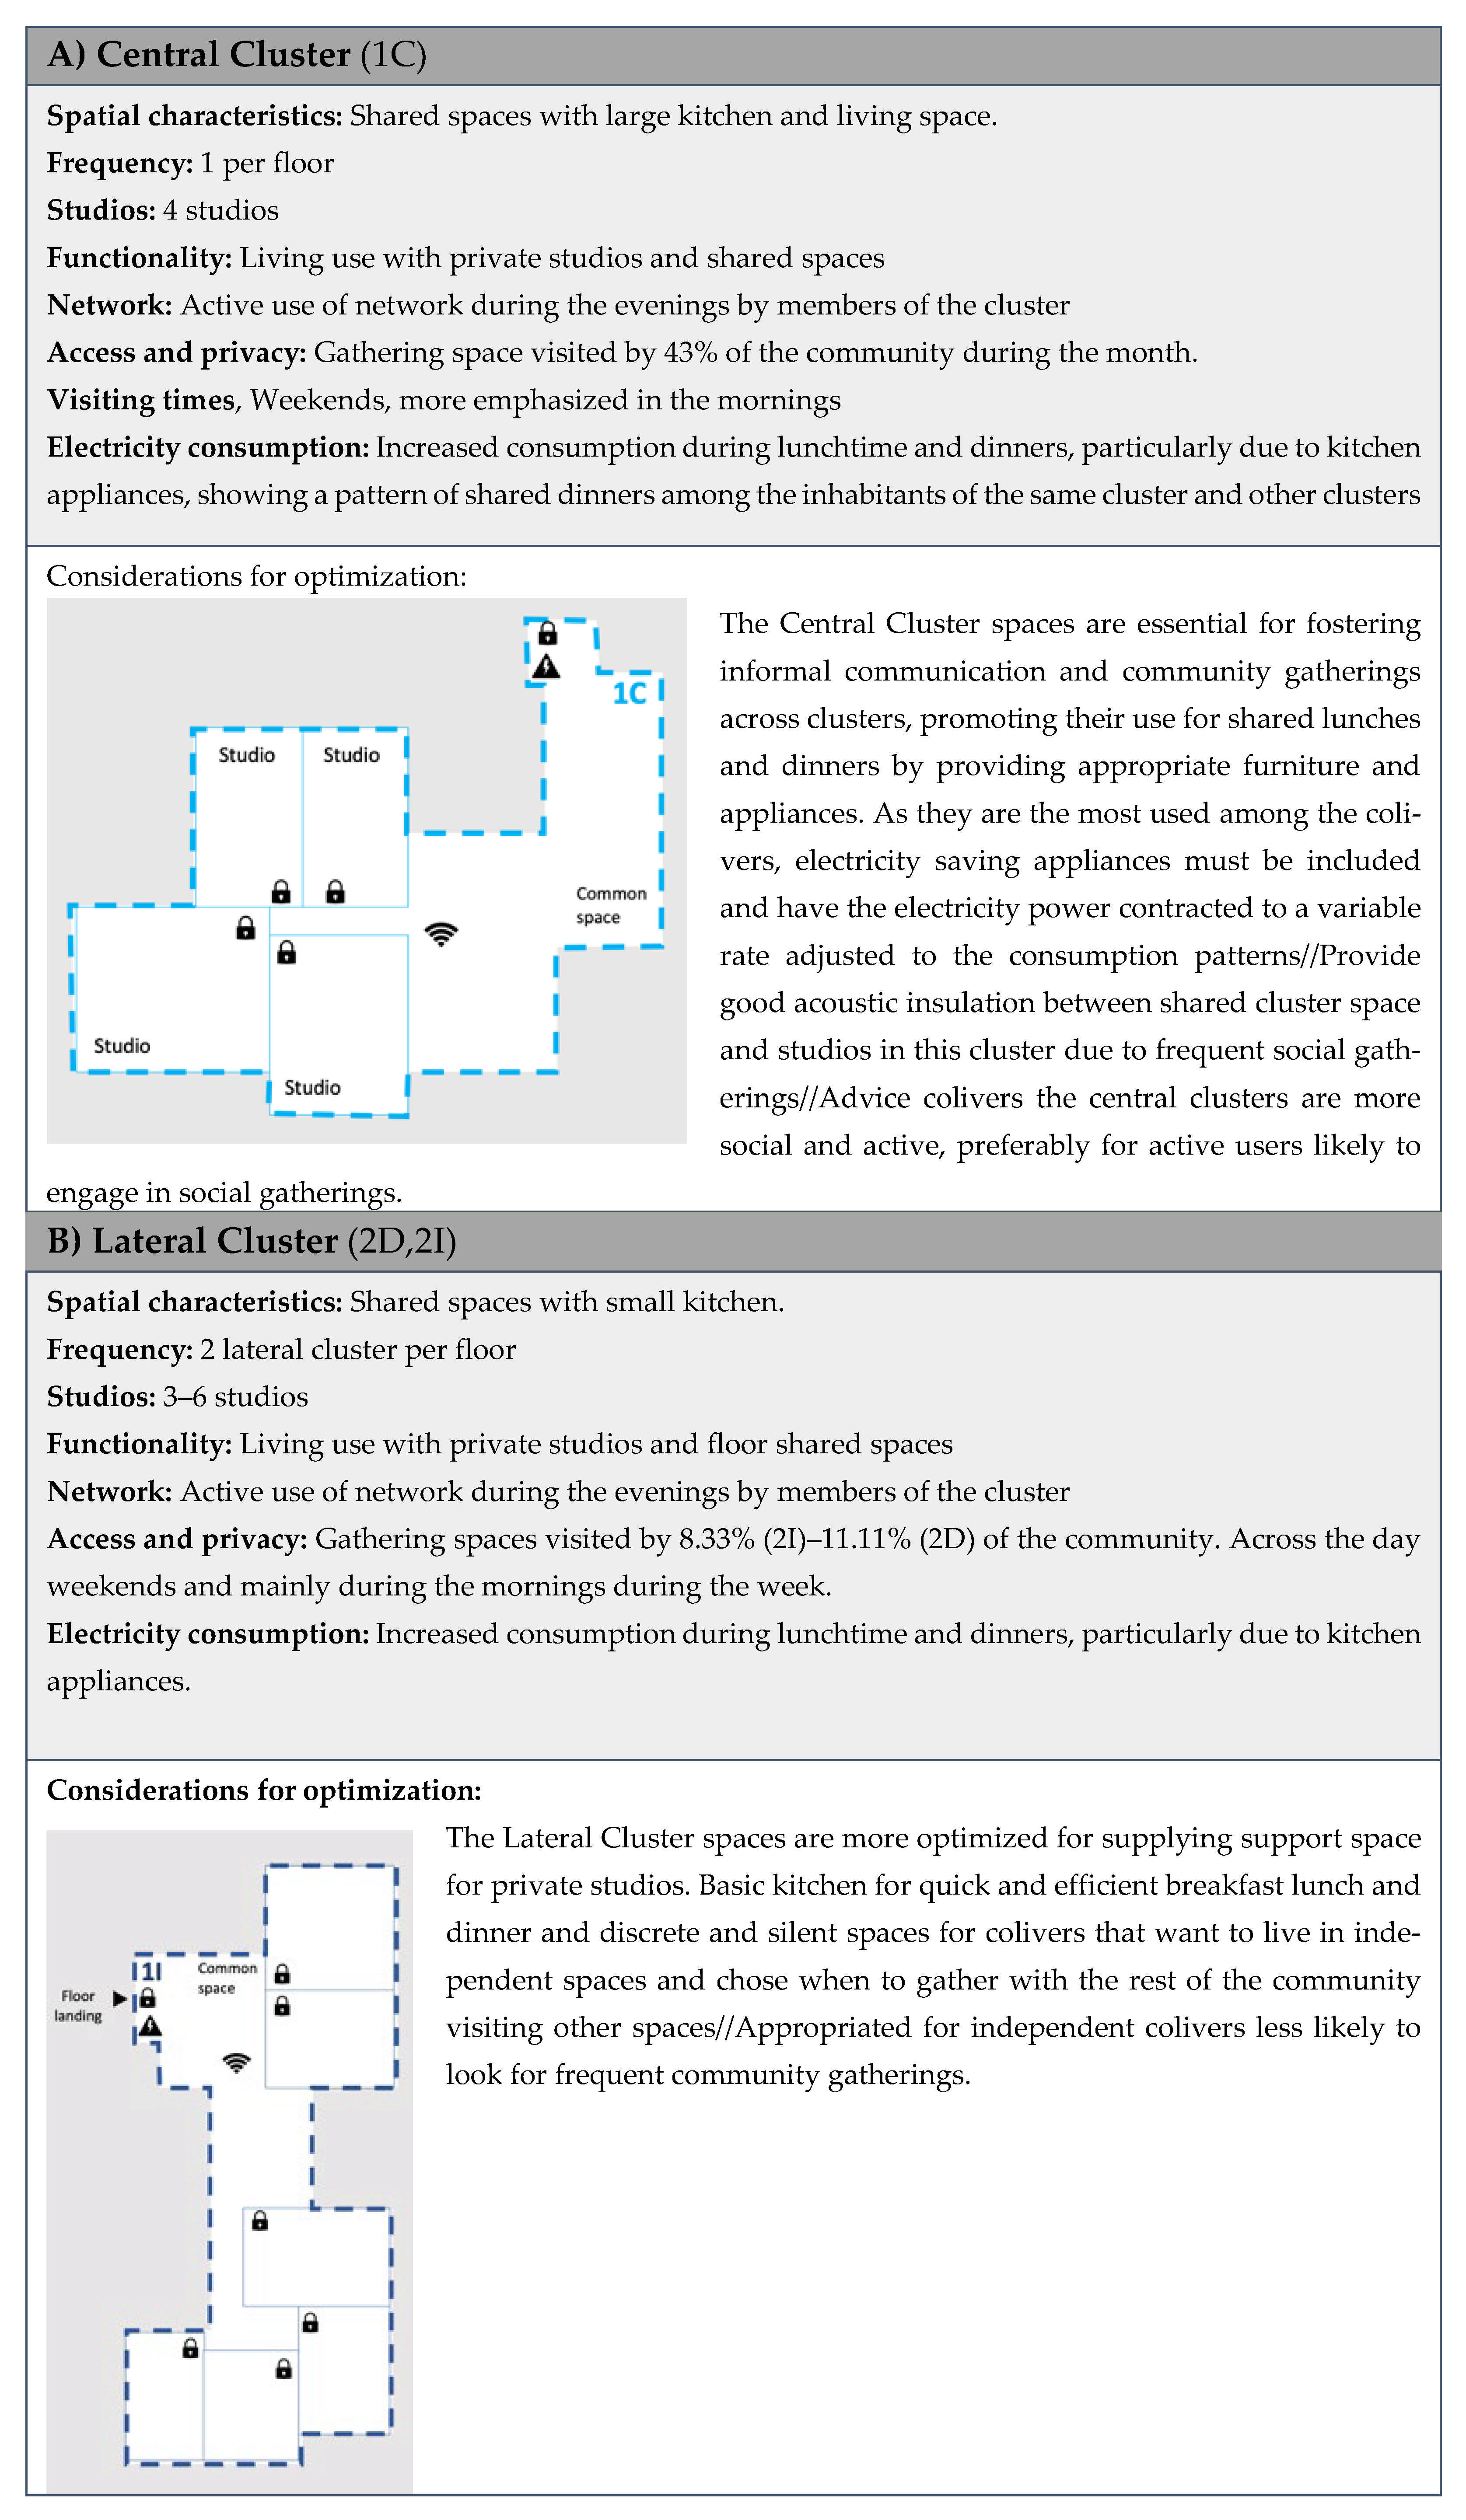
Figure 9.
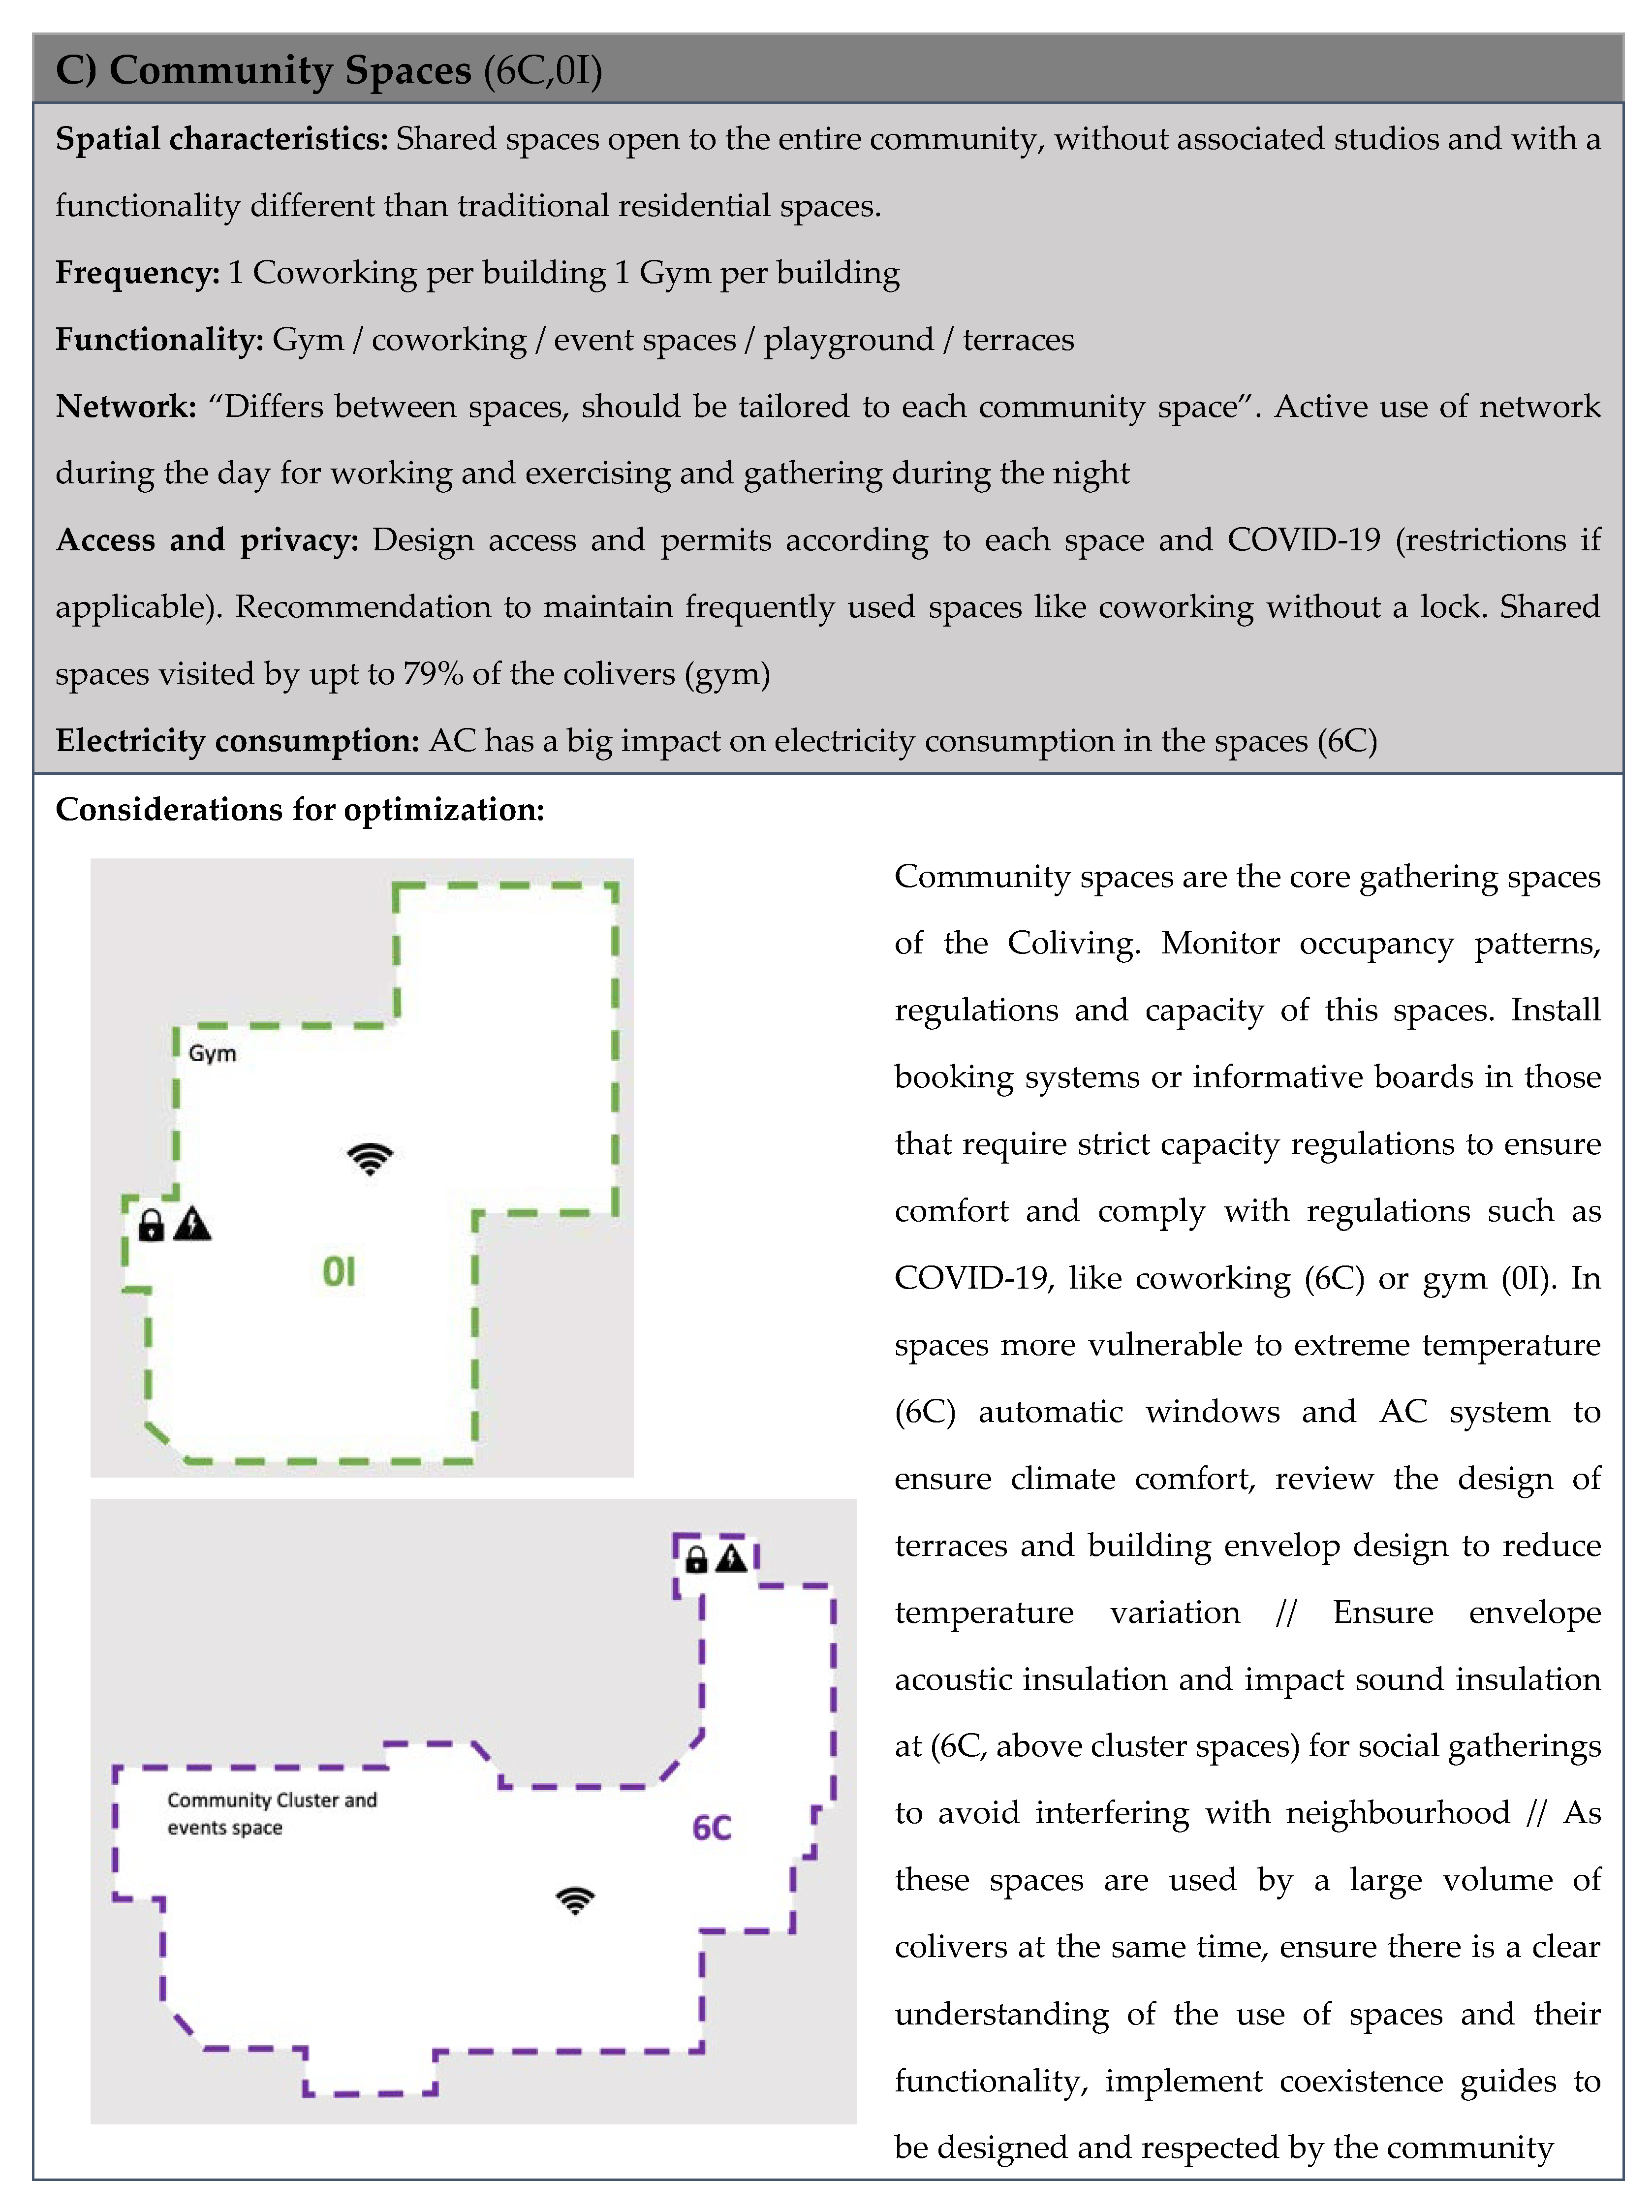
Space profiles (SPs). (A) Central Cluster (1C). (B) Lateral Cluster (2D, 2I). (C) Community Spaces (6C, 0I).
Figure 9.
Space profiles (SPs). (A) Central Cluster (1C). (B) Lateral Cluster (2D, 2I). (C) Community Spaces (6C, 0I).
Table 1.
POE coliving spatial assessment evaluation framework. The variable name is an acronym of the “Description” and a subindex that identifies the phase(s). (1C, 2D, 2I, 6C and 0I are the units of spaces analyzed through the current research).
Table 1.
POE coliving spatial assessment evaluation framework. The variable name is an acronym of the “Description” and a subindex that identifies the phase(s). (1C, 2D, 2I, 6C and 0I are the units of spaces analyzed through the current research).
| Variable | Description | Unit | Evaluation | Device | Sustainability Indicator | Spaces Assessed in the Coliving | Literature |
|---|
| VE | Entries per coliver | # Entries per occupant | Ordinal, low, medium, high | Smart lock | Social | 1C, 2D, 2I, | [63,64,65,66] |
| VH | Entry hours | in or out | Ordinal, out of hours | Smart lock | Social | 1C, 2D, 2I, 0I, 6C | |
| PB | Presence (lights) | Hours | On/Off | SEM (Smart Electricity Meter) | Environmental Financial | 6C | [67] |
| ECA | Electricity consumption | Hours | Activity time and appliances | SEM | Environmental Financial | 1C, 2D, 2I, 0I, 6C | [68,69,70,71] |
| RWB | Computing laptop/data | Hours | Activity time | Wi-Fi | Social | 1C, 2D, 2I, 0I, 6C | [22,72,73,74,75] |
| EB | Cooking/events home appliances | Hours | Activity time, appliances | Wi-Fi
Smart-locks | Social | 1C, 2D, 2I, 0I, 6C | [22,72,73,74,75] |
| Tc | Level of trust | % Open private spaces/Total private spaces | Open/closed | Smart-locks | Social | 1C, 2D, 2I | [68,69,70,71] |
| AA | After-hours activity | Hours | Presence & use of appliances/devices | Smart locks-SEM | Social | 1C, 2D, 2I, 0I, 6C | [68,69,70,71] |
| WABC | Week vs. weekend | Hours | Ordinal, not ordinal | All | Social | 1C, 2D, 2I, 0I, 6C | All the previous |
Table 2.
Physical classification of analyzed spaces. (Size in Net Usable Area NUA). The central cluster is the shared units that correspond to the central apartments in each floor of the building. The lateral cluster corresponds to the apartments situated at the left and right of the central apartment of each floor of the building.
| Space | Typology | Residents | Uses | Access to All Colivers | Size of the Common Space |
|---|
| 2I | Lateral Cluster | 6 | 6 studios + kitchen/living-space | 07:00–23:59 floor residents | 22.88 m2 |
| 2D | Lateral Cluster | 6 | 6 studios + kitchen/living-space | 07:00–23:59 floor residents | 21.15 m2 |
| 1C | Central Cluster | 4 | 4 studios + Large kitchen/living-space | 07:00–23:59 all residents | 62.05 m2 |
| 6C, 0I | Community Space | 0 | Coworking, social area, gym, terraces | 07:00–23:59 all residents | 6C = 156 m2
0I = 60 m2 |
Table 3.
Categorization of locks according to the typology, location, and access permits.
Table 3.
Categorization of locks according to the typology, location, and access permits.
| Typology | Location | Position | Access Permits |
|---|
| Building access lock (password and digital key) | Building main entrance | Open-Locked | Everyone |
| Cluster Cylinder | Cluster access I-C-D/R all Coliving | Open-Locked | Cluster members 24 h
Others 07:00–23:59 |
| Private studio Gateway | Studio access I-C-D studios | Open-Locked-Unlocked | Individual |
Table 4.
Spaces classification according to William’s parameters (Physical parameters). * Studios are private spaces, 1 per Coliving each cluster is connected to 3–6 studios (In Italic to differentiate from the common spaces that will be measured).
Table 4.
Spaces classification according to William’s parameters (Physical parameters). * Studios are private spaces, 1 per Coliving each cluster is connected to 3–6 studios (In Italic to differentiate from the common spaces that will be measured).
| Space | Space Typology | Size
(m2) | % of the Total Building | Proximity
(Distance to Studio) | Ratio
(m2/person) | Privacy Level | Equipment |
|---|
| Lateral Cluster (2I, 2D) | Cluster | 18–22 | 11% | Same apartment
(<1 min) | 2.38 | Semipublic
(Open 07 h-00 h) | Kitchen + small living space |
| Central Cluster (1C) | Cluster | 55–65 | 16% | Same apartment
(<1 min) | 3.57 | Semipublic
(Open 07 h-00 h) | Living room + Large kitchen |
| Gym (0I) | Community | 75 | 4% | Ground-floor
(<5 min) | 0.89 | Public | Fitness and exercise room |
| Community Coworking (6C) | Community | 135 | 7% | Sixth floor
(<5 min) | 1.61 | Public | Coworking, events, coffee corner
sofa area, terrace |
| Studio * | Studio | 8–18 | 59% | N/A | 14.76 | Private | Bedroom + Bathroom |
Table 5.
Percentage of colivers visiting the different shared spaces per weekday, “S” is the % of colivers that visited a space at least once during the sample period. Entrance corresponds to the main gate of the building, therefore 100% of colivers transit it. Visualization from PowerBI. (The numbers are the ordinal representation of the weekdays 1 = Monday, 2 Tuesday…). 1 May 2021 to 1 June 2021.
| Spaces | 1 | 2 | 3 | 4 | 5 | 6 | 7 | S |
|---|
| 1C | 16.7% | 26.4% | 22.2% | 27.8% | 25.0% | 22.2% | 16.7% | 43.1% |
| 2D | 5.6% | 4.2% | 5.6% | 6.9% | 5.6% | 6.9% | 4.2% | 11.1% |
| 2I | % | 6.9% | 6.9% | 6.9% | 6.9% | 6.9% | 6.9% | 8.3% |
| 6C | - | - | - | 1.4% | 4.2%% | 16.7% | 18.1% | 27.8% |
| Entrance | 93.1% | 93.1% | 91.7% | 94.4% | 90.3% | 90.3% | 93.1% | 100.0% |
| Gym | 40.3% | 44.4% | 41.7% | 44.4% | 47.2% | 19.4% | 27.8% | 79.2% |
| Any space | 94.4% | 95.8% | 94.4% | 95.8% | 93.1% | 91.7% | 94.4% | 100% |
Table 6.
Number of colivers visiting each space from 1 May 2021 to 1 June 2021. Visualization from PowerBI.
Table 6.
Number of colivers visiting each space from 1 May 2021 to 1 June 2021. Visualization from PowerBI.
| Space | Gym | 1C | 4C | 5C | 3C | 6C | 4D | 1D | 2C | 3D | 2D | 1I | 6I | 2I | 3I | 6D | Average |
|---|
| Visitor count | 57 | 31 | 25 | 21 | 20 | 20 | 12 | 10 | 10 | 9 | 8 | 7 | 7 | 6 | 5 | 3 | 16.6 |
| (%) from total | 79 | 43 | 35 | 29 | 28 | 28 | 17 | 14 | 14 | 13 | 11 | 10 | 10 | 8 | 7 | 4 | 23 |
| Publisher’s Note: MDPI stays neutral with regard to jurisdictional claims in published maps and institutional affiliations. |
© 2021 by the authors. Licensee MDPI, Basel, Switzerland. This article is an open access article distributed under the terms and conditions of the Creative Commons Attribution (CC BY) license (https://creativecommons.org/licenses/by/4.0/).


 and
and 


