1. Introduction
Business process re-engineering allows optimising processes within businesses. One way to do so is to use lean thinking to maximise customer value whilst minimising waste [
1]. The origins of the lean concept have been traced back in time far beyond the Toyota production system (TPS), where it is typically thought to have originated. The principles of TPS had not been formally documented until 1965, when the Kanban systems were rolled out to Toyota’s suppliers [
2]. Just-in-time is one of the core elements of lean production and is the material flow design upon which the lean production model is founded [
3]. For such a production model to succeed and achieve high efficiency and productivity levels, it needs to have a robust quality management system to achieve the notion of ‘right first time’ and have quality controls at the source to prevent defects from entering the production system altogether [
4,
5,
6].
Defects occur when products are produced outside of agreed tolerances of the approved specification. Defects are a significant contributor to product waste and waste of resources, including raw materials, energy, water, and human resources. A reduction in waste generation helps to boost business performance by lowering environmental, economic and social impacts, i.e., the three pillars of sustainability [
7].
Optimised process monitoring helps identify defects in advance or as they happen in real time [
8]. A key function of the quality control (QC) process is to provide evidence that customer requirements (tolerances) of the product are met [
9]; therefore, measuring and controlling the values of the different variables that regulate the manufacturing processes is critical. However, collecting these values and handling the data manually tends to be slow, tedious, and prone to human error, as data can be misread, misplaced, or misrecorded easily. Furthermore, human judgement may not be consistent due to various factors including fatigue, mental or physical stress [
10], as well as variability in heuristic and cognitive capabilities. Data capturing and analysing technology can be used instead to acquire such data and use it to control processes within acceptable parameters, ensuring optimum product flow and quality. Furthermore, as computing devices get smaller and cheaper, it is increasingly possible to tailor them to meet more needs on the factory floor, enabling machines to gather data, measure key performance indicators, and track operational efficiency [
11].
Data archiving is also necessary so that results can be reviewed later for auditing purposes [
12]. As cloud storage becomes safer, more affordable and with connection speeds that provide quick access, companies are increasingly moving away from paper records [
13]. This change introduces the challenge of reviewing and re-writing internal procedures to capture these new ways of data collection and reporting. It is important to know and prove who does what, when, how, and why [
14] for the purposes of traceability, accuracy, and consistency.
Industry 4.0 aims at automating industrial practices by using concepts and technologies such as the Industrial Internet of Things (IIoT), Big Data and Cloud Analytics. These technologies are driving the digitalisation of supply chains, leading to improvements in operational efficiency, product quality and cost reduction [
15]. Several papers have recently reviewed the rapid digitalisation of industry, e.g., [
16,
17,
18,
19]. However, research focusing on the digitalisation of quality management processes towards an Industry 4.0 paradigm is limited. Leveraging the proliferation of IIoT and data connectivity along with standard quality tools and principles, Quality 4.0 can help organisations on their digital transformation journeys, improving both efficiency and product quality management [
20]. Quality 4.0 integrates directly with the manufacturing system and can enable the detection of non-conforming products in real time so that the QC team can evaluate and resolve issues [
21]. Quality 4.0 is not a substitute for standard quality management systems, but rather it builds and improves them. For instance, mobile devices such as tablets are a way to move away from a paper-based to a digitised process. It allows data to be collected, analysed, and distributed in real time for improved visibility and efficiency [
20,
22], i.e., digitising data, which is one of the pillars of smart manufacturing [
23].
However, due to a lack of know-how, motivation and implementation costs for Industry 4.0 solutions, many small and medium enterprises (SMEs) have not adopted or explored these opportunities yet [
24,
25]. We envisage that by implementing such digitalisation solutions, businesses can reduce defects and therefore minimise waste generation. In this context, this article aims to illustrate how QC processes can be improved in an industrial case study by business process re-engineering. Industry 4.0 technologies and lean principles have been applied to remove or reduce production system waste, in order to improve the efficiency of factory processes and minimise final product defects. This should inspire other food businesses, and potentially other industrial companies, to digitalise their operations. This paper, therefore, caters to the knowledge and development of food quality and sustainability within an Industry 4.0 domain, with a focus on quality management and continuous improvement features (Quality 4.0), and considerations of sustainability principles.
The article is structured as follows:
Section 2 introduces the methodology with the background of the company,
Section 3 identifies the lean-thinking solution,
Section 4 discusses how the solution was implemented,
Section 5 compares the results achieved by the new system with those of the traditional system, and
Section 6 presents the main conclusions of this project, as well as the planned future work.
2. Methodology
This article explores how business process re-engineering by combining lean principles with Industry 4.0 technologies can lead to savings in resources and reductions in waste, as well as improving operational efficiency during the QC process. The case study approach was adopted as it can offer a more detailed evaluation of a complex issue in its real-life context in comparison to survey or interview techniques [
26,
27]. Furthermore, the case study approach provides a step-by-step implementation illustrative example of digitalising the QC process within a factory.
The case study involved the food business Richard Hochfeld Ltd. (RH), a privately-owned company based in Southern England that imports table grapes, apples, and pears from various countries and other regions within the country for supply to major UK retailers. The main site of the business includes offices, a warehouse and a pack-house.
The current QC method in place at RH has been developed over several years. It is in essence a paper-based system where documents are printed, filed in date order, labelled, stored, and archived every six months. It is recommended that the documents should be stored in a safe, locked, cool room for no less than three years [
28]. This is a laborious and time-consuming practice that RH is seeking to change, exploring new digital technologies that have in recent years become more accessible and cheaper [
9].
The project aim is to improve the overall procedure within the pack-house by achieving the following:
Enabling the Line QC team (pack-house QC team completing checks on the factory floor), to accurately and immediately identify defects in the product and react promptly to alleviate them.
Digitalising pertinent information so that it can be accessed and analysed in a timely fashion.
Enabling live data analysis of batches being produced in real time.
Increasing the sample size and reducing the time taken to record data.
Reducing paper wastage.
In order to achieve this, a more detailed study of the current activities in RH is needed, followed by the identification of an adequate strategy to achieve the objectives mentioned above. This is presented in the next section.
3. Identification of the Improvement Solution
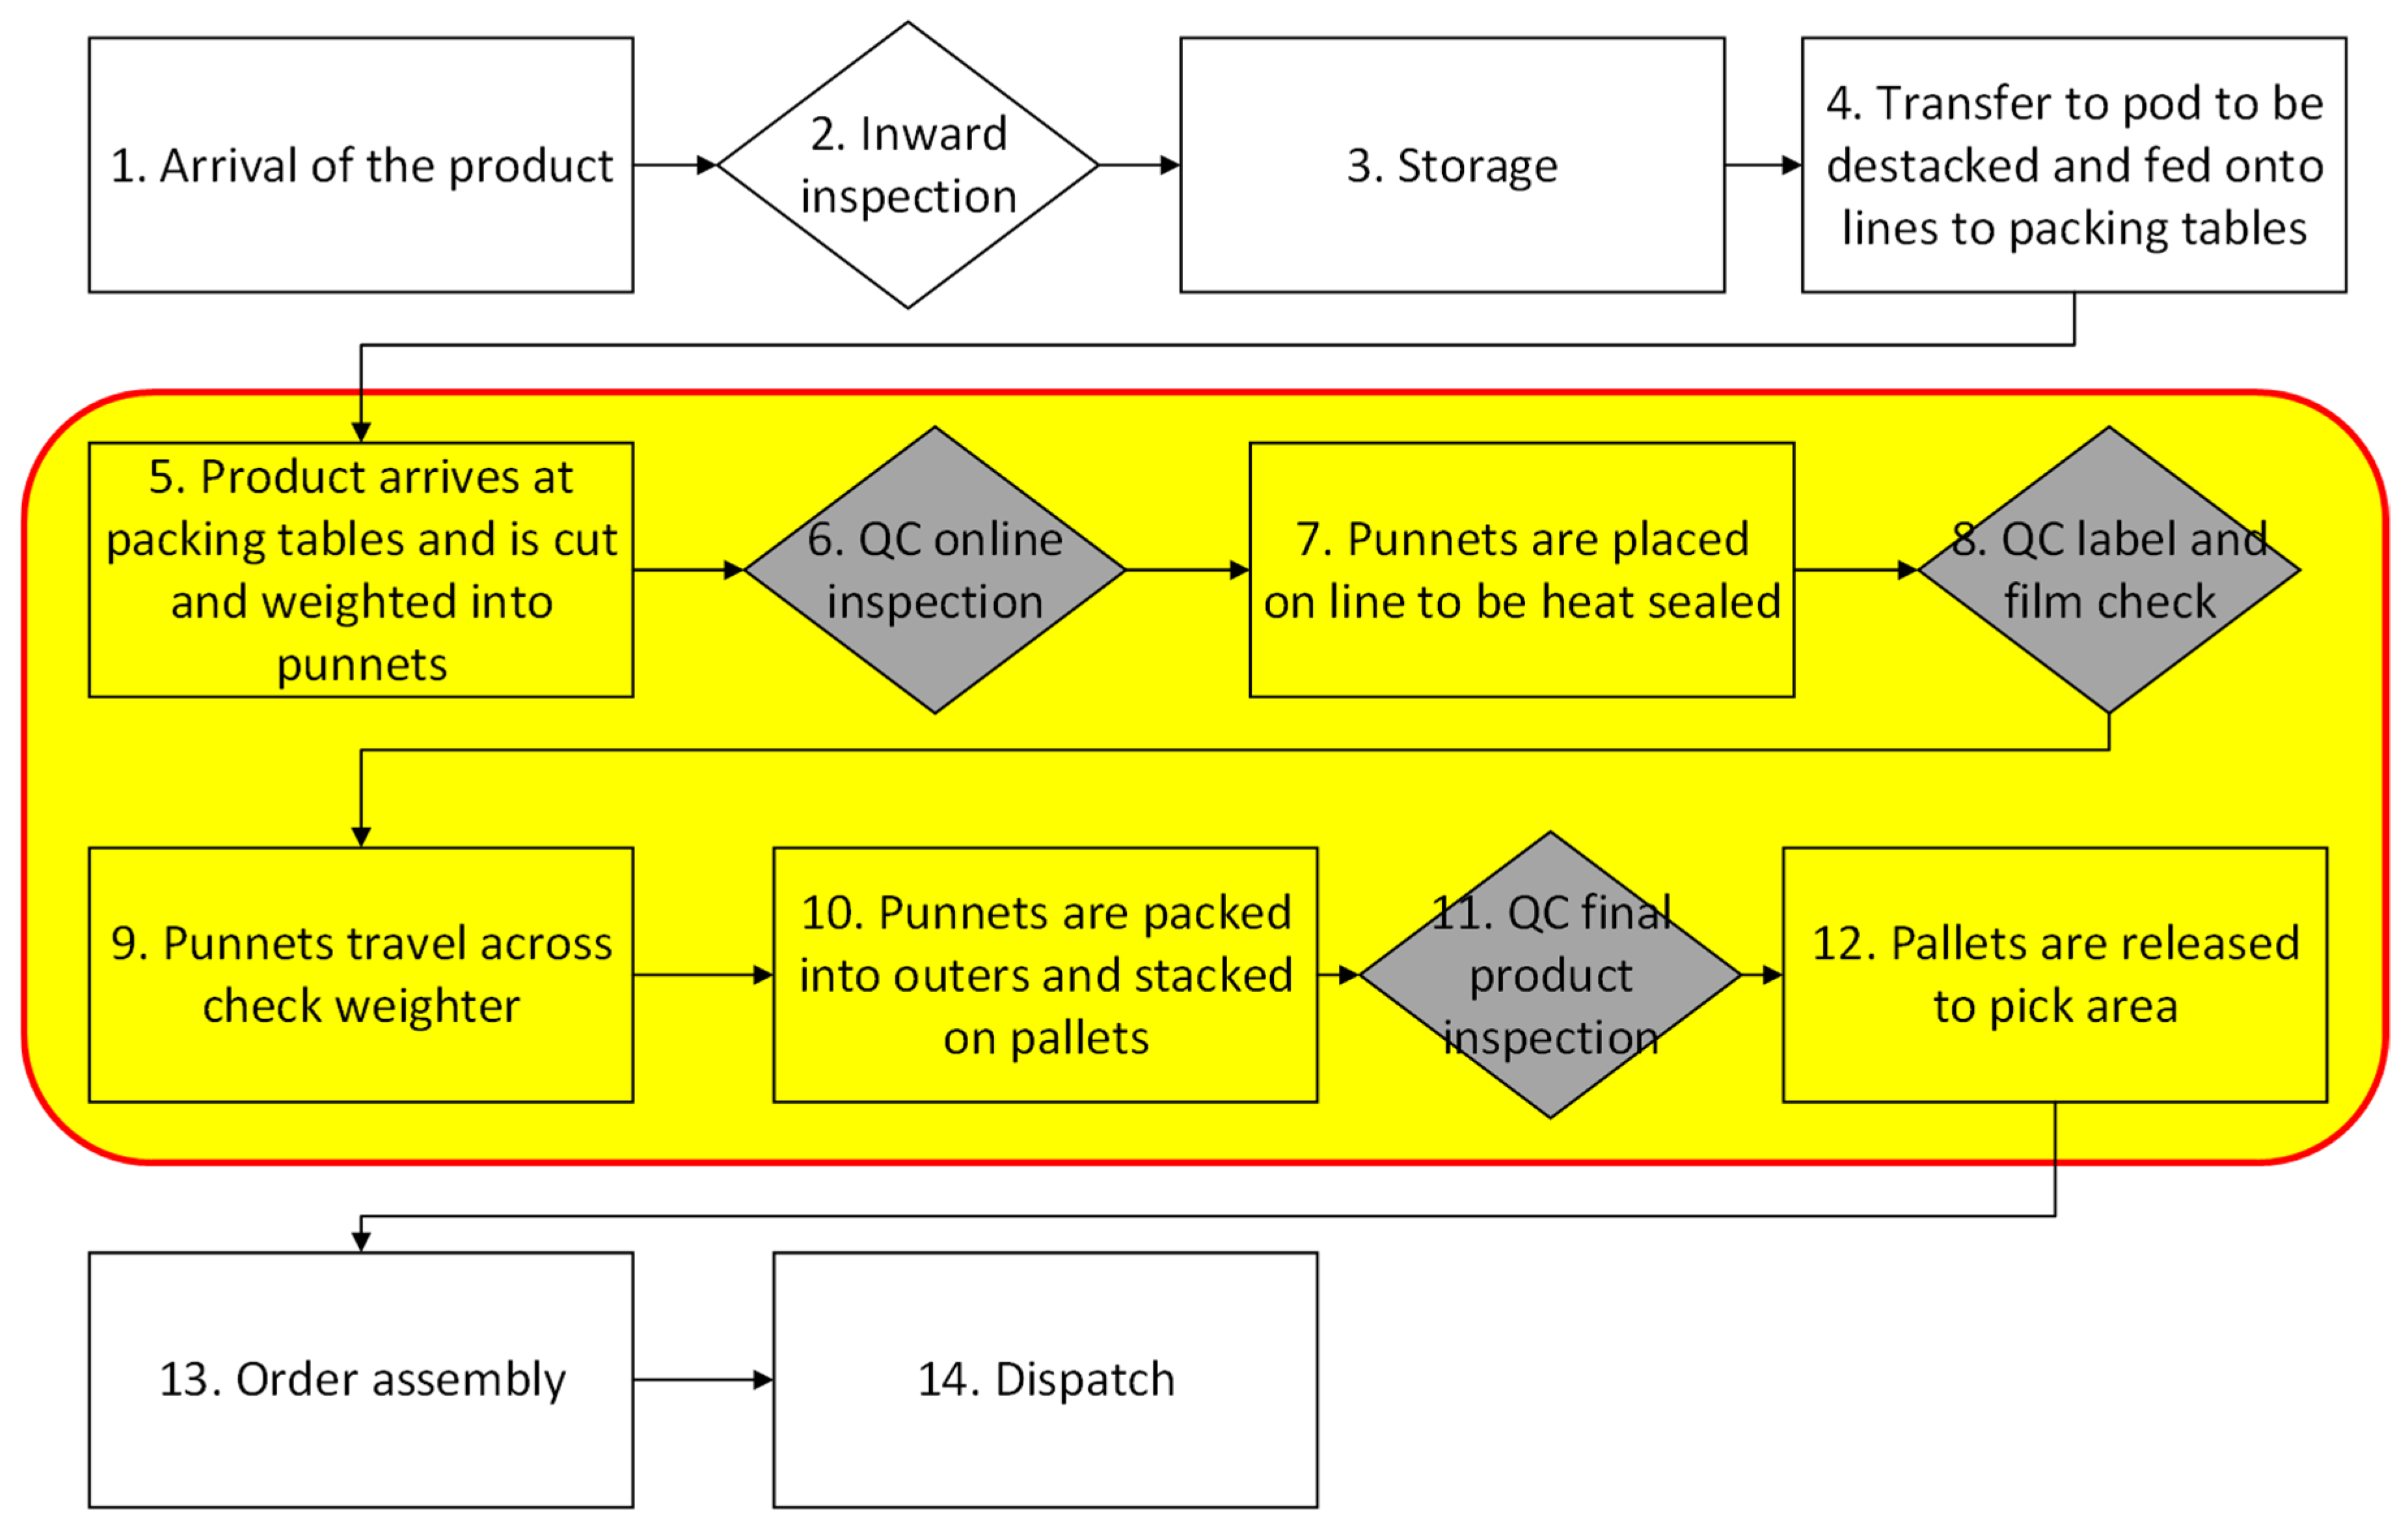
Figure 1 shows the fourteen processes involved from the arrival of the fruit products at RH until they are dispatched to clients. This project is focused on the QC function within the pack-house (highlighted in yellow in
Figure 1). The rhombus represents the inspection step, and the grey-coloured rhombus denotes the QC process. The pack-house has 127 linked weighing stations and five dynamic check-weighers that allow RH to produce batches that conform to an average weight requirement, known as the Three Packers Rules [
29].
Following an analysis of the processes in the pack-house, three types of wastes were identified:
Defects: the fruit product that does not meet customer’s specifications at the first test must be reworked.
Uneconomical: the current paper-based reporting system does not add any real value and is expensive, as it needs people to physically record it and store the paperwork for a minimum of 5 years. The paperwork acts a proof of quality checks and for traceability purposes in case of recall or customer complaints. However, this information is of no use to the pack-house team.
Transport: the physical paperwork produced must be filed, moved and stored, taking up time and space before it is finally disposed of.
Furthermore, talent waste has also been identified, as the Line Quality Control (LQC) team is currently spending time and effort to complete and manage the paperwork when their efforts can be utilised for some other important tasks.
The LQC team also comes under pressure from the line leaders (whose main objective is to ensure high productivity) to pass products that have been processed. Empowering the QC team, allowing them to act upon their findings in real time and improve the overall quality of the end product, should also help keep the team motivated and feel that their work is more valued. Important influences on worker satisfaction are found in the opportunities for workers to use their skills, as well as promotion opportunities, and relationships with supervisors and co-workers [
30]. This means that the importance placed on the task being delegated to an employee can be a key factor in their motivation to perform at a high level [
30].
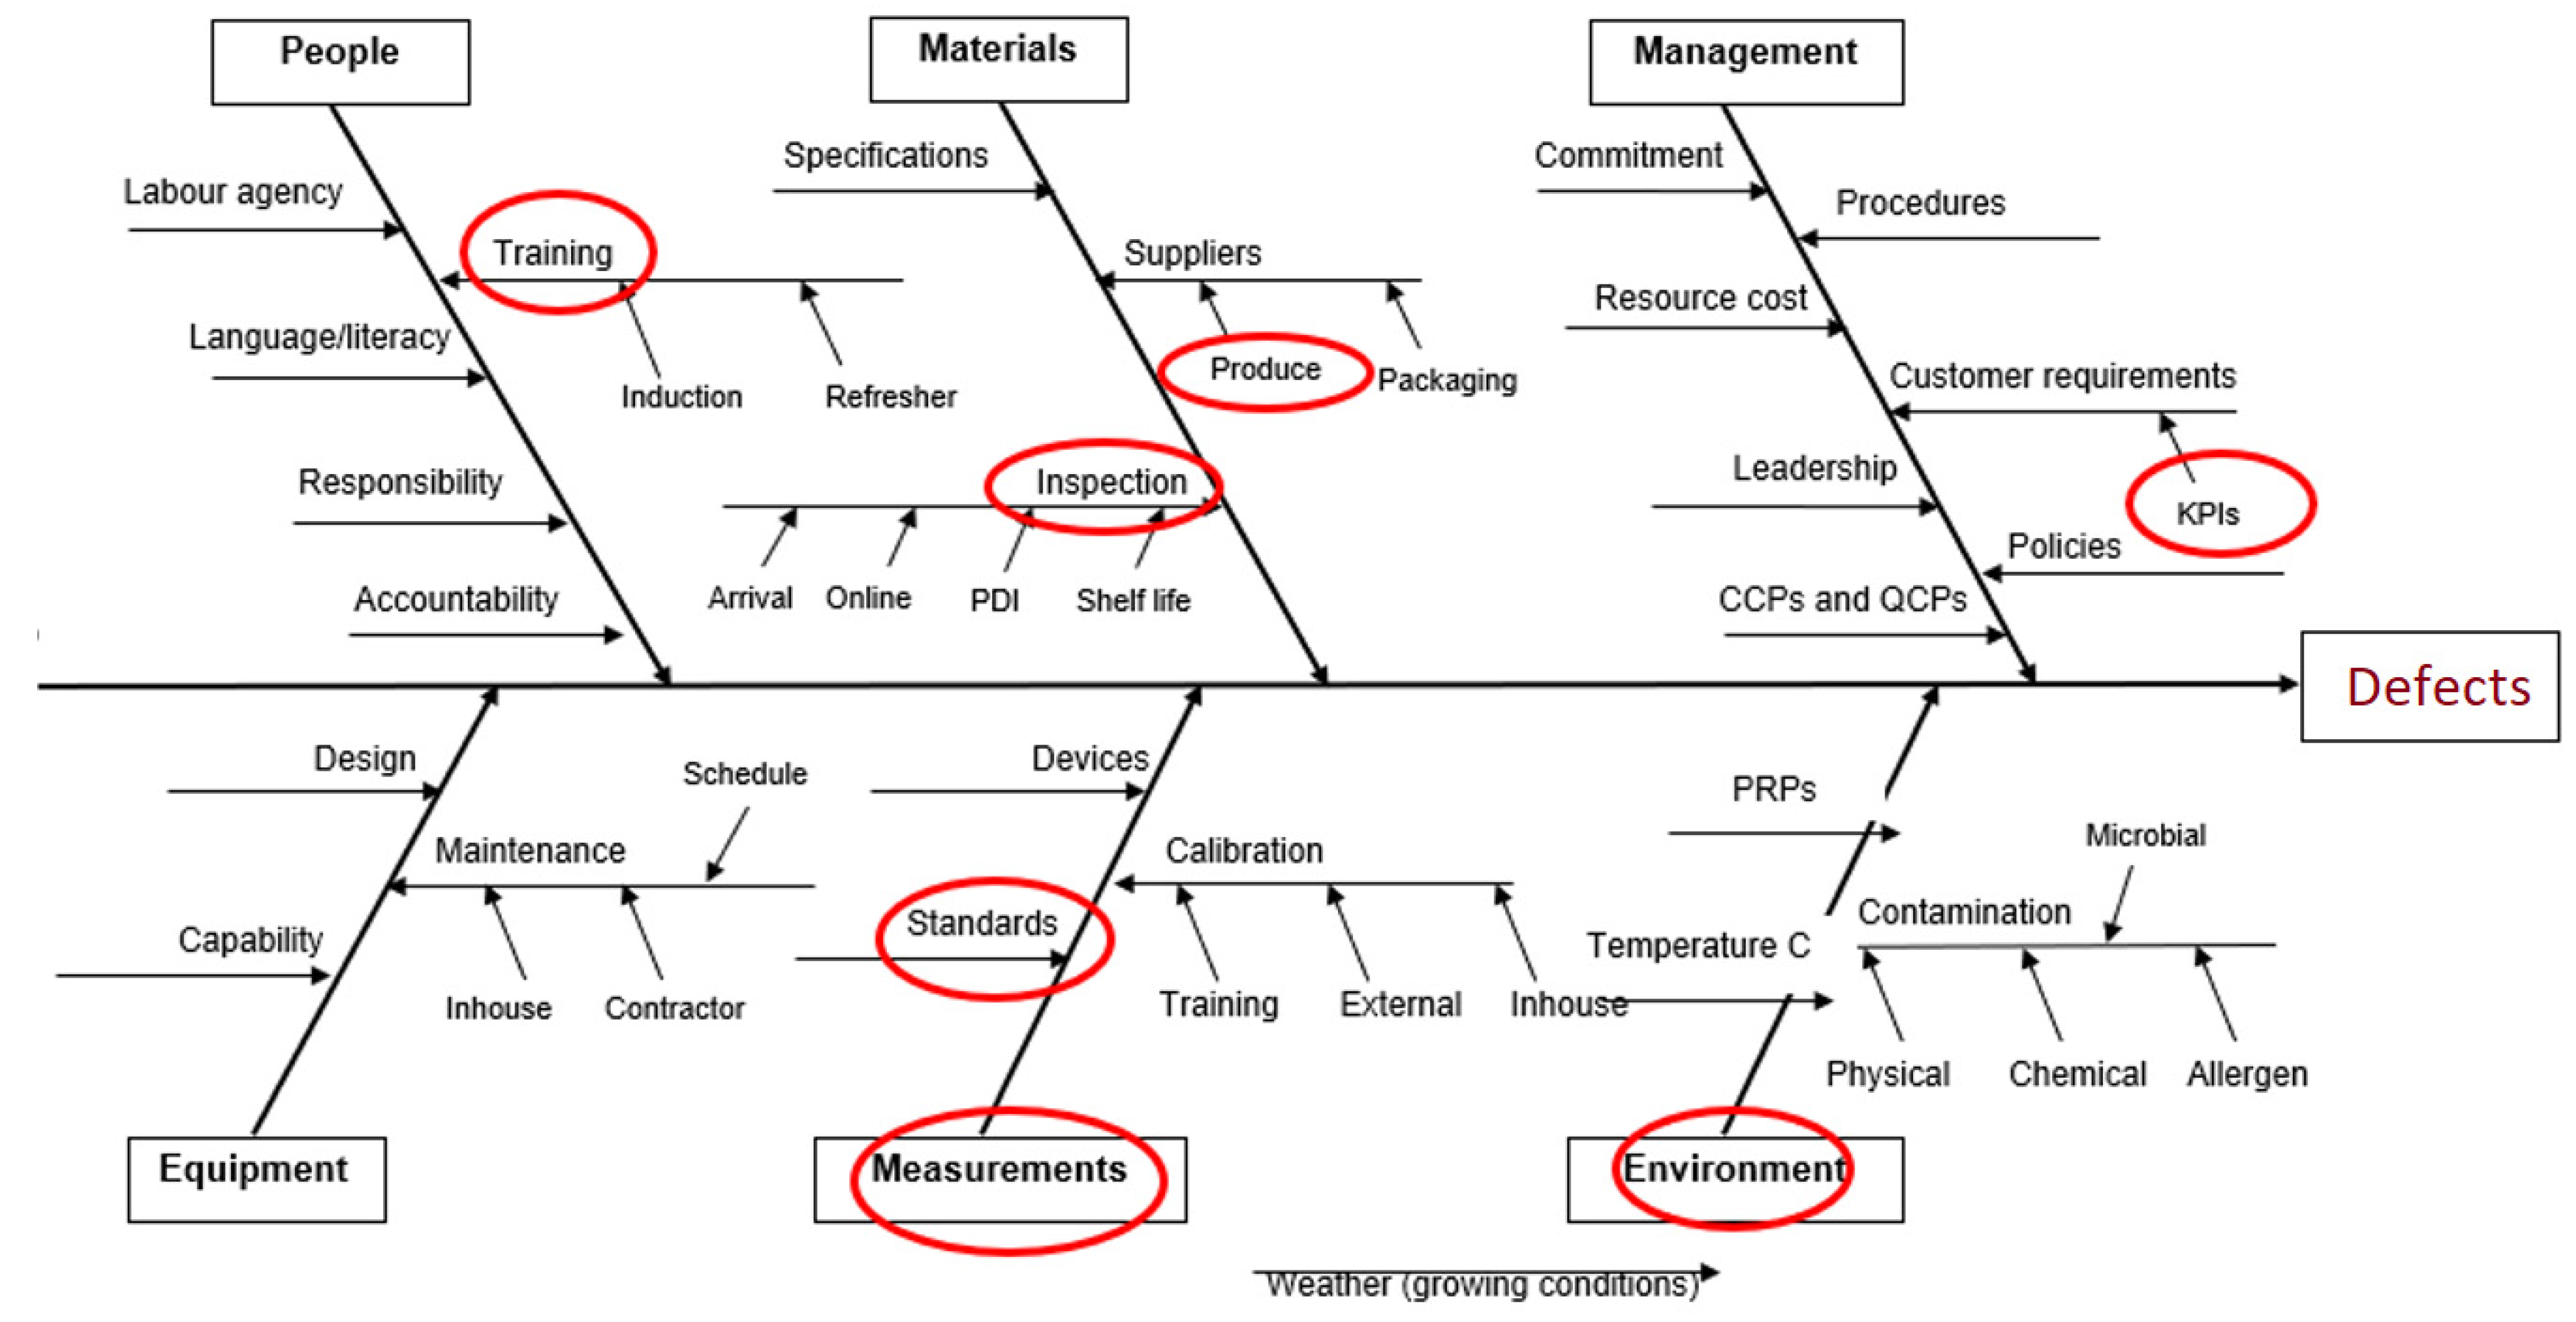
An Ishikawa diagram or fishbone diagram (
Figure 2) was developed to identify where the root cause of the defects may occur. Key aspects identified (circled in red) were the effects of the environment, produce received, the inspection process, measurements following standards, training received by the staff and key performance indicators (KPIs) from customer requirements. These key aspects have been considered on the basis of the historical data available and the reasons behind the defects. The acronyms used in
Figure 2 and their abbreviations are as follows: PDI: pre-delivery inspection, CCPs: critical control points, QCPs: quality control points, and PRPs: prerequisite programmes (good hygienic practices).
Following further investigation, it was found that only 0.9% of the final product in the pack-house inspection is recorded to confirm that the product meets the customer standards. The information from this inspection is handwritten on an inspection form. Once the job is finished, this is filed, and the information recorded is generally not reviewed unless a rejection occurs upon customer receipt. The paperwork must then be filed and eventually stored before it can be disposed of after three years.
Furthermore, when interrogating the data from the final product checks following a rejection at the customer’s depot, it was noted that the documentation did not offer any evidence of the problem experienced at the depot. If there are no data that can explain the problems experienced at the depot, the system is not controlling product quality effectively but merely serves to fulfil the minimum needs to comply with customer and independent audit bodies’ traceability requirements. Exploring the root causes of this, it was found that the LQC team, responsible for checking and recording the quality of the product being produced on the factory floor, was spending large amounts of time completing “cumbersome forms and collecting physical label samples”, thereby neglecting the assessment of the quality of the finished product and not having enough time to work with the packers to reduce defects in the product.
Another issue is that the sample size of the final check was found to be too small to be significant because the batch produced can be delivered to the final customer over several depots. Each depot completes a minimum check that corresponds to the order size delivered. These checks take too long to complete and report. Consequently, by the time the LQC has completed the checks for an individual pallet, the whole pallet is finished. The LQC is then under pressure from the line leader (whose main concern is productivity) to approve the pallet as suitable for supply. The information that the LQC has collected is often wasted at this point and only exists for traceability purposes in the event of a rejection or recall by a customer (or mock recall by a certification body). The quality manager (QM) has attempted to increase sampling using the current system; however, due to the inherent time constraints of the process, this was considered unworkable for the LQC team.
The retailer that buys from RH determines the initial sample size for inspection upon receipt at each of their depots to verify whether the lot is in or out of tolerance and should be kept or rejected. A lot is the amount of a single product delivered to one of their distribution depots in a daily order. This lot may be just a small part of the batch that was produced on a single job at RH. The average sample size for the initial inspection is five per cent. Once the lot size is greater than 1000 units, the maximum sample size is 16 per cent. Therefore, to ensure that RH can provide empirical evidence for the particular pallet delivered to the individual retailer distribution depot from any given batch, the sample size required must be increased. Consequently, RH decided to increase the percentage of the final product that is inspected to a minimum of 9%. Since 1100 is the total number of punnets per standard pallet, this will mean that 100 punnets for every 1100 punnet produced must be inspected.
RH produces on average 157,000 punnets per day. These are generally packed with ten punnets per outer with 110 outers per finished pallet (an average of 142.7 pallets per day). There are eight main stock-keeping units, with three of them making up more than 60% of the daily orders. Each pallet produced has a unique pallet number that is associated with the job number. The job number provides traceability, both back to the raw material that has been used to produce the finished product and forward to the customer depot. The job number is used both by the software that controls the weight in the pack-house through to the system that is used to control inventory and invoicing.
Each pallet produced has on average two pieces of QC paperwork that accompany it: an online check and the final product check. Other checks that are performed are the QC start-up check, the online label check and the Machine Minder (operator) checks. For each packing job of ten pallets, we can estimate that 25 pieces of paper are produced, which need to be filed and stored for a minimum of three years. This results in approximately 129,500 pieces of paper each year that is of no practical use.
The Technical Director and QM at RH showed interest in digitalising data collection and remove the paperwork from the packing lines to reduce the time the LQC team spends on recording and reviewing checks, ensuring that they can target the most important aspects of the inspection. Following conversations with RH staff, it was suggested to introduce a tablet-based quality check (TBQC) system into the pack-house to digitise QC. The concept of using an electronic tablet that can allow multiple users to complete questionnaires in a repeatable way has been proven useful, allowing experiments to be saved and giving instant access to results [
31]. This idea should support RH in employing lean-thinking principles within their processes to ensure QC checks are executed to reduce both physical waste and the use of resources during production. Digitising the checks could also allow monitoring of quality in real time and interrogation of the data at a later date. This should enhance the quality of the information being collected, with the additional possibility of taking photographic evidence where appropriate. Consequently, the LQC team will have more time to train the packers on the line to reduce the number of products being produced that contain defects. The QM also believes that increasing the inspection size and giving the QC team a view of their results in real time will increase their confidence and make them feel empowered to make further improvement decisions. Furthermore, by digitising the checks, the information produced will be live. It will enable the LQC team, QM and pack-house manager to react quickly to bring any product out of tolerance into conformity in good time if it falls short of predetermined standards.
The TBQC solution was further investigated by looking for existing digital solutions in the market within the fresh produce sector. Three businesses were identified, which offered a similar solution of hiring their equipment and software and receiving support for an annual fee. They provided an off-the-peg solution, which would not allow for interrogation of the data collected within these systems, instead being forced to rely on the provider to run seasonal reports and analyses. Furthermore, they do not integrate with the software that is already employed throughout the pack-house. In conjunction with the technical director and the QM of RH, it was decided that a better solution was to develop a bespoke solution with the help of an automation and technology company with whom RH has already worked in the past. This would allow RH to tailor the reports and information to suit their needs.
Following the identification of the TBQC solution, the project objective was defined in detail following the SMART criteria [
32]:
Specific: to substitute the traditional paper-based quality check (PBC) with a novel tablet-based quality check (TBQC).
Measurable: the following parameters will be measured for both check systems: time spent to complete the recorded checks, time spent with packers, the proportion of punnets identified containing defects, economic costs and LQC’s satisfaction.
Achievable: RH has set up a collaboration with an experienced automation and technology company that will support the development and implementation of the TBQC. The project objectives were signed off by the Managing Director at RH.
Relevant: the approach and solution proposed to follow line-thinking principles that are expected to allow RH to improve the overall performance of the business and reduce waste.
Time-bound: the project should be completed by October 2019.
The next section describes how the solution identified in this section was implemented.
4. Implementation
The new software developed for the TBQC integrates directly into the existing software that controls the average weight system within the pack-house. The tests carried out are linked directly to the job number. When the line leader sets up a new job on the software, the tests required by the LQC automatically load onto the software. These tests have their minimum and maximum tolerances set by the customer to ensure the product is measured within the set parameters. If the results are outside the set parameters, the software indicates that the product is not within the tolerance and advises the LQC team that action must be taken. Furthermore, the results are visible in real time to the Pack-house Manager, QM, line leaders and QC team by a dashboard capable of displaying the results of the checks carried out for each of the six lines in real time, showing minor, major, unacceptable, and waste defects.
4.1. Preliminary Comparison between Both Checks
A comparison between the PBC and the new TBQC procedures was performed to identify the information that could be collected under each procedure. With the PBC, four paper documents are generated: packing instructions, online check, punnet scaling check and final product check. With the TBQC, data are collected in five stages: QC start-up, online check 1, online check 2, punnet scaling check and final product check. This shows that the TBQC provides an extra opportunity for the LQC team to evaluate the product’s quality and intervene to make improvements where necessary. Each of these data-collection points, as well as how they are affected by PBC and TBQC procedures, are described below.
The QC start-up check requires the LQC team to check and complete the job information and ensure that the raw material and label information being used is correct. This must be completed prior to production to avoid human error. The ability to review this information with confidence that it has been completed correctly and at the right time is of great importance if required for future reference. Although this step is also performed in the PBC system, no physical document is generated.
The packing instructions form is performed only in the PBC procedure. The Machine Minder must manually tick boxes in the form to confirm the line has been cleared from previous jobs and is ready for use. They must also gather a copy of the printed film and labels that are required for the job and attach them to the paperwork, recording the batch numbers of any packing used. This process is time-consuming and cumbersome, as it requires scissors to cut out the film and sticky tape to attach it to the paper. Digitising this process allows the batch numbers to be recorded and removes the need to collect the physical labels and film, using the tablet to capture the image.
The online checks require a series of ticks to indicate that each punnet has been packed to conform with basic specifications. The introduction of the TBQC guides the LQC to complete a processing check for each scale (workstation) on the line. This ensures that each packer is being checked and allows the QM to identify packers who require additional training. This is followed by a timed check that highlights any major or minor defects seen by the LQC. With the PBC, no information about what the defects identified are or what action was taken to rectify them is recorded. With the TBQC, the LQC not only identifies the defect but also captures an image that is uploaded directly to the test. The time of the checks is noted at exact 15-min intervals, and digitising the checks ensures that the actual time of the check is precisely recorded.
The punnet sealing check form requires the punnet seal and print quality to be verified every 15 min. The Machine Minder is responsible for checking and signing that this has been done. With the TBQC, the test is timed stamped and photographic evidence is collected showing that the print quality is adequate.
The final product check form contains information that can be used to check that the product meets the tolerance for the customer, measuring attributes such as soluble sugar levels (brix°), berry size, loose berries (shatter), the number of bunches used to comprise an individual unit and physical defects seen within the punnet. These attributes must be calculated to ascertain whether the product is within tolerance. This check must be completed for each pallet that is produced in a batch. A batch may be just a single pallet or up to 26 pallets. With the PBC, the LQC team cannot analyse the data being collected in real time to see the trend of major or minor defects across the batch. Completing the form with the PBC and calculating the result is time-consuming and limits the number of punnets that can be checked in time to allow the LQC to make a reasonable judgement about whether the product is within tolerance. With the TBQC, the QM, line leaders and pack-house manager can view the data in real time. Furthermore, by digitising this check, the information gathered is simplified, and the brix° check has been removed from the final check to the online check, as fruit with low brix° should not reach the final product stage.
Potential drawbacks and challenges of introducing the novel TBQC system have been identified and will be closely monitored. The most relevant ones are:
Cost of implementation and ongoing cost to support the system
Need for new skills and training of staff
Introducing additional complexity in daily operations
New security threats
However, these drawbacks may be compensated by an overall reduction in the number of defects and rejection by customers in the long run. In addition, it is expected that the staff will improve their skillsets by being exposed to new technology. Finally, using the technology over a period of time will reduce its complexity and plug any security threats.
4.2. Project Plan
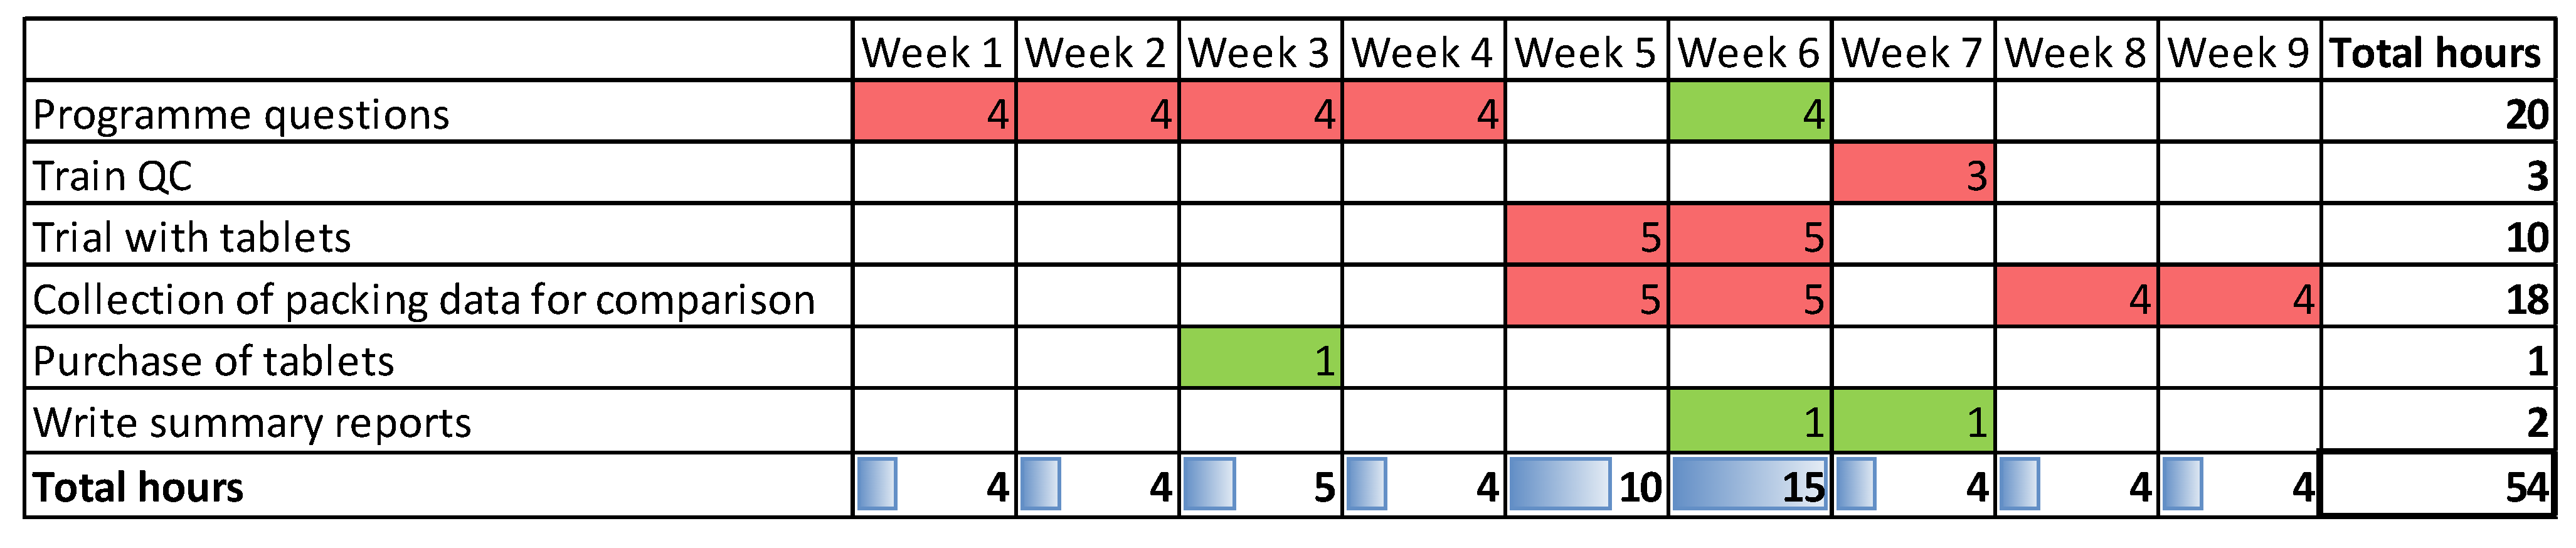
Figure 3 shows the Gantt chart of the project, with the time in hours allocated for each task divided per week. The project took 9 weeks to complete; therefore, the objective of completing the project by October 2019 was met. A total of 54 h was needed to implement the solution and successfully complete the project. The most intensive week was week 6, with 15 h of work. The first task of the project, named “programme questions”, was the most resource intensive at 20 h. The Gantt chart shows the critical path in red.
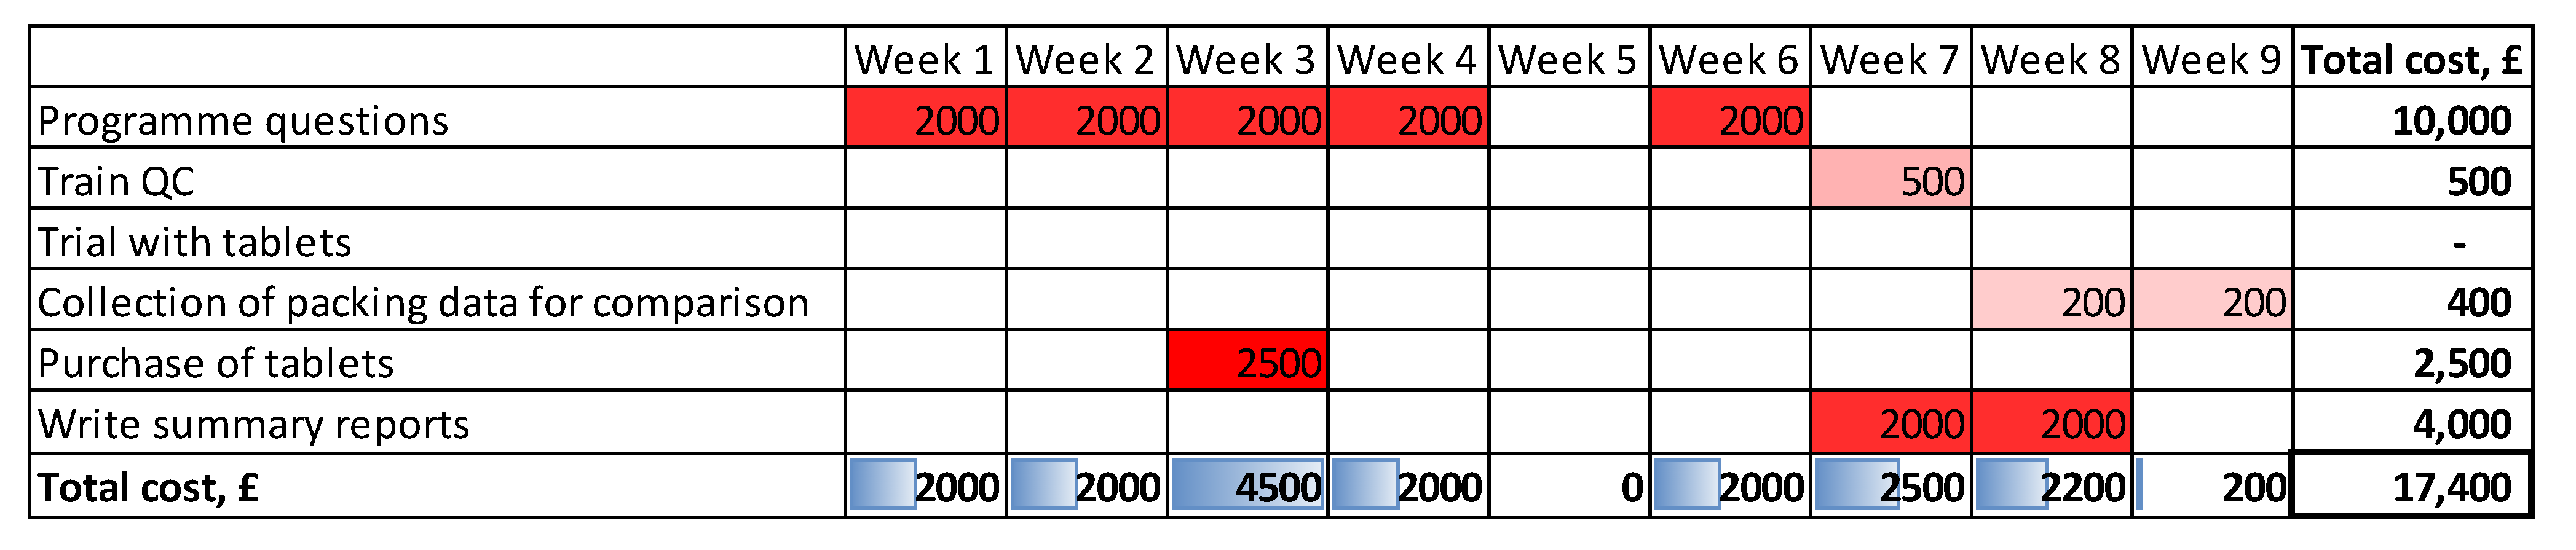
Figure 4 shows the economic costs of implementing the project, with the cost of each task divided per week. The total cost of implementing the project was £17,400. The week with the highest cost associated was week 3, which is when the tablets were purchased. The “programme questions” task had associated the highest cost, at £10,000. This task required more hours of work to be completed, as shown in
Figure 3. It must be noted that the cost of software development was borne by the automation and technology company, which provided the programmers and knowledge required. This company will retain all the rights to the application and will sell it alongside their current offerings.
5. Results and Discussion
Following the implementation of the TBQC solution, a series of tests were carried out to make sure the new system outperforms the traditional PBC procedure. Forty jobs were monitored over one week to measure the following parameters for both PBC and TBQC:
time taken to complete a single pallet of 1100 punnets
time taken by the LQC to complete the quality check
time the LQC spends with the packers on the line once the quality check is complete
number of unsatisfactory punnets identified by the LQC team during processing when completing the quality check
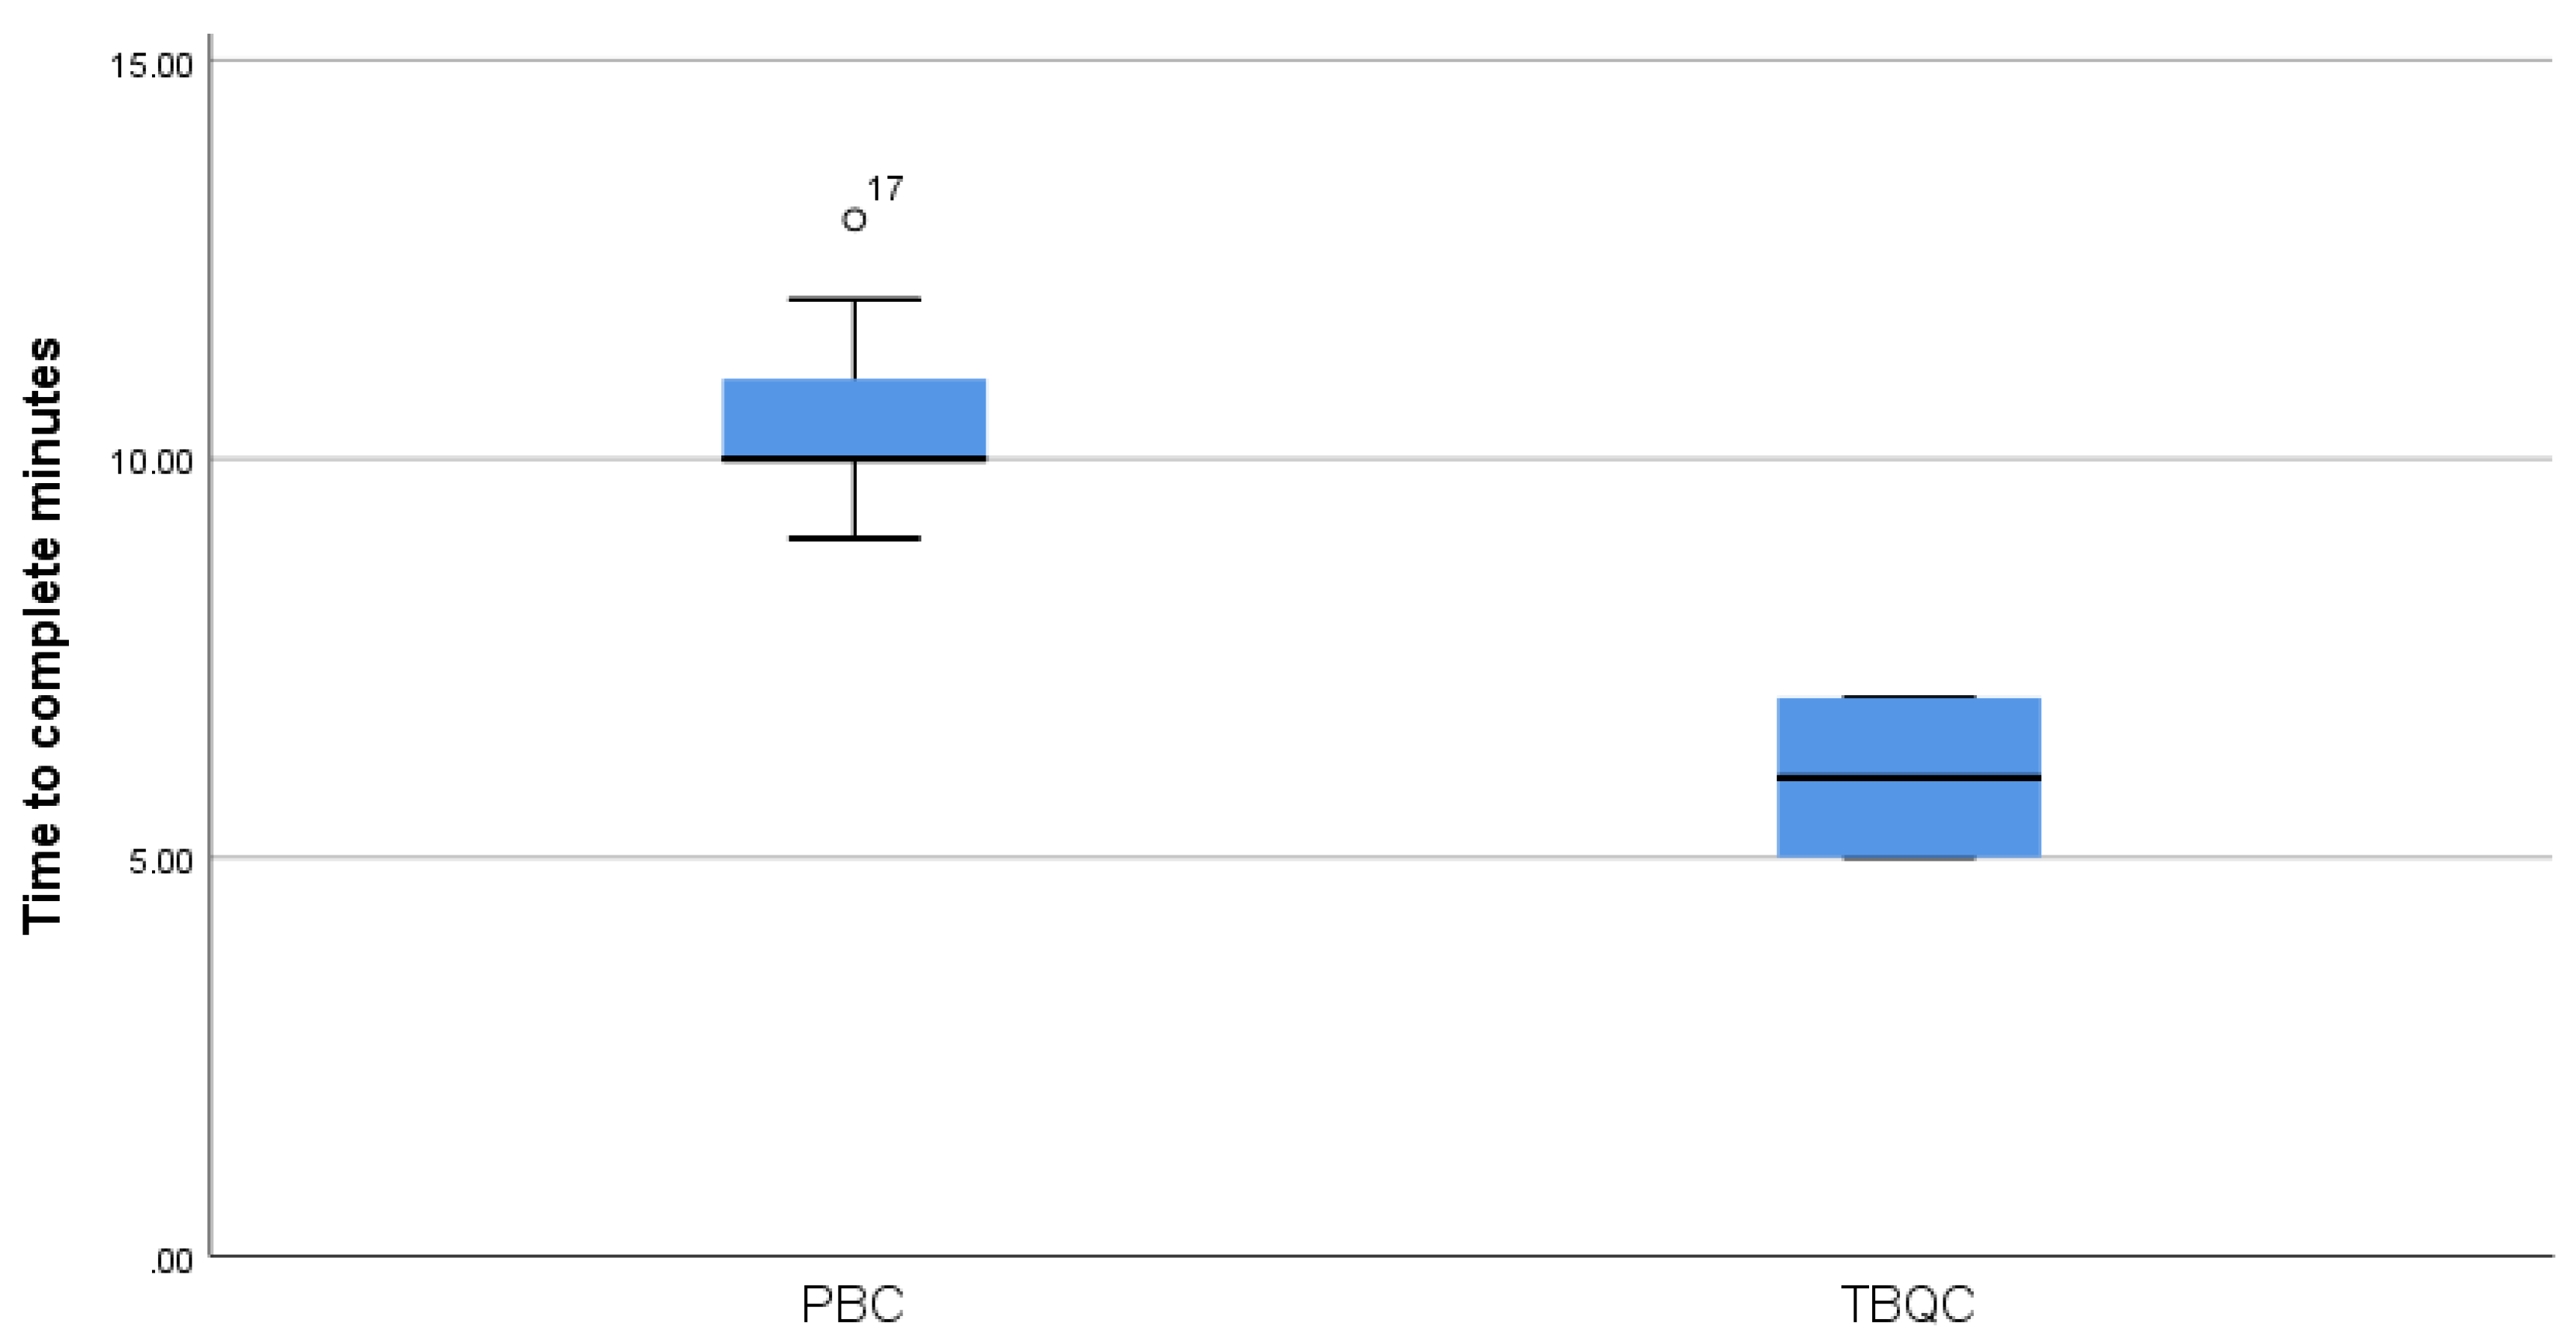
The box-and-whisker plot in
Figure 5 shows the time taken in minutes to complete 20 PBCs compared to 20 TBQCs. The plot shows the median as a horizontal line, range within the first and third quartile as a blue box, the maximum and minimum values as lines extending from the boxes, and any outlier as a dot. It was clear that the LQC team had consistently completed the required recorded checks more quickly with the TBQC system, saving on average 4.35 min per check. The median time to complete the PBC check was 10 min, compared to just 6 min for the TBQC.
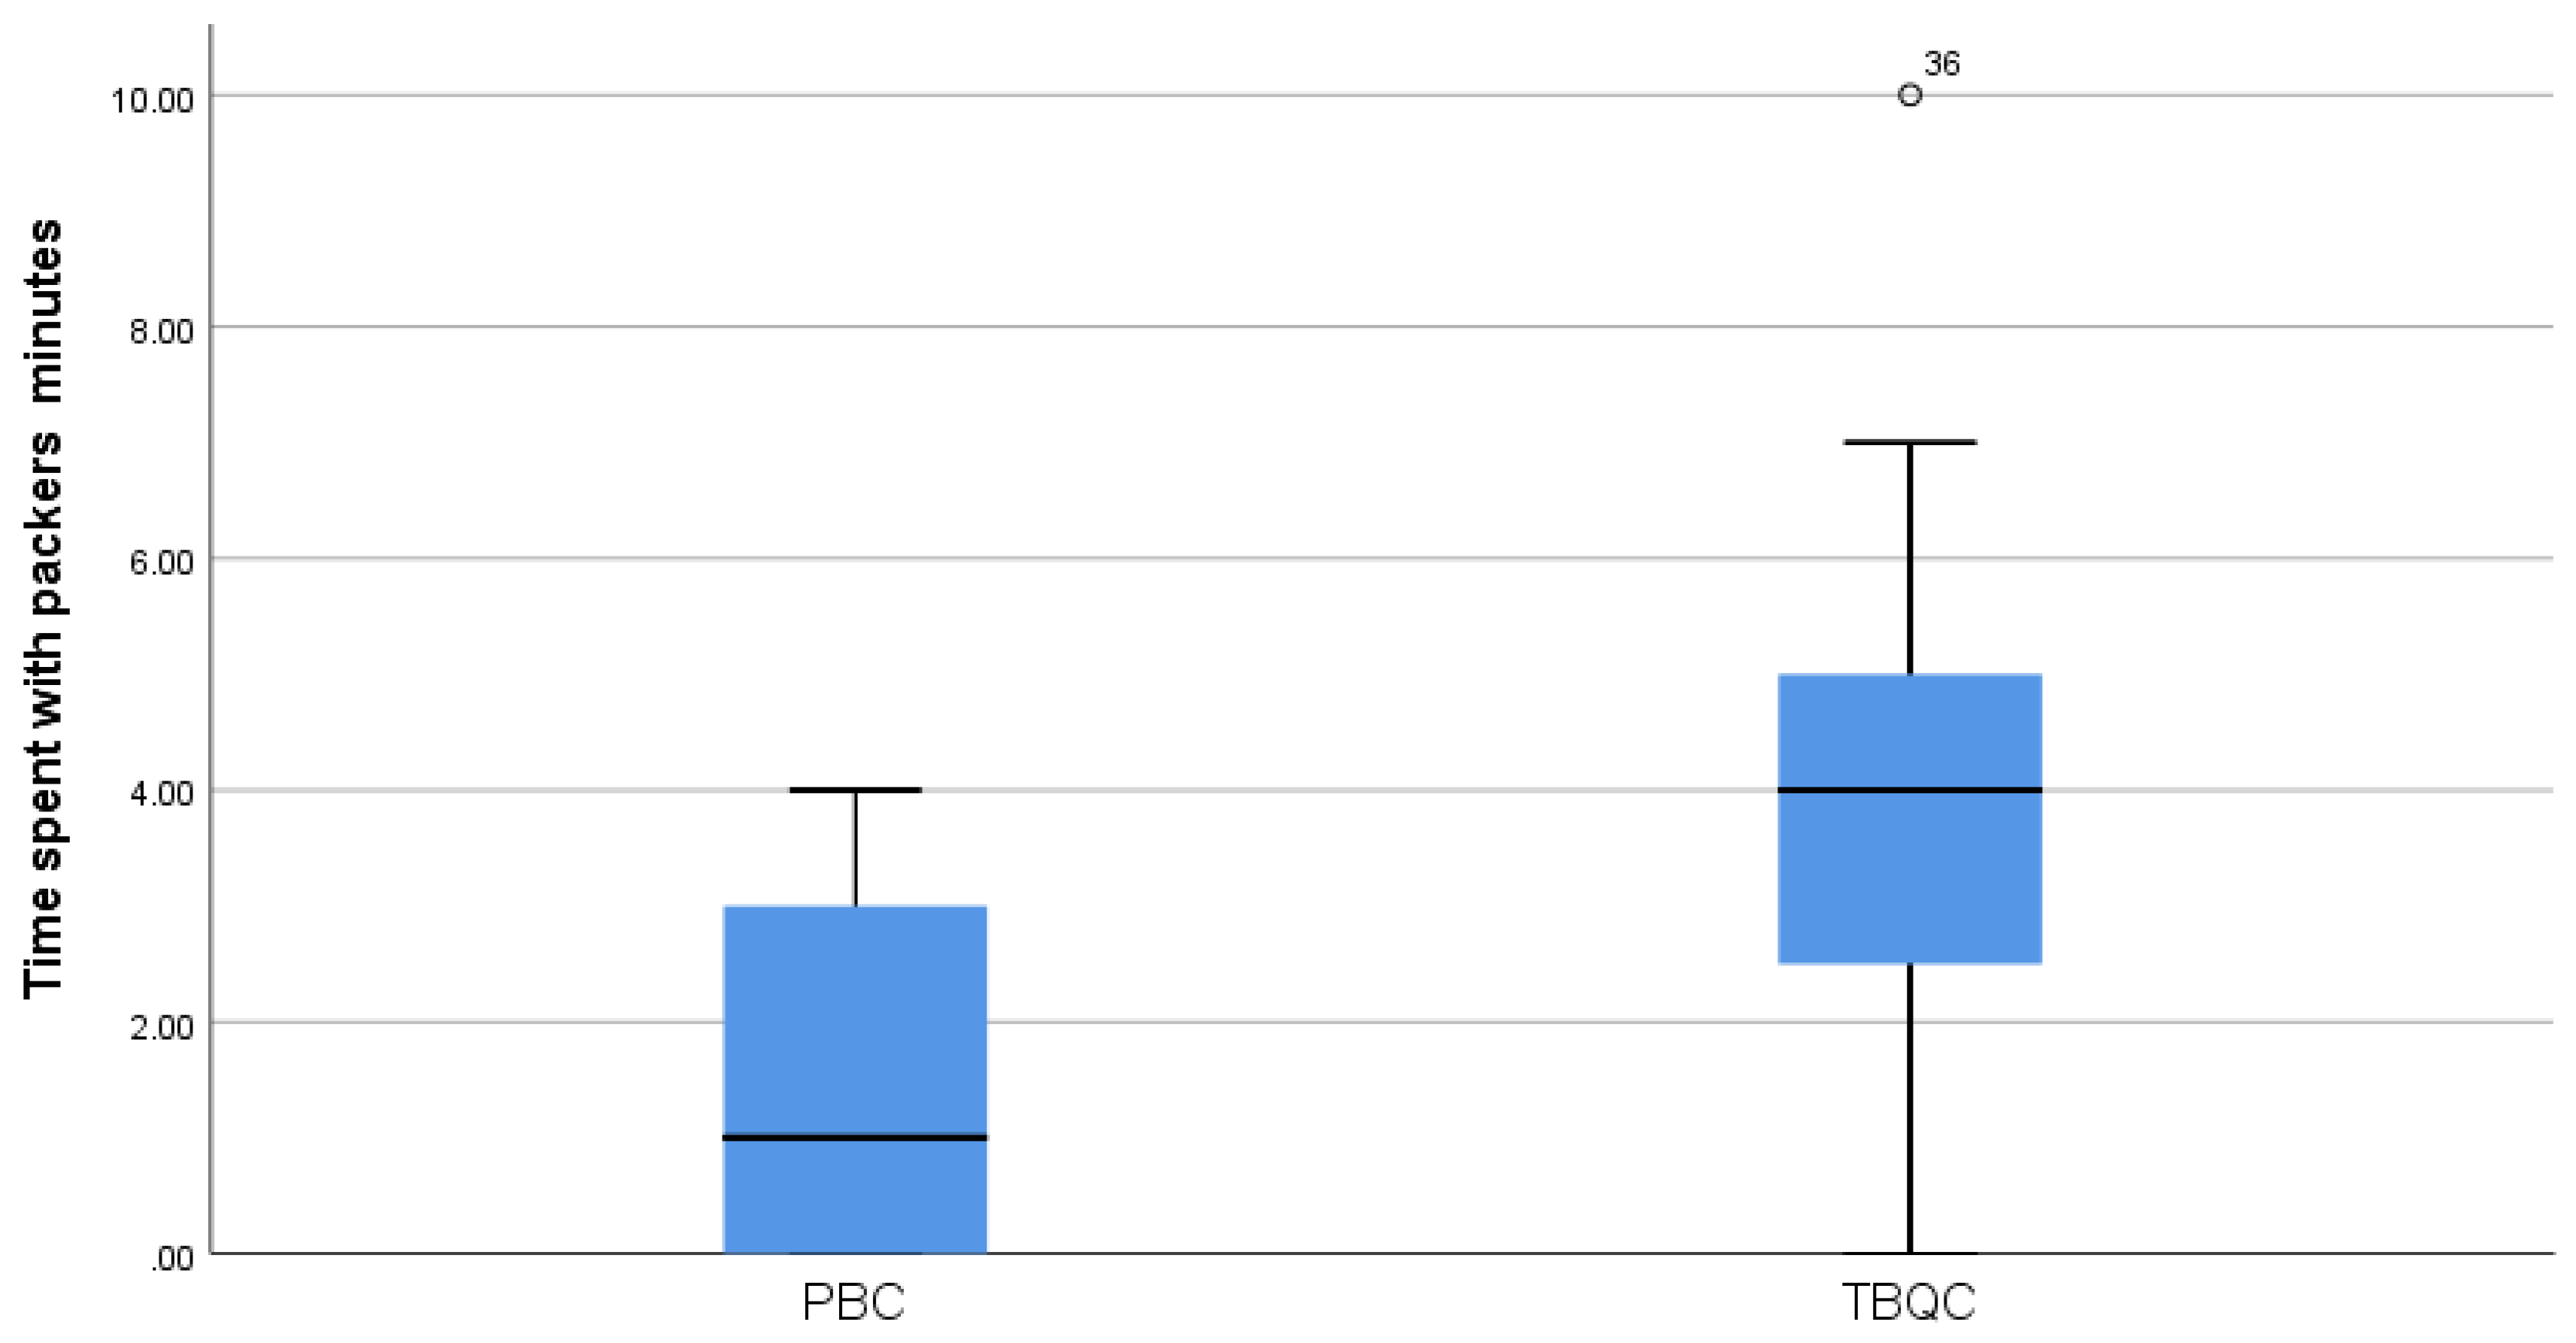
Figure 6 shows how much time the LQC team was able to spend working with the packers on the production line to improve the final product. The median time when following the PBC procedure was around one minute per pallet. This increased to 4 min for the TBQC. In total, the LQC spent 29 min working with the packers when completing the PBC, compared to 74 min using the TBQC. In 10 out of 20 pallets produced when using PBC, the LQC team could not spend any time working with the packers. In contrast, this occurred only three times when following the TBQC procedure.
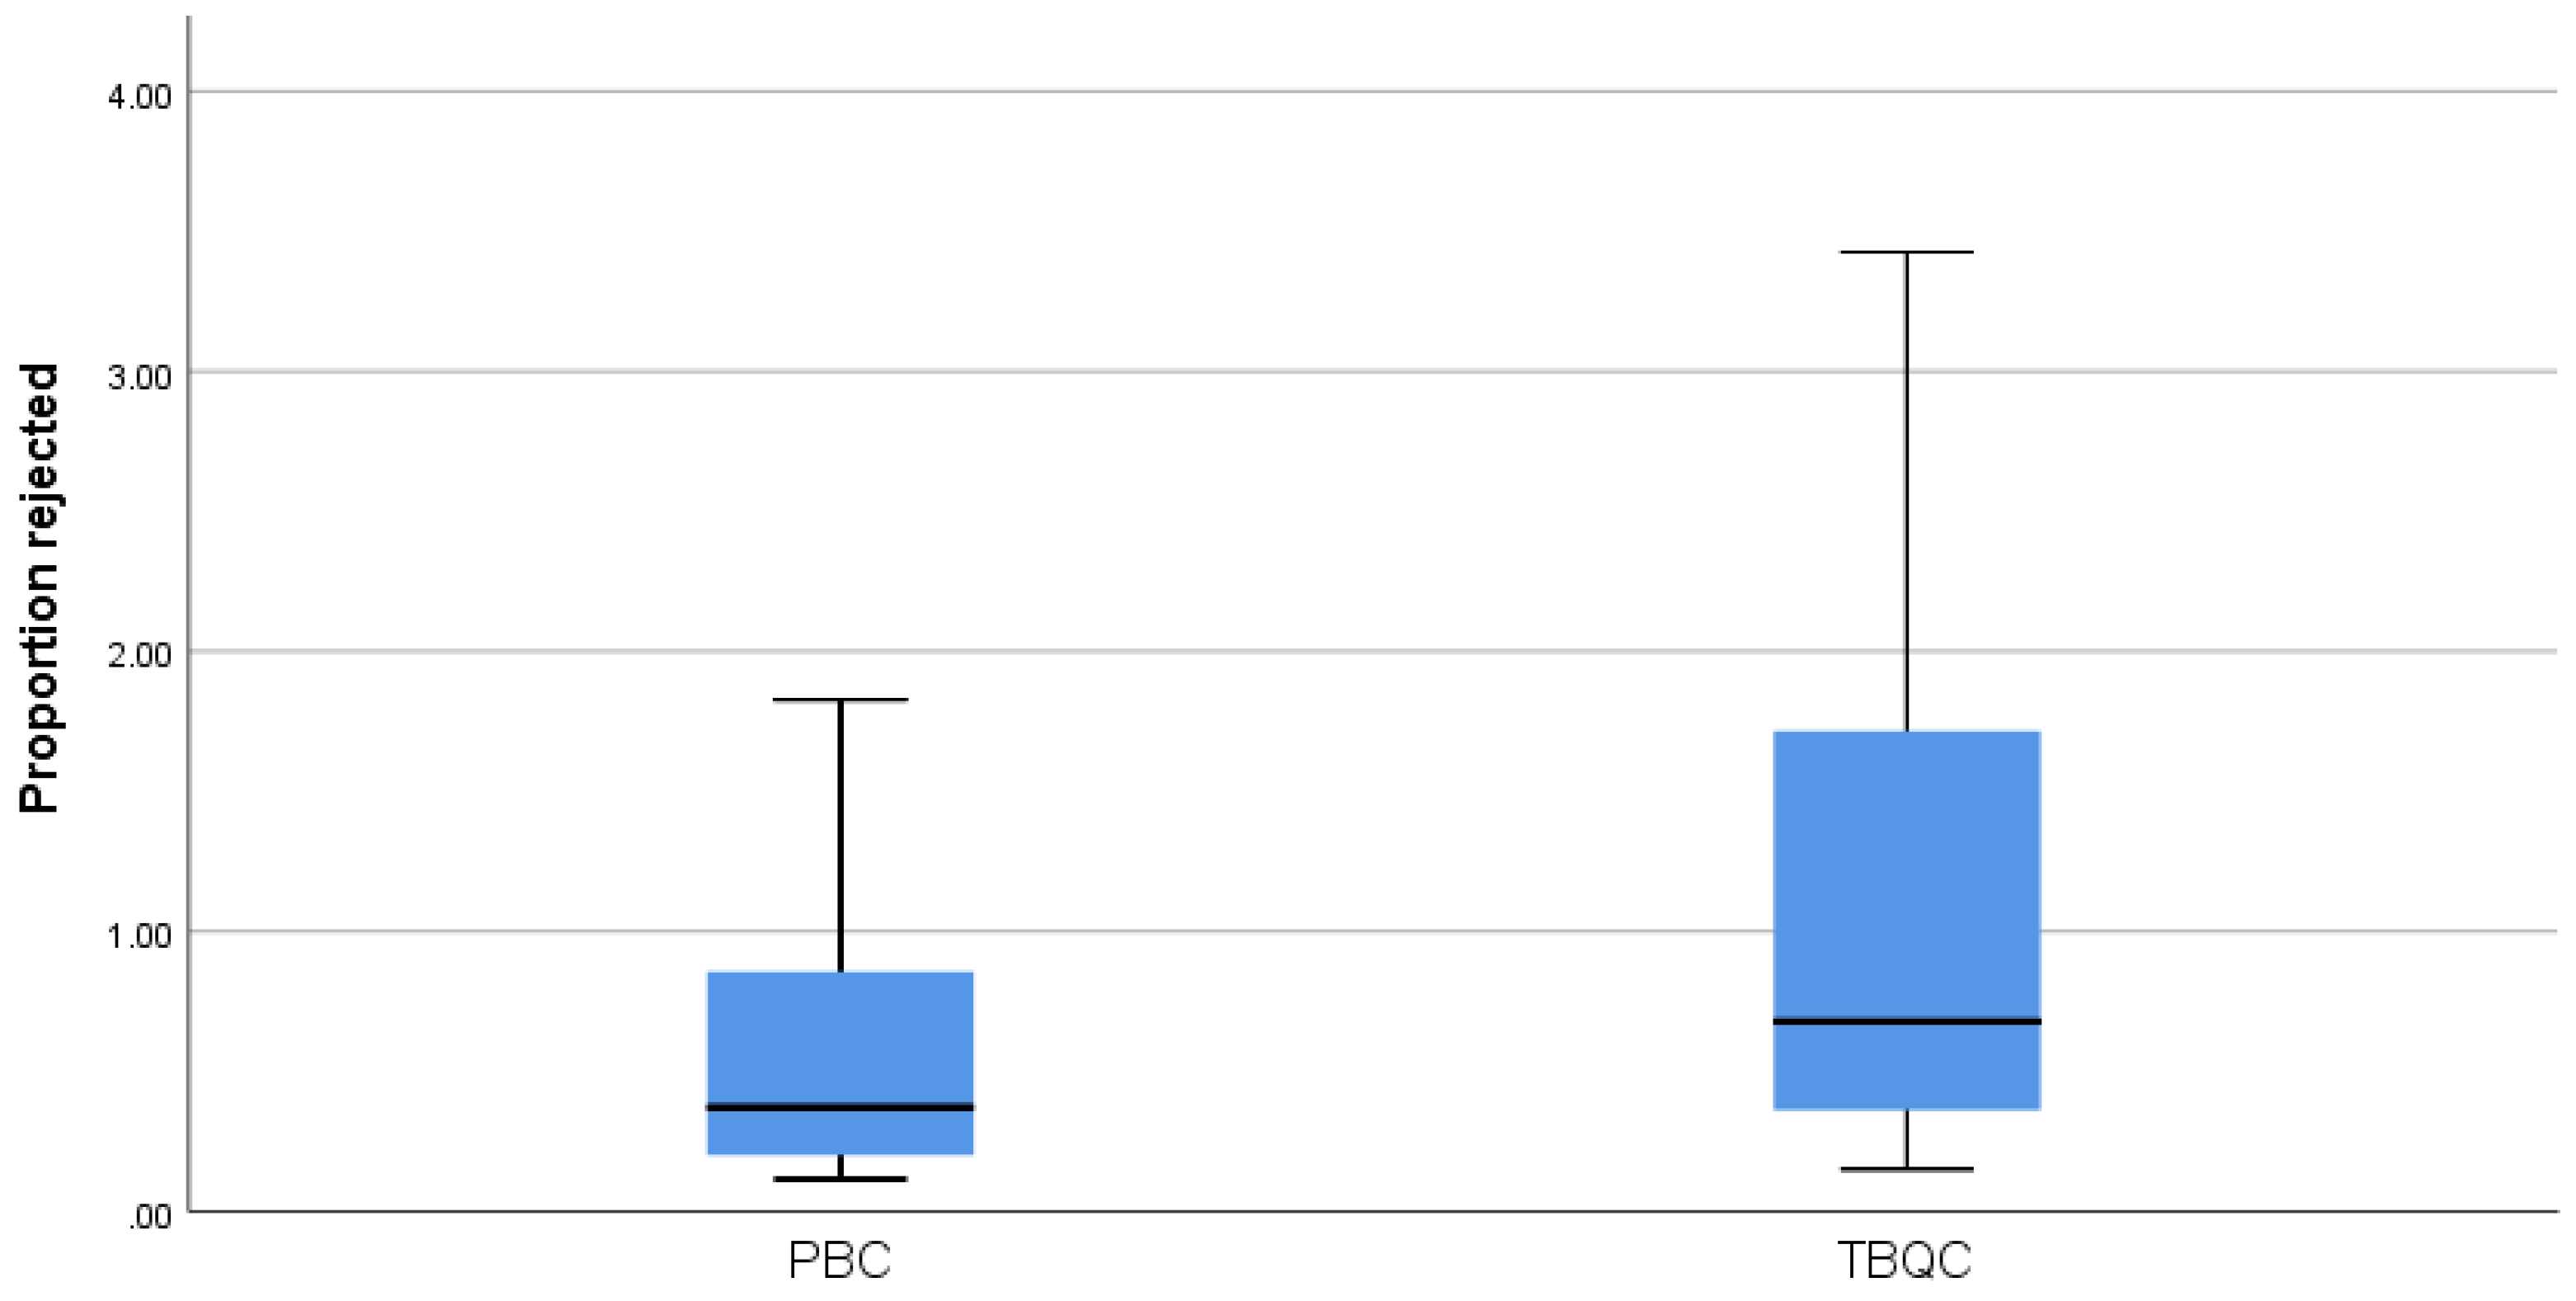
Figure 7 shows the proportion of punnets rejected due to identifying defects on the production line by the LQC. There was a clear increase in the number of punnets identified containing defects when carrying out TBQC compared to the PBC, despite the total number of punnets produced remaining constant.
A Mann–Whitney U test was used to analyse whether the different results for the total number of punnets produced and punnets rejected per job for both PBC and TBQC were statistically significant. The following four assumptions were checked to make sure the data could be analysed by using a Mann–Whitney U test [
33]:
The dependent variable was continuous
The independent variable consisted of two categorical, independent groups
There was no relationship between the observations in each group or between the groups themselves
The variables were not normally distributed
As the first stage of the Mann–Whitney U test,
Table 1 shows the ranks for both PBC and TBQC procedures for the total number of punnets produced and punnets rejected per job. The mean rank of the total punnets produced was consistent between the two methods. However, the punnets rejected per job during the TBQC method was considerably higher, with a mean rank of 29.35, compared to the PBC mean rank of 11.65.
Results from the Mann–Whitney U test shown in
Table 2 prove that the higher number of punnets rejected per job for the TBQC compared to the PBC was statistically significant: U(N
PBC = 20, N
TBQC = 20) = 23.000. Since U < 127 (critical value for the Mann–Whitney U Test for N
1 = N
2 = 20 and
p = 0.05: U = 127) [
34], the difference between the punnets rejected per job was unlikely to have occurred by chance. Similarly, the higher number of punnets produced for TBQC was statistically significant.
To further explore the increase in time efficiency of the TBQC, the time needed to gather data during an audit or traceability exercise was measured. The compliance manager made a mock recall and requested the QM to gather the physical PBC completed for a single job number. This took a total of 2 h 25 min, as the paperwork was stored away from the main site and the QM required assistance from a fork truck operator to retrieve a pallet from racking. Once the pallet was at ground level, the QM de-stacked around half of the pallet to get to the box containing the job number in question. The QM then gathered the digitised TBQC information from the newly developed software, needing less than 10 min to access it and email it to the compliance manager. These results exhibit a clear saving in time and labour, as it took 135 min less to retrieve the information by the TBQC compared to the PBC, and the assistance of a forklift operator was not needed.
In addition to improving the economic performance of RH by identifying more defects in the final product, a reduction in the use of physical paper by approximately two-thirds every four days has been achieved when using TBQC. The annual economic savings due to this reduction in paper use have been estimated to reach nearly £7000 (
Table 3). This also has associated a significant reduction in environmental impact related to the production of the paper as well as its waste management.
Finally, the opinions of the LQC team were collected to elucidate whether they were satisfied with the change from a PBC to a TBQC system. A questionnaire with six questions was given to 11 randomly chosen anonymous members of the LQC team. The questionnaire results in
Table 4 show that LQC staff were generally satisfied with the change. The mean results were between “agree” and “strongly agree” that the change was positive. This has strong implications in terms of job satisfaction, job performance, and talent retention.
In conclusion, implementing this solution led to an improvement of the following operational parameters: a reduction in the time needed to complete recorded checks; a consequent increase of time the pack-house quality control team can spend with packers on the production lines to facilitate identification of defects; a reduction of the likelihood of rejection at the customers’ depot; a reduction in the use of physical paper and an increase in staff satisfaction.
6. Conclusions and Recommendations
This project has used business process re-engineering to identify a lean solution to improve the efficiency of the operations in a food company’s pack-house. By substituting a PBC system with a TBQC system, several operational parameters have been improved. The LQC has consistently completed the required checks more quickly, saving an average of 4.35 min per check. This saving has an immediate impact on the ability of the LQC team to work with the packers to produce the product without defects, and therefore reduce waste. When using the PBC system, the LQC could spend time working with the packers for only 10 out of 20 pallets produced, compared to 17 out of 20 when using the TBQC system. The LQC was able to spend a total of 29 min working with the packers when completing the PBC, compared to 74 min using the TBQC. This allows the LQC team to understand issues in the packhouse and to instruct the packers better. The additional time also allows the LQC team to identify defects before products are heat sealed; the LQC removes three times more defective punnets and returns them to the packers with TBQC than when using the PBC. This ensures that the product meets the customers’ tolerances and reduces the likelihood of rejection at the customers’ depot. It is expected that, as the LQC team spend more time working alongside the packers, the number of punnets the packers produce with defects will be reduced.
Therefore, it can be concluded that the introduction of the TBQC system significantly improves activities in the pack-house by reducing the time needed to complete the recorded checks, increasing the time LQC spends with packers and facilitating the identification of defects. A consequence of this is the reduction in physical waste. This system also enables monitoring of each line in real time and identification of quality issues as they arise, saving time, effort, and resources when carrying out traceability and recall tests. The possibility of recording photographic evidence gives the check greater validity. Furthermore, there is a reduction in the use of paper, which translates into a reduction in paper waste, and as a result, an economic saving. Reducing deliveries and saving storage for materials further improves the economic performance of the business. Finally, the company staff has also shown their satisfaction over the new TBQC system implemented.
It is expected that the data continuously gathered in the medium- to long-term will be used. After a period of two years of data collection, it will be possible to look for trends according to the seasons, and across types, varieties, and countries of origin. Such information could assist the pack-house planners, line leaders, and QC teams when making decisions on staffing levels required to complete jobs, and deployment locations according to the experience of packing staff. Furthermore, this information could be used to draw comparisons between the intake inspection in RH and the QC conducted by the exporter. In turn, this could help the exporters understand the issues causing the punnets to be outside the quality tolerance on arrival at RH. These issues could then be addressed earlier in the process by helping the exporter to make improvements to the product while it is within their control. This could potentially benefit the exporters by reducing their packing charges, as when punnets are processed in RH to bring the final product to tolerance, the exporters are charged an additional levy above the standard rate. Receiving the product within the final customer’s specification also benefits RH, as fruit that does not require additional work can be packed more quickly, increasing capacity within the pack-house.
The research approach discussed in this paper forms a basis for adopting an element of quality management. Although this paper focuses on Quality 4.0 implementation in the food sector, it is expected that the approach followed and solutions applied would also be applicable in other manufacturing sectors, allowing them to save resources and minimise waste.


 ,
, 


