
Evaluation of High-Resolution Satellite-Derived Solar Radiation Data for PV Performance Simulation in East Africa


Abstract
:1. Introduction
- To evaluate and compare GHI satellite datasets in East Africa with a view to advising which database to use where. GHI satellite data are mostly verified against data from the archive of the Baseline Surface Radiation Network (BSRN), based at the World Radiation Monitoring Centre (WRMC). However, there are just three BSRN monitoring stations on the continent of Africa (Algeria, Namib Desert and South Africa), as opposed to 13 in the USA and 11 in Europe. Additionally, the West has many other ground stations, which, although accurate, do not belong to the BSRN network. Africa is very short of ground-based solar radiation sensors in general.
- To establish whether the different clear sky models utilised by satellite-derived solar radiation datasets affect the outcomes of the dataset values in East Africa. Clear sky models differ in complexity of algorithm, atmospheric inputs, temporal and spatial resolution of atmospheric inputs and location where the model was fitted.
- To compare and contrast solar GHI satellite data with measurements from ground stations in East Africa.
2. Instruments, Places and Measurements
2.1. The Satellite-Derived GHI Databases Used in This Research
2.2. The Ground-Based Data Used in This Research
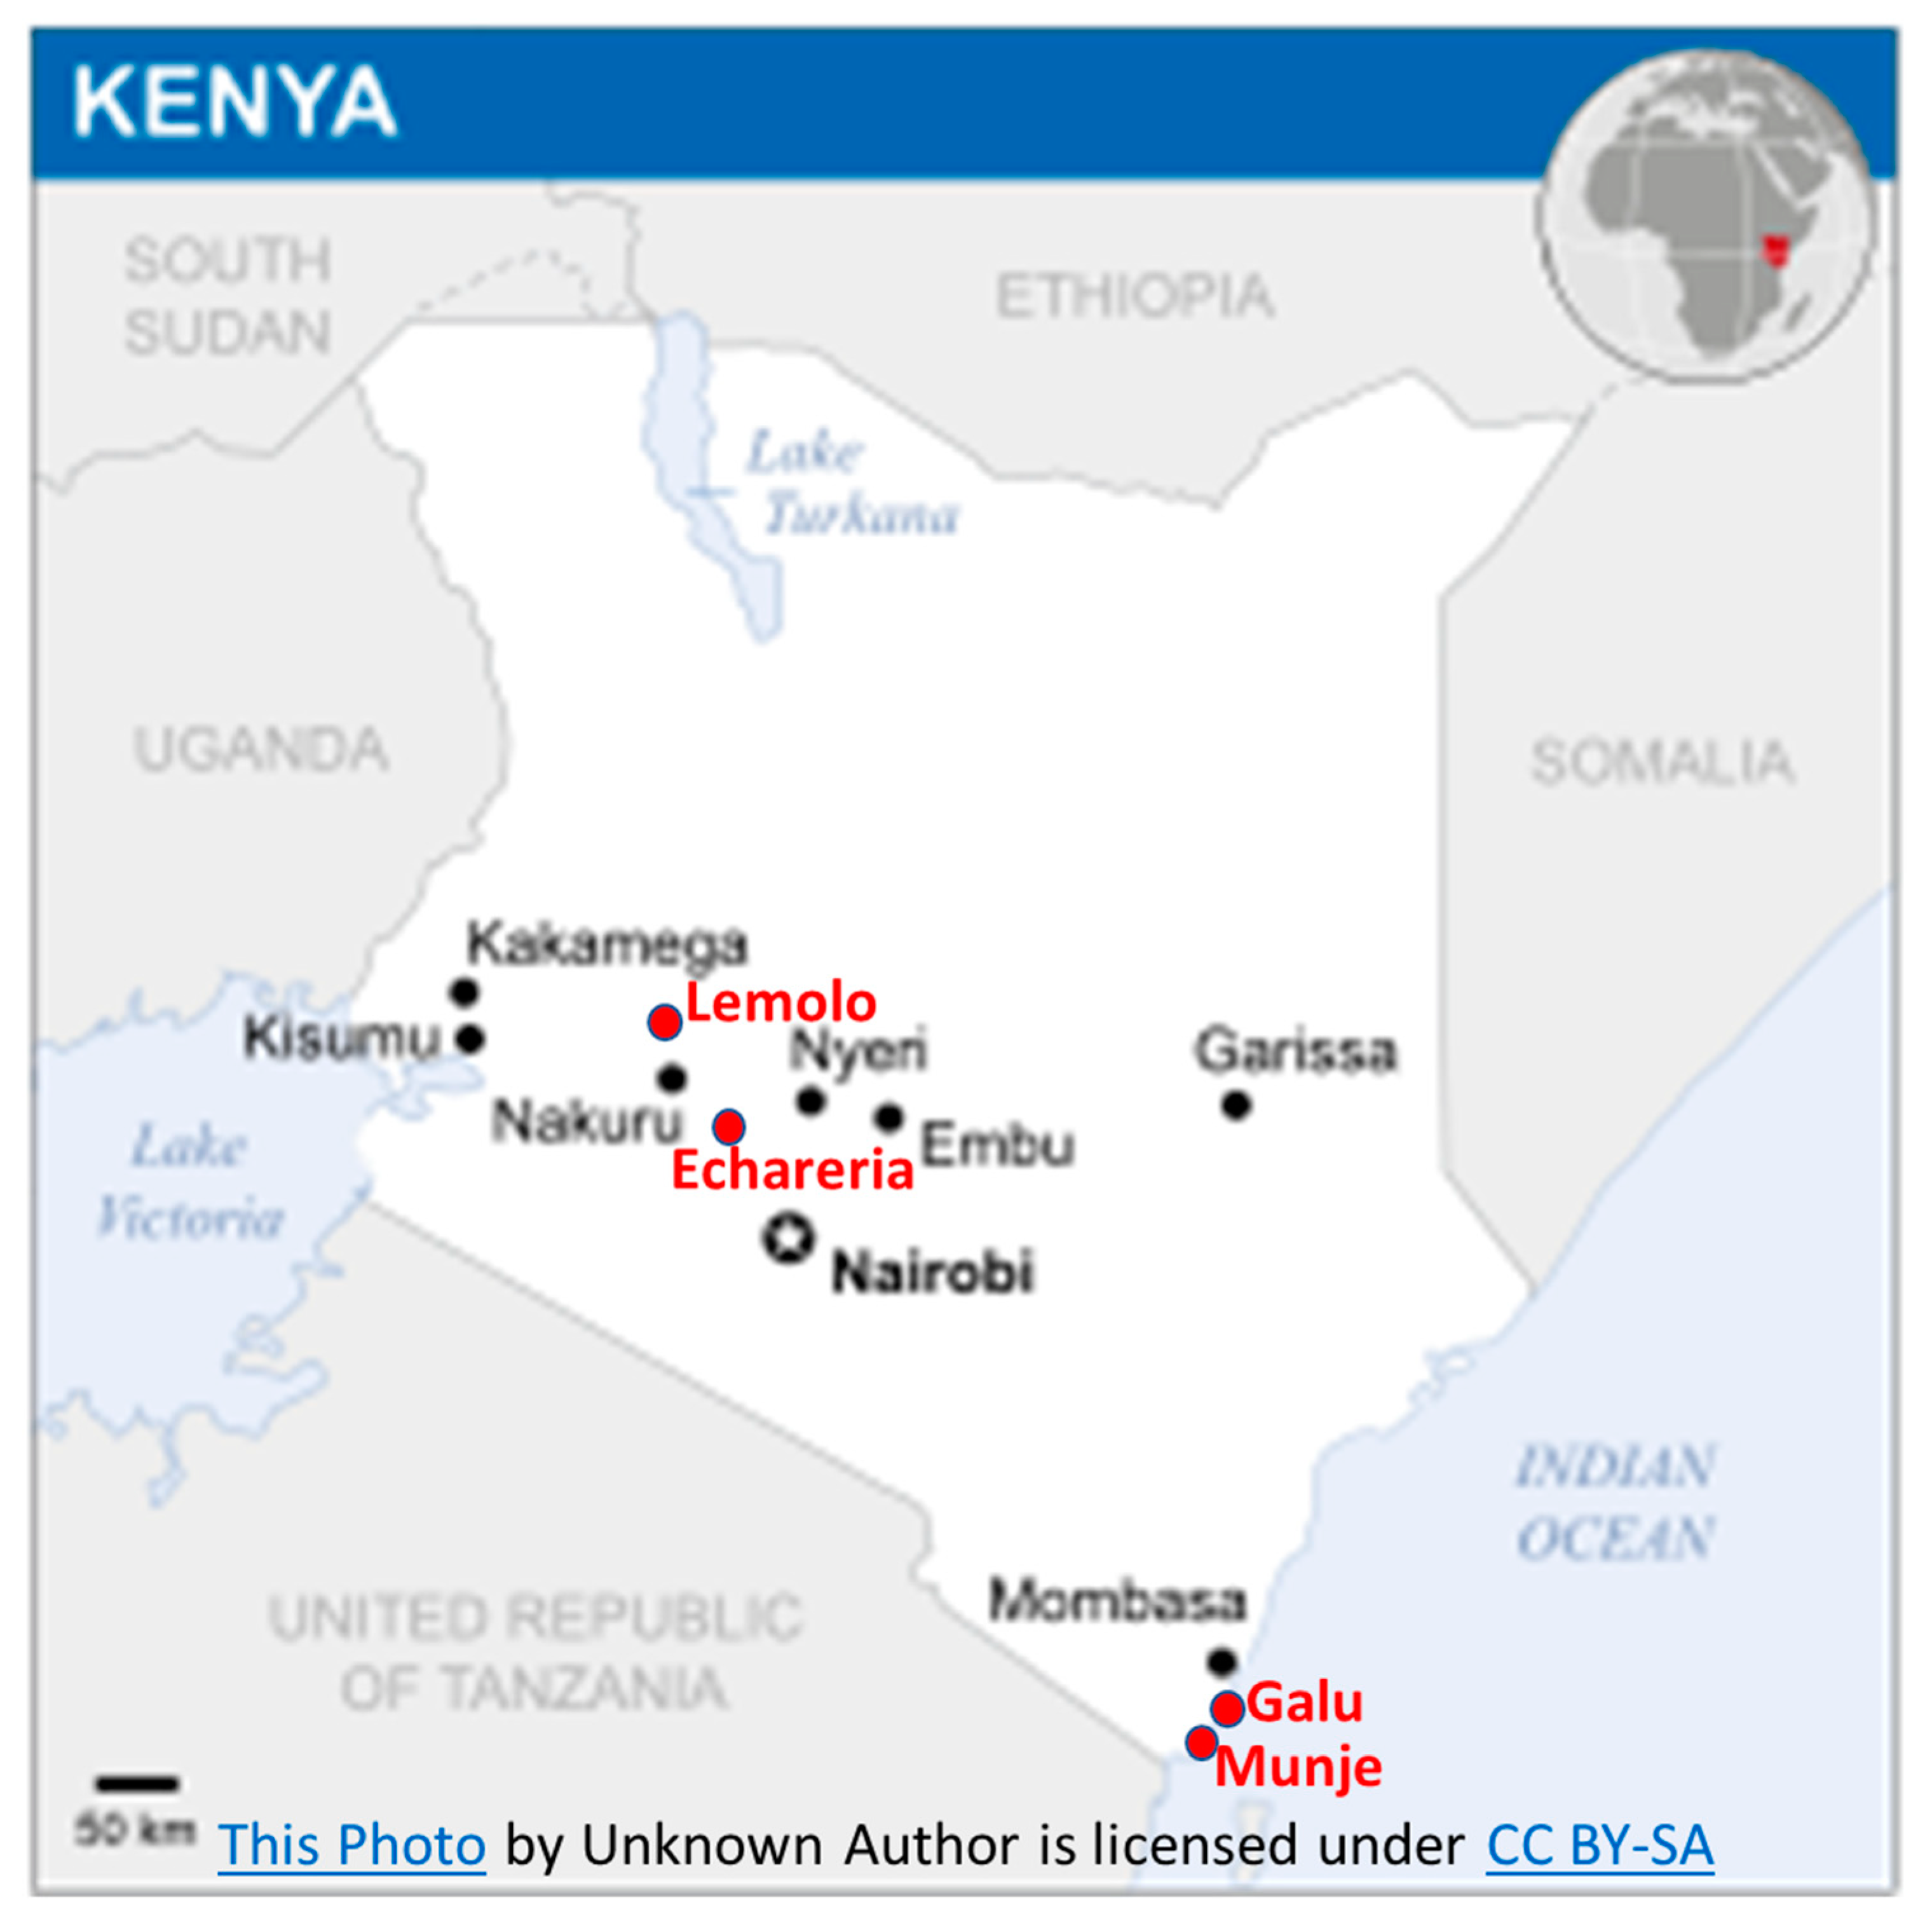
- Lemolo B (latitude: –0.01°; longitude: 36.04°), in a semi-arid region of Kenya (Köppen–Geiger climate classification AW, tropical savannah);
- Echareria (latitude: −0.35°; longitude: 36.22°) with a Köppen–Geiger climate classification of Csb. That is, it enjoys a “Mediterranean” climate with a dry summer and mild wet winter.
- Galu: latitude −4.35°, longitude 39.57°; and
- Munje: latitude −4.51°, longitude 39.46°.
3. Methodology
4. Results
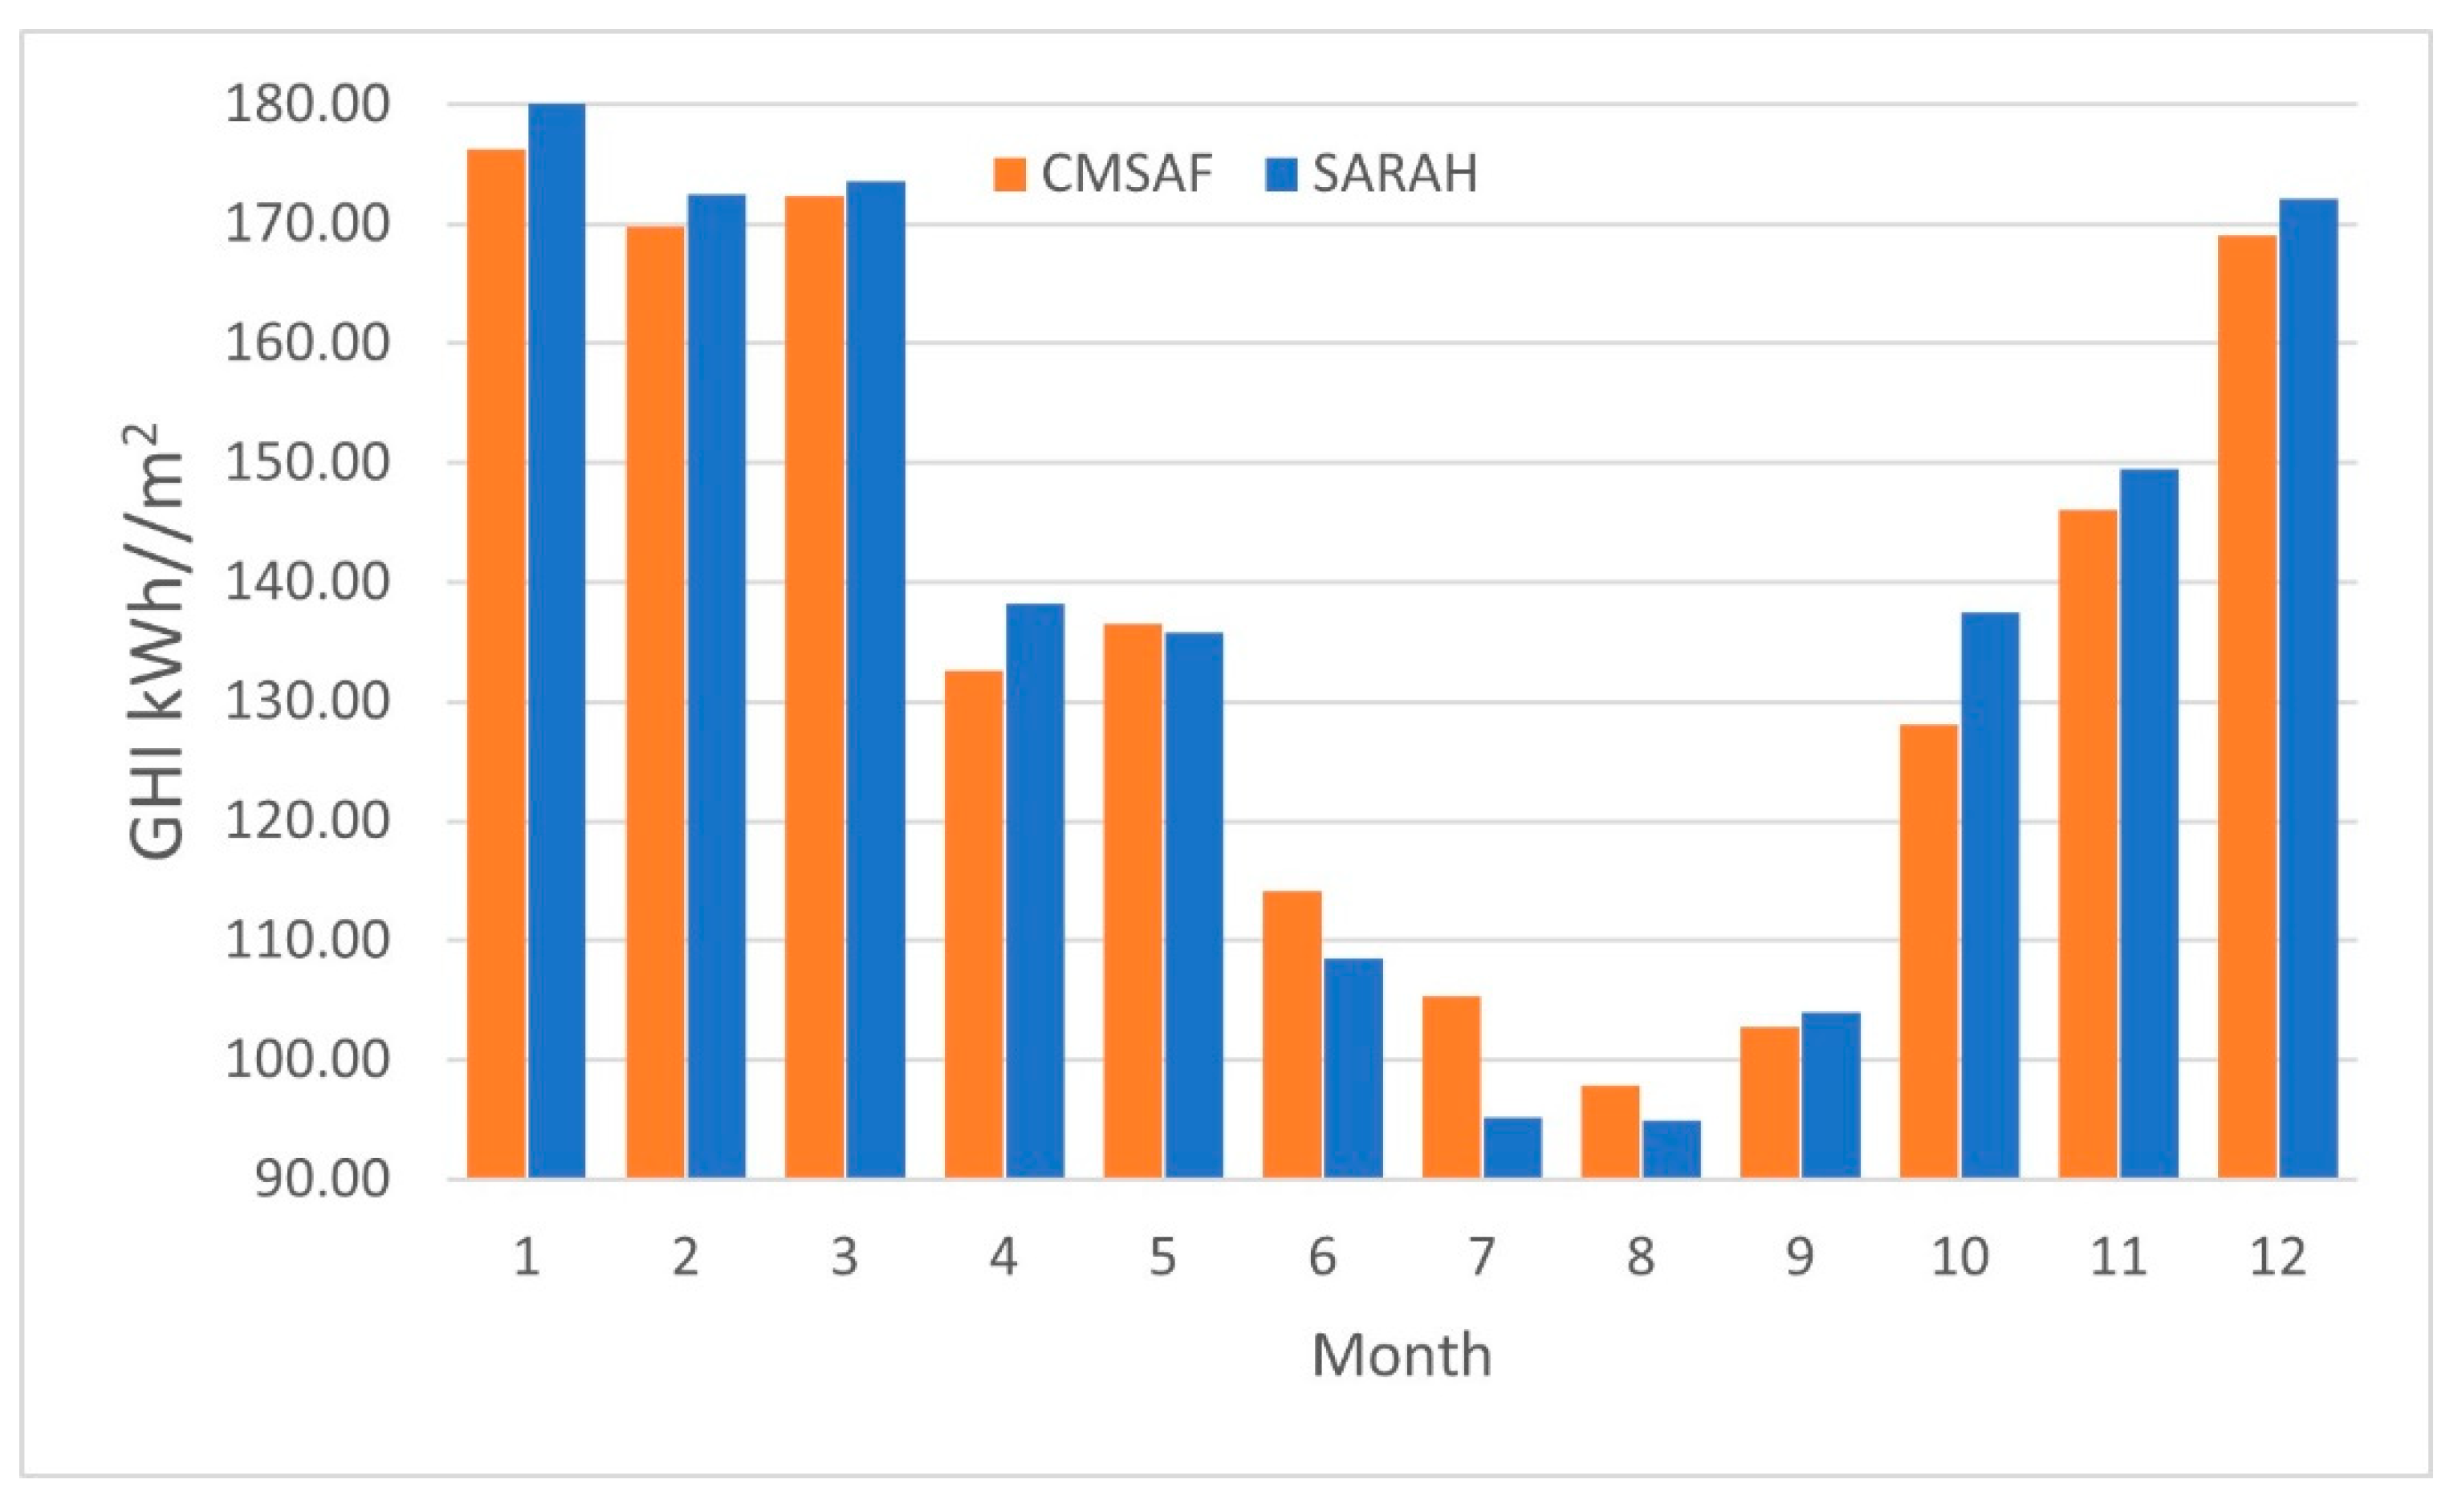
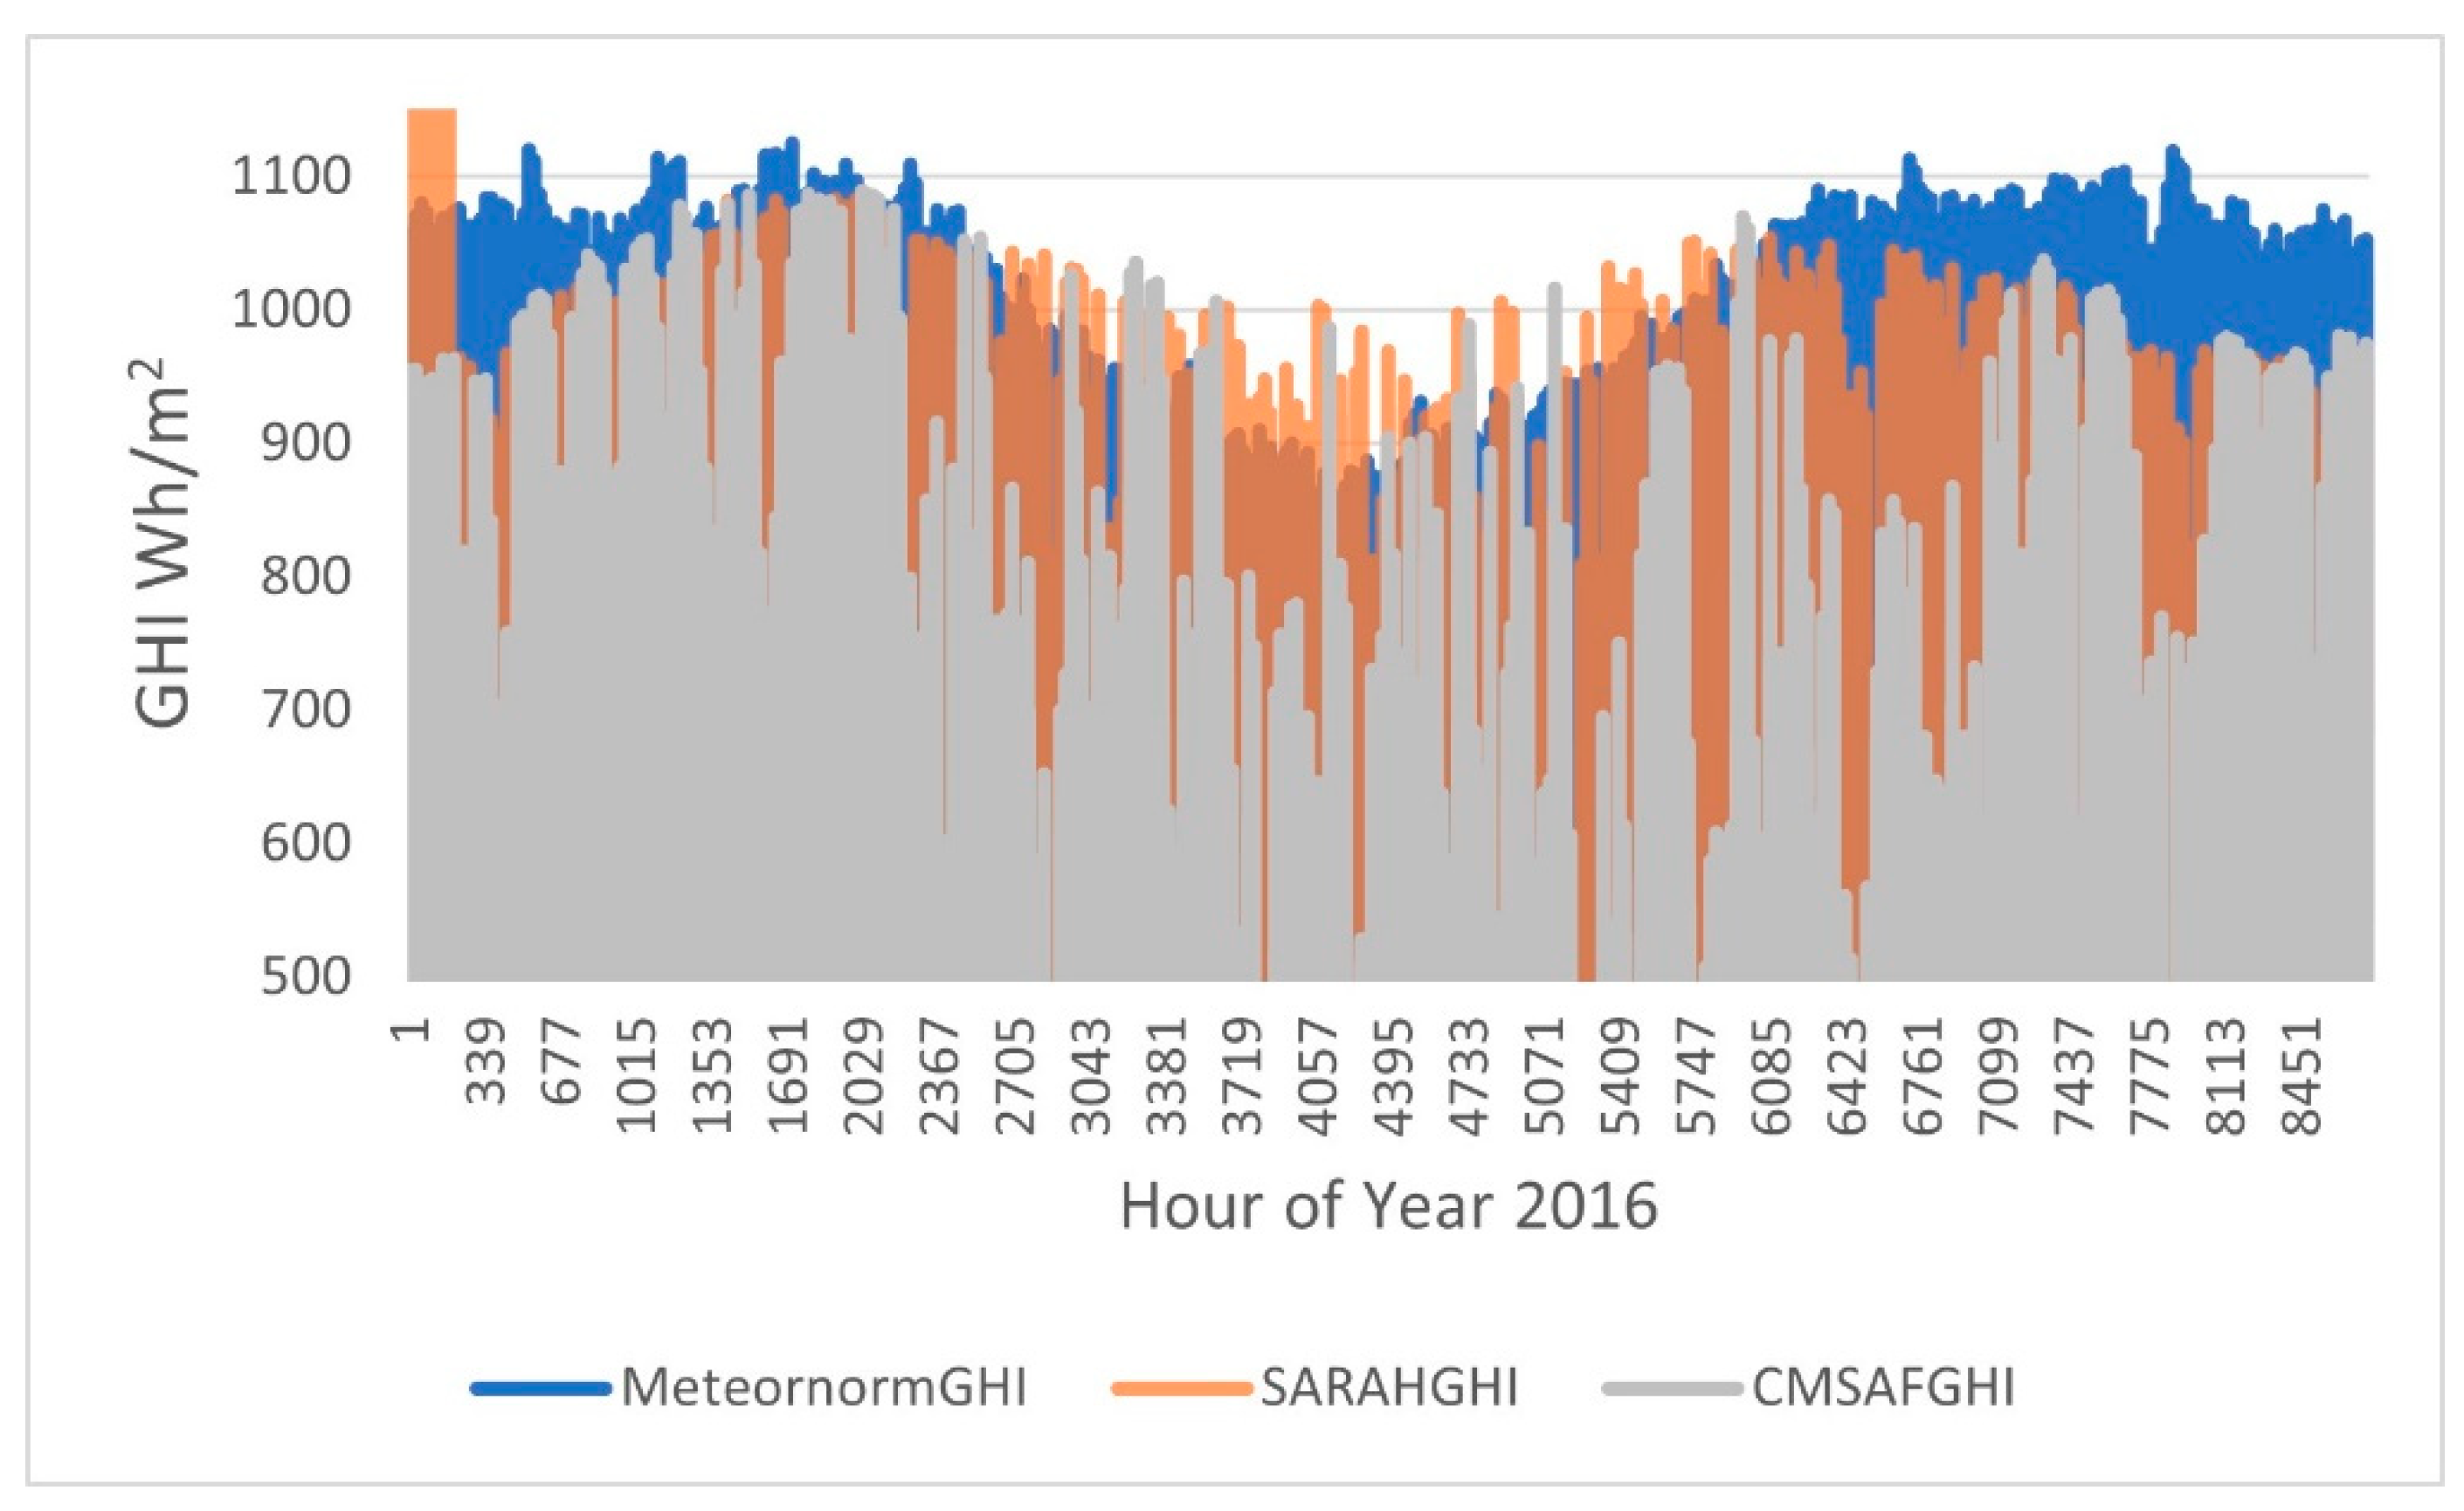
4.1. Selection of GHI Satellite Database without Ground Validation
4.2. Accuracy of the GHI Satellite Databases Determined by Ground Validation
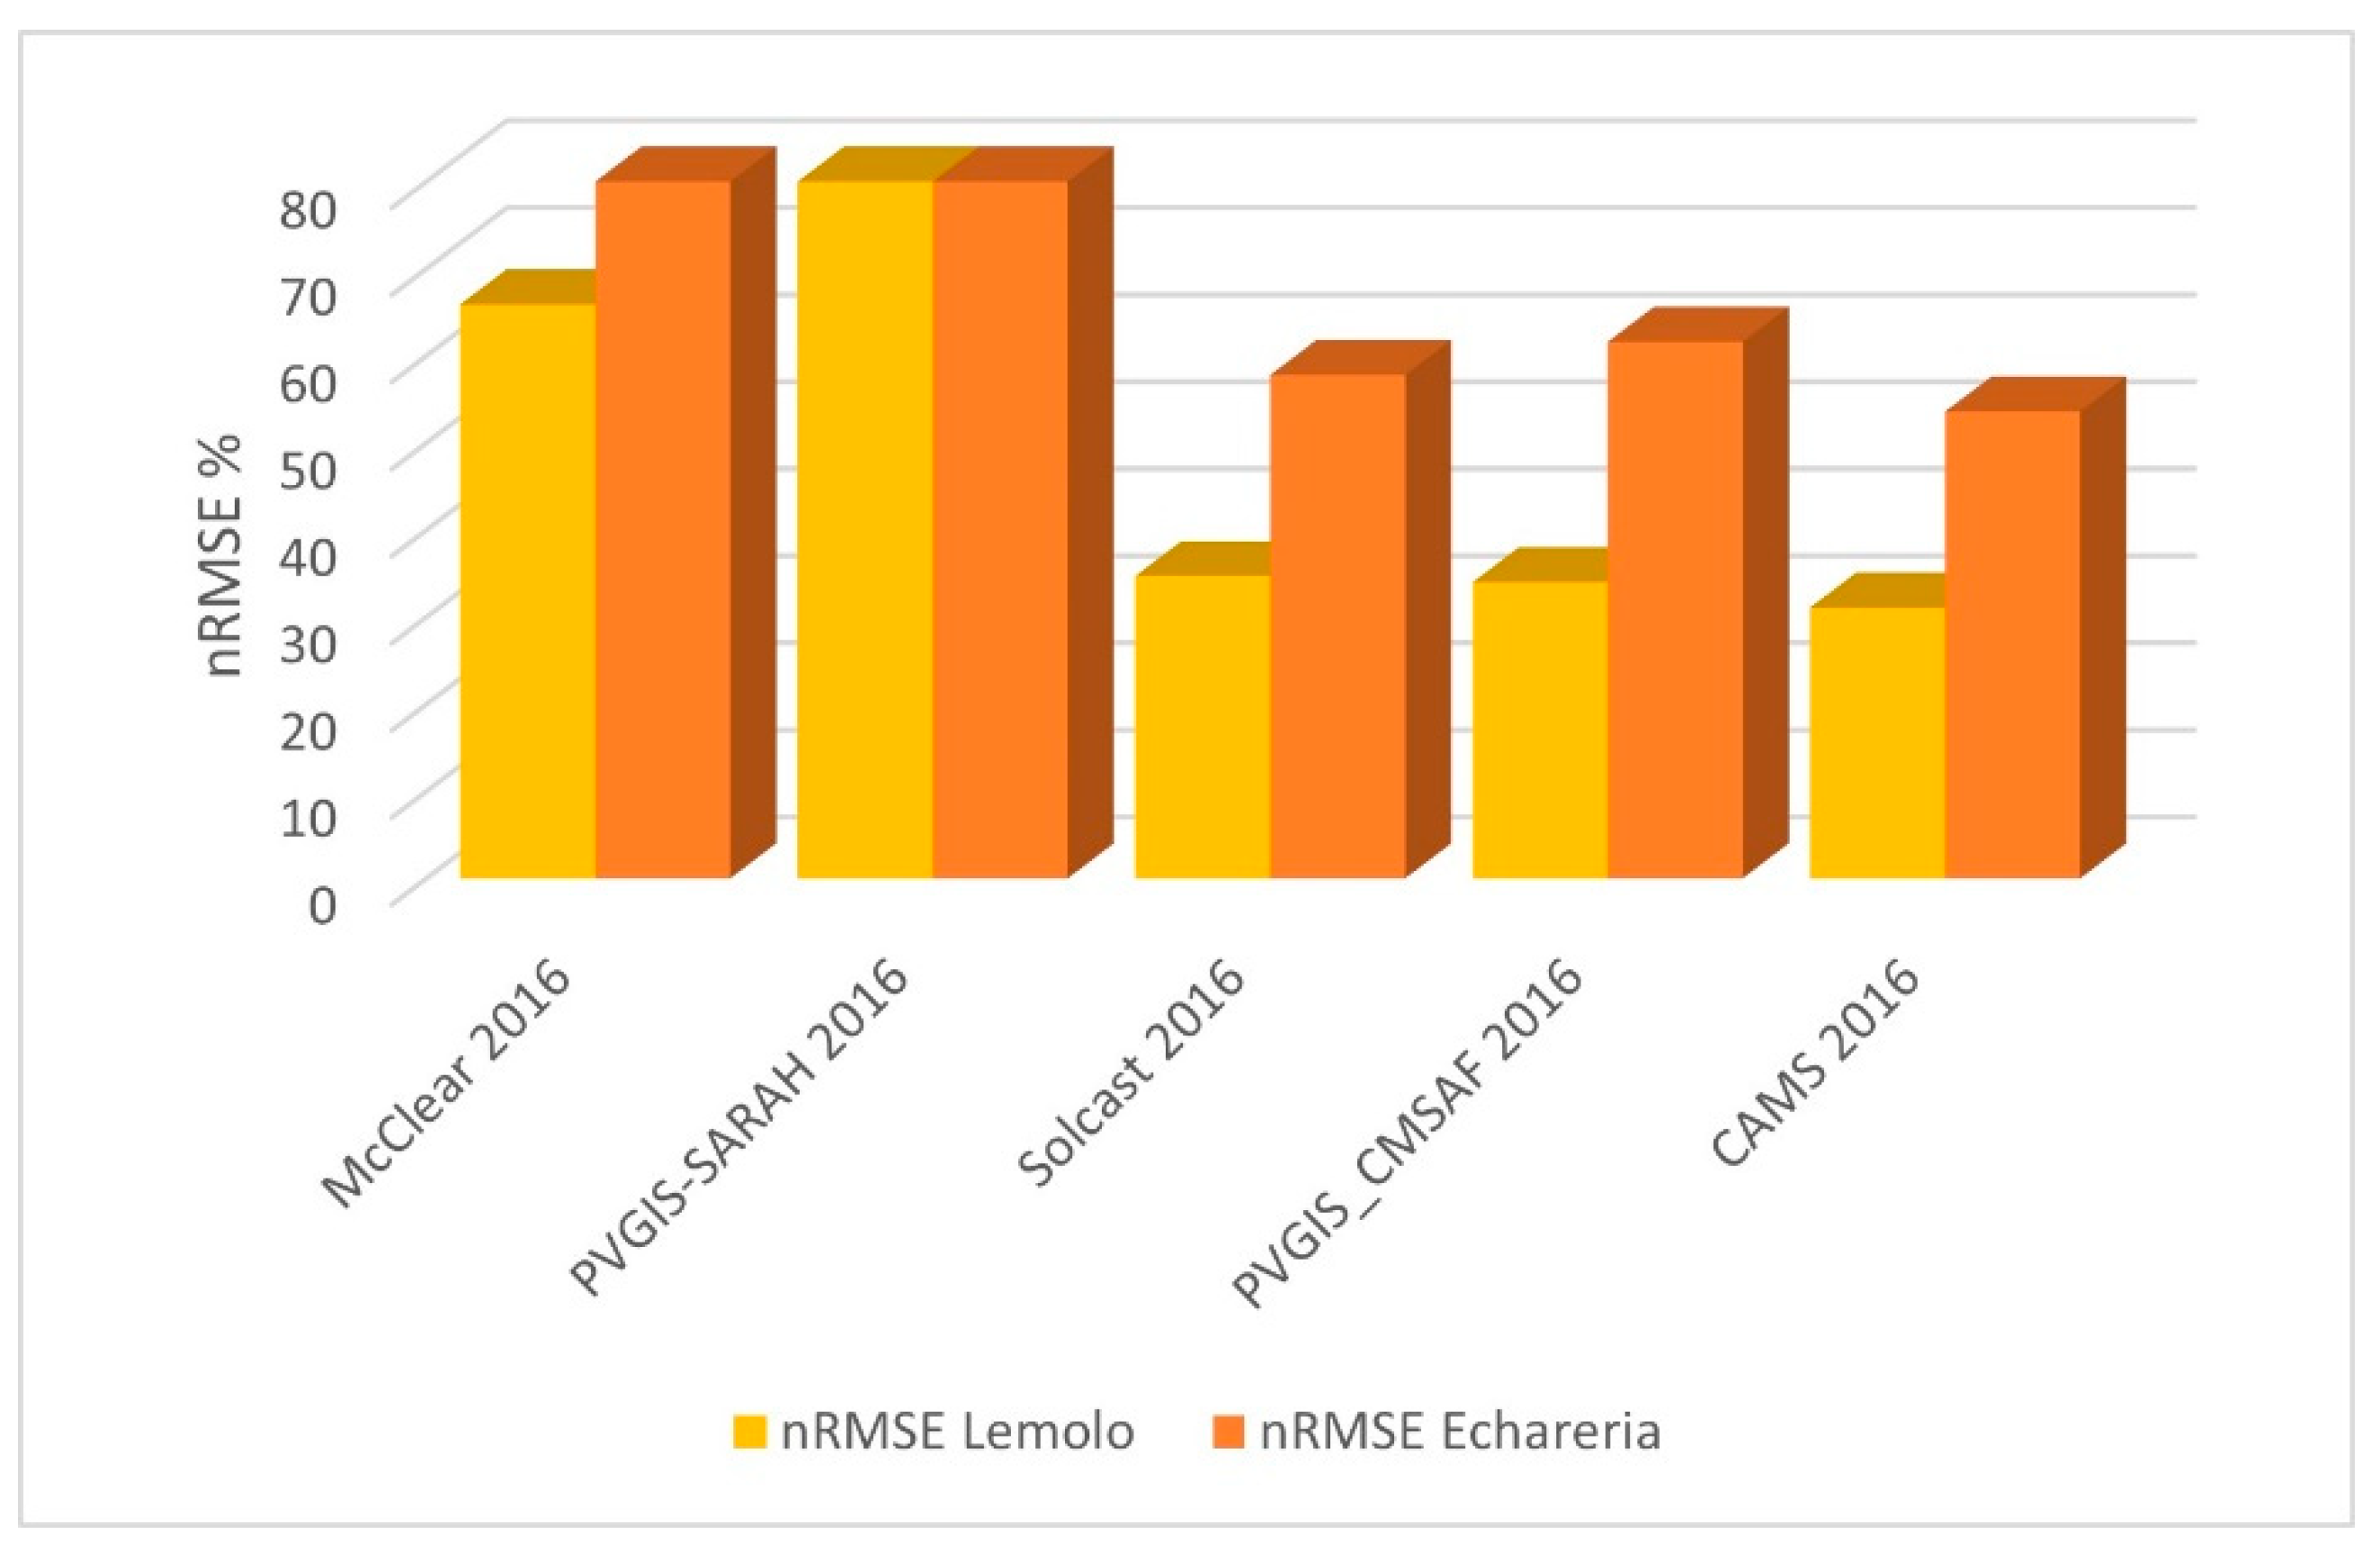
4.2.1. nRMSE of the Four GHI Satellite Databaes
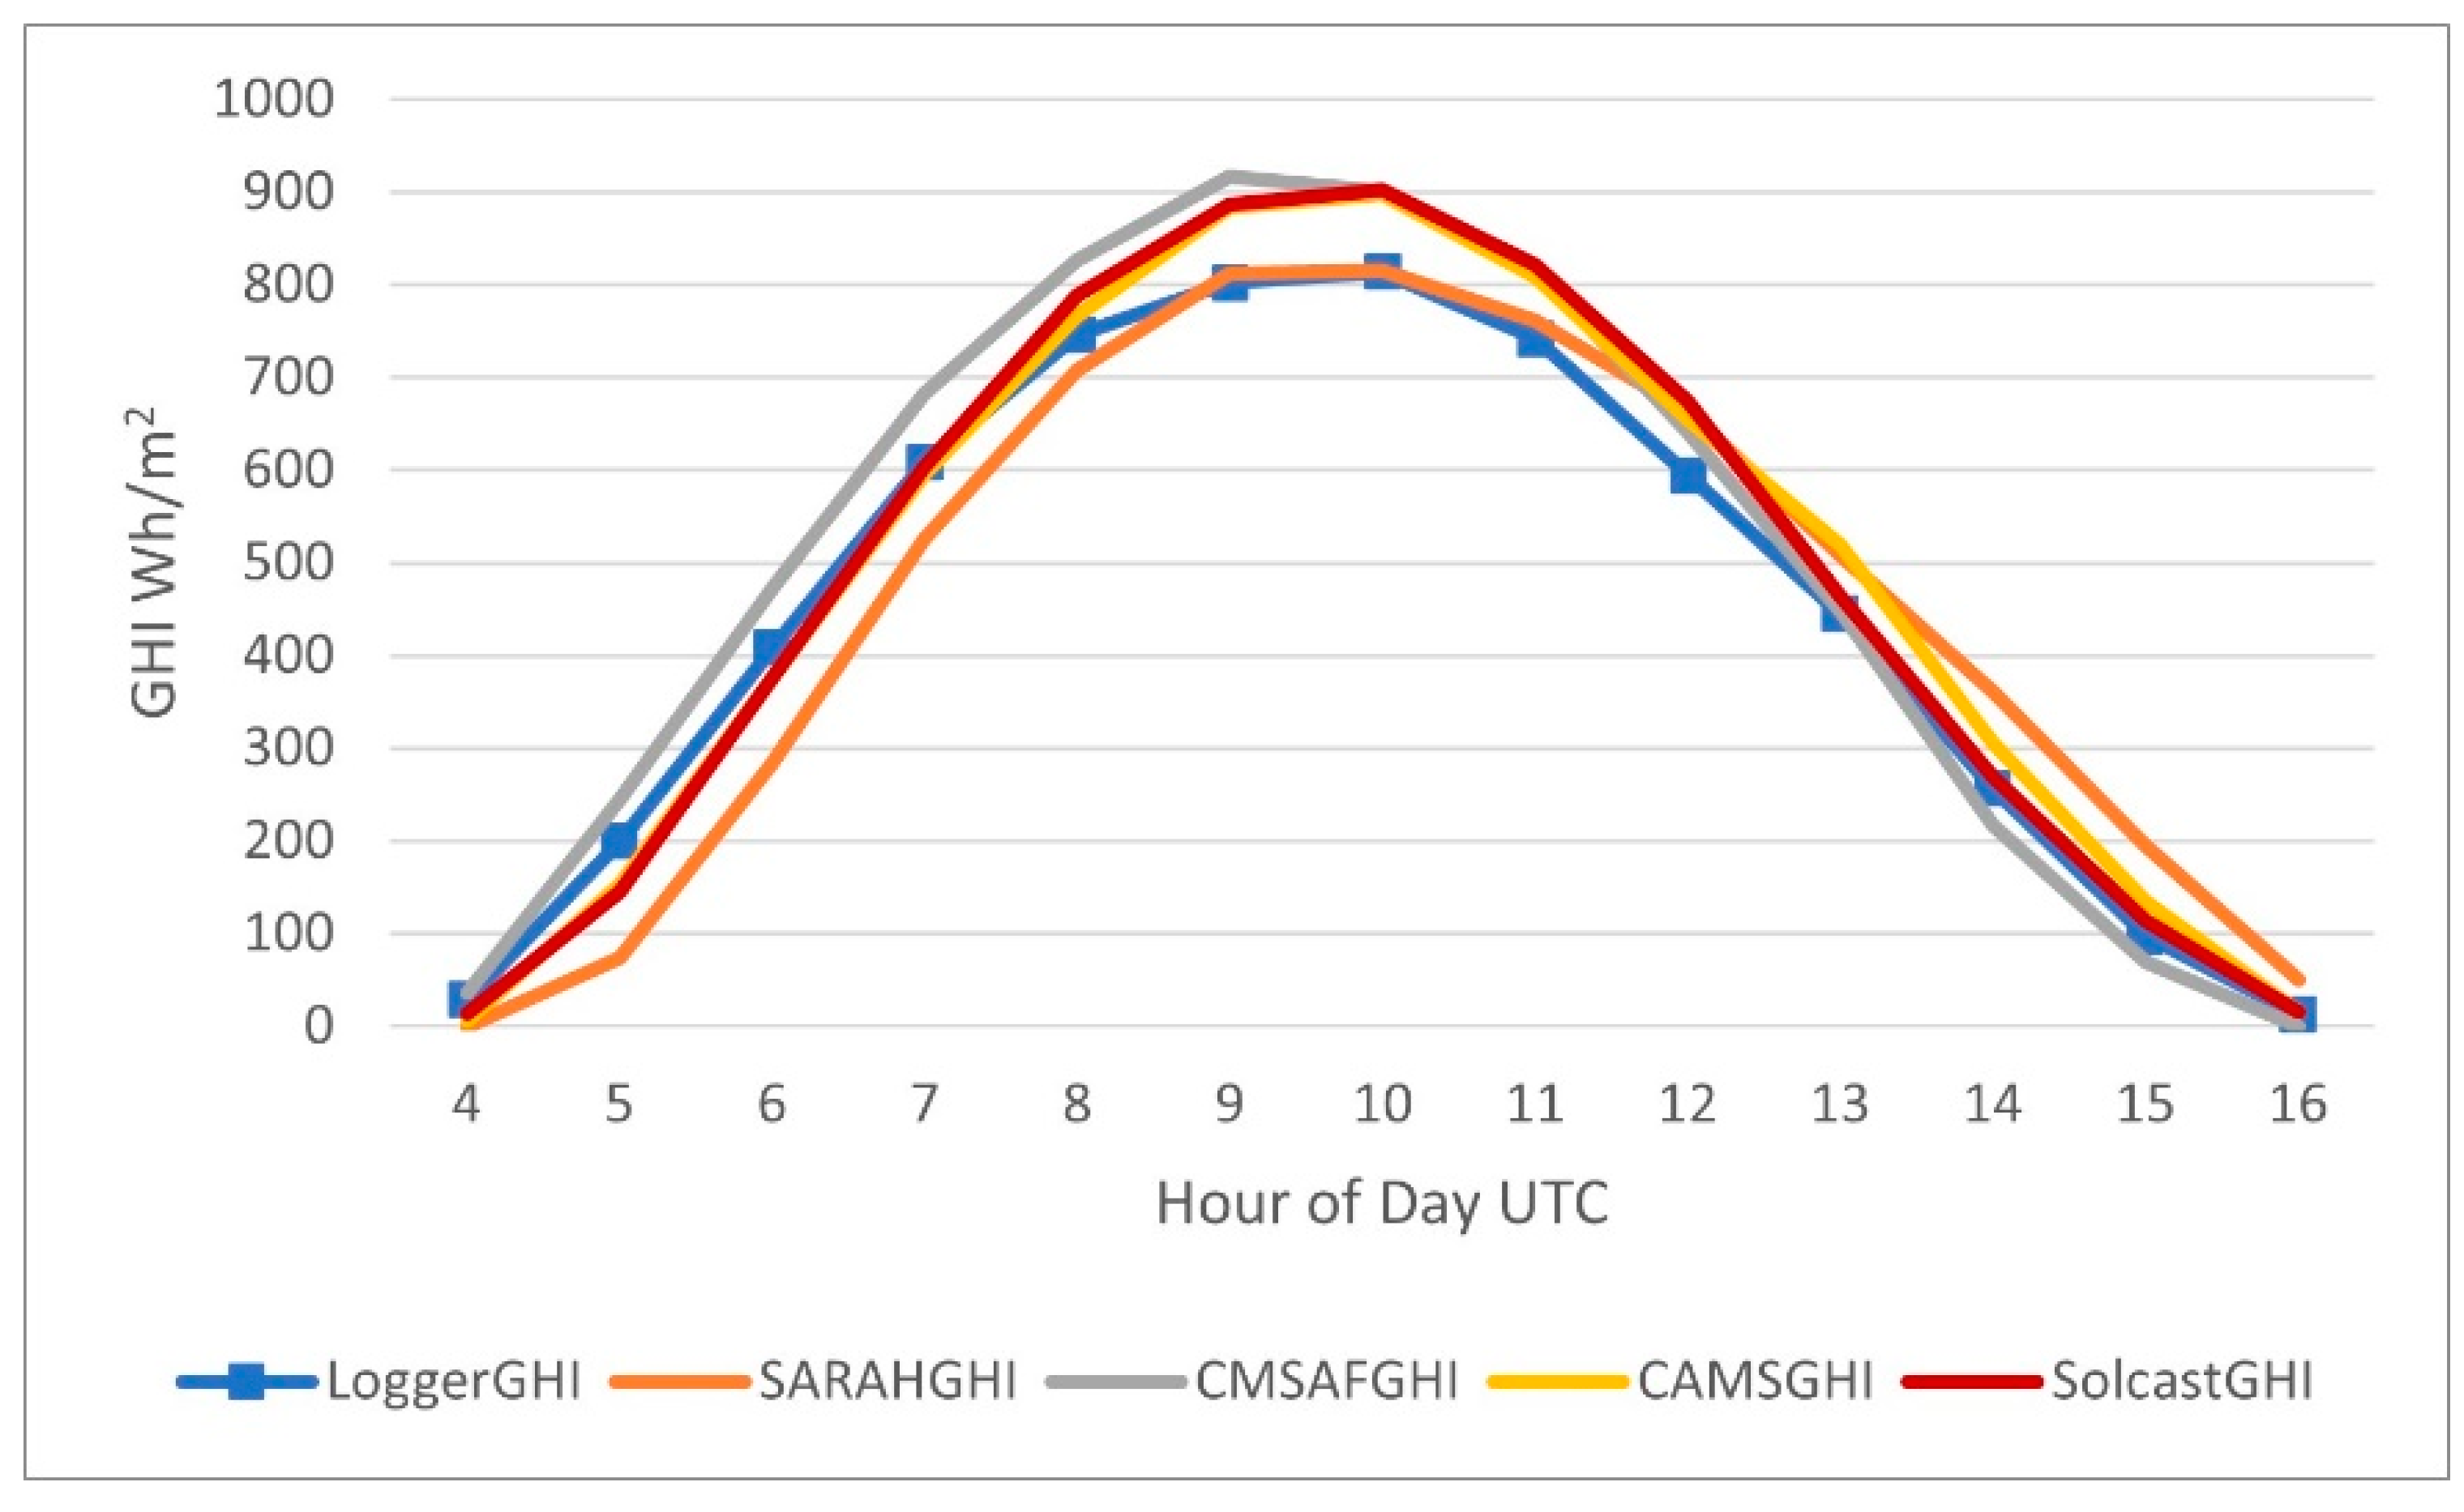
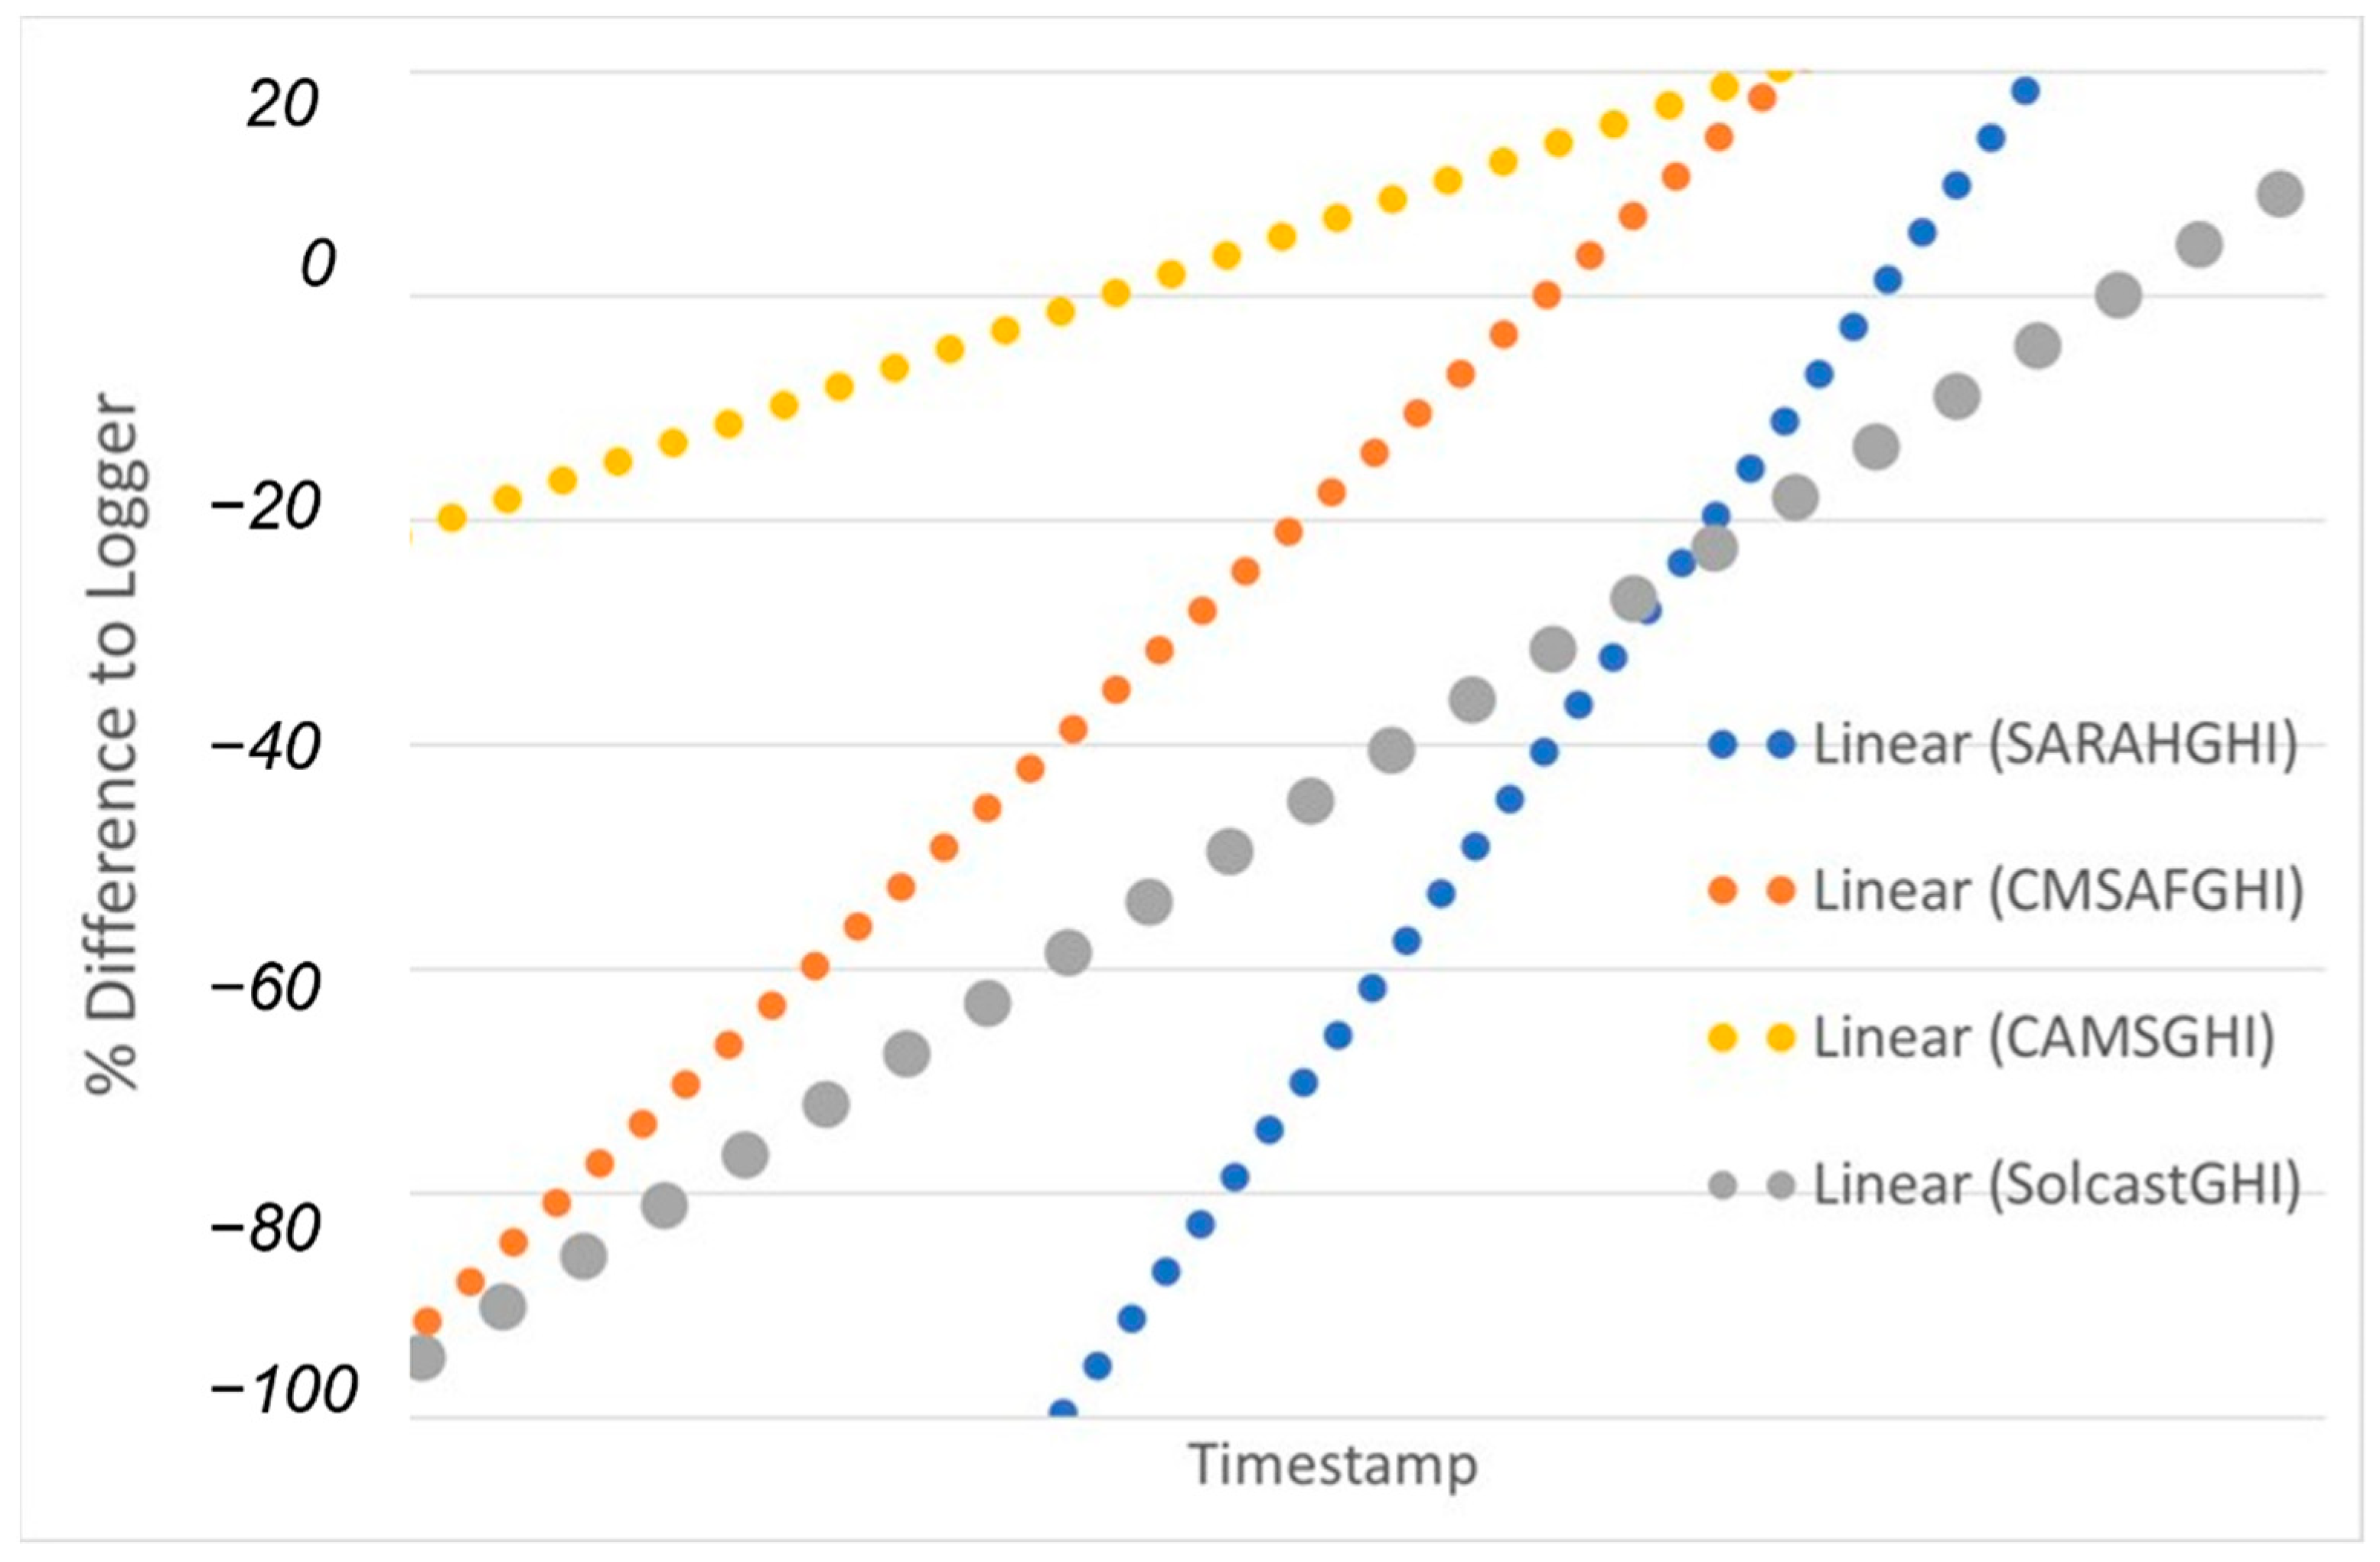
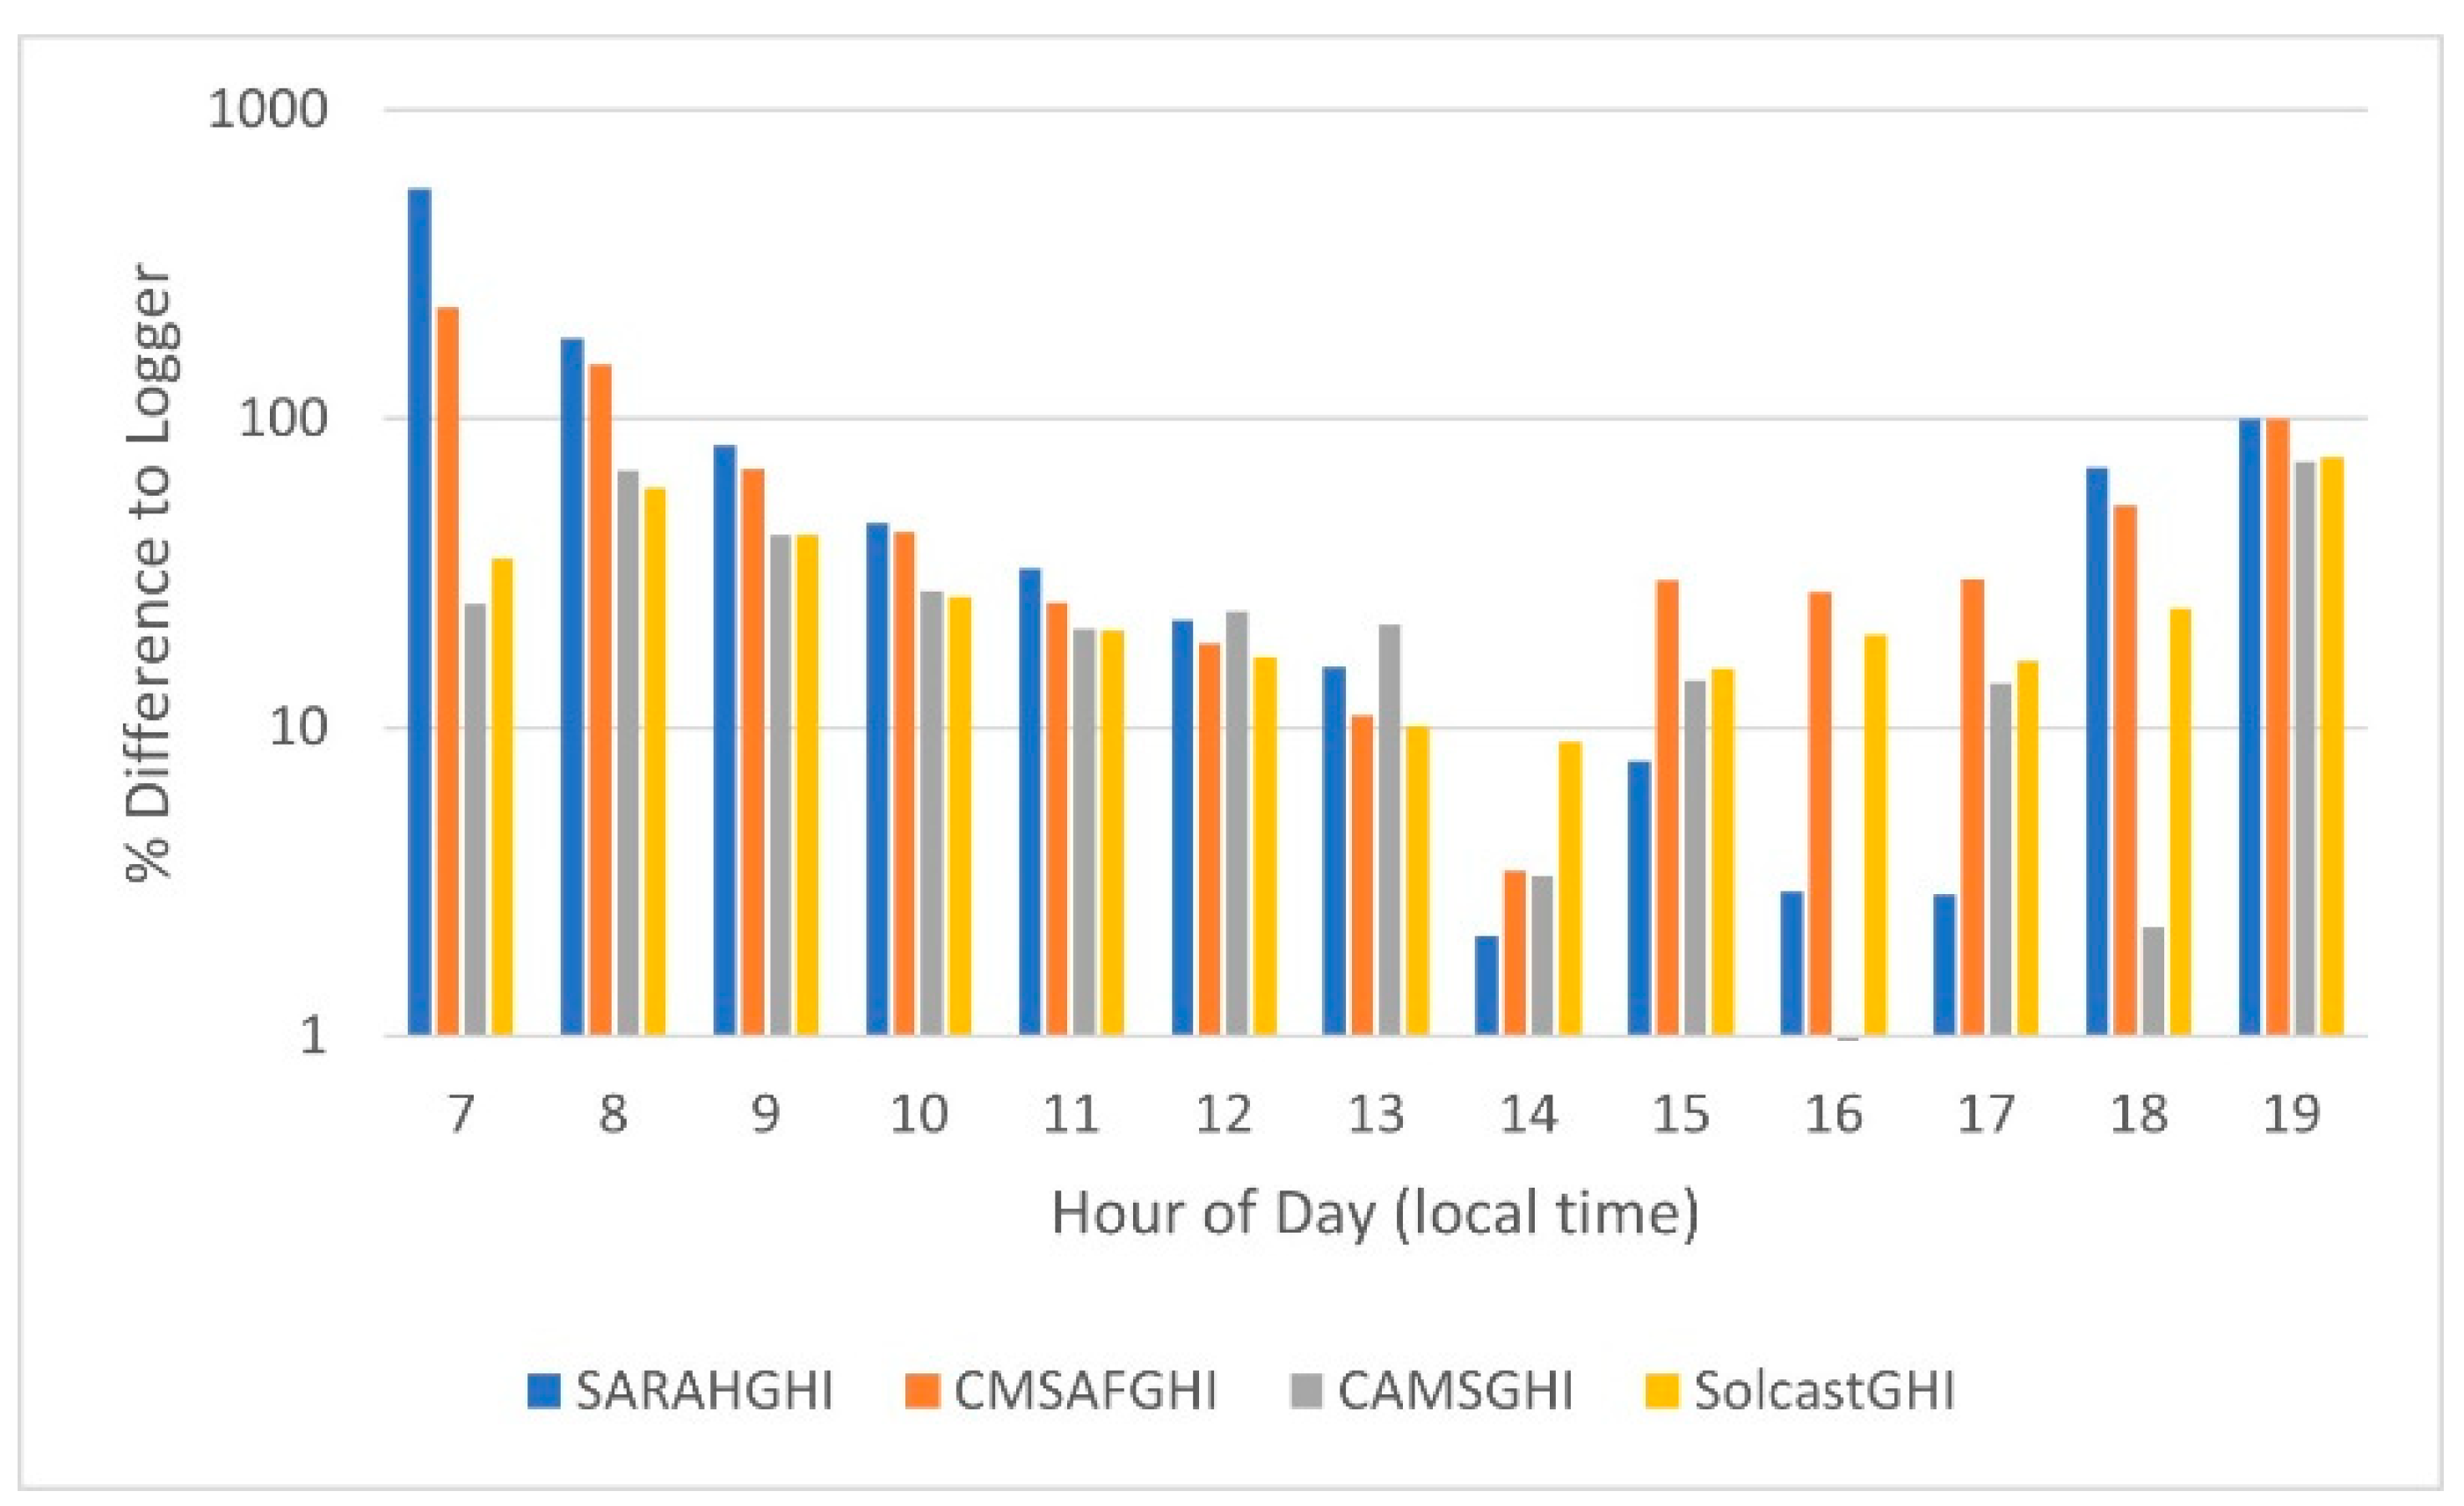
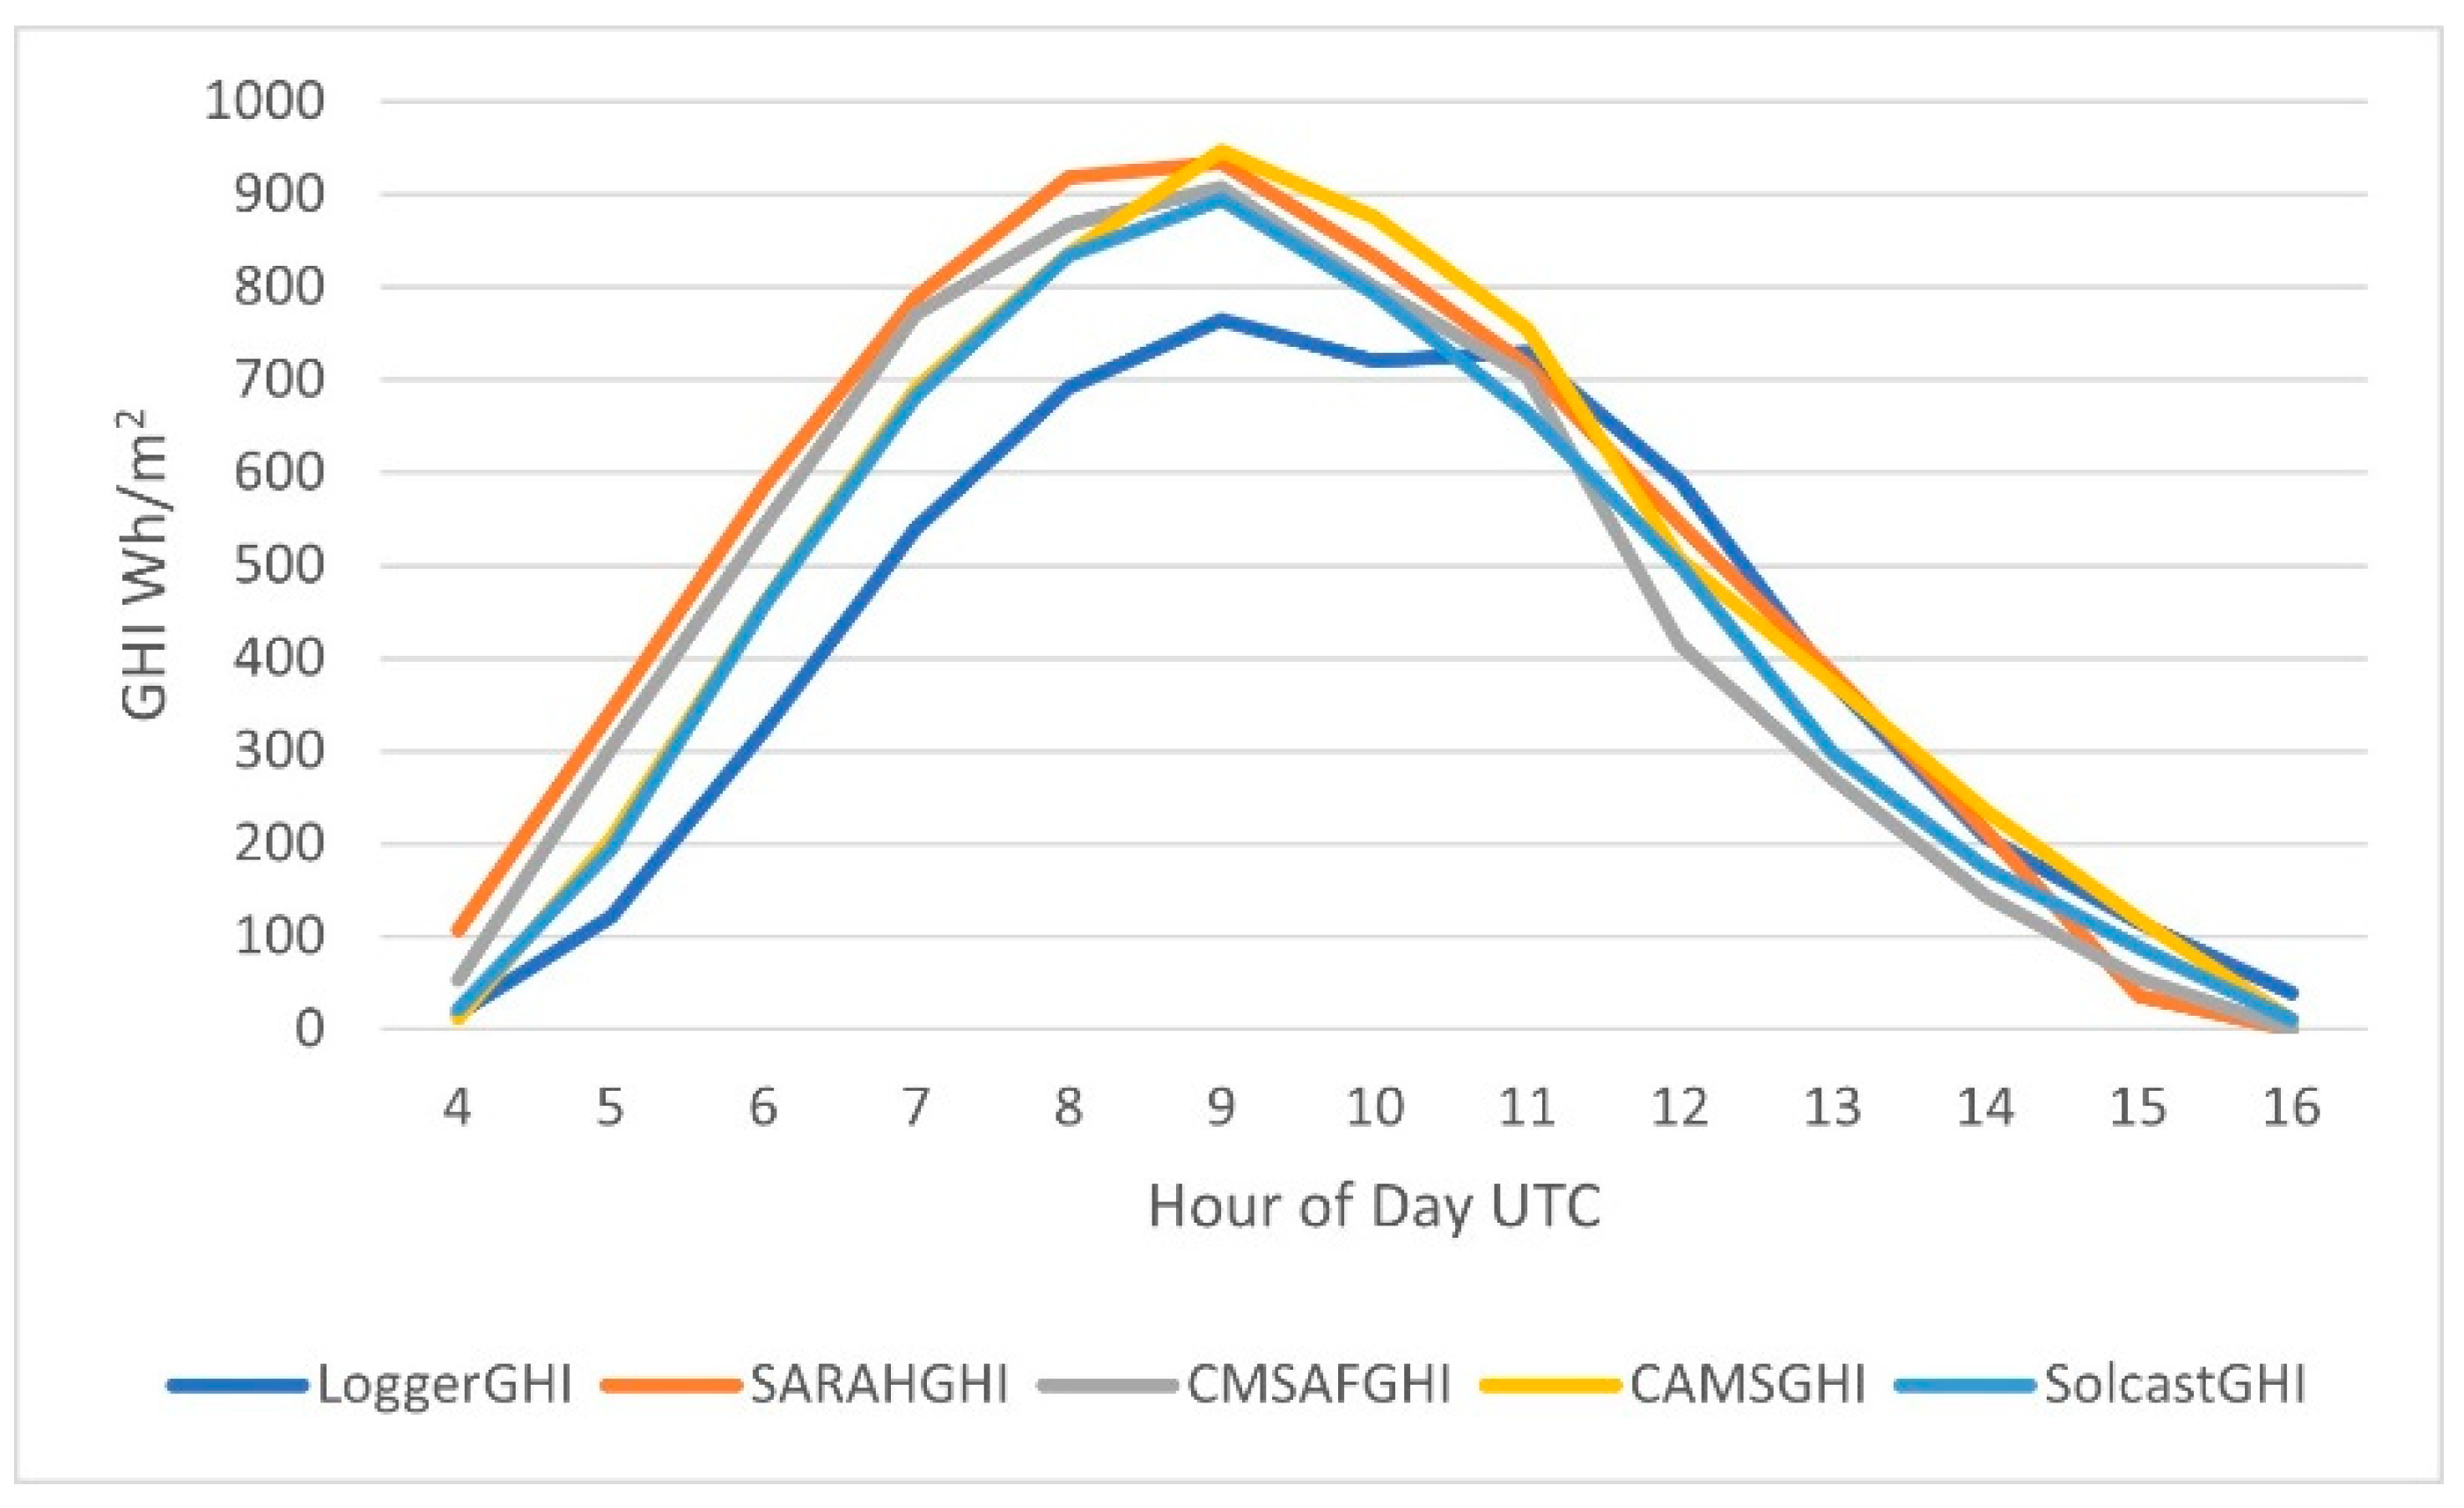
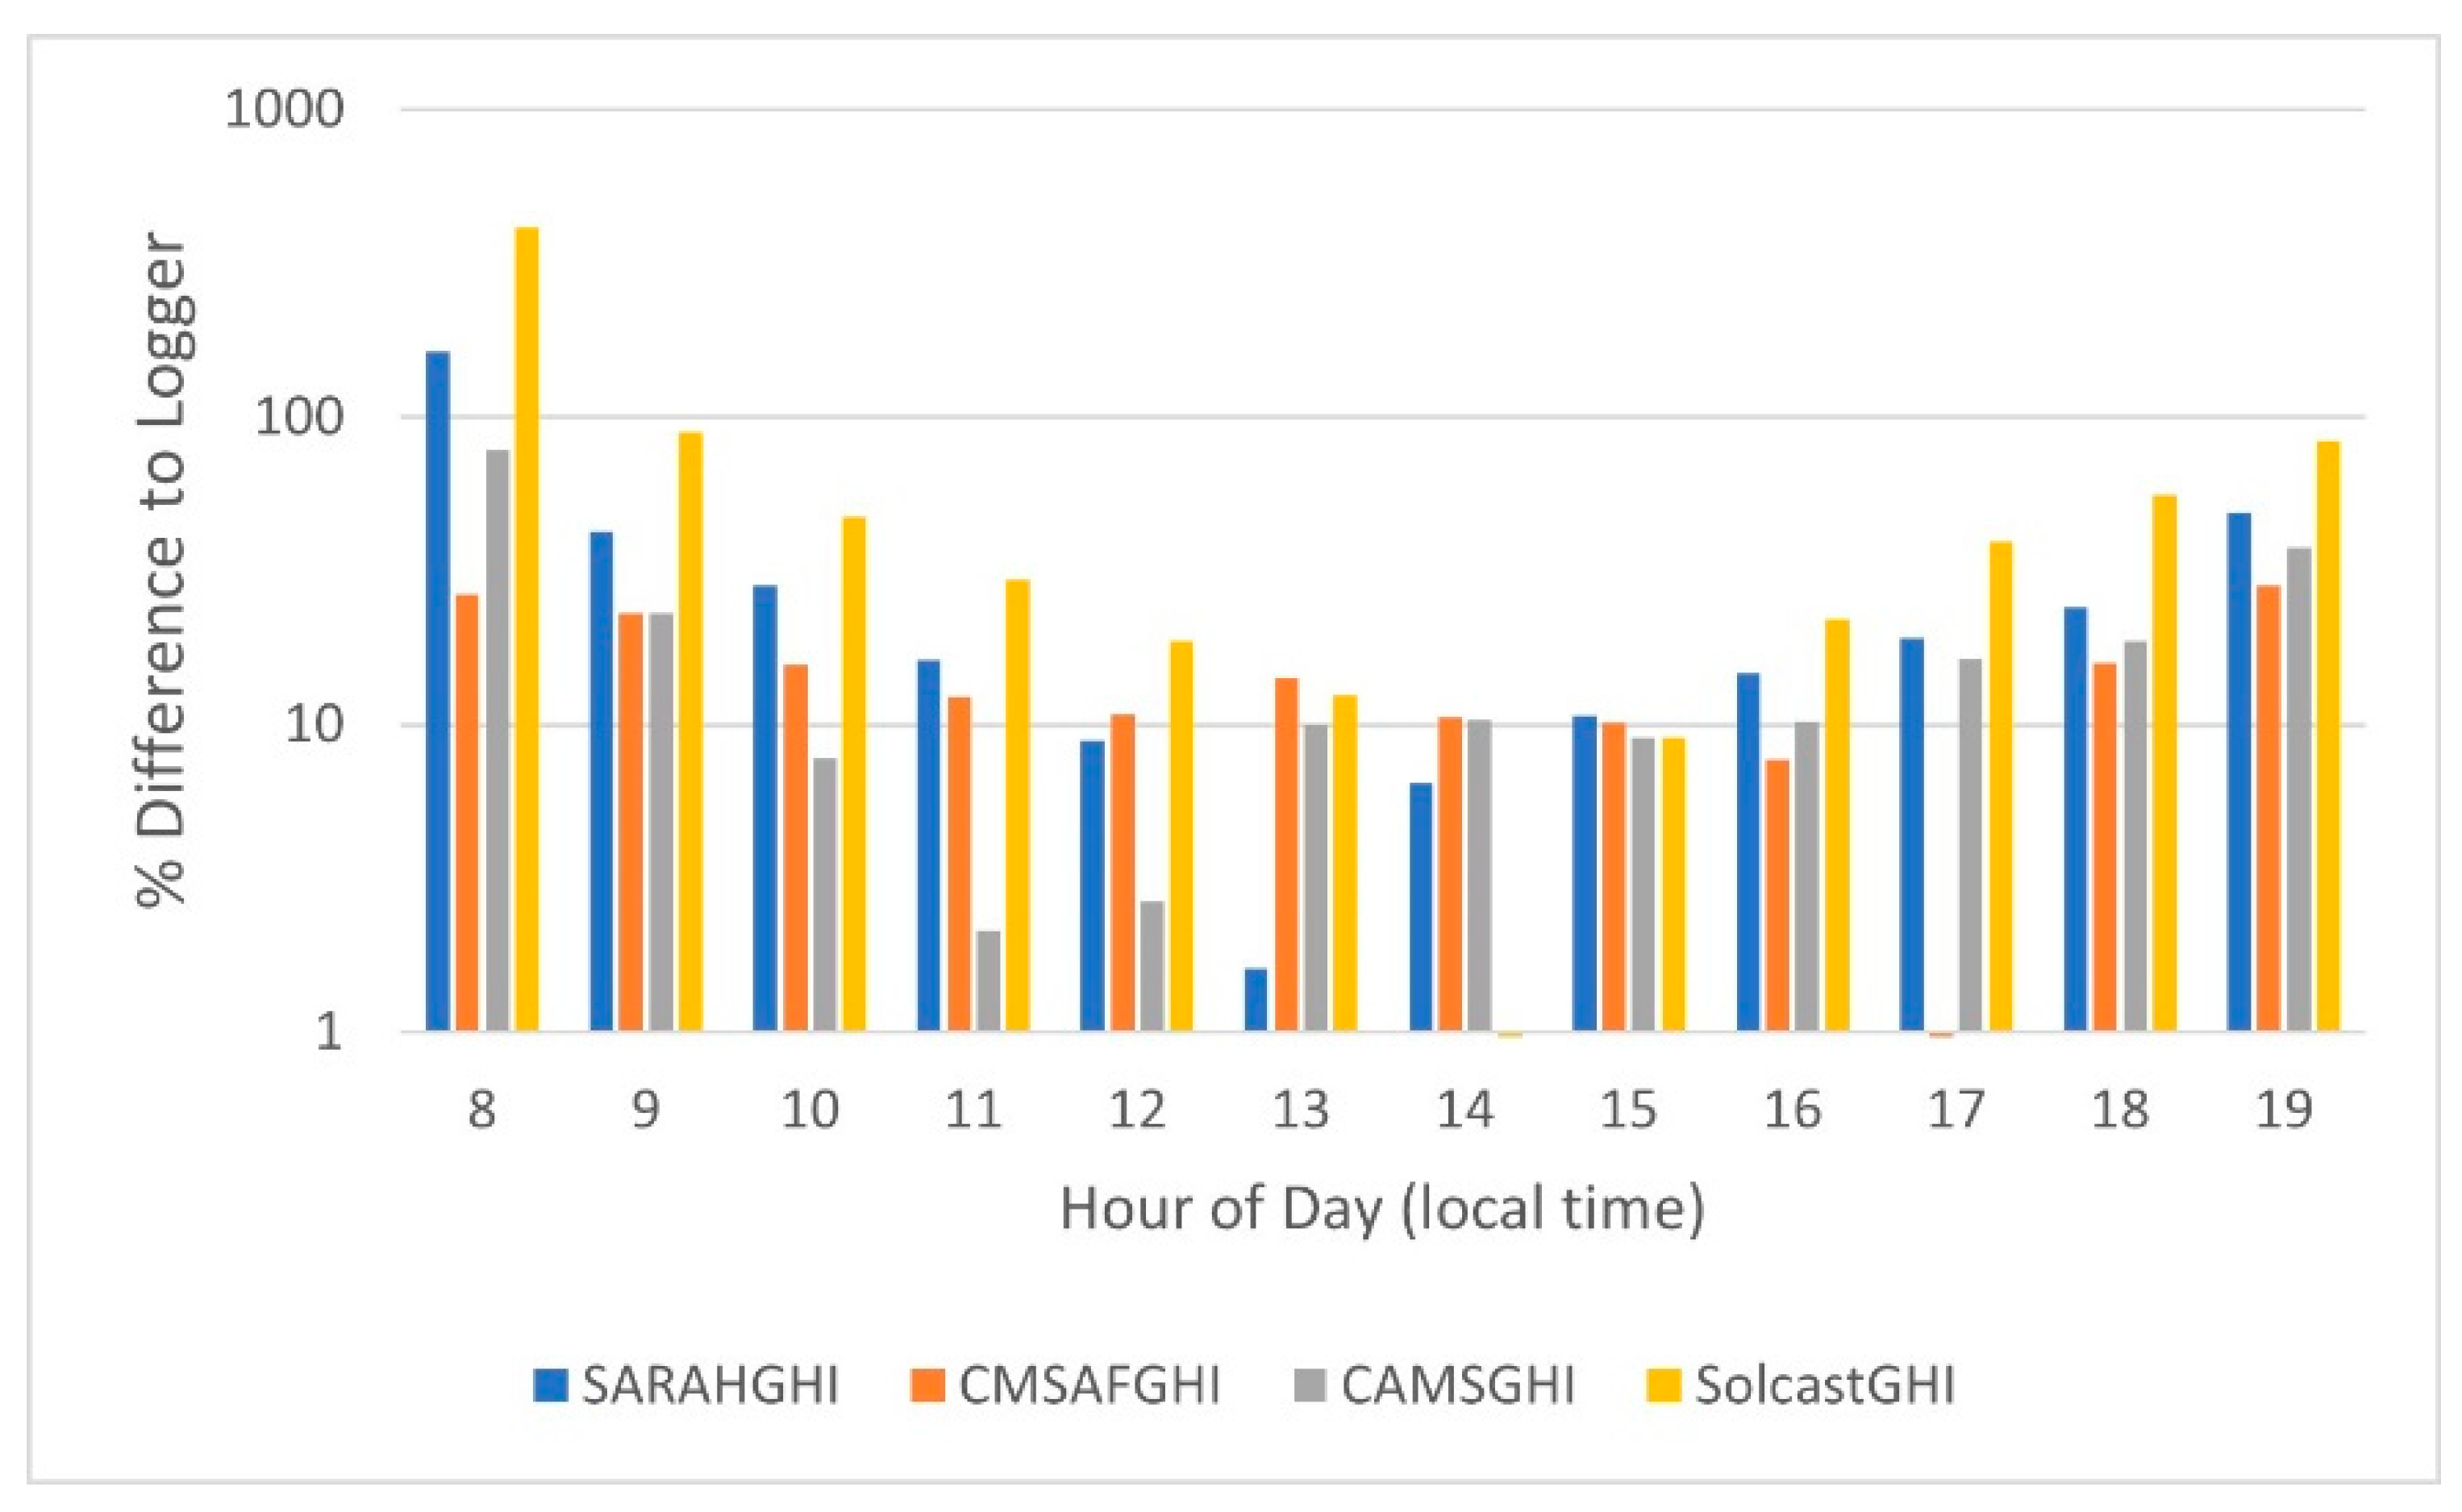
4.2.2. Instantaneous Accuracy of the GHI Satellite Databases
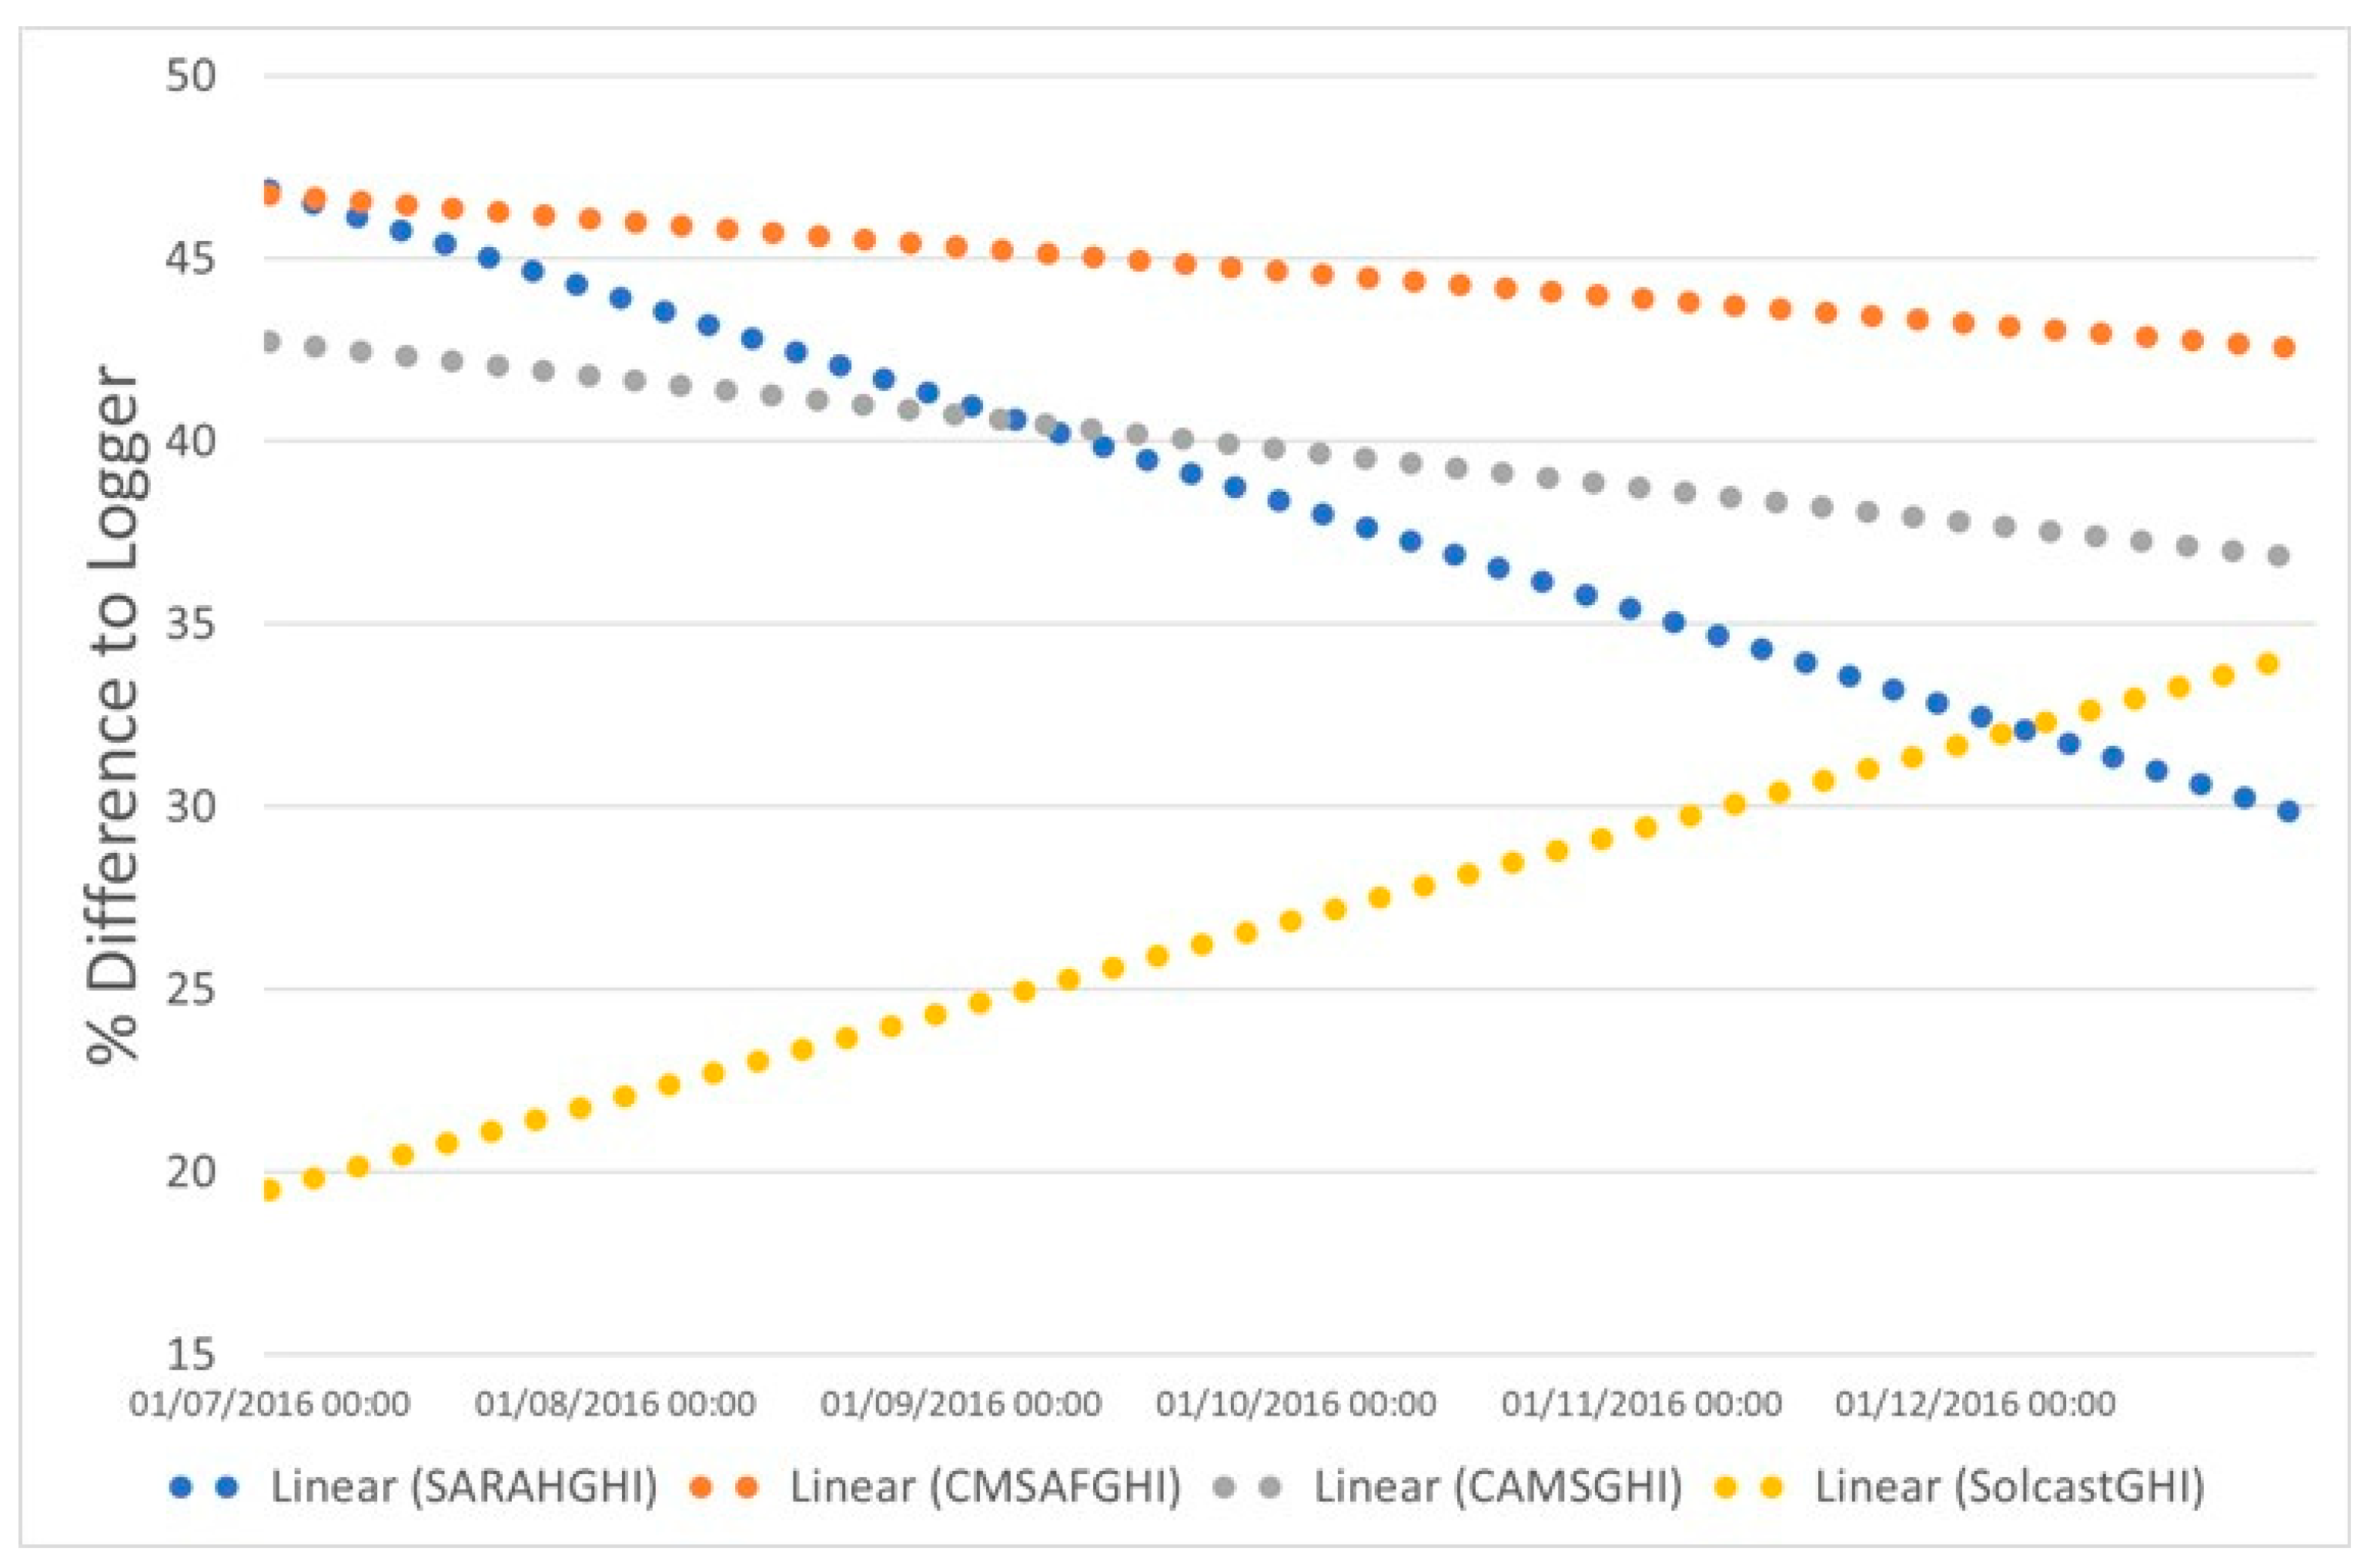
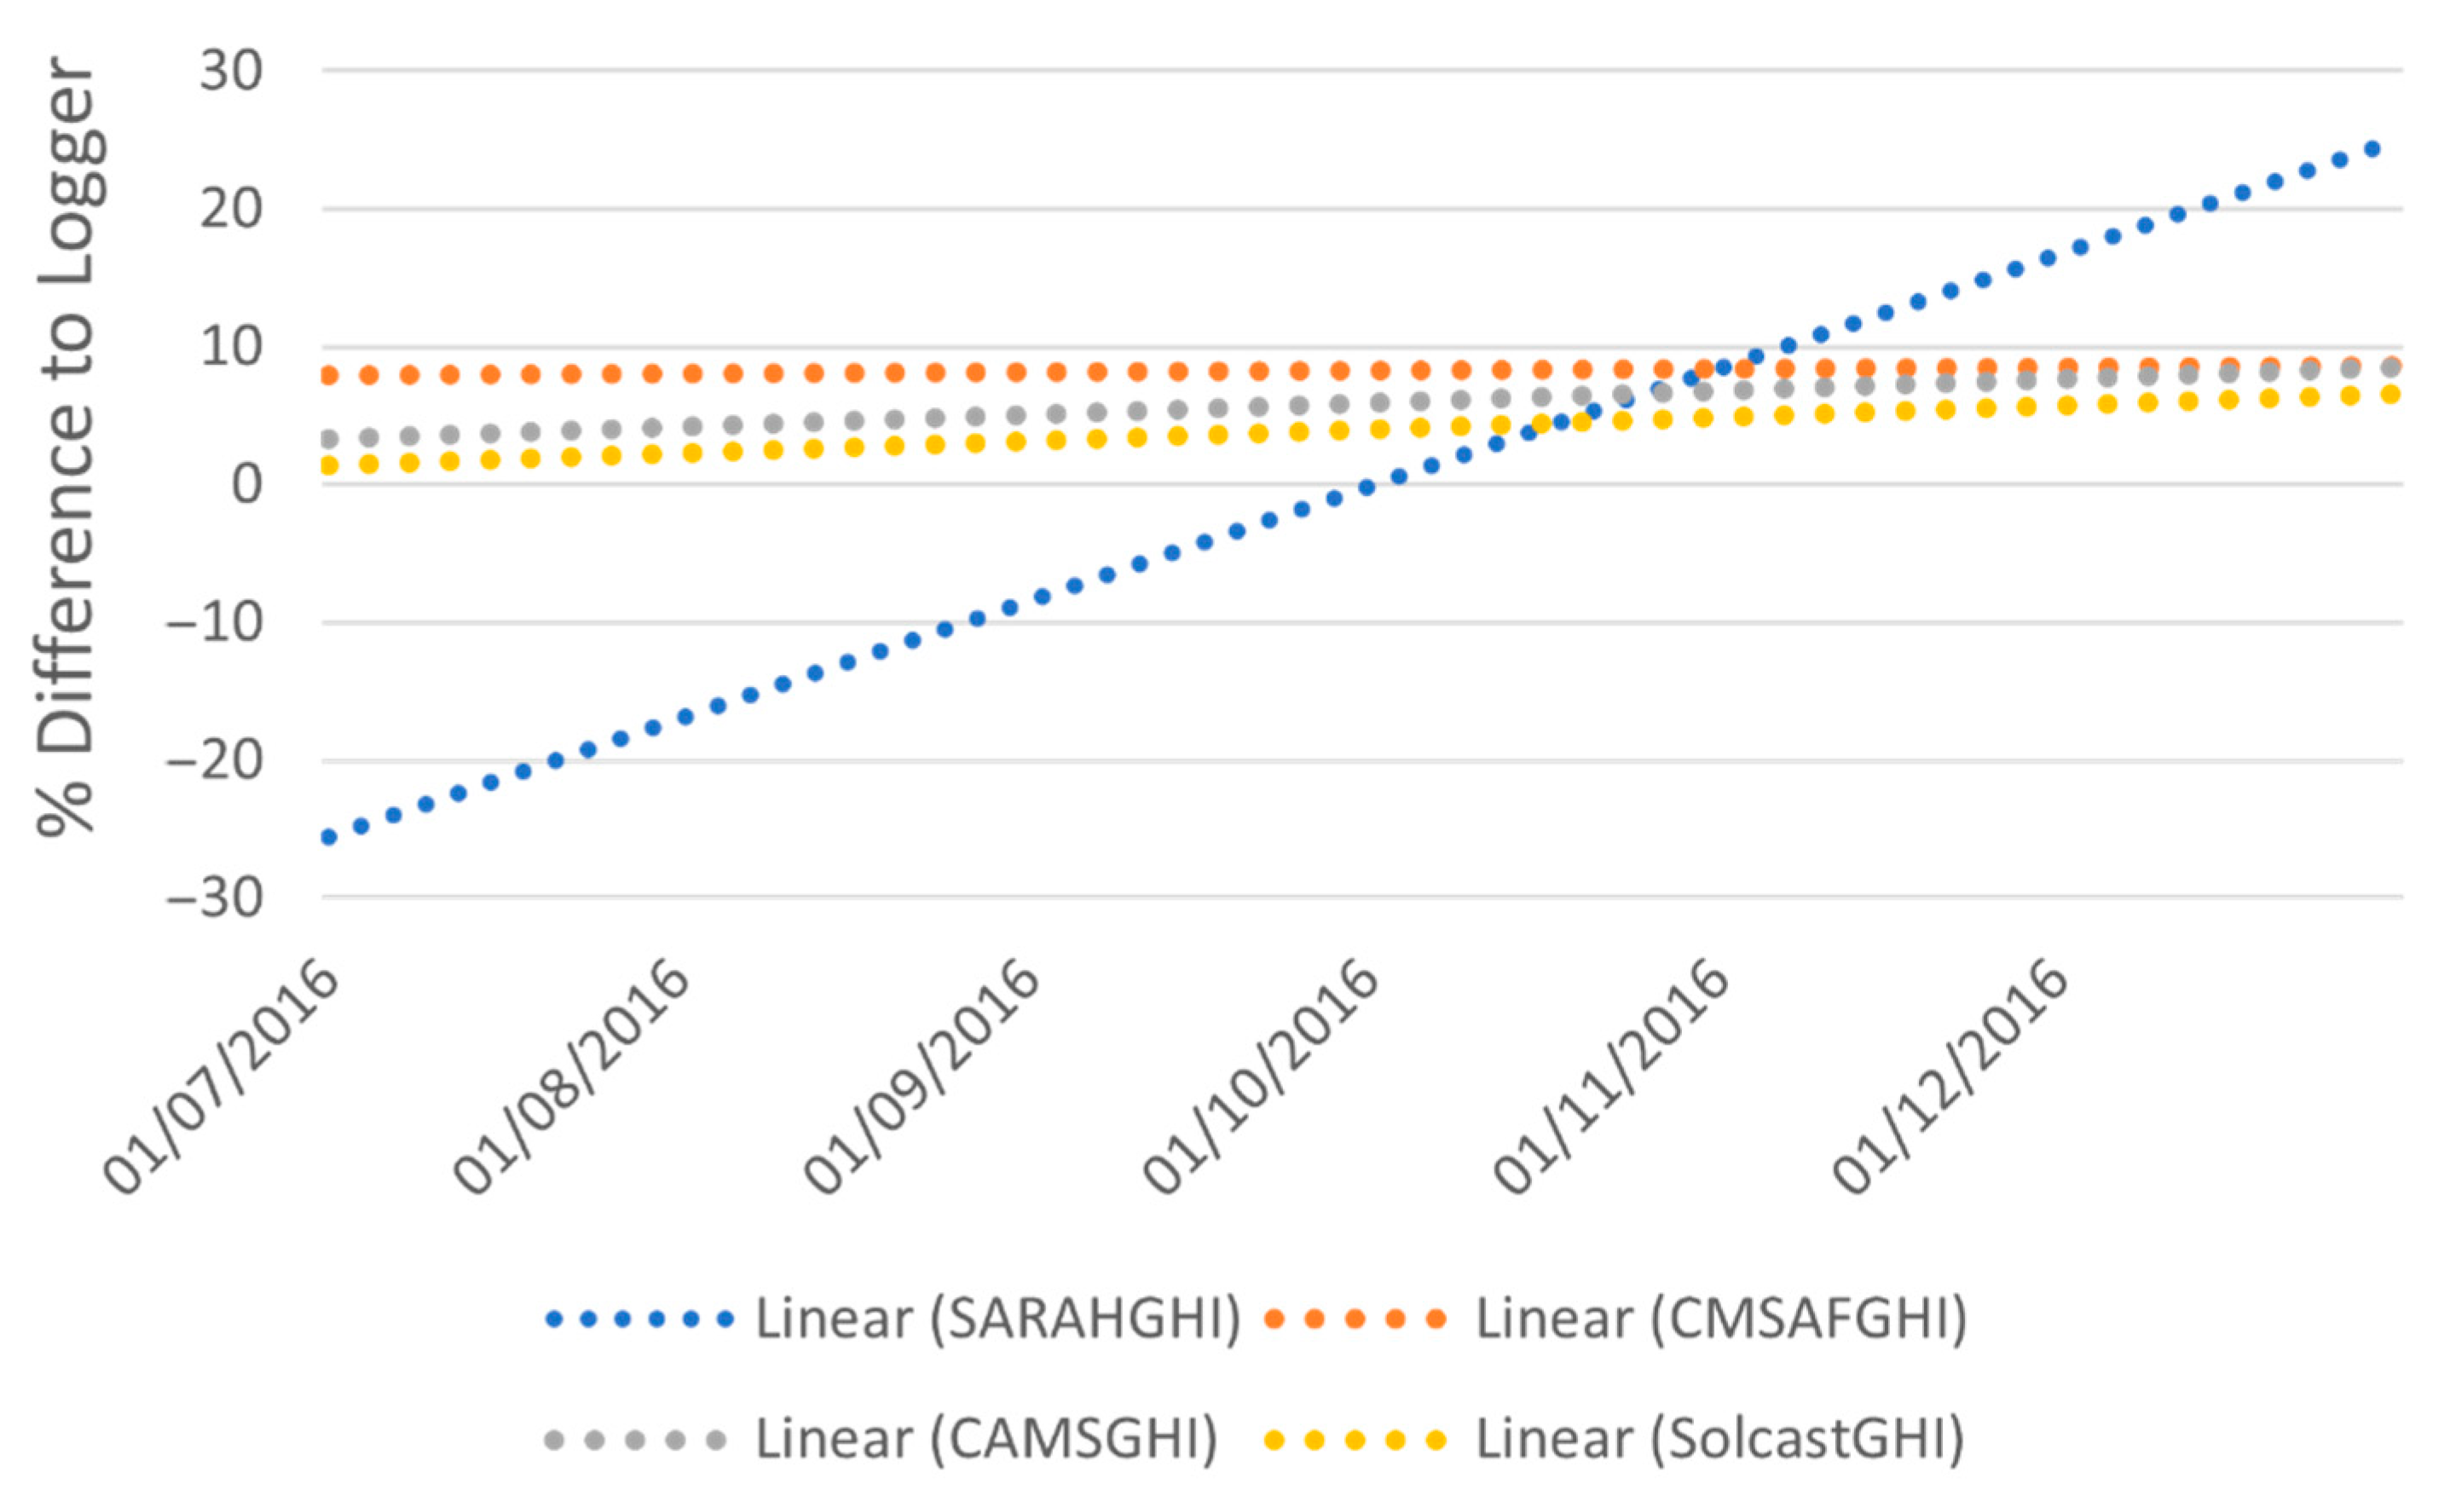
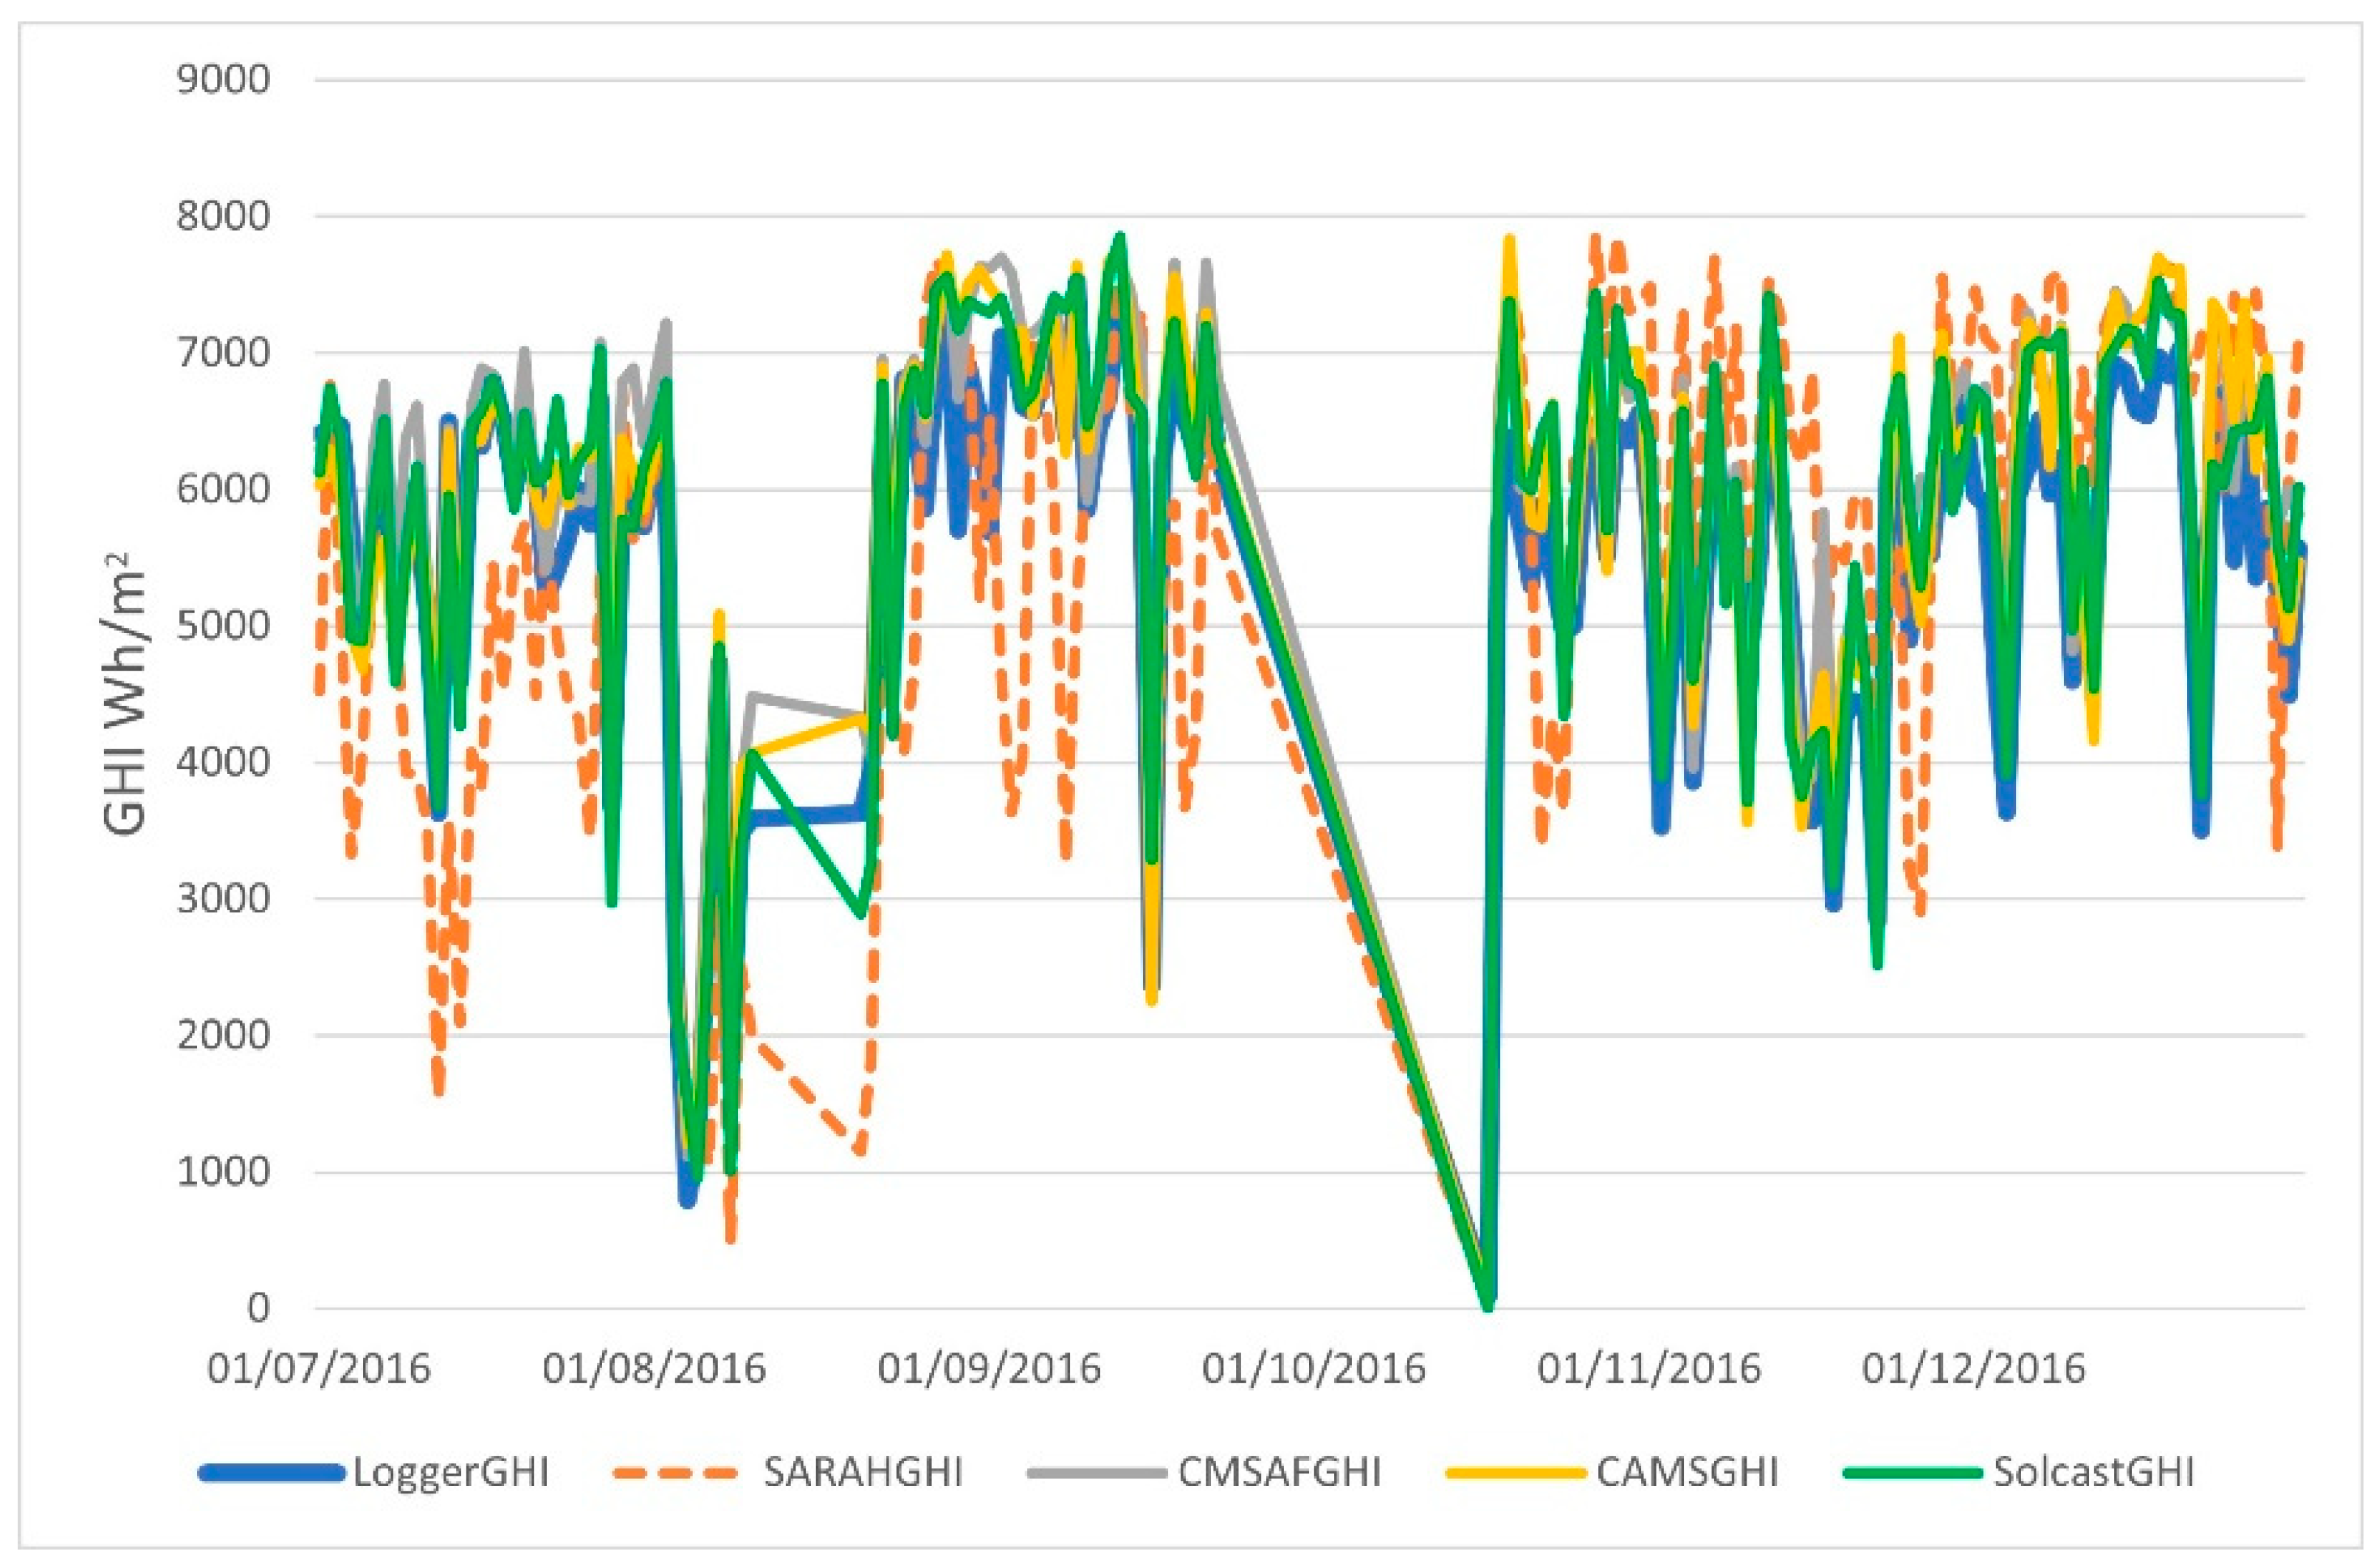
4.2.3. Managing Changing Uncertainties and Preserving the Temporal Pattern of the Data
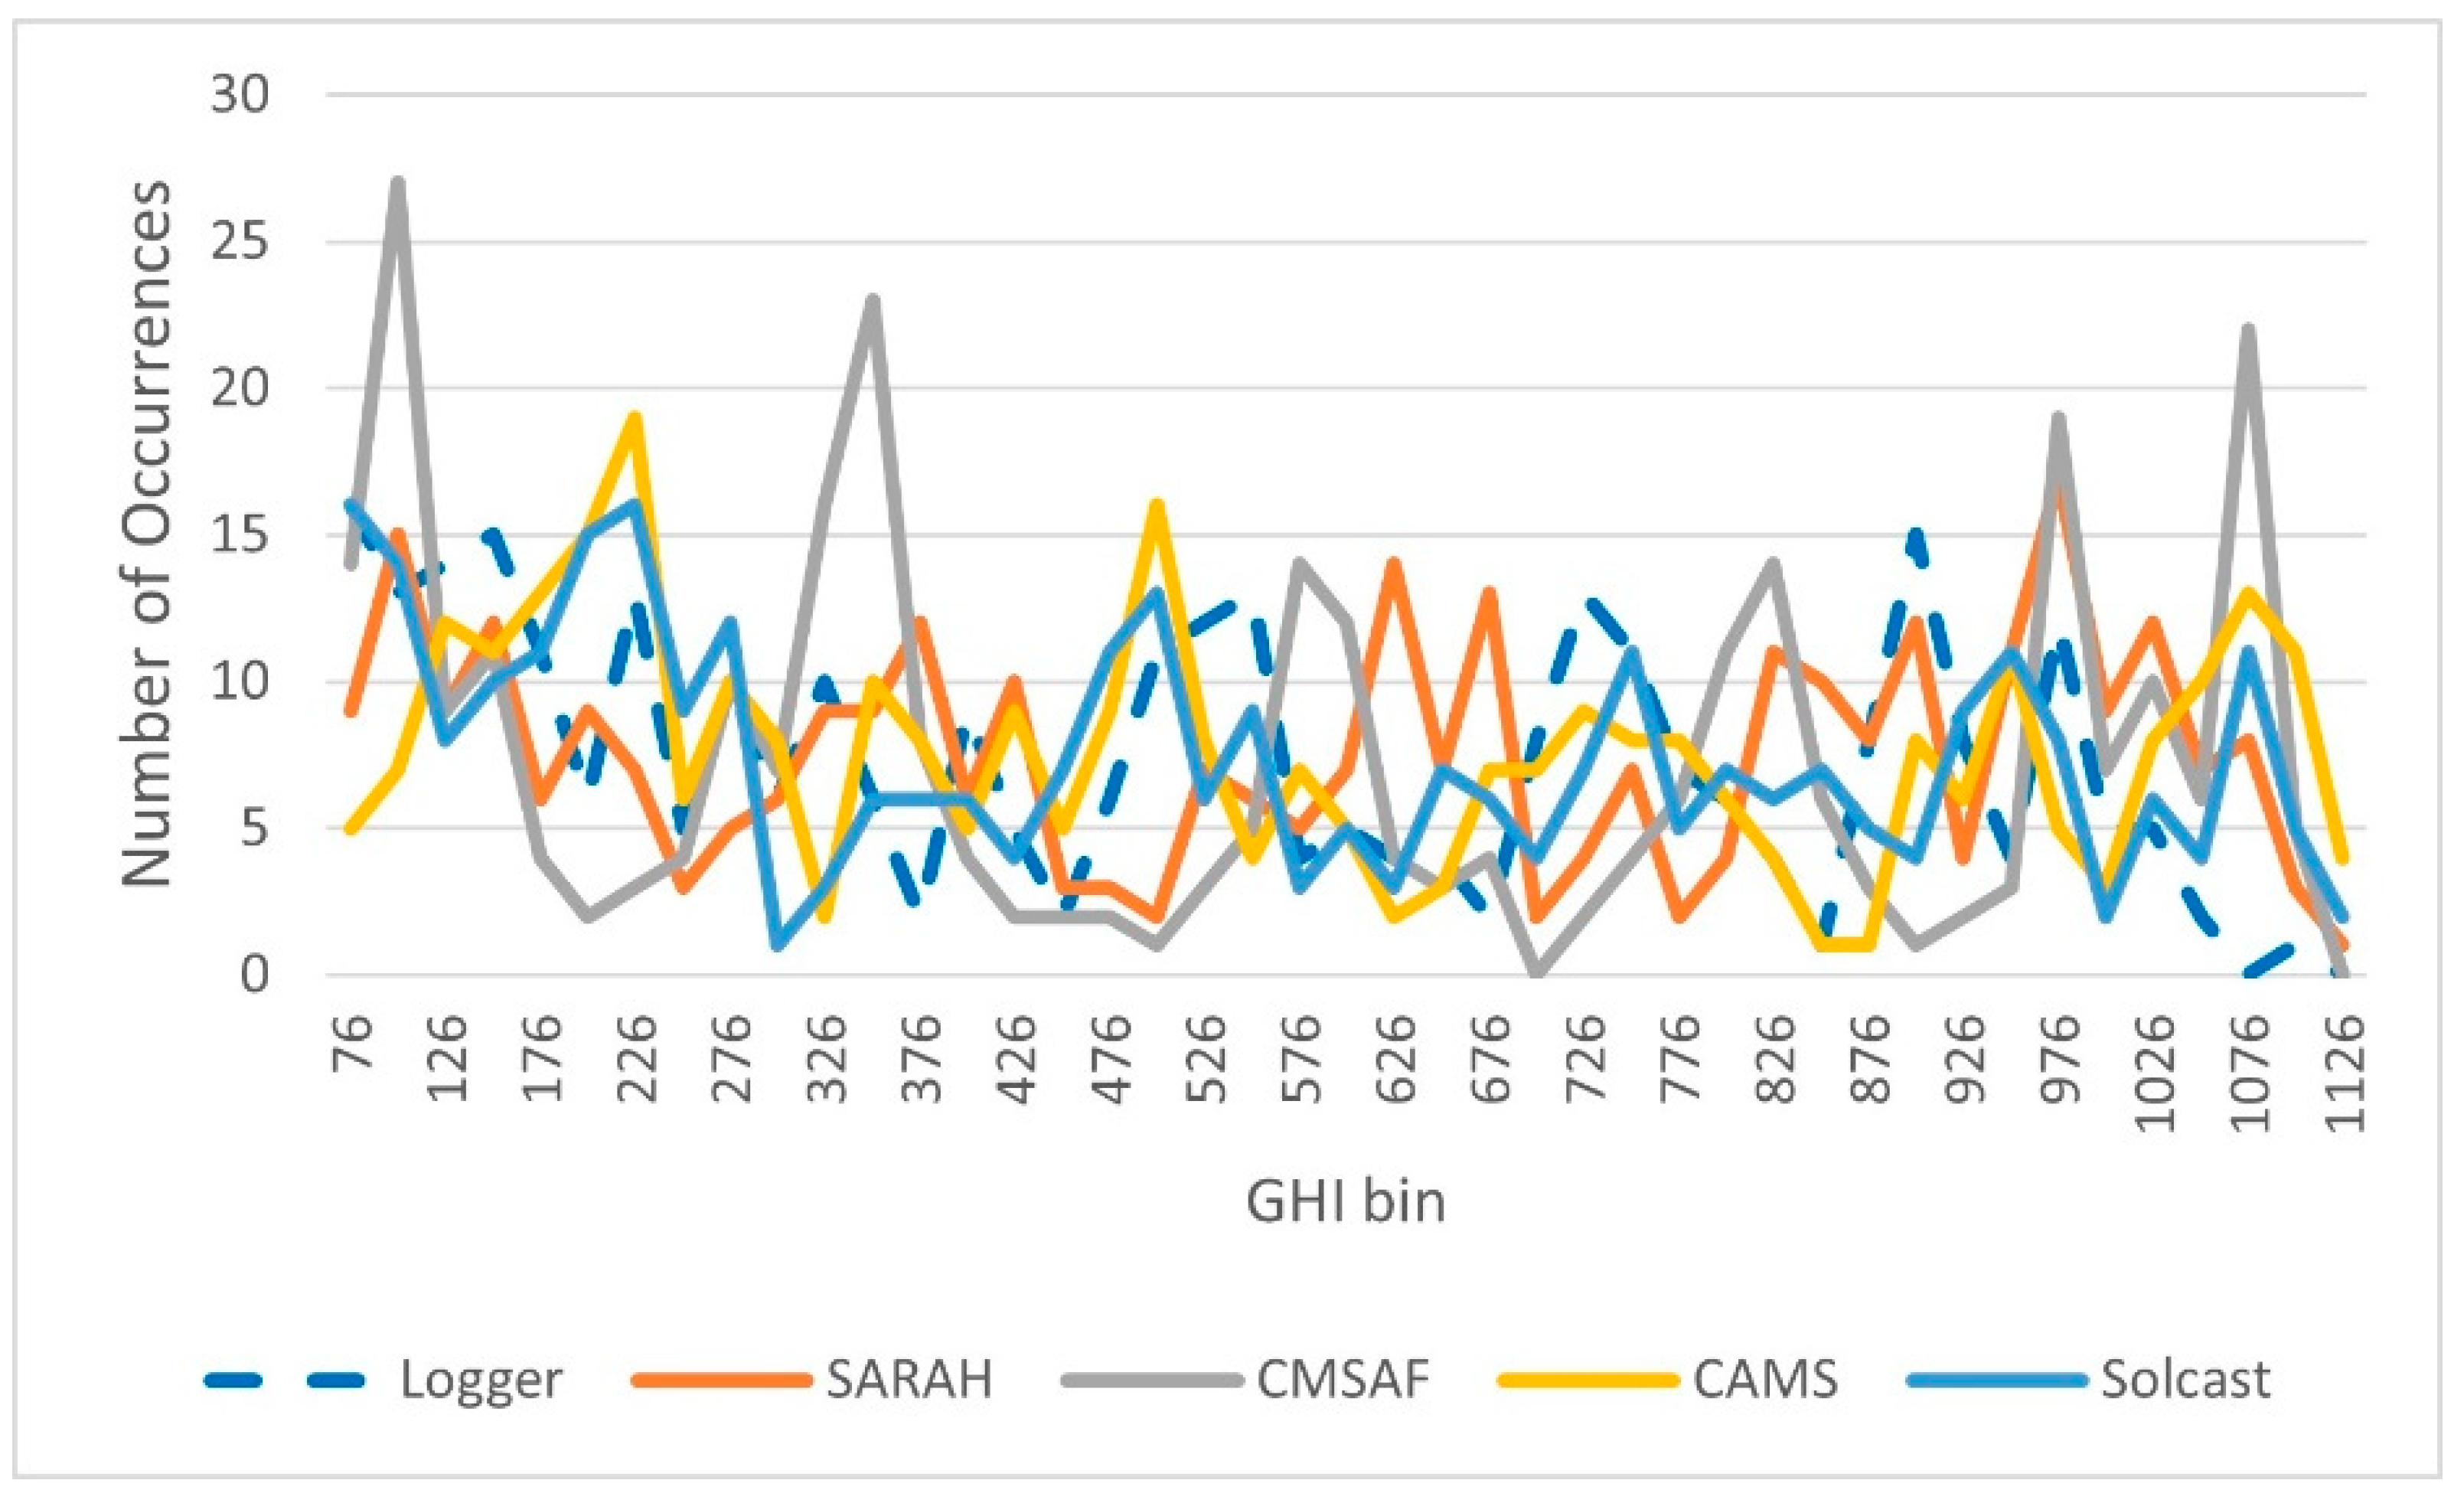
4.2.4. Statistics for the Ground-Based Measurements and GHI Satellite Databases
5. Discussion
6. Conclusions
Author Contributions
Funding
Institutional Review Board Statement
Informed Consent Statement
Data Availability Statement
Conflicts of Interest
Glossary
| Abbreviation | Definition |
| BSRN | Baseline Surface Radiation Network |
| CAMS | Copernicus Atmosphere Monitoring Service |
| CMSAF | Climate Monitoring Satellite Application Facility |
| ETR | Extraterrestrial irradiation |
| EUMETSAT | European Organisation For the Exploitation of Meteorological Satellites |
| GHI | Global horizontal irradiation |
| h | Solar Elevation |
| JRC | Joint Research Centre |
| MECS | Modern Energy Cooking Services Programme |
| nMBE | Normalised Mean Bias Error |
| MERRA-2 | Modern Era Retrospective Analysis for Research and Applications, Version 2 |
| MVIRI | Meteosat Visible Infra-Red Imager |
| nRMSE | normalised Root Mean Error |
| PMCC | Pearson Product-Moment Correlation Coefficient |
| PV | Photovoltaic |
| PVGIS | Photovoltaic Geographical Information System |
| QC | Quality Control |
| SARAH | Surface Solar Radiation Dataset-Heliosat |
| SEVIRI | Spinning Enhanced Visible and Infrared Imager |
| SoNG | Solar Nano Grids |
| SPECMAGIC | SPECtral Mesoscale Atmospheric Global Irradiance Code |
| SPECtral | Shuttle Radar Topography Mission |
| SRTM | Shuttle Radar Topography Mission |
| WRMC | World Radiation Monitoring Centre |
Appendix A
Quality Control of Lemolo and Echareria Data

| Type of Test | Test Name | Test Description | Quality Criteria |
|---|---|---|---|
| TD | Temporal Drift | Clock drift detection | i. Comparative hourly plots between datasets |
| ii. Comparative hourly plots between datasets and clear sky values 1. | |||
| PT | Upper Limit | Upper bound when comparing surface solar radiation data against the extraterrestrial solar radiation 2. | GHI/ETR < 1 if h > 2° |
| PT | Upper Clear sky Limit | Upper bound when comparing surface solar radiation data against the clear sky solar radiation 1. | GHI/Clear sky irradiance <= 1.1 if h > 2° |
| PT | Lower Limit | Lower bound for heavily overcast conditions with low atmospheric transparency. | GHI ≥ 0.03 × ETR |
| PT | Clear sky hours | Number of clear sky hours 3. | |
| PT | Daily Lower Limit | Lower bounds for GHI in heavily overcast conditions with low atmospheric transparency. The daily mean µ is calculated from data when the sun is above the horizon (daylight hours). | µ (GHI/ETR) ≥ 0.03 |
| S | Step | Plausible rate of change between two successive timestamps. | If h > 2° |
| S | Shadow | Shadow contamination: rapid drop of values followed by sudden increase. | If h > 2° |
| P | Persistence | Check for variability of measurements/sensor failure. The daily mean µ and standard deviation σ are calculated from data when the sun is above the horizon (daylight hours). | |
| SC | Spatial Consistency/Sum | Comparison of the sum of GHI for 990 h in the period under review when both weather instruments report data. | |
| SC | Completeness of data | Percentage of hours in the measurement period for which data exists. |
| Test Name | Lemolo B | Echareria |
|---|---|---|
| Upper Limit | 22 | 15 |
| Upper Clear sky Limit | 0.9 | 7 |
| Lower Limit | 9 | 9 |
| Daily Lower Limit | 0 | 4 |
| Step | 0.1 | 0 |
| Shadow | 2.7 | 7 |
| Persistence | 0 | 0 |
| Test Name | Lemolo B | Echareria |
|---|---|---|
| Percentage of Clearsky hours in test period | 54 | 50 |
| Average GHI of clear sky hours Wh/m2 | 700 | 500 |
| Sum of GHI for 990 h when both data loggers report data kWh/m2 | 237 | 219 |
| Percentage completeness of data 2016–2017 | 93 | 11 |
| Percentage completeness of data 2017 only | 100 | 6 |
Appendix B
| HOURLY | No. Values Lemolo | nRMSE % Lemolo | No. Values Echareria | nRMSE % Echareria | nRMSE % Lemolo 715 Values |
|---|---|---|---|---|---|
| PVGIS-SARAH 2016 | 3489 | 82.3 | 715 | 80.8 | 65.7 |
| Solcast 2016 | 3489 | 37.5 | 715 | 57.8 | 50.2 |
| PVGIS_CMSAF 2016 | 3489 | 34 | 715 | 68.6 | 35.4 |
| CAMS 2016 | 3489 | 31.1 | 715 | 53.6 | 33.3 |
| Solcast 2017 | 8102 | 38.6 | 386 | 68.5 | |
| Solcast 2016, 17 | 11,590 | 37.5 | 1100 | 61.6 | |
| CAMS 2017 | 8102 | 38.6 | 386 | 65.7 | |
| CAMS 2016, 17 | 11,590 | 36.5 | 1100 | 57.9 | |
| McClear 2016 | 3489 | 65.9 | 715 | 99.8 | 77.5 |
| McClear 2017 | 8102 | 73.7 | 386 | 100.6 | |
| McClear 2016, 17 | 11,590 | 71.3 | 1100 | 100.1 |
| DAILY | nRMSE % Lemolo (365 Days) | nRMSE % Echareria (365 Days) | nRMSE % Galu (235 Days) | nRMSE % Munje (182 Days) |
|---|---|---|---|---|
| PVGIS-SARAH 2016 | 22.3 | 26.9 | 22.9 | |
| PVGIS_CMSAF 2016 | 10.5 | 12.3 | 15.6 | |
| CAMS | 10.6 | 15.7 | 24.6 | 52.2 |
| Solcast | 9.2 | 11.4 | 27.5 | 53.2 |


| Lemolo | Echareria | Galu | |||||||||||||||
|---|---|---|---|---|---|---|---|---|---|---|---|---|---|---|---|---|---|
| Time Interval | Test | Best | 2nd Best | 3rd Best | Worst of 4 | Worst of 5 | Best | 2nd Best | 3rd Best | Worst of 4 | Worst of 5 | Best | 2nd Best | 3rd Best | Worst of 4 | Best | 2nd Best |
| One min | nRMSE | CAMS | McClear | ||||||||||||||
| 5 min | nRMSE | Solcast | CAMS | ||||||||||||||
| 15 min | nRMSE | Solcast | CAMS | ||||||||||||||
| 15 min | Instant nRMSE | Solcast | CAMS | ||||||||||||||
| 60 min | nRMSE | CAMS | CMSAF | Solcast | McClear | SARAH | CAMS | Solcast | CMSAF | SARAH | McClear | ||||||
| 60 min | Instant nRMSE | CAMS | Solcast | CMSAF | McClear | SARAH | |||||||||||
| 60 min | nMBE | CAMS | CMSAF | Solcast | SARAH | CAMS | Solcast | CMSAF | SARAH | ||||||||
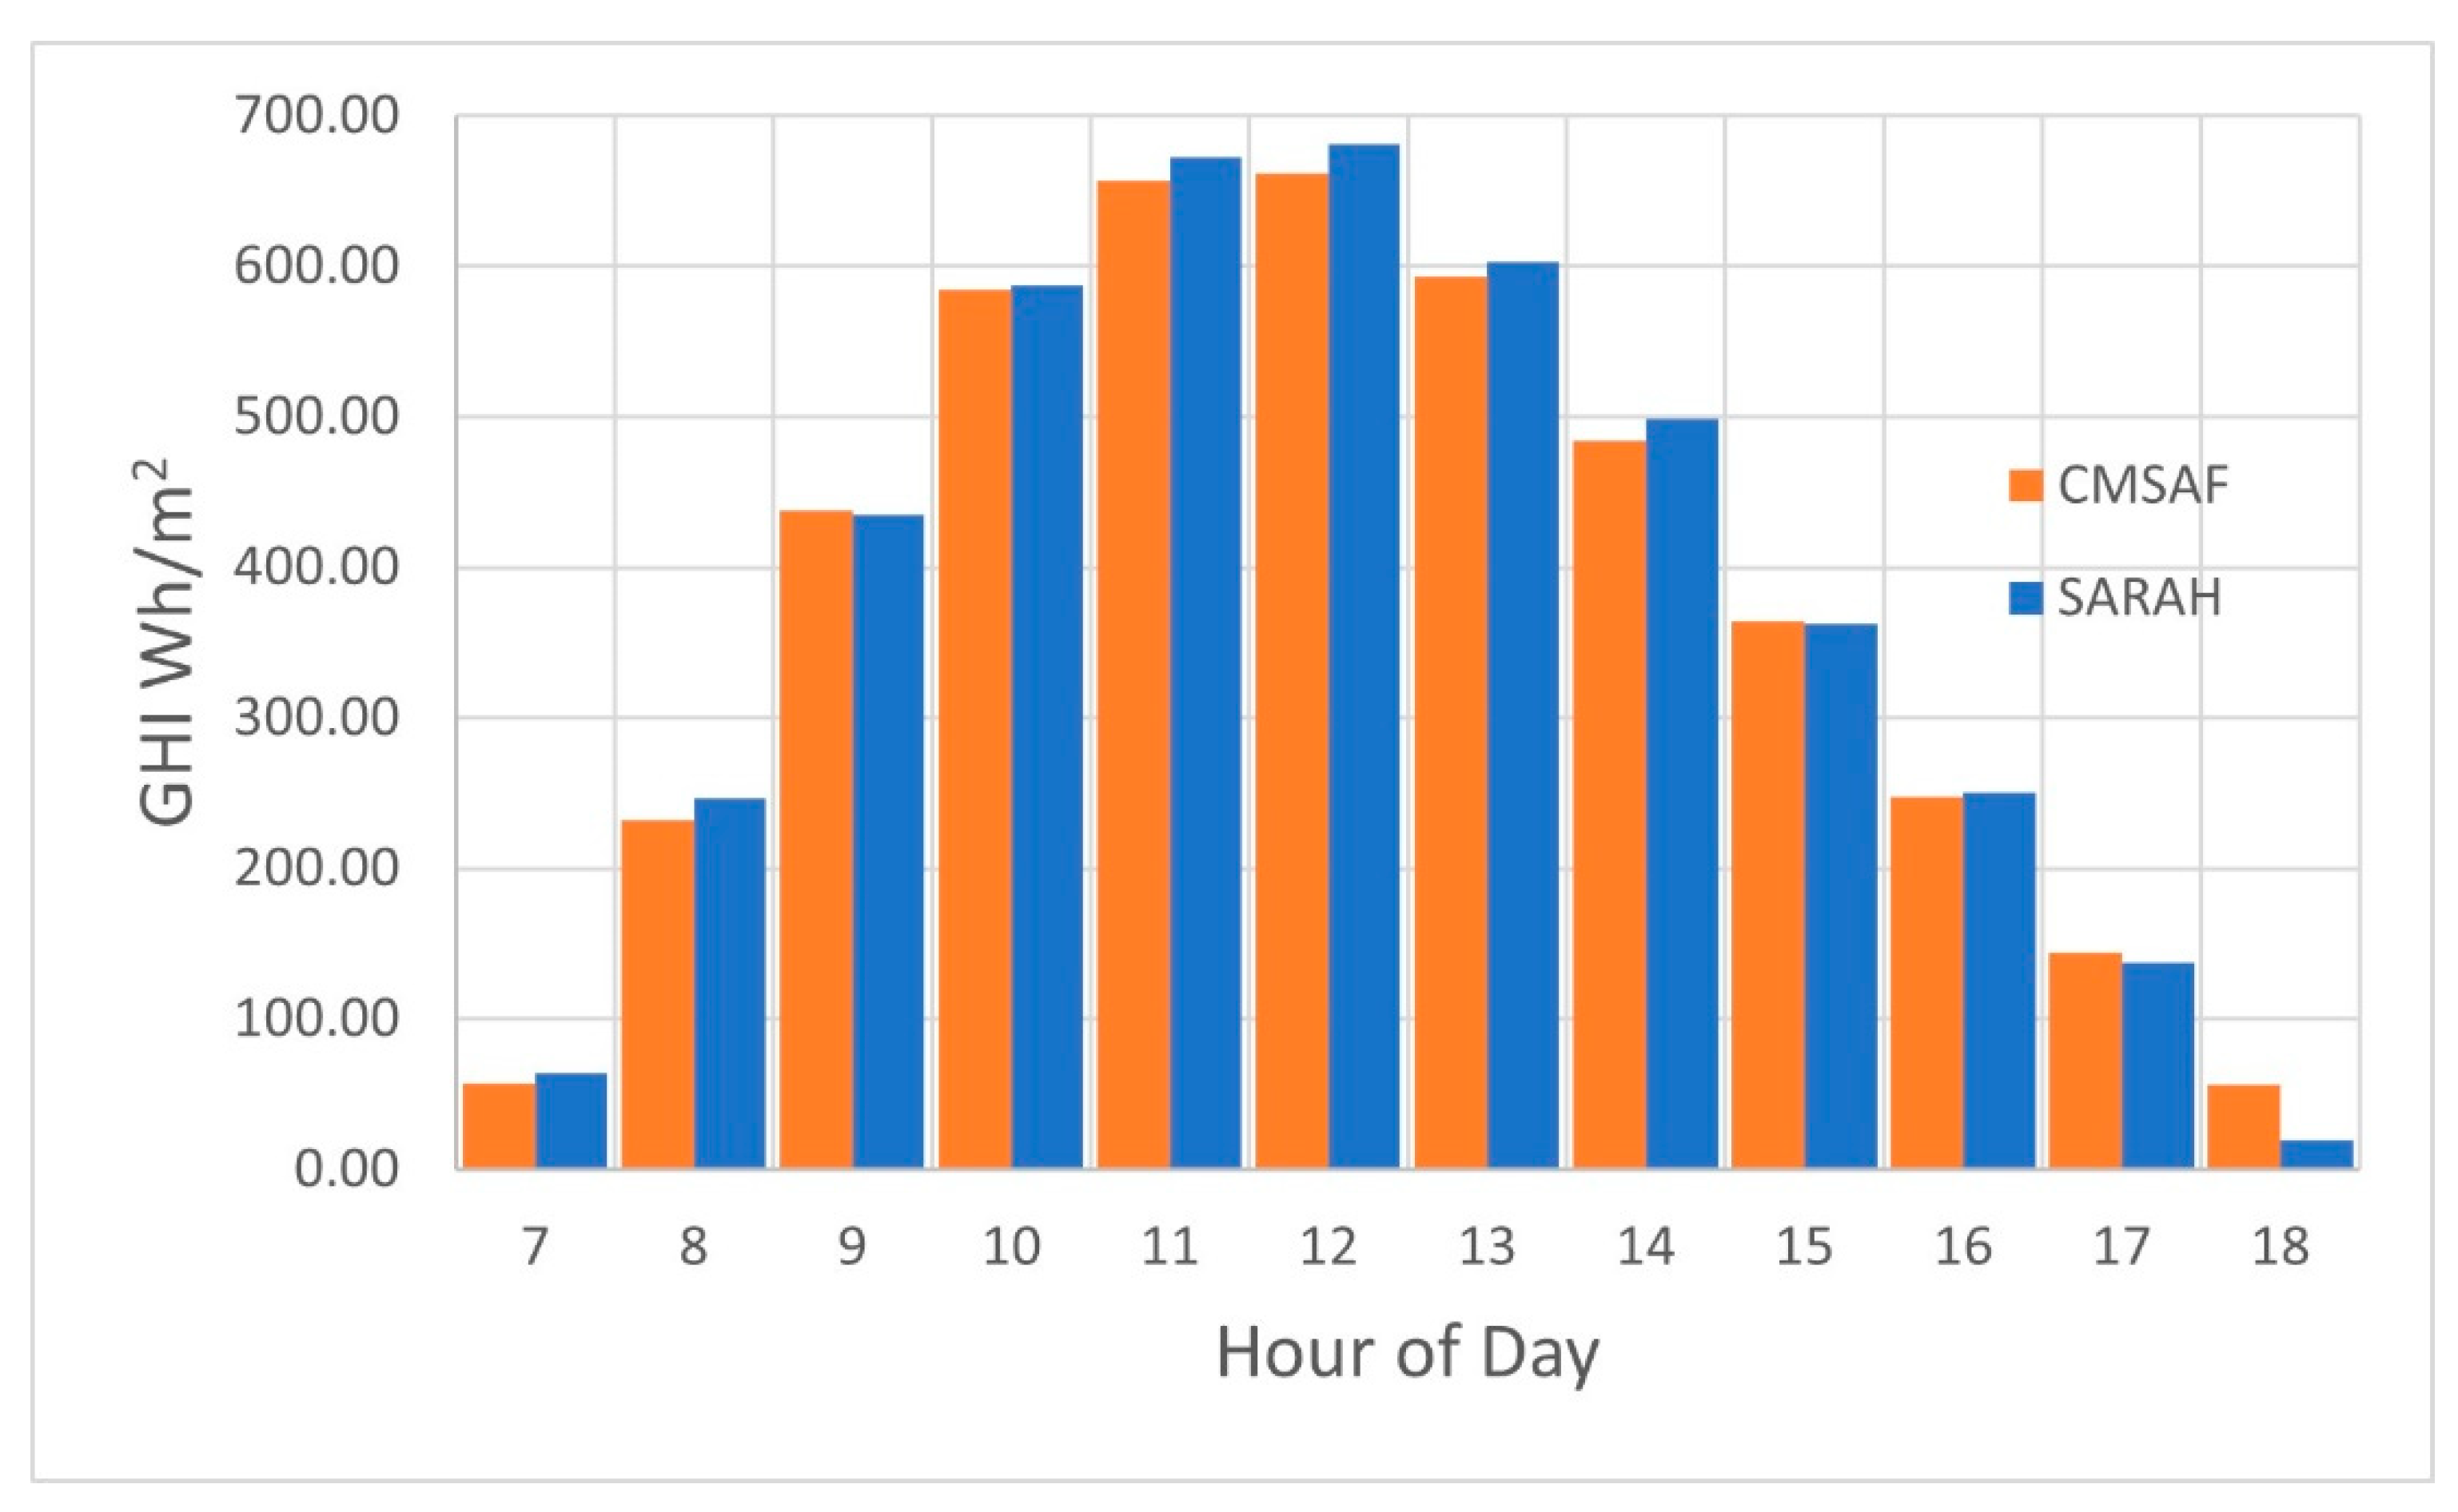
| 60 min | Hourly average | SARAH | Solcast | CAMS | CMSAF | Solcast | CMSAF | CAMS | SARAH | ||||||||
| 60 min | Hourly Std Dev | SARAH | CAMS | Solcast | CMSAF | Solcast | CAMS | CMSAF | SARAH | ||||||||
| 60 min | Trend closest to Logger | Solcast | CAMS | CMSAF | SARAH | CAMS | CMSAF | Solcast | SARAH | ||||||||
| 60 min | Pearson | CAMS | CMSAF | Solcast | SARAH | CAMS | Solcast | CMSAF | SARAH | ||||||||
| 60 min | Average GHI per hour of day | SARAH | CAMS | Solcast | CMSAF | Solcast | CAMS | CMSAF | SARAH | ||||||||
| Daily | nRMSE | Solcast | CAMS | CMSAF | SARAH | Solcast | CMSAF | CAMS | SARAH | CMSAF | SARAH | CAMS | Solcast | CAMS | Solcast | ||
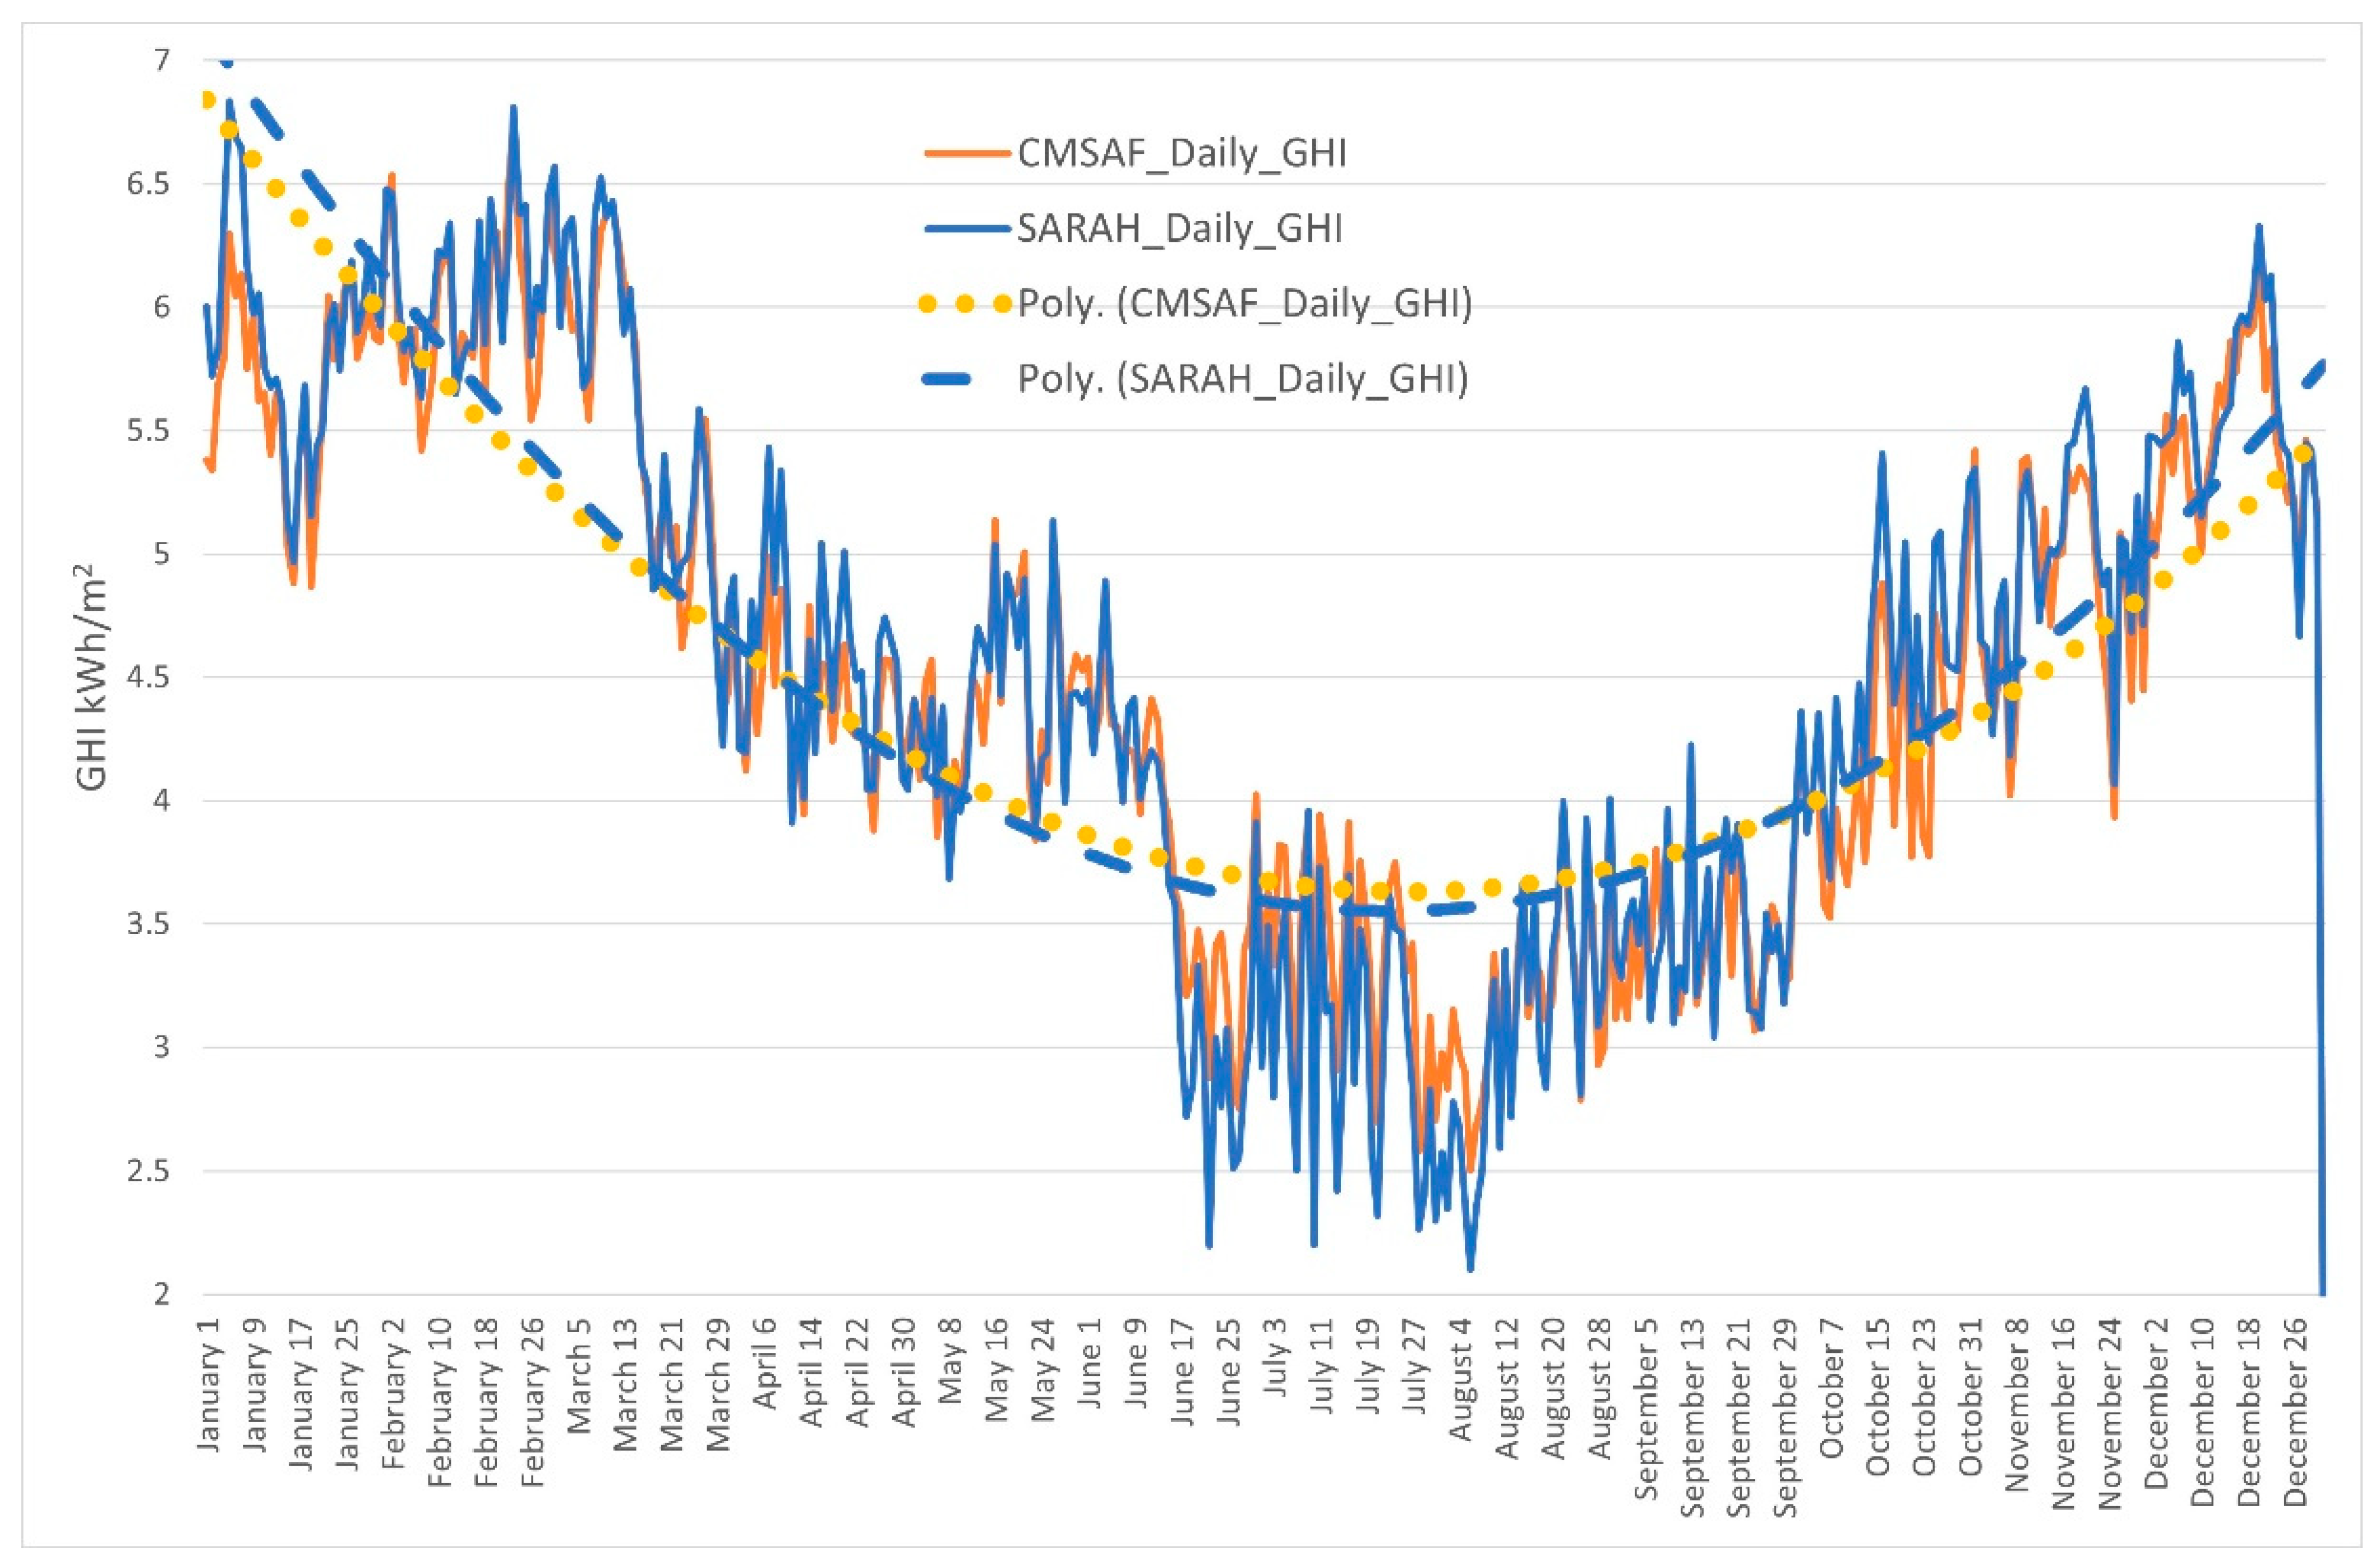
| Daily | Daily average | SARAH | Solcast | CAMS | CMSAF | Solcast | CMSAF | CAMS | SARAH | ||||||||
| Daily | Average GHI per Day of Year | Solcast | CAMS | CMSAF | SARAH | ||||||||||||
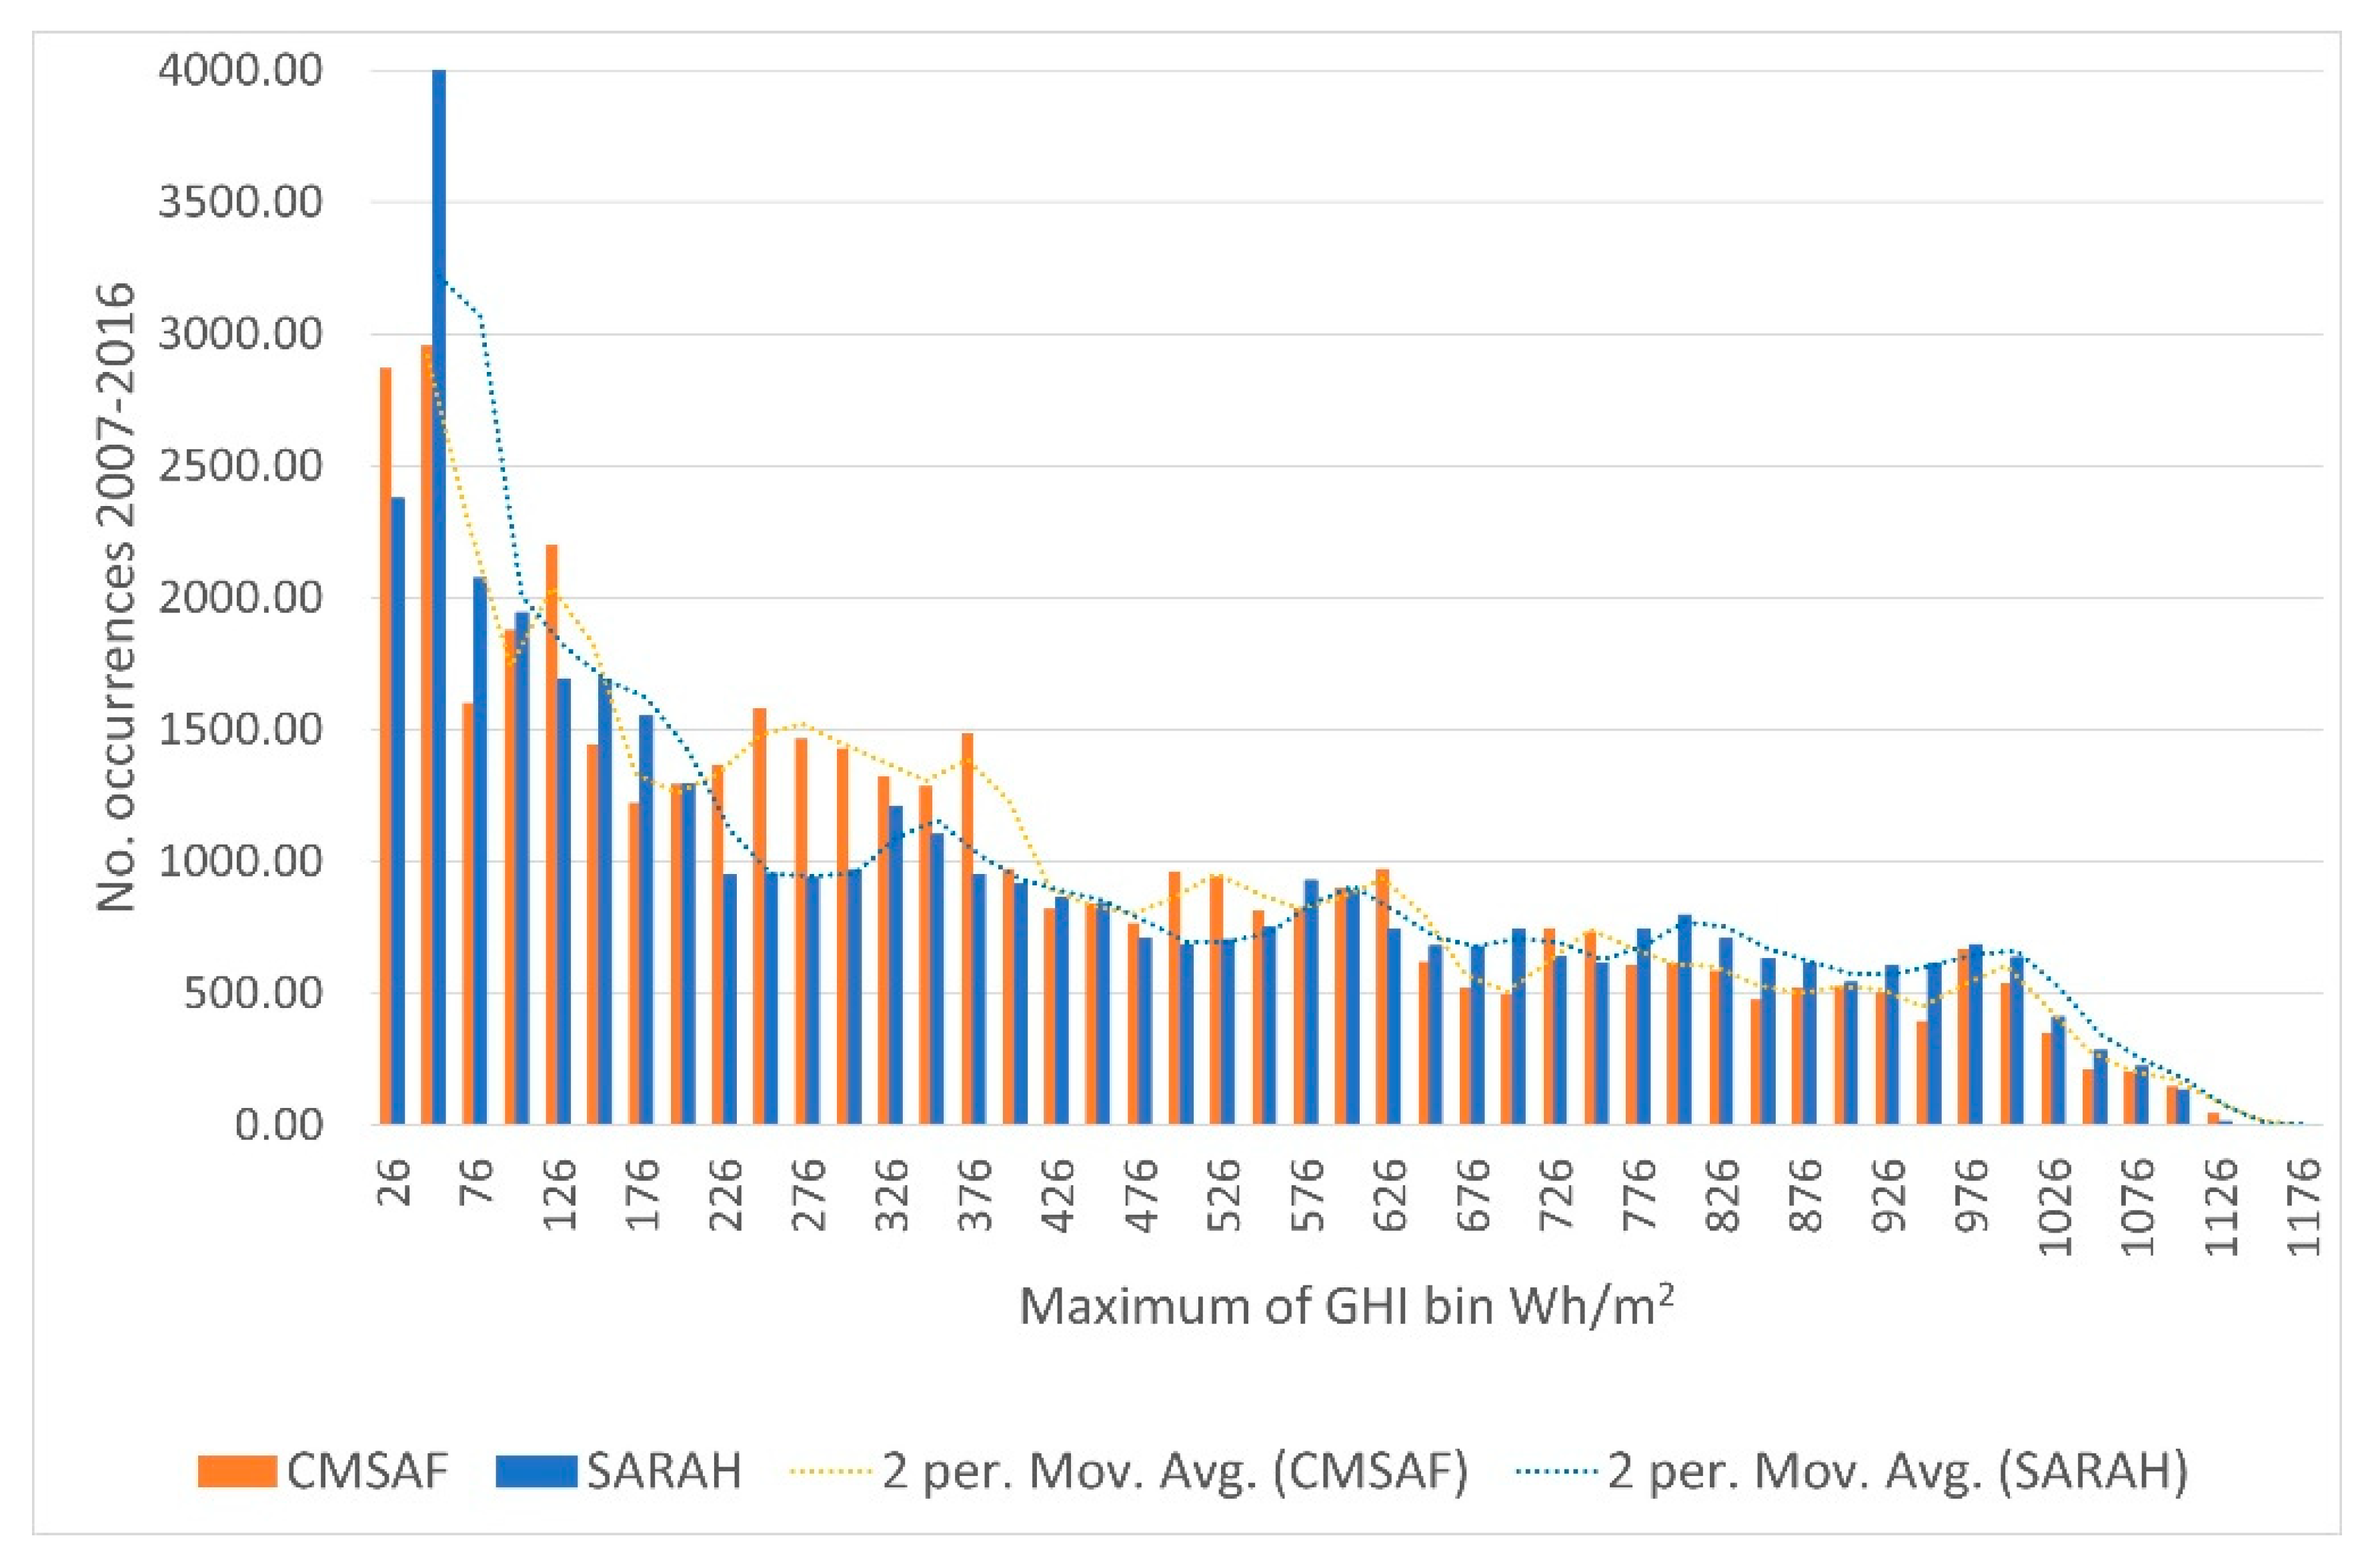
| Frequency Distribution | SARAH | Solcast | CMSAF | CAMS | |||||||||||||
| Lemolo | Echareria | Both | |||||||||
|---|---|---|---|---|---|---|---|---|---|---|---|
| Rank | 1 | 2 | 3 | 4 | Mean | 1 | 2 | 3 | 4 | Mean | Mean |
| CAMS | 4 × 1 | 3 × 2 | 1 × 3 | 0 | 3.25 | 4 × 1 | 2 × 2 | 1 × 3 | 0 | 2.75 | 3 |
| CMSAF | 1 × 1 | 3 × 2 | 2 × 3 | 3 × 4 | 6.25 | 0 | 2 × 2 | 5 × 3 | 0 | 4.75 | 5.5 |
| Solcast | 1 × 1 | 2 × 2 | 5 × 3 | 0 | 5 | 3 × 1 | 3 × 2 | 1 × 3 | 0 | 3 | 4 |
| SARAH | 2 × 1 | 0 | 0 | 5 × 4 | 5.5 | 0 | 0 | 0 | 7 × 4 | 7 | 6.25 |
References
- Meyer, R. Industry Insight: On-Site Measurements for PV Projects—Is It Really Necessary? ESI Afr. 2015, 42, 1. Available online: https://www.esi-africa.com/industry-sectors/renewable-energy/industry-insight-on-site-solar-measurements-for-solar-pv-projects-is-it-really-necessary/ (accessed on 12 January 2021).
- Solargis. How to Choose the Right Dataset for Evaluation of Solar Projects—The MASTER Approach. 2020. Available online: https://solargis.com/ebook-how-to-choose-solar-resource-data (accessed on 12 January 2021).
- Yang, D.; Bright, J.M. Worldwide validation of 8 satellite-derived and reanalysis solar radiation products: A preliminary evaluation and overall metrics for hourly data over 27 years. Sol. Energy 2020, 210, 3–19. [Google Scholar] [CrossRef]
- Bilbao, J.; Roman, R.; Miguel, A. Turbidity Coefficients from normal direct solar irradiance in Central Spain. Atmos. Res. 2014, 143, 73–84. Available online: https://www.sciencedirect.com/science/article/pii/S0169809514000854?via%3Dihub (accessed on 13 October 2021). [CrossRef]
- Gandoman, F.H.; Abdel Aleem, S.H.E.; Omar, N.; Ahmadi, A.; Alenezi, Q. Short-term solar power forecasting considering cloud coverage and ambient temperature variation effects. Renew. Energy 2018, 123, 793–805. [Google Scholar] [CrossRef]
- Amillo, A.M.G.; Ntsangwane, L.; Huld, T.; Trentmann, J. Comparison of satellite-retrieved high-resolution solar radiation datasets for South Africa. J. Energy S. Afr. 2018, 29, 63–76. [Google Scholar] [CrossRef]
- Solemi. Available online: https://wdc.dlr.de/data_products/SERVICES/SOLARENERGY/description.php (accessed on 12 January 2021).
- Meteonorm. Available online: Meteonorm.com (accessed on 12 January 2021).
- Reuniwatt. Available online: https://reuniwatt.com/en/ (accessed on 12 January 2021).
- Soda. Available online: http://www.soda-pro.com/web-services/radiation/helioclim-3-archives-for-pay (accessed on 12 January 2021).
- SolarAnywhere. Available online: https://www.solaranywhere.com/ (accessed on 12 January 2021).
- Solargis. Available online: Solargis.com (accessed on 12 January 2021).
- 3E. Available online: https://www.3e.eu/data-services/solar-resource-data/ (accessed on 12 January 2021).
- 3 Tier. Available online: https://www.3tier.com/en/support/solar-online-tools/ (accessed on 12 January 2021).
- Efstathiou, M.; Varotsos, C.A. On the 11 year solar cycle signature in global total ozone dynamics. Meteorol. Appl. 2013, 20, 72–79. [Google Scholar] [CrossRef]
- Cracknell, A.P.; Varotsos, C.A. New aspects of global climate-dynamics research and remote sensing. Int. J. Remote Sens. 2011, 32, 579–600. [Google Scholar] [CrossRef]
- PVGIS. Available online: https://re.jrc.ec.europa.eu/pvg_tools/en/tools.html (accessed on 12 January 2021).
- Urraca, R.; Gracia-amillo, A.M.; Koubli, E.; Huld, T.; Trentmann, J.; Riihelä, A.; Lindfors, A.V.; Palmer, D.; Gottschalg, R.; Antonanzas-torres, F. Remote Sensing of Environment Extensive validation of CM SAF surface radiation products over Europe. Remote Sens. Environ. 2017, 199, 171–186. [Google Scholar] [CrossRef] [PubMed] [Green Version]
- SPECMAGIC. Available online: http://gnu-magic.sourceforge.net/ (accessed on 12 January 2021).
- Qu, Z.; Oumbe, A.; Blanc, P.; Espinar, B.; Gesell, G.; Gschwind, B.; Klüser, L.; Lefèvre, M.; Saboret, L.; Schroedter-Homscheidt, M.; et al. Fast radiative transfer parameterisation for assessing the surface solar irradiance: The Heliosat-4 method. Meteorol. Z. 2017, 26, 33–57. [Google Scholar] [CrossRef]
- CAMS (Copernicus Atmosphere Monitoring Service). Available online: http://www.soda-pro.com/web-services/radiation/cams-radiation-service (accessed on 12 January 2021).
- Schroedter-Homscheidt, M.; Hoyer-Klick, C.; Killius, N.; Lefevre, M.; Wald, L.; Wey, E.; Saboret, L. User’s Guide to the CAMS Radiation Service-Status December 2017. Available online: https://www.researchgate.net/publication/324542911_User%27s_Guide_to_the_CAMS_Radiation_Service_-_Status_December_2017 (accessed on 10 December 2020).
- Solcast. Available online: https://solcast.com/ (accessed on 12 January 2021).
- Bright, J. Solcast: Validation of a satellite-derived solar irradiance dataset. Sol. Energy 2019, 189, 435–449. [Google Scholar] [CrossRef]
- MEERA-2. Available online: https://gmao.gsfc.nasa.gov/reanalysis/MERRA-2/ (accessed on 12 January 2021).
- UK Engineering and Physical Sciences (EP/L002612/1) Research Project: Solar Nano Grids (SoNG). Available online: http://songproject.co.uk/ (accessed on 12 January 2021).
- Gro for GooD: Groundwater Risk Management for Growth and Development. Available online: https://upgro.org/consortium/gro-for-good/ (accessed on 12 January 2021).
- Is There a Way of Calibrating and Validating Sediment Yield Model without Observed Sediment Data. Available online: https://www.researchgate.net/post/Is_there_a_way_of_calibrating_and_validating_sediment_yield_model_without_observed_sediment_data (accessed on 26 May 2021).
- Palmer, D.; Koubli, E.; Cole, I.; Betts, T.; Gottschalg, R. Satellite or ground-based measurements for production of site specific hourly irradiance data: Which is most accurate and where? Sol. Energy 2018, 165, 240–255. [Google Scholar] [CrossRef] [Green Version]
- Bennett, N.D.; Croke, B.F.W.; Guariso, G.; Guillaume, J.H.A.; Hamilton, S.H.; Jakeman, A.J.; Marsilli-Libelli, S.; Newham, L.T.H.; Norton, J.P.; Perrin, C.; et al. Characterising performance of environmental models. Environ. Model. Softw. 2012, 40, 1–20. Available online: https://www.researchgate.net/publication/285693132_Characterising_performance_of_environmental_models (accessed on 12 January 2021). [CrossRef]
- Laerd Statistics. Available online: https://statistics.laerd.com/statistical-guides/pearson-correlation-coefficient-statistical-guide.php (accessed on 12 January 2021).
- Varotsos, C.A.; Efstathiou, M.; Cracknell, A.P. Plausible reasons for the inconsistencies between the modeled and observed temperatures in the tropical troposphere. Geophys. Res. Lett. 2013, 40, 4906–4910. [Google Scholar] [CrossRef]
- Polo, J.; Antonanzas-Torres, F.; Vindel, J.M.; Ramirez, L. Sensitivity of satellite-based methods for deriving solar radiation to different choice of aerosol input and models. Renew. Energy 2014, 68, 785–792. Available online: https://ideas.repec.org/a/eee/renene/v68y2014icp785-792.html (accessed on 12 January 2021). [CrossRef]
- Sun, X.; Bright, J.; Gueymard, C.A.; Acord, B.; Wang, P.; Engerer, N. Worldwide performance assessment of 75 global clear-sky irradiance models using Principal Component Analysis. Reviews 2019, 111, 550–570. Available online: https://www.sciencedirect.com/science/article/abs/pii/S1364032119302187 (accessed on 12 January 2021). [CrossRef]
- Journée, M.; Bertrand, C. Quality control of solar radiation data within the RMIB solar measurements network. Sol. Energy 2011, 85, 72–86. [Google Scholar] [CrossRef]
- Laitia, L.; Andreis, D.; Zottele, F.; Giovannini, L.; Panziera, L.; Toller, G.; Zardi, D. A solar atlas for the Trentino region in the Alps: Quality control of surface radiation data. Energy Procedia 2014, 59, 336–343. [Google Scholar] [CrossRef] [Green Version]


| Database | Satellite Model | Clear Sky Model | Cloud Properties Model | Temporal Resolution of Clear Sky Inputs | Spatial Resolution of Clear Sky Inputs |
|---|---|---|---|---|---|
| SARAH | Heliosat-2 | SPECMAGIC | - | Monthly | 125 km |
| CMSAF | Heliosat-2 | SPECMAGIC | - | 3-hourly | 125 km |
| CAMS | Heliosat-4 | McClear | McCloud | 3-hourly | 125 km |
| Solcast | Proprietary | REST2v5 | Proprietary | Hourly | 50 km |
| Statistical Measure | CMSAF | SARAH | % Difference |
|---|---|---|---|
| Average annual in-plane irradiation kWh/m2 | 1650.67 | 1664.12 | −0.81 |
| 10-year average hourly GHI Wh/m2 | 188.28 | 189.81 | −0.81 |
| Mean std dev of each hourly GHI value Wh/m2 | 73.98 | 82.10 | −9.90 |
| Time Interval (min) | Satellite Model | No. Values Lemolo | nRMSE % Lemolo |
|---|---|---|---|
| 1 | CAMS | 1143 | 76 |
| 1 | McClear | 1143 | 162 |
| 5 | CAMS | 72,611 | 166 |
| 5 | Solcast | 72,611 | 47 |
| 15 | CAMS | 45,487 | 125 |
| 15 | Solcast | 45,487 | 45 |
| HOURLY | No. Values Lemolo | nMBE % Lemolo | No. Values Echareria | nMBE % Echareria |
|---|---|---|---|---|
| PVGIS-SARAH 2016 | 3489 | 0.35 | 715 | 0.47 |
| Solcast 2016 | 3489 | 0.16 | 715 | 0.34 |
| PVGIS_CMSAF 2016 | 3489 | 0.18 | 715 | 0.39 |
| CAMS 2016 | 3489 | 0.16 | 715 | 0.31 |
| Time Interval (min) | GHI Satellite Database/Clearsky Model | No. Values Lemolo | nRMSE % Lemolo |
|---|---|---|---|
| 15 | Solcast | 4916 | 52 |
| 15 | CAMS | 4916 | 130 |
| 60 | CAMS | 1161 | 47 |
| 60 | Solcast | 1161 | 47 |
| 60 | PVGIS_CMSAF | 364 | 53 |
| 60 | McClear | 1161 | 60 |
| 60 | PVGIS-SARAH | 364 | 295 |
| Database | Lemolo PMCC | Echareria PMCC |
|---|---|---|
| SARAH | 0.875 | 0.877 |
| CMSAF | 0.978 | 0.905 |
| CAMS | 0.978 | 0.946 |
| Solcast | 0.971 | 0.907 |
| Location and No. Hours | GHI Wh/m2 | Logger | SARAH | CMSAF | CAMS | Solcast |
|---|---|---|---|---|---|---|
| Lemolo 3489 h | Sum | 842,684 | 835,475 | 910,815 | 888,160 | 881,534 |
| Hourly average | 242 | 240 | 261 | 255 | 253 | |
| % difference sum/avg to Logger | −1 | 8 | 5 | 5 | ||
| Hourly Std dev | 322 | 337 | 358 | 345 | 347 | |
| % difference std dev to Logger | 5 | 11 | 7 | 8 | ||
| % of hours under-estimating | 70 | 63 | 69 | 68 | ||
| Echareria 715 h | Sum | 157,929 | 189,617 | 172,963 | 179,699 | 167,135 |
| Hourly avg | 221 | 266 | 242 | 252 | 234 | |
| % difference sum/avg to Logger | 20 | 10 | 14 | 6 | ||
| Hourly Std dev | 314 | 360 | 354 | 350 | 335 | |
| % difference std dev to Logger | 15 | 13 | 11 | 7 | ||
| % of hours under-estimating | 65 | 67 | 67 | 64 |
| % Avg Daily Difference to Logger | No. Days | SARAHGHI | CMSAFGHI | CAMSGHI | SolcastGHI |
|---|---|---|---|---|---|
| Lemolo | 152 | 0 | 8 | 6 | 4 |
| Echareria | 22 | 22 | 12 | 16 | 4 |
Publisher’s Note: MDPI stays neutral with regard to jurisdictional claims in published maps and institutional affiliations. |
© 2021 by the authors. Licensee MDPI, Basel, Switzerland. This article is an open access article distributed under the terms and conditions of the Creative Commons Attribution (CC BY) license (https://creativecommons.org/licenses/by/4.0/).
Share and Cite
Palmer, D.; Blanchard, R. Evaluation of High-Resolution Satellite-Derived Solar Radiation Data for PV Performance Simulation in East Africa. Sustainability 2021, 13, 11852. https://doi.org/10.3390/su132111852
Palmer D, Blanchard R. Evaluation of High-Resolution Satellite-Derived Solar Radiation Data for PV Performance Simulation in East Africa. Sustainability. 2021; 13(21):11852. https://doi.org/10.3390/su132111852
Chicago/Turabian StylePalmer, Diane, and Richard Blanchard. 2021. "Evaluation of High-Resolution Satellite-Derived Solar Radiation Data for PV Performance Simulation in East Africa" Sustainability 13, no. 21: 11852. https://doi.org/10.3390/su132111852
APA StylePalmer, D., & Blanchard, R. (2021). Evaluation of High-Resolution Satellite-Derived Solar Radiation Data for PV Performance Simulation in East Africa. Sustainability, 13(21), 11852. https://doi.org/10.3390/su132111852