Abstract
This paper presents a comparative analysis of the spatial transformation in the Hungarian and Slovenian pig sectors at the level of local administrative units (LAU). Concentration and inequality measures were applied in the empirical analyses, along with Markov transition probability matrices, to examine the stability and/or mobility over time and the presence of clustering effects. Both countries experienced a rapid decline in pig population. This profound structural change has led to a smaller number of more concentrated pig farms and increased territorial concentration. The degree of farm and territorial concentration and inequality in Hungary has been much higher than in Slovenia, and the concentration gap between the countries has increased. Between 2000 and 2010, the degree of concentration was much higher in Hungary than in Slovenia; average herd size per holding increased by 68 percent in Hungary, and only seven percent in Slovenia. In Hungary, clustering effects were particularly significant, with the pig sector moving towards large-scale concentration. The former effect was also confirmed in the Slovenian pig sector, but significantly weakened during the period under investigation. The exploitation and policy management of spatial externalities justifies these agricultural, economic, and agri-environmental practices.
1. Introduction
The spatial concentration of economic activities and clustering effects has received substantial attention for more than a decade, and there is a wealth of research in various strands of the economic and regional literature. However, studies of the agricultural sectors are still limited. The pork sector is one of the best examples of industrialized agriculture, with strong input–output linkages to the manufacturing sector. The farm structure of the pork industry is strongly affected by economies of scale [1,2], but can differ between countries and regions. An increase in the concentration in global hog production has been accompanied by a spatial concentration of pork production [3,4], which has been explained using agglomeration economies [5].
European pig production was also characterized by structural concentration in the 2000s, accompanied by a rapid increase in technological performance, specialization, and the modernization of farm economies of scale [6]. Thus, intensification of production created economic benefits for the sector, but also increased social tension, particularly in the area of environmental sustainability and environmental protection [6,7].
Therefore, pig population clustering and concentration might also be linked to environmental problems, particularly swine sewage management. Previous literature has highlighted such problems of the environmental management of swine sewage using different methodological approaches, providing case studies for Italy [8,9], Cyprus [10], and China [11].
Undertaking an assessment of the benefits and drawbacks of the intensification and concentration in the pig sector is even more complex in Central and Eastern European (CEE) countries. The authors [12] provide a general overview of pig farming in European Union (EU-28) countries between 2007 and 2013. Based on official Farm Structure Survey statistics, the authors highlight a deep structural gap between the so-called “old” (EU-15) and “new” member states (NMSs); the latter being mostly the CEE-11 countries that accessed the EU in 2004 (Estonia, Czech Republic, Hungary, Latvia, Lithuania, Poland, Slovakia, and Slovenia), 2007 (Bulgaria and Romania), and 2013 (Croatia) (“NMS-13”; i.e., CEE-11 plus Cyprus and Malta from EU enlargement in 2004). The most important difference was that small pig producers (farms with less than ten sows) were mostly found in NMS-13 countries. The large proportion of small farms, which are less productive and less efficient, reduces average herd size in the NMS-13 group.
On the other hand, the transition in farm structure has not been so uniform among the NMSs. From an analysis of the changes in the distribution of sows by farm-size category, the authors [12] (p. 8–9) classified EU Member States’ pig sectors into three types according to the following characteristics:
- (i).
- Concentration: In several EU Member States, “large farms account for more and more sows, to the detriment of the smallest farms. The surviving farmers are only those that have understood the need of having sustainable production based on investments in technology, genetics, nutrition, and integration”.
- (ii).
- Abandonment: “The decrease affects pig farms of all sizes, including large farms”.
- (iii).
- Restructuring: “The number of sows from small herds fell sharply, and the number in the medium and large herds rose correspondingly. This can be interpreted as a re-organization of production”.
The spatial dimension of the concentration and structural changes described above has been only very weakly processed in the literature. Previous studies have concentrated primarily on North American and Western European countries, whilst research on the situation in CEE countries is almost non-existent, except for work by [13,14].
The aim of the research presented in this paper is to provide a comparative analysis of the spatial transformations in the Hungarian and Slovenian pig sectors. In contrast to the situation in the USA and Western European countries, in both countries the pig sector is declining, with fairly stable domestic demand in pork consumption, within competitive European/global pig/pork markets. Pig farm size structures and pork market structures in the studied countries are different. Hungary, with its prevailingly large-scale pig farms, is a net exporter of pigs/pork, while Slovenia, with typically small- and medium-sized pig farms, is a net importer. In both countries, pork is the meat most often consumed. However, per capita pork consumption in Slovenia is higher than in Hungary.
This study contributes to territorial farm concentration and regional clustering studies, with a broader relevance for the studied countries in the CEE pork sector that have a significant culture of cuisine and gastronomy in terms of the consumption of pork meat. First, the study compares two different pig farming, industrial organization, and marketing structures. Second, the study applies different methodological approaches to analyze the spatial concentration and spatial mobility of pig populations and their spatial agglomeration at the local administrative unit level. Previous papers in the field of regional studies have identified industry clusters using different methods [15], and spatial econometric approaches have been used in agglomeration studies [14,16]. Our study adds to the concentration and clustering studies of the pig sector [14] through a cross-country comparison, in which three additional methodological approaches were used, which had previously been employed in regional studies. These are (i) the Gini coefficient decomposition and Lorenz curves for the spatial concentration of pig population, (ii) the Markov transition probability matrices and mobility indices for determining the spatial mobility of the pig population, and (iii) local indicators of spatial association (LISA)/local Moran’s I cluster maps for each variable, which were applied to understand the regional clustering of the pig population. Finally, the study presents the implications regarding the complex story of the restructuring of the pig sector, in terms of competitiveness, sector survival, and profitability, the latter of which is also an issue for future research.
The structure of the paper is as follows: the following section provides an overview of the Hungarian and Slovenian pig sector and pork market structure. The third section presents material and methods. Next, we present country-level results, compare them, and discuss. The final section concludes.
2. Materials and Methods
This section presents the background to the studied countries pork sector and market, the data used, and methods applied.
2.1. Structural Changes in the Hungarian and Slovenian Pork Sector and Pork Market Structure
The two neighboring countries investigated in this study are representants of the CEE region (see Figure 1), and their pig market processes are therefore also characterized by the general transition trends in the region.
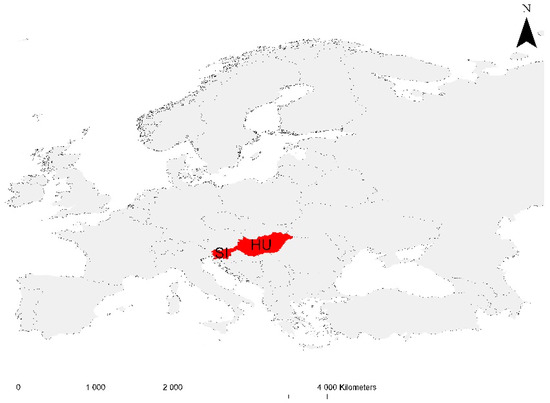
Figure 1.
Geolocation of Hungary (HU) and Slovenia (SI) within Europe. Source: authors’ construction, shape downloaded from [17].
Adapting to EU single-market regulation has been a major challenge for the Hungarian and Slovenian pork sectors. One of the key challenges was to enter the single EU pig market without protective tariffs and export subsidies. After EU accession, live pig imports increased considerably in both Hungary and Slovenia. Furthermore, complying with animal welfare and nitrogen emission regulations created serious administrative burdens for both countries. Note that these regulations were originally established for the old EU Member States, where the pork sector is more concentrated and has a more competitive farm structure (such as in, for example, Denmark, the Netherlands, and Flanders in Belgium). In contrast, in Hungary and Slovenia the pork sector has been dominated by small-scale farms, which in many cases struggled with structural anomalies until the change of the regime; thus a significant proportion of farms did not have the capital to invest in achieving compliance with the new rules.
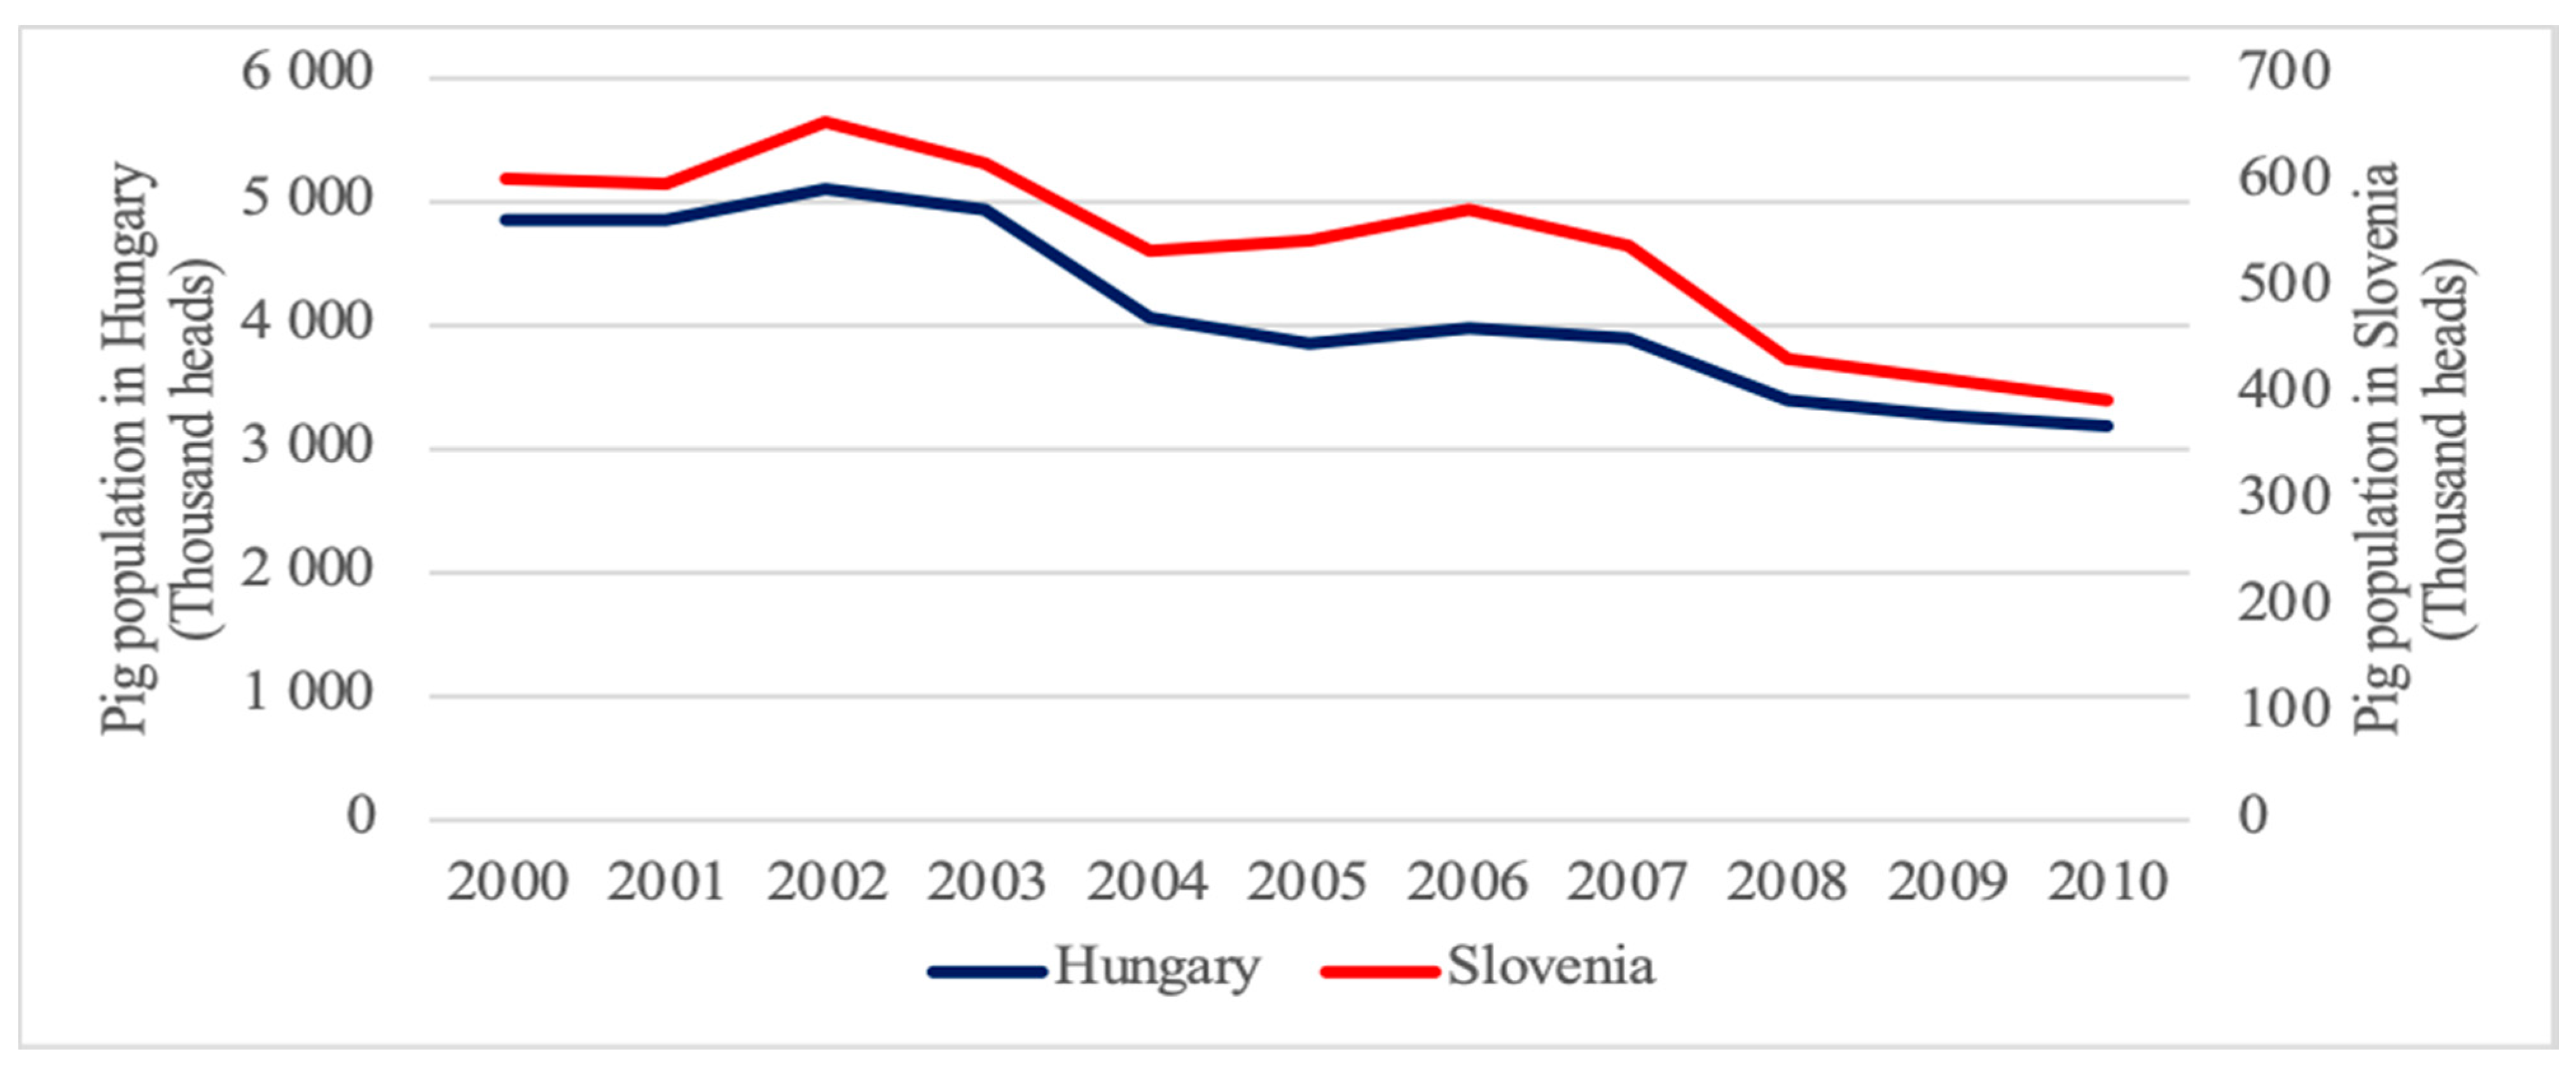
The Hungarian and the Slovenian pig sector developed very similarly during the first decade of the twenty-first century. The farm pig population in the two countries decreased at exactly the same rate (by 34.5%) between 2000 and 2010. Figure 2 shows that the dynamics of the fall in pig numbers followed a similar pattern. During the same period, the number of Hungarian and Slovenian pig holdings decreased by 62% and 40%, respectively [18,19]. To sum up, pig farming has undergone a profound structural change, leading to less, but more concentrated, pig production in both countries. However, the degree of concentration has been much higher in Hungary than in Slovenia; average herd size per holding increased by 68 percent in Hungary, but only 7 percent in Slovenia.
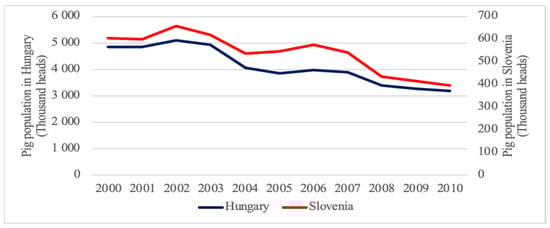
Figure 2.
Decrease in Hungarian and Slovenian pig population to the same extent, 2000–2010. Source: authors’ construction, based on data from [20,21,22].
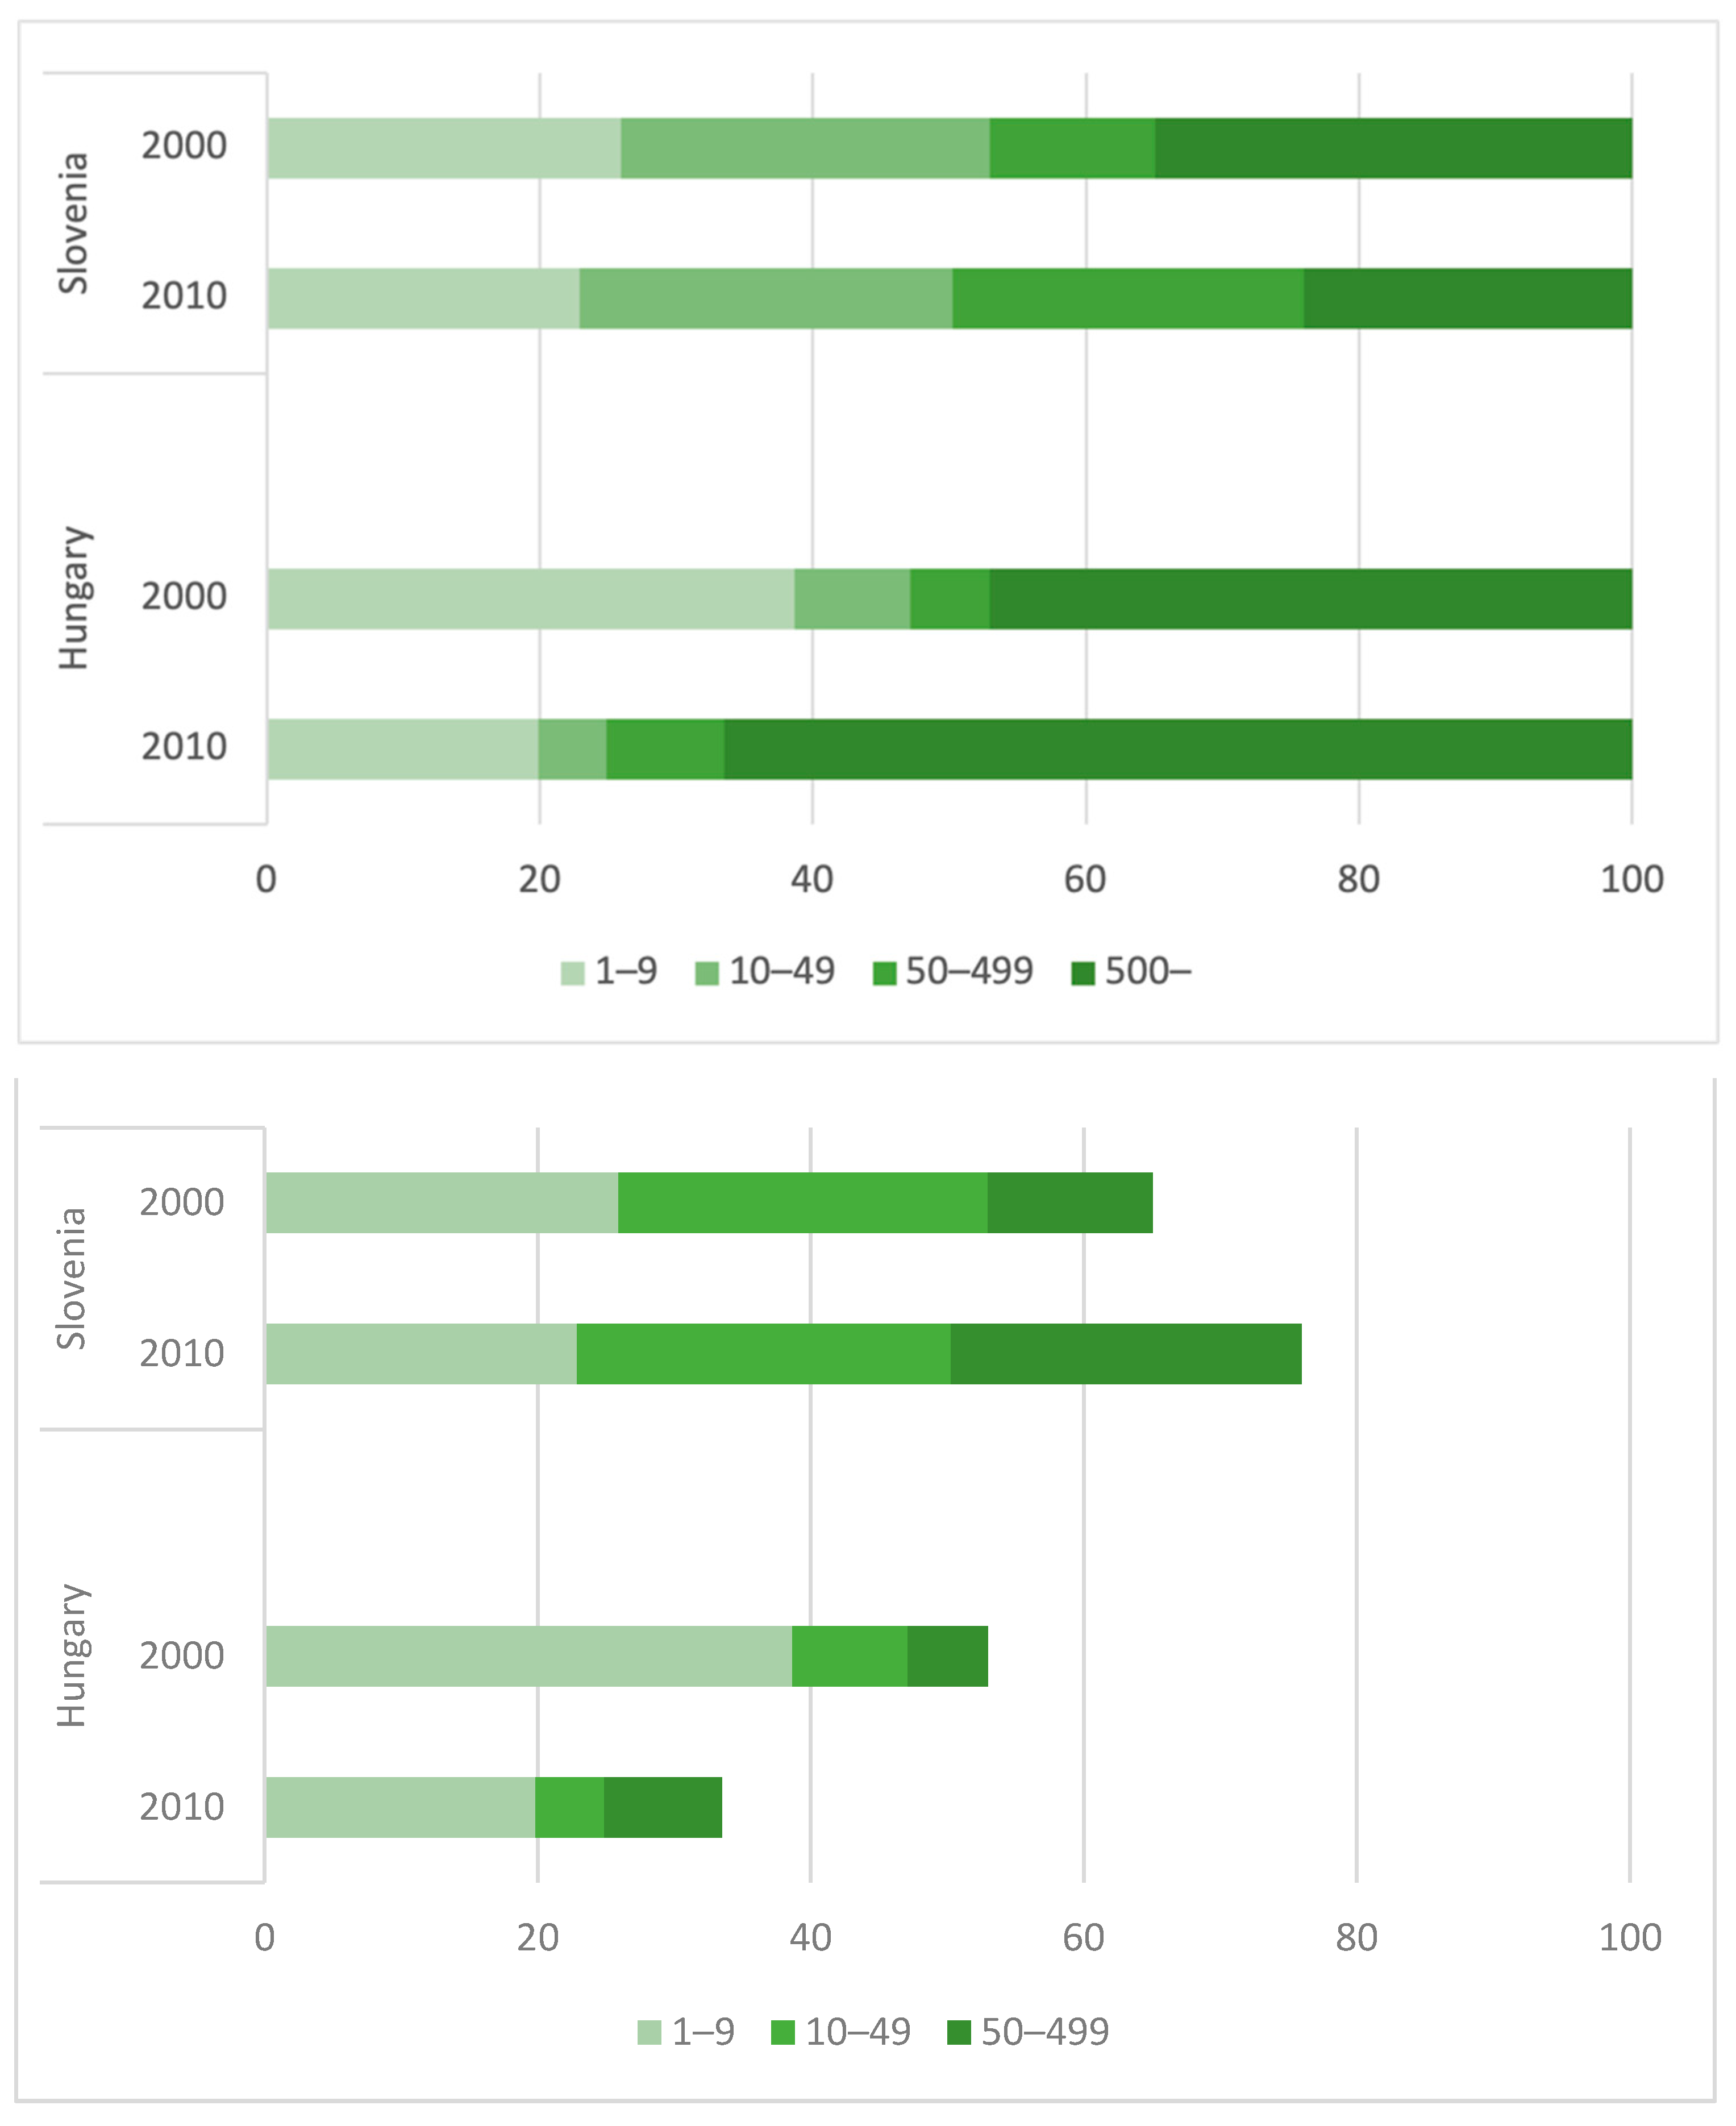
The difference in the pig sector structures between Hungary and Slovenia are clearly illustrated in Figure 3, which shows the distribution of the pig population by farm size (in livestock units, LSUs). While, in Slovenia, small- and medium-sized pig farms prevail and their share has increased in relation to the relative pig population vis-à-vis large farms, the situation is the reverse in Hungary, where large pig farms have come to dominate and have increased in relative importance in the pig population farming structure.
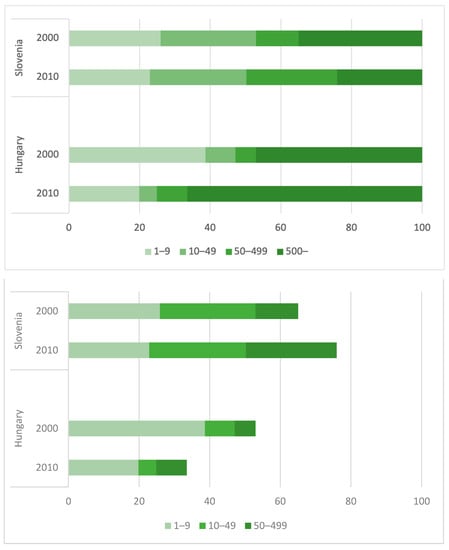
Figure 3.
Distribution of pig population by farm size in Hungary and Slovenia (in percentage). Source: authors’ construction, based on data from [18,19,21,22].
In the early 2000s, Hungary had a unique dual-structured pig sector, with a high share of small- and large-scale farms and a very small share of mid-size pig holdings. Between 2000 and 2010, the pig population decreased in each farm size category. However, this change was notably different according to farm size: the share of large farms clearly expanded, to the detriment of small-scale farms. In the meantime, the proportion of mid-size farms remained very small, deepening further the extremely dualistic structure of the Hungarian pig farm structure. Using the typology of [12], the transition of the Hungarian pig sector can be identified as a mixed abandonment–concentration process.
In 2000, pig herd distribution by farm size was much more equal in Slovenia than in Hungary and had become even more equal by 2010. The share of the second-largest farm size class (between 50 and 499 pigs per farm) doubled, while the pig population radically declined in all other size categories. Accordingly, the Slovenian pig sector transition can be called a restructuring process.
The different pork market structures of Hungary and Slovenia are presented in Figure 4, with a focus on the demand side; although pork consumption is important in both countries. Per-capita pork consumption is higher in Slovenia and has increased, and vice versa in Hungary. This may potentially be explained by substitution effects in meat consumption, particularly the substitution of pork with poultry. One significant difference between the studied countries is the overall market balance structure, with Hungary a net exporter and Slovenia a net importer of pork. The degree of self-sufficiency declined in both countries, but more in Slovenia than in Hungary; although in the latter it also declined by around 20 percentage points. This finding suggests that the international competitiveness of the pork markets in both countries has deteriorated. In the Slovenian case, imports were substituted for domestic production, thus leading to a relatively low degree of self-sufficiency. Hungary remained a net exporter, but faced strong competition from other European/global competitors.
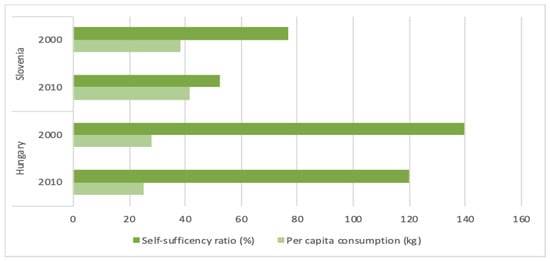
Figure 4.
Pork market structure in Hungary and Slovenia. Source: authors’ construction, based on data from [21,22].
The general objective of this research was to reveal the spatial dimension of these structural changes in the Hungarian and Slovenian pig farm structure, with a focus on their regional dimensions. More specifically, the paper focuses on two research questions. On the one hand, we investigated how the spatial concentration and spatial mobility of pig populations evolved in Hungary and Slovenia during the period of structural transition. On the other hand, the presence of spatial distribution effects was analyzed in both countries.
2.2. Data
The empirical analysis was based on data provided by the Hungarian and the Slovenian Central Statistical Offices. Pig population data (in heads) were collected from the General Agricultural Census in 2000 and 2010 at local administrative unit (LAU) level.
The selection of the observed spatial unit was complicated by the fact that the Hungarian and Slovenian settlement and administrative structures are different. In addition, the content of LAU-1 and LAU-2 levels, according the official EU nomenclature before 2017 also differed between the two countries. For example, the LAU-2 level covers single settlements in Hungary, each of which has its own local government body (municipality). In Slovenia, on the other hand, LAU-2 units are made up of several settlements running a joint municipality. Furthermore, there is an order of magnitude difference in the number of LAU-2 units (in 2010, 212 in Slovenia and 3154 in Hungary), which cannot be explained only by the difference in the areas (20,373 km2 vs. 93,030 km2) of the countries. Therefore, a uniform application of the LAU-2 level would lead to the problem of different territorial resolutions. Taking this into account, we decided to use the pre-2007 nomenclature; the LAU-2 for Slovenia and LAU-1 for Hungary, as observation unit. The Slovenian LAU-2 and the Hungarian LAU-1 can be considered to be the same unit in terms of administrative functionality and structure, as they both cover a seat town, functioning as a bureaucratic and statistical-administrative center, and several smaller settlements. The main characteristics of the observation units can be seen in Table 1.

Table 1.
Main characteristics of observation (spatial) units for Hungary and Slovenia (statistics refer to the year 2010).
Hereafter, the observation units will be referred to as “local administrative units” or “LAUs” for simplicity.
2.3. Gini Coefficient and Lorenz Curve
Gini coefficient and Lorenz-curves were used as a first step to analyze the spatial concentration of the pig populations. Then, the decomposition procedure proposed by [23] was applied to analyze the nature of change in spatial concentration. The authors suggest the following method for determining the change in a single Gini index (G (v)).
where
and
is the generalized Gini concentration index for year one, based on the ranking of year zero. The value of can be interpreted as a measure of the progressivity of pig population growth, while the value of can be interpreted as a mobility index, based on re-ranking. Equation (1), therefore, expresses that inequality is progressive with an increase in the pig population, assuming that it is not offset by simultaneous mobility. If the pig population grows, between starting and end periods, and the value of is greater than zero, this means that the pig population is more concentrated in the “poor” (smaller pig population) than the “rich” (larger pig population) units. This is called pro-poor growth. If is less than zero, then pig growth is more strongly concentrated in “rich” than in “poor” units. In our case, when the pig population does not grow but decreases, we can speak of growth in the “poor” population, when losses are less concentrated among the “poor” territorial units compared to the “rich” ones.
2.4. Markov Matrix and Transition Probability Matrix
For the analysis of spatial stability, similarly to research that specializes in foreign trade or territorial convergence [24,25], we used Markov matrices to determine the spatial mobility of pigs. Districts were classified into quartiles, according to the size of the pig population. With the help of Markov matrices, we examined the chance of a LAU remaining in the same quartile in 2010 as it was in 2000, and the likelihood of a deterioration or improvement in its position. Direct comparisons of mobility between the farm-size classes were made using different mobility indices.
The first index (M1) by [26] evaluates the trace (tr) of the transition probability matrix. This index, thus, directly captures the relative magnitude of diagonal and off-diagonal terms and can be shown to equal the inverse of the harmonic mean of the expected duration of remaining in a given cell.
where K is the number of cells, and P is the transition probability matrix.
The second index (M2, see [26,27]) focuses on the determinant (det) of transition probability matrices.
Higher values for both indices indicate greater mobility, while zero values indicate perfect immobility.
2.5. Global and Local Moran’s I Indices
Global and local Moran’s I indices were used to investigate spatial distribution in terms of spatial association patterns, such as global spatial association and local spatial association. Global Moran’s I index reveals the clusters or degree of dispersion of variables in terms of space; describing the overall spatial characteristics of pig production across observation (LAU) units [28]. Global Moran’s I index is defined as:
where n denotes the number of LAUs; and are the natural logarithms of pig population (heads) in LAUs i and j, respectively; and is an element of spatial weight matrix (more specifically, a row-standardized queen contiguity weights matrix) and refers to an adjacent relationship between LAUs i and j. The elements of the matrix are calculated using the following rules (before row-standardization):
where bnd(i) and bnd(j) denote the set of boundary points of units i and j, respectively.
Values of Moran’s I mostly range from −1 to +1, where negative values indicate negative a spatial autocorrelation (dispersion), while positive values represent positive autocorrelation (clustering). A zero represents a random spatial pattern [29].
In this paper, local Moran’s I (the most commonly used index of LISA indices) is calculated to measure partial spatial autocorrelation and quantify spatial dependence for each observation unit. Using local Moran’s I, we can identify spatial clusters with high and low pig production. For the ith unit, local Moran’s I is defined as [30]:
where
Positive local Moran’s I values identify LAUs with spatial clusters. Two types of spatial cluster can be distinguished:
- high–high clusters (high value in a high-value neighborhood),
- low–low clusters (low values in a low-value neighborhood).
Negative local Moran’s I values identify spatial outliers, including
- high–low outliers (high value in a low-value neighborhood),
- low–high outliers (low value in a high-value neighborhood).
In the research for this paper, the statistical significance of global and local Moran’s I was tested using permutation tests based on 9999 permutations [30]. H0 may be rejected if the pseudo p-value is equal to or less than 5%.
To help visualize partial spatial clusters, we drew LISA/local Moran’s I cluster maps for each variable, using GeoDa version 1.14.0.
3. Results
We first present and discuss results about spatial concentration and mobility, then clustering effects.
3.1. Spatial Concentration and Mobility
The Gini coefficients that measure spatial concentration and inequality and its decomposition can be seen in Table 2.
Table 2.
Decomposition of change in spatial concentration between 2000 and 2010.
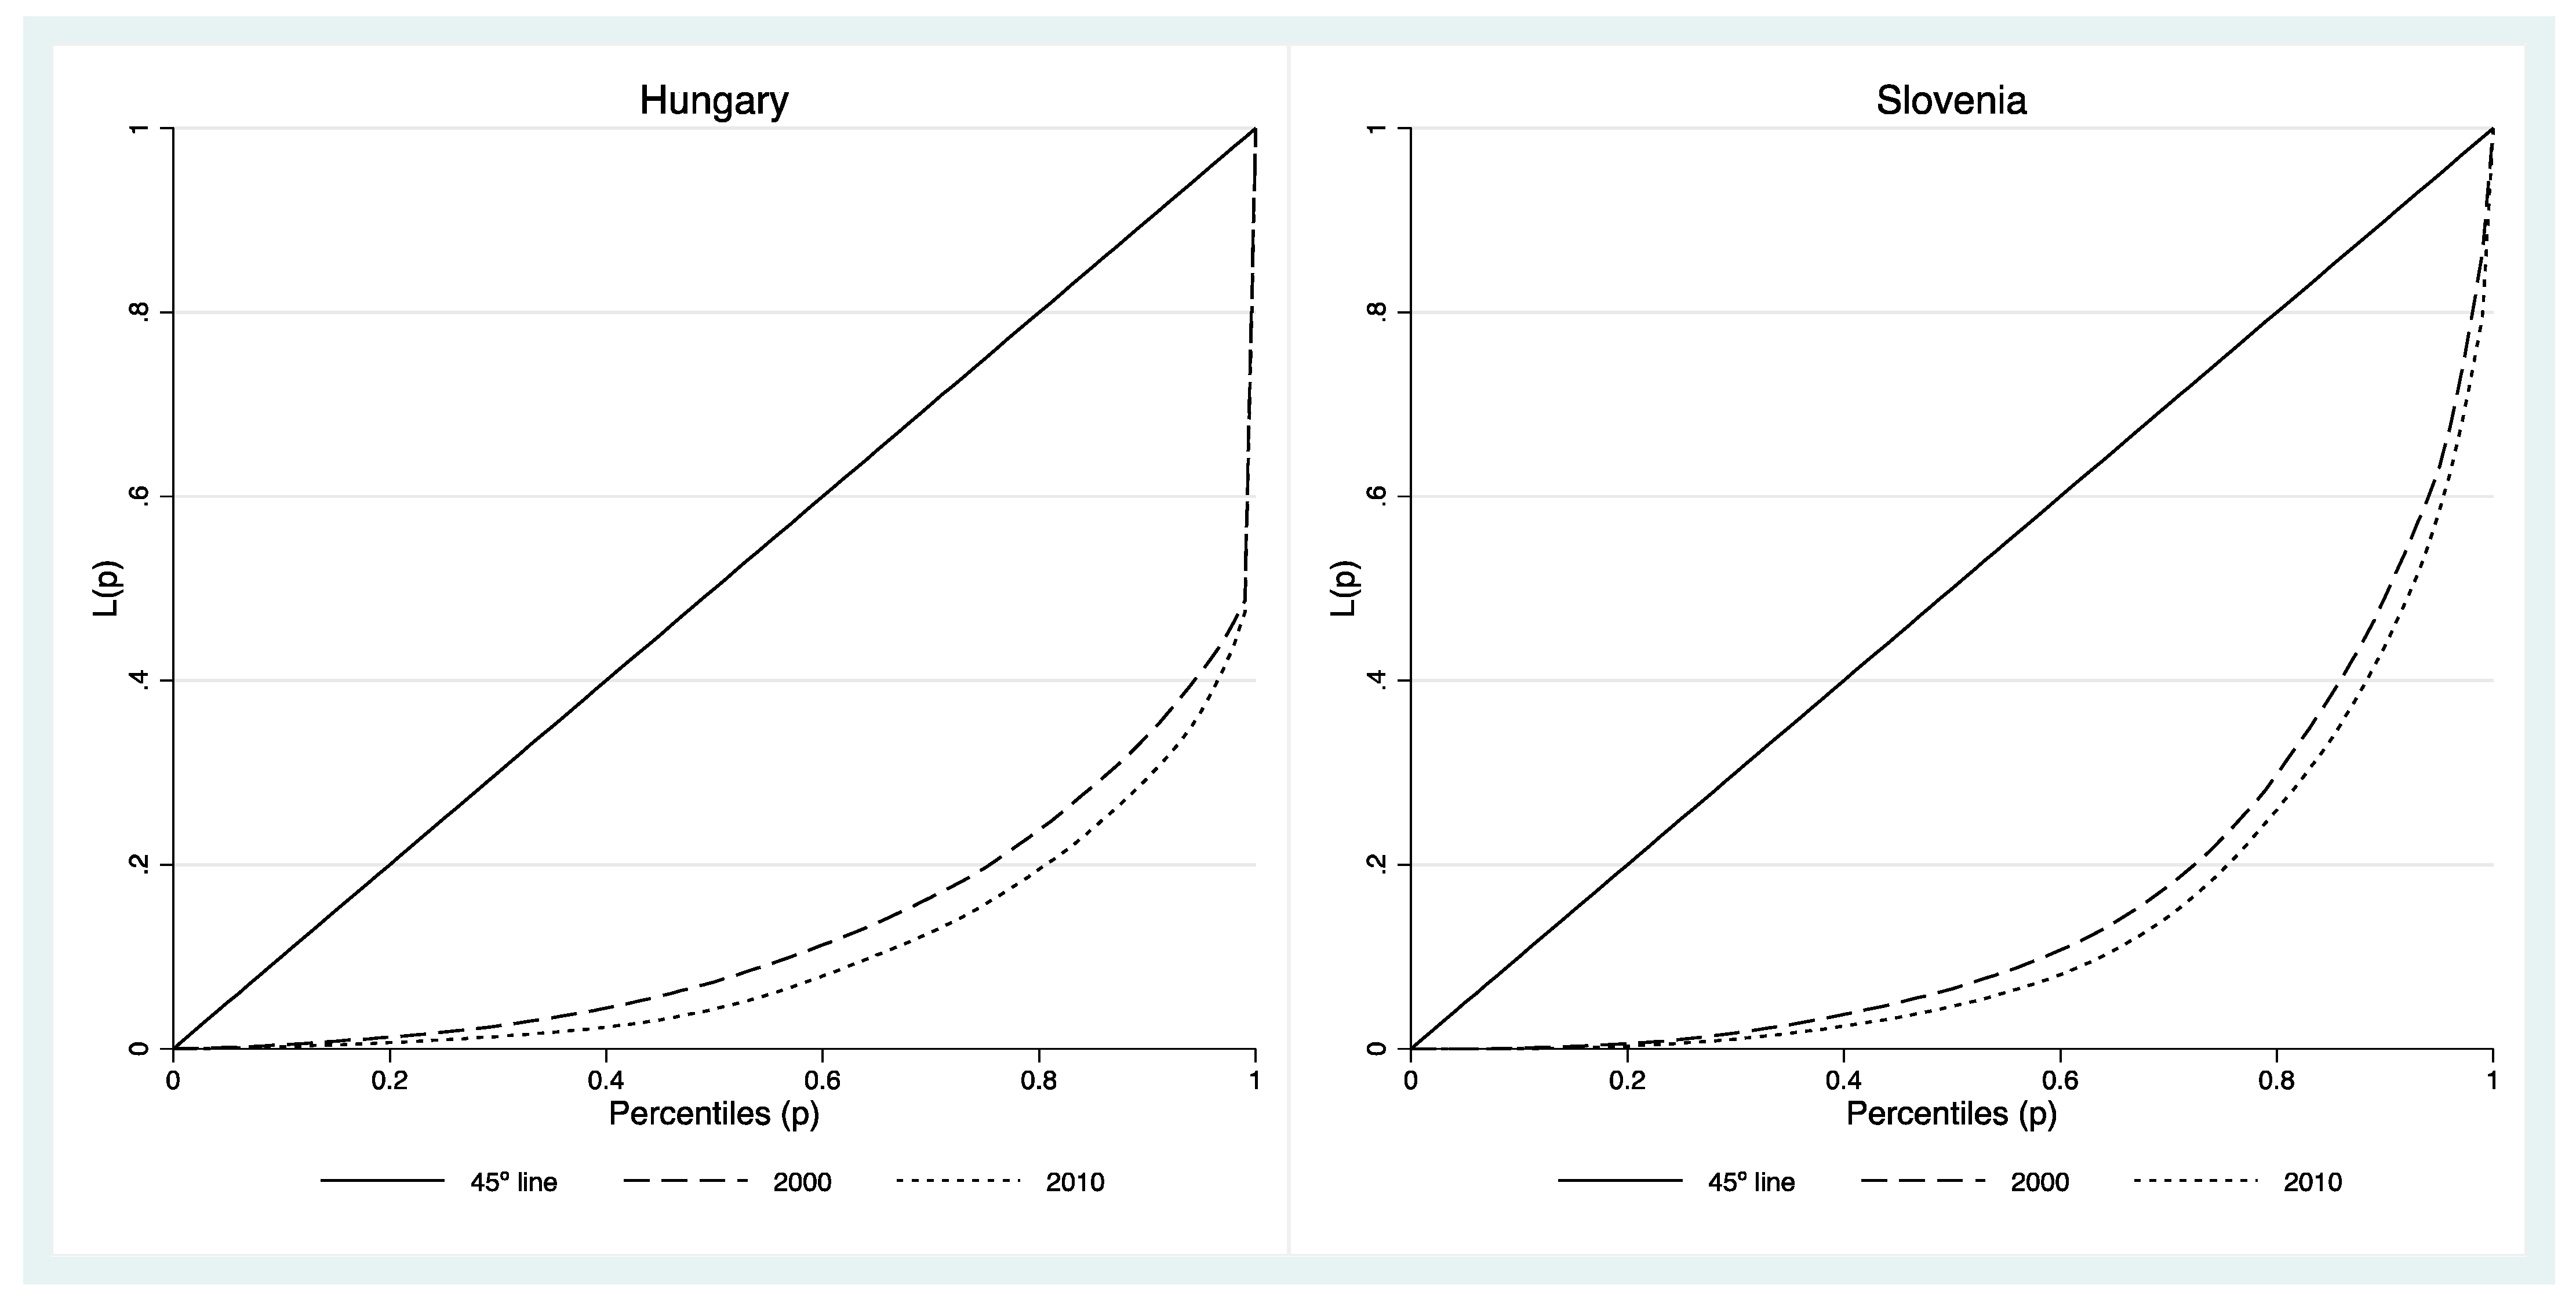
The actual values of the initial (year zero = 2000) and final (year one = 2010) single-parameter Gini coefficients show that both the Hungarian and Slovenian pig sectors were strongly spatially concentrated in 2000, and that this inequality had further strengthened by 2010. The growth ratios of spatial concentration were exactly the same (6.5%) in both countries. Considering the P-component, there is an important difference between the two transition processes. In Slovenia, P(v) > 0 shows that the transition was a “pro-poor” process; the decrease in pig herds was proportionally less for LAUs with relatively smaller pig herds than for those with a relatively large pig population. However, this trend was totally offset by the re-ranking (R-) component; R(v) > P(v) suggests that spatial pig herd mobility was the driver of this increasing inequality.
In Hungary, the situation was simpler. Both the values of the P- and R-component show a “pro-rich” re-ranking and inequality-increasing transition.
This process of increasing concentration/inequality is graphically illustrated with Lorenz-curves in Figure 5.
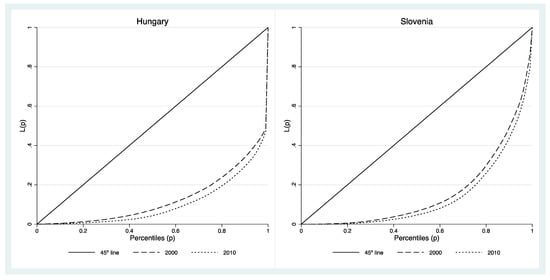
Figure 5.
Lorenz-curves for the Hungarian and Slovenian pig sector. Source: authors’ calculation.
Despite the significant role of the R-component, the spatial mobility of the pig population was slightly lower in Slovenia (see Table 3). The diagonal elements of the Markov transition probability matrix represent the LAUs that remained in the same quartile between 2000 and 2010. It can be seen that the Slovenian diagonal values move around 80 percent in each quartile. The ranking position of the majority of LAUs did not change during the investigated period. However, the strange transition path from Q1 (representing LAUs with the smallest pig herds) to Q4 (LAUs with the largest ones) covers more than 10% of the initially Q1-ranked units. The radical expansion of the pig population in these units might have resulted in the significant re-ranking effect seen in Table 3.
Table 3.
Decomposition of change in spatial concentration between 2000 and 2010.
Measures of spatial mobility are higher in Hungary, although the transitions are mostly limited to the neighboring quartiles. Most change occurred between quartiles Q1 and Q2, and Q2 and Q3.
3.2. Spatial Association of Pig Distribution
The final step of the research involved an investigation of the spatial association. As Table 4 shows, the actual values of Moran’s I were significant in both countries and periods, revealing the existence of potential spatial patterns in pig distribution. Moran’s I indices decreased in both countries during the period under analysis. However, the speed of decline was more than eight times as fast in Hungary than in Slovenia. This difference can be explained by the different nature of the structural transitions. The concentration of farm structure and “pro-rich” spatial processes related to the pig population were more favorable, in terms of preserving clustering effects in Hungary. In the restructuring Slovenian pig sector, clustering was weakened by the decreasing pig population and the “pro-poor” nature of the transition.
Table 4.
Global Moran’s I indices pig population at LAU * level.
Now we turn to the investigation of the local autocorrelation, to identify clusters within the global pattern in Hungary using the LISA cluster maps (Figure 6). In 2000, Hungarian pig production was geographically concentrated in the Southern Great Plain (Cluster HH1, consisting of 40 LAUs). The core LAUs of this large clustered area can be found near the southern border. A far smaller cluster (HH2), consisting of two LAUs, existed in the western part of the Little Plain. These two regions have the greatest proportion of arable land that is used by individual farms, thereby increasing the potential for manure spreading and growing forage. The local potential for forage production and the application of manure increases local pig density, mainly because of low transportation costs. From a socio-cultural perspective, pig farming has a deep cultural and historical background in these areas; a situation which is favorable for technological and information spillover.
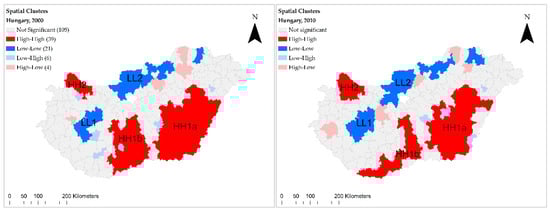
Figure 6.
LISA * cluster maps of the Hungarian pig population, 2000 and 2010. * Local indicator of spatial autocorrelation (local Moran’s I has been used as indicator). HH: high–high cluster, and LL: low–low cluster. Source: authors’ estimation.
Two low–low spatial clusters (marked in blue) are identified in two mountainous or hilly regions, which are naturally less favored areas for pig farming. LL1 is located near Lake Balaton, where agricultural activity is limited and strongly controlled by environmental restrictions.
By 2010, the pig population of LAUs had sharply declined in general, while the spatial profile of pig production in Hungary remained quite clustered. The location of the clustered areas did not change considerably, but their shape transformed slightly. The differences between the core and periphery regions shrunk, and the number of high–high LAUs declined from 400 to 37. HH-1 remained the largest and most important cluster for individual farm pig production in the Great Plain. The area of cluster HH-2 expanded with two new LAUs.
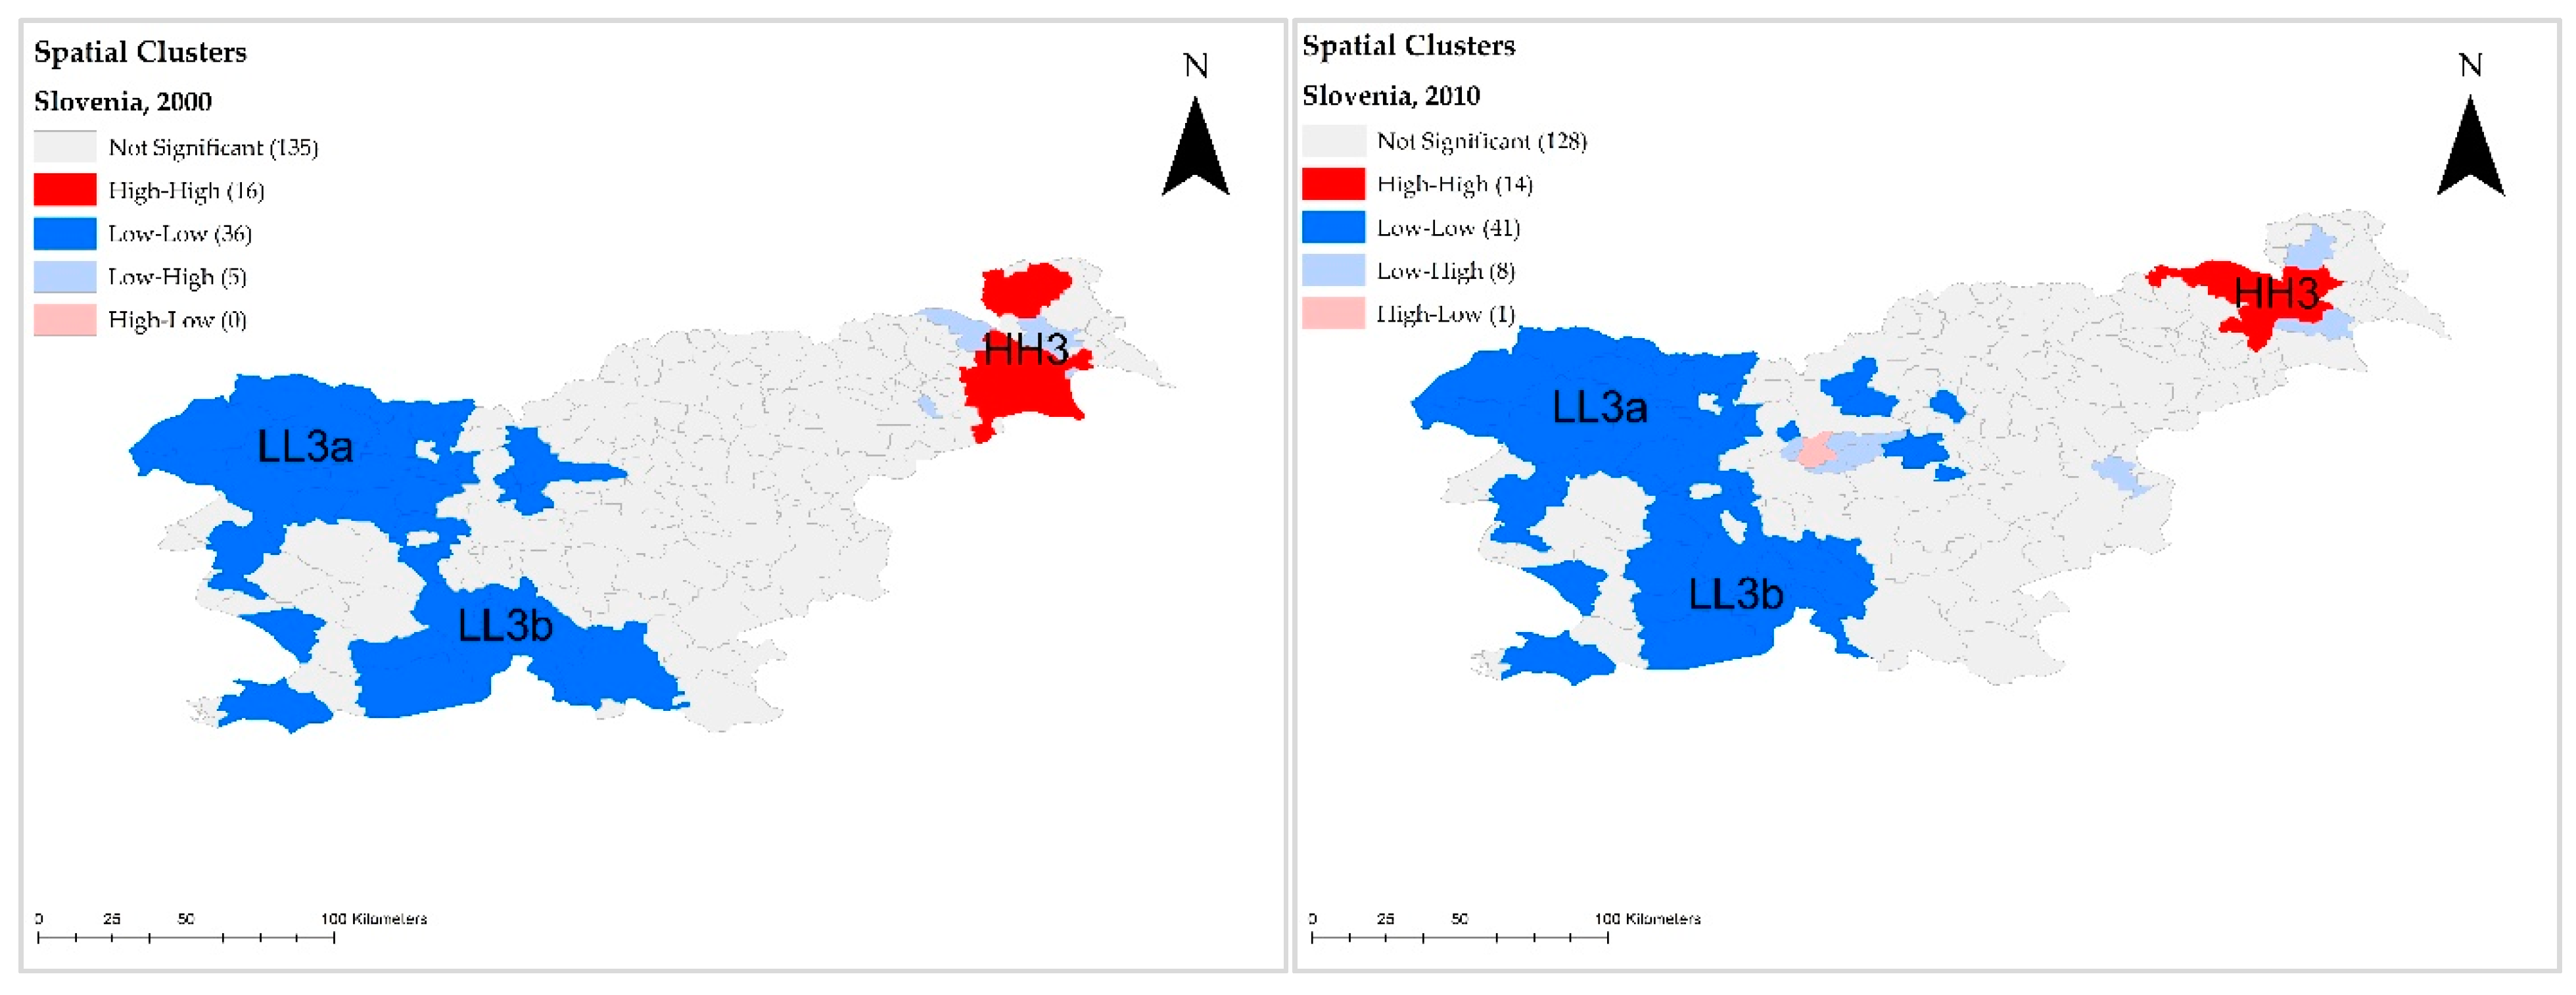
The spatial pattern of the Slovenian pig sector (Figure 7) involved less clustering and more dependence on terrain than the Hungarian one. The only high–high cluster (consisting of 16 LAUs) was found in the eastern lowlands. The area of clustering economies was limited to a very small part of the country. This situation had not changed by 2010. While the global Moran’s I decreased almost by 70 percent, the HH3 cluster declined in area. Clustering effects had clearly become peripheral by the end of 2010.

Figure 7.
LISA * cluster maps of the Slovenian pig population, 2000 and 2010. * Local indicator of spatial autocorrelation (local Moran’s I has been used as indicator). HH: high–high cluster, and LL: low–low cluster. Source: authors’ estimation.
4. Discussion
Based on the results from the Gini coefficient decomposition, we find that the increase in spatial inequality in both countries was accompanied by a drastic reduction in the pig population. In the case of Slovenia, a “pro-poor”, inequality-compensating progressivity was discovered. However, this inequality-reducing component was totally eliminated by the re-ranking effect of changes in pig herds. In the case of Hungary, the progressive element involved a “pro-rich” process, which was further strengthened by the re-ranking. Consequently, our primary conclusion is that spatial progressivity is related to the nature of farm structural change, which moved in different directions in the studied countries. In Slovenia, the decrease in the inequality of farm structure contributed to a “pro-poor” transition. In contrast, the concentration of the Hungarian pig farm structure underwent a “pro-rich” transition. This relationship between global farm structural change and spatial transition is a logical, but not evident, phenomenon. Testing it on a larger sample using quantitative methods is therefore recommended.
The re-ranking effect played a significant role in increasing inequality in the spatial concentrations of both countries. As our study focused on changes in the pig population, explanations used in the literature that refer to income inequality (based on taxes and transfers) cannot be applied. Spatial re-ranking is much more likely to be due to reorganization technologies and the tightening of environmental regulations. The reorganization process of CEE pig sectors, as detailed by [12], legitimately increases spatial disparity; the need to increase productivity and efficiency leads to the specialization of spatial units and the territorial organization of the sector. That this process occurred in Hungary is supported by the fact that ten of the twelve Hungarian pig cooperatives can currently be found in highly clustered pig production areas, while only two cooperatives operate elsewhere in the country, in locations where pig production is also not uncommon (see [14]).
The territorial role of environmental regulation is twofold. On the one hand, it [31] has been demonstrated that restrictions on manure spreading can boost spatial concentration and agglomeration economies. On the other hand, re-ranking processes are strengthened by restrictions, as manure placement restrictions are area-specific; they are stricter in environmentally sensitive and tourist areas, but more permissive in environmentally and socially less sensitive areas. The reverse is also true for agri-environmental payments [32]. Failure to take this fact into account in pig sector development plans is a serious regulatory error, which can be partly attributed to the increase in social tension related to sectoral transformation.
In terms of spatial patterns, the two countries show significant differences. Despite the increase in spatial inequalities in Slovenia, the presence of clustering effects and the extent of pig agglomeration areas have drastically declined. We found that the formation of clusters is initially limited by the terrain of the country, as clearly reflected in the diagonals and transition probability indices of the Markov matrices. Under these environmental conditions, the potential for positive spatial externalities (spillover effects, information exchange, and market access) remains partly unutilized. This again suggests the need for the planned development of formal horizontal integration and professional networks in the sector.
In Hungary, the presence of clustering effects and the extent of pig cluster areas did not significantly decrease, due to favorable terrain conditions, and also partly due to the spatial concentration of horizontal integration. Positive regional externalities remained important factors for the concentrated Hungarian pig sector. It would be reasonable to consciously build on these externalities in sectoral development strategies, thereby reinforcing and stimulating spillover processes.
The operational interest and relevance of our study can be found in agricultural and environmental policies and pig farming practice. The pig sector in both studied countries has experienced decline. This has reduced environmental problems and the swine sewage management in the areas with a high pig concentration, particularly on large-scale pig farms.
In designing new agricultural policies regarding pig farming at the national and international (i.e., European) level, it could be worth considering economic, environmental, and societal sustainability objectives. This preparation and decision-making process should include practitioners, civil society interest groups, and citizens, to avoid possible conflicts and trade-offs between farmers, different societal interest groups, and non-farming populations living in rural areas. Moreover, the role of organic farming in the pig sector could also be considered more important. This transformation process can be linked with the development of supplementary activities on farms, such as meat processing and tourism. Organic swine farming exists in both countries, although not on a large scale, but rather on small-scale family farms. This can provide opportunities for pig-meat branding and niche market development, such as in the case of the “krškopoljski” pig in Slovenia [33].
Our results suggest that the exploitation and policy management of spatial externalities is justified, even in countries with a small area and decreasing pig population. Among the issues for future research is making a comparison of the present findings with those of the post 2010 period, when comparable agricultural survey data become available. This most recent evidence could capture the adjustment and restructuring of the pig sectors in response to the economic crisis and instabilities in the global pig and pork markets in terms of real price instability. This may have led to a reduction in the pig population, contributing to changing concentration and clustering paths.
5. Conclusions
This study contributes to the spatial transformation and spatial concentration research literature, focusing on a comparative analysis of the pig sector. In this paper we described an investigation of the spatial aspects of the structural changes in the Hungarian and Slovenian pig sectors. These two neighboring countries, with different pig farm sizes and pork market structures, are good representatives of typical Central-European concentration and restructuring processes. In terms of the pig/pork-meat market balance, Hungary is a net exporter, and Slovenia is a net importer. With the decline in the pig population, self-sufficiency has declined in countries that have traditionally been major consumers of pork meat.
Concentration and inequality measures with Markov transition probability matrices were applied. To sum up, our results for Hungary and Slovenia show that the structural transformation of the Central European countries, which involved a decrease in the pig population, has been characterized by an increase in territorial concentration and inequality. Clustering effects are particularly significant in the Hungarian pig sector, which is moving towards large-scale concentration. Agglomeration externalities may be useful, in terms of implementing national sectoral development plans. In the case of Slovenia, the presence of a clustering effect was also confirmed, although it significantly weakened during the period under investigation and may have weakened further since then; an issue for research in the future. In 2020, agricultural censuses were conducted and will provide recent data structures and comparisons. Among issues for research in the future is the analysis of the spatial clustering concentration, capturing the impact of scale effects in economic structures and agglomeration economics, considering causal inference.
Author Contributions
Conceptualization, A.C. and I.F.; methodology, A.C. and I.F.; software, A.C.; validation, A.C., Š.B. and I.F.; formal analysis, A.C.; investigation, A.C.; resources, I.F. and Š.B.; data curation, Š.B. and A.C.; writing—original draft preparation, A.C. and Š.B.; writing—review and editing, Š.B.; visualization, A.C.; supervision, I.F.; project administration, I.F. and Š.B.; funding acquisition, I.F. and Š.B. All authors have read and agreed to the published version of the manuscript.
Funding
This article is based on joint research within the received funding from the Hungarian and Slovenian Research Agencies in the project N5-0094—Impacts of agricultural policy on the regional adjustment in agriculture: A Hungarian-Slovenian comparison.
Institutional Review Board Statement
Not applicable.
Informed Consent Statement
Not applicable.
Data Availability Statement
Publicly available datasets were analyzed in this study.
Conflicts of Interest
The authors declare no conflict of interest.
References
- Duff, M. Economies of size in production agriculture. J. Hunger Environ. Nutr. 2009, 4, 375–392. [Google Scholar] [CrossRef]
- Hsu, S.-L. Scale Economies, Scale Externalities: Hog Farming and the Changing American Agricultural Industry (23 March). FSU College of Law, Public Law Research Paper No. 745. 2015. Available online: http://ssrn.com/abstract=2584224 (accessed on 11 November 2020). [CrossRef]
- Herath, D.P.; Weersink, A.J.; Carpentier, C.L. Spatial dynamics of the livestock sector in the United States: Do environmental regulations matter? J. Agric. Resour. Econ. 2005, 30, 45–48. [Google Scholar]
- Larue, S.; Abildtrup, J.; Schmitt, B. Positive and negative agglomeration externalities: Arbitration in the pig sector. Spat. Econ. Anal. 2011, 6, 167–183. [Google Scholar] [CrossRef]
- Roe, B.; Irwin, E.G.; Sharp, J.S. Pigs in space: Modeling the spatial structure of hog production in traditional and nontraditional production regions. Am. J. Agric. Econ. 2002, 84, 259–278. [Google Scholar] [CrossRef]
- Roguet, C.; Duflot, B.; Rieu, M. Évolution des modèles d’élevage de porcs en Europe et impacts sur les performances technico-économiques. Économie Rurale 2017, 357–358, 73–86. [Google Scholar] [CrossRef]
- Hayes, E.T.; Curran, T.P.; Dodd, V.A. The influence of diet crude protein level on odour and ammonia emissions from finishing pig houses. Bioresour. Technol. 2017, 91, 309–315. [Google Scholar] [CrossRef] [Green Version]
- Vizzari, M.; Modica, G. Environmental effectiveness of swine sewage management: A multicriteria AHP-based model for a reliable quick assessment. Environ. Manag. 2013, 52, 1023–1039. [Google Scholar] [CrossRef]
- Bava, L.; Zucali, M.; Sandrucci, A.; Tamburini, A. Environmental impact of the typical heavy pig production in Italy. J. Clean. Prod. 2017, 140, 685–691. [Google Scholar] [CrossRef]
- Lijó, L.; Frison, N.; Fatone, F.; González-García, S.; Feijoo, G.; Moreira, M.T. Environmental and sustainability evaluation of livestock waste management practices in Cyprus. Sci. Total Environ. 2018, 634, 127–140. [Google Scholar] [CrossRef]
- Zhang, L.; Cao, M.; Xing, A.; Sun, Z.; Huang, Y. Modelling the Spatial Expansion of Green Manure Considering Land Productivity and Implementing Strategies. Sustainability 2018, 10, 225. [Google Scholar] [CrossRef] [Green Version]
- Marquer, P.; Rabade, T.; Forti, R. Pig Farming in the European Union: Considerable Variations from One Member State to Another. Statistics in Focus 15/2014; Eurostat: Luxembourg, 2014. [Google Scholar]
- Mulatu, A.; Wossink, A. Environmental regulation and location of industrialized agricultural production in Europe. Land Econ. 2014, 90, 509–537. [Google Scholar] [CrossRef]
- Csonka, A.; Fertő, I. Structural change and agglomeration in the Hungarian pork industry. Eur. Plan. Stud. 2020, 28, 1756–1770. [Google Scholar] [CrossRef]
- Komorowski, M. Identifying industry clusters: A critical analysis of the most commonly used methods. Reg. Stud. Reg. Sci. 2020, 7, 92–100. [Google Scholar] [CrossRef]
- Cruz, S.S.; Teixeira, A.A. The neglected heterogeneity of spatial agglomeration and co-location patterns of creative employment: Evidence from Portugal. Ann. Reg. Sci. 2015, 54, 143–177. [Google Scholar] [CrossRef]
- Carlos Efraín Porto Tapiquén. Geografía, SIG y Cartografía Digital. Valencia, Spain. 2020. Available online: http://tapiquen-sig.jimdofree.com (accessed on 18 October 2021).
- Eurostat. Livestock: Number of Farms and Heads of Animals by Livestock Units (LSU) of Farm and NUTS 2 Regions (1990–2007); Eurostata: Luxembourg, 2019; Available online: https://appsso.eurostat.ec.europa.eu/nui/show.do?dataset=ef_ls_ovlsureg&lang=en (accessed on 30 January 2020).
- Eurostat. Livestock: Number of Farms and Heads of Animals by Livestock Units (LSU) of Farm and NUTS 2 Regions (from 2005 onwards); Eurostata: Luxembourg, 2019; Available online: https://appsso.eurostat.ec.europa.eu/nui/show.do?dataset=ef_olslsureg&lang=en (accessed on 30 January 2020).
- Eurostat. Pig Population-Annual Data; Eurostata: Luxembourg, 2020; Available online: https://appsso.eurostat.ec.europa.eu/nui/show.do?dataset=apro_mt_lspig&lang=en (accessed on 31 January 2020).
- Hungarian Central Statistical Office. Dissemination Database–Regional Statistics. 2016. Available online: http://statinfo.ksh.hu/Statinfo/themeSelector.jsp?page=2&szst=T (accessed on 26 January 2020).
- SORS. Livestock (Agricultural Census); Statistical Office of the Republic of Slovenia: Ljubljana, Slovenia, 2019; Available online: https://pxweb.stat.si/SiStat/en/Podrocja/Index/85/kmetijstvo-gozdarstvo-in-ribistvo (accessed on 19 November 2019).
- Jenkins, S.P.; Van Kerm, P. Trends in income inequality, pro-poor income growth and income mobility. Oxf. Econ. Pap. 2006, 58, 531–548. [Google Scholar] [CrossRef] [Green Version]
- Fertő, I. Spatial Developments of Hungarian Agriculture in the Transition: The Case of Crop Production; Discussion Paper No. 107; Leibniz Institute of Agricultural Development in Central and Eastern Europe (IAMO): Halle (Saale), Germany, 2007. [Google Scholar]
- Fertő, I.; Varga, Á. A jóllét területi különbségei Magyarországon: Egy lehetséges térségfejlettségi index alkalmazása. Statisztikai Szemle 2014, 92, 874–891. [Google Scholar]
- Shorrocks, A. The measurement of mobility. Econometrica 1978, 46, 1013–1024. [Google Scholar] [CrossRef]
- Geweke, J.; Marshall, R.; Zarkin, G. Mobility indices in continuous time Markov chains. Econometrica 1986, 54, 1407–1423. [Google Scholar] [CrossRef]
- Zhang, L.; Wang, J.; Wen, H.; Fu, Z.; Li, X. Operating performance, industry agglomeration and its spatial characteristics of Chinese photovoltaic industry. Renew. Sust. Energ. Rev. 2016, 65, 373–386. [Google Scholar] [CrossRef]
- Moran, P.A.P. Notes on continous stochastic phenomena. Biometrika 1950, 37, 17–23. [Google Scholar] [CrossRef]
- Anselin, L. Local Indicators of Spatial Association—LISA. Geogr. Anal. 1995, 27, 93–115. [Google Scholar] [CrossRef]
- Gaigné, C.; Le Gallo, J.; Larue, S.; Schmitt, B. Does regulation of manure land application work against agglomeration economies? Theory and evidence from the French hog sector. Am. J. Agric. Econ. 2012, 94, 116–132. [Google Scholar] [CrossRef]
- Polakova, J.; Soukup, J. Results of implementing less-favoured area subsidies in the 2014–2020 time frame: Are the measures of environmental concern complementary? Sustainability 2020, 12, 10534. [Google Scholar] [CrossRef]
- Društvo Rejcev Krškopoljskih Prašičev–Rejska Organizacija za Avtohtono Pasmo Krškopoljskih Prašičev, Cerklje ob Krki, Slovenia. 2021. Available online: http://www.krskopoljski-prasic.si/ (accessed on 20 October 2021).


Publisher’s Note: MDPI stays neutral with regard to jurisdictional claims in published maps and institutional affiliations. |
© 2021 by the authors. Licensee MDPI, Basel, Switzerland. This article is an open access article distributed under the terms and conditions of the Creative Commons Attribution (CC BY) license (https://creativecommons.org/licenses/by/4.0/).