Article

Ecosystem Services Monitoring in the Muthurajawela Marsh and Negombo Lagoon, Sri Lanka, for Sustainable Landscape Planning

by
Darshana Athukorala
1,*,
Ronald C. Estoque
2,
Yuji Murayama
3 and
Bunkei Matsushita
3
1
Graduate School of Life and Environmental Sciences, University of Tsukuba, 1-1-1 Tennodai, Tsukuba 305-8572, Ibaraki, Japan
2
Center for Biodiversity and Climate Change, Forestry and Forest Products Research Institute, Tsukuba 305-8687, Ibaraki, Japan
3
Faculty of Life and Environmental Sciences, University of Tsukuba, 1-1-1 Tennodai, Tsukuba 305-8572, Ibaraki, Japan
*
Author to whom correspondence should be addressed.
Sustainability 2021, 13(20), 11463; https://doi.org/10.3390/su132011463
Submission received: 4 August 2021 / Revised: 12 October 2021 / Accepted: 12 October 2021 / Published: 17 October 2021

Abstract

:
In this study, we examined the impacts of urbanization on the natural landscape and ecosystem services of the Muthurajawela Marsh and Negombo Lagoon (MMNL) located in the Colombo Metropolitan Region, Sri Lanka, with the goal to help inform sustainable landscape and urban planning. The MMNL is an important urban wetland ecosystem in the country but has been under the immense pressure of urbanization where the natural cover (e.g., marshland and mangrove areas) is continuously being converted to urban use (e.g., residential and commercial). Here, we estimated and assessed the changes in the ecosystem service value (ESV) of the MMNL based on land use/cover (LUC) changes over the past two decades (1997–2017). Considering two plausible scenarios, namely a business-as-usual (BAU) scenario and ecological protection (EP) scenario, and using a spatially explicit land change model, we simulated the future (2030) LUC changes in the area and estimated the potential consequent future changes in the ESV of the MMNL. The results revealed that from 1997 to 2017, the ESV of the MMNL decreased by USD 8.96 million/year (LKR 1642 million/year), or about 33%, primarily due to the loss of mangrove and marshland from urban expansion. Under a BAU scenario, by 2030, it would continue to decrease by USD 6.01 million/year (LKR 1101 million/year), or about 34%. Under an EP scenario, the projected decrease would be lower at USD 4.79 million/year (LKR 878 million/year), or about 27%. Among the ecosystem services of the MMNL that have been, and would be, affected the most are flood attenuation, industrial wastewater treatment, agriculture production, and support to downstream fisheries (fish breeding and nursery). Overall, between the two scenarios, the EP scenario is the more desirable for the sustainability of the MMNL. It can help flatten its curve of continuous ecological degradation; hence, it should be considered by local government planners and decision-makers. In general, the approach employed is adaptable and applicable to other urban wetland ecosystems in the country and the rest of the world.

1. Introduction

Wetland ecosystems provide a wide range of valuable ecosystem services, such as flood control, pollution control, water conservation, and climate regulation [1,2]. They feature prominently in the United Nations’ Sustainable Development Goals (SDGs) and targets [3]. In urban areas, urban wetland ecosystems play important roles, providing ecosystem services that contribute to the maintenance and sustainability of urban ecological environment and the overall safety and livability of urban regions [4,5,6]. However, anthropogenic activities such as industrialization, agricultural expansion, and urbanization have changed, diminished, or destroyed most wetlands in recent decades [7,8], including urban wetland ecosystems [9].
In this study, we examined the impacts of urbanization on the natural landscape and ecosystem services of the Muthurajawela Marsh and Negombo Lagoon (MMNL), an important urban wetland ecosystem and one of the top priority wetlands in Sri Lanka. Here, we used settlement expansion as a proxy indicator of urbanization, where settlement is a land use/cover (LUC) class that includes low-intensity and high-intensity urban areas, industrial zones, transportation hubs, airports, home gardens, asphalt areas, and residential areas (more on Section 2.2). Owing to its geographical and biophysical characteristics, the MMNL is a source of valuable ecosystem services, such as flood attenuation, water purification, carbon sequestration, and fish breeding and nursery [10,11].
However, because of rapid and uncontrolled urbanization that has led to the loss of natural cover [9,12], we hypothesize that these ecosystem services, including the ecosystem service value (ESV) of the MMNL have been affected. Among the major challenges that local government planners and decision-makers and other concerned groups and individuals are facing today is how the MMNL’s curve of continuous ecological degradation can be flattened. The goal of our study is to help inform landscape and urban planning towards this context and for the sustainability of the MMNL in general.
In previous studies, the concept of ecosystem services has been included in spatiotemporal monitoring and assessments of the impacts of urbanization in many parts of the world, both in non-wetland urban regions [13,14,15,16,17] and in urban wetland regions [4,6]. Advances in geospatial technology, including the increasing availability of Earth observation (remote sensing) data at various spatial and temporal resolutions, have helped to improve social-ecological monitoring and assessments. Furthermore, the development of land change models has helped researchers to project future LUC changes and explore different scenarios [13,14,18,19,20].
Several studies have been conducted to investigate various aspects of the MMNL. For example, Athukorala et al. [9] have studied the impacts of urbanization on the MMNL, emphasizing implications for landscape planning towards a sustainable urban ecosystem. Jayathilake and Chandrasekara [21] have investigated the variations of avifaunal diversity concerning land use modifications in the Negombo estuary. Emerton and Kekulandala [11] have assessed the economic value of the Muthurajawela Marsh. Bambaradeniya et al. [22] have studied the biodiversity status in the Muthurajawela wetland sanctuary. However, we are not aware of any study that monitored the past-present changes and/or projected the future changes in the ecosystem services and ESV of the MMNL based on Earth observation data and geospatial techniques.
Hence, in this study, we assessed changes in the ESV of the MMNL based on LUC changes over the past two decades (1997–2017) using Earth observation data. Considering two plausible scenarios, namely a business-as-usual (BAU) scenario and ecological protection (EP) scenario, and using a spatially explicit land change model, we simulated future (2030) LUC changes in the area and estimated potential consequent future changes in the ESV of the MMNL. We discussed the implications of the results in the context of the MMNL’s sustainability.

2. Methods

2.1. Study Area

Figure 1 shows a cross-section of the MMNL, classified into five ecological zones, each with a description of the level of anthropogenic activities, water conditions, soil groups, vegetation types, and some ecosystem services. The MMNL is situated on the western coastal plain of Sri Lanka, within the Colombo Metropolitan Region (Figure 2). It has a total area of approximately 134 km2 [9,10]. In 1996, the Government of Sri Lanka designated the northern section of the MMNL as a wetland sanctuary (Muthurajawela Sanctuary) owing to its high ecological and biological significance [10] (Figure 2, PA1). In 2006, another protected area was designated by the government (Muthurajawela Environmental Protection Area) for ecosystem services, including flood control [23] (Figure 2, PA2).
The Negombo Lagoon is linked to the Indian Ocean by a single narrow opening at the northern end of the channel segment (Figure 2). The Muthurajawela Marsh stretches southward from the lagoon, forming the largest coastal peat bog in the country [9]. The elevation range is approximately from −13 to 44 m above sea level. This urban wetland ecosystem receives plenty of rainwater from the southwest monsoon. Annual average rainfall ranges from 2000 to 2500 mm, and annual average temperatures are from 22.5 °C to 25.0 °C [24].
The marsh plant vegetations are in their final stages of succession, leading to dry land formation [10]. In the MMNL, 194 species of flora have been recorded under seven major plant communities—marsh, reed swamp, short grassland, shrubland, lentic, stream bank, and mangrove swamp. For species of fauna, 40 fishes (4 of which are endemic and nationally endangered), 14 amphibians, 31 reptiles, 102 birds (1 endemic and 19 winter migratory birds), and 22 mammals have also been recorded [10]. The aquatic resources are abundant in phytoplankton, phosphors, and algae, all of which are essential components in the food web of various organisms [25].
Today, the sustainability of this valuable urban wetland ecosystem is under threat from the growing pressure of urbanization. Flattening the MMNL’s curve of continuous ecological degradation is important, not only as a research endeavor but also as a landscape and urban planning priority.
Figure 1. Graphical illustration of the cross-section of the MMNL divided into zones (aquatic, mangrove, wet meadow, marsh, and upland). These zones are further characterized based on anthropogenic activities, water level, soil group, vegetation, and ecosystem services. Source: National wetland directory of Sri Lanka [10], Environmental Profile of Muthurajawela and Negombo Lagoon [25], Athukorala et al. 2021 [9].
Sustainability 13 11463 g001
Figure 2. Location of the study area: (a) map of Sri Lanka [26]; (b) Gampaha District; and (c) Muthurajawela Marsh and Negombo Lagoon. PA 1 = Protected area 1 (Muthurajawela Sanctuary). PA 2 = Protected area 2 (Muthurajawela Environmental Protection Area).
Sustainability 13 11463 g002

2.2. LUC Change Analysis

We used three LUC maps in this study (1997, 2007, and 2017) (Figure 3). We classified these LUC maps from cloud-free Landsat images (https://earthexplorer.usgs.gov/, accessed on 1 October 2021) captured on 7 February 1997, 2 January 2007, and 13 January 2017. We used a supervised classification method, employing the maximum likelihood algorithm [27,28,29].
Our LUC classification system included four classes, namely marshland, mangrove, settlement, and water. The marshland class included seasonally and intermittently flooded areas, abandoned paddy lands, agricultural lands, marsh plant vegetation, trees, grassland and scrub, peat and bog soil areas, and other cropland areas. The mangrove class included seasonally and intermittently flooded areas with mangroves. The settlement class included low-intensity and high-intensity urban areas, industrial zones, transportation hubs, airports, home gardens, asphalt areas, and residential areas. The water class included the lagoon and other bodies of water such as canals, streams, and ponds.
The accuracy of each LUC map was assessed using 400 reference points generated using a random sampling technique. Google Earth images were used as sources of reference data for 2007 and 2017, while topographic maps of Sri Lanka were used as sources of reference data for 1997. The overall accuracy was 86.50%, 84.25%, and 84.50% for the 1997, 2007, and 2017 LUC maps, respectively.

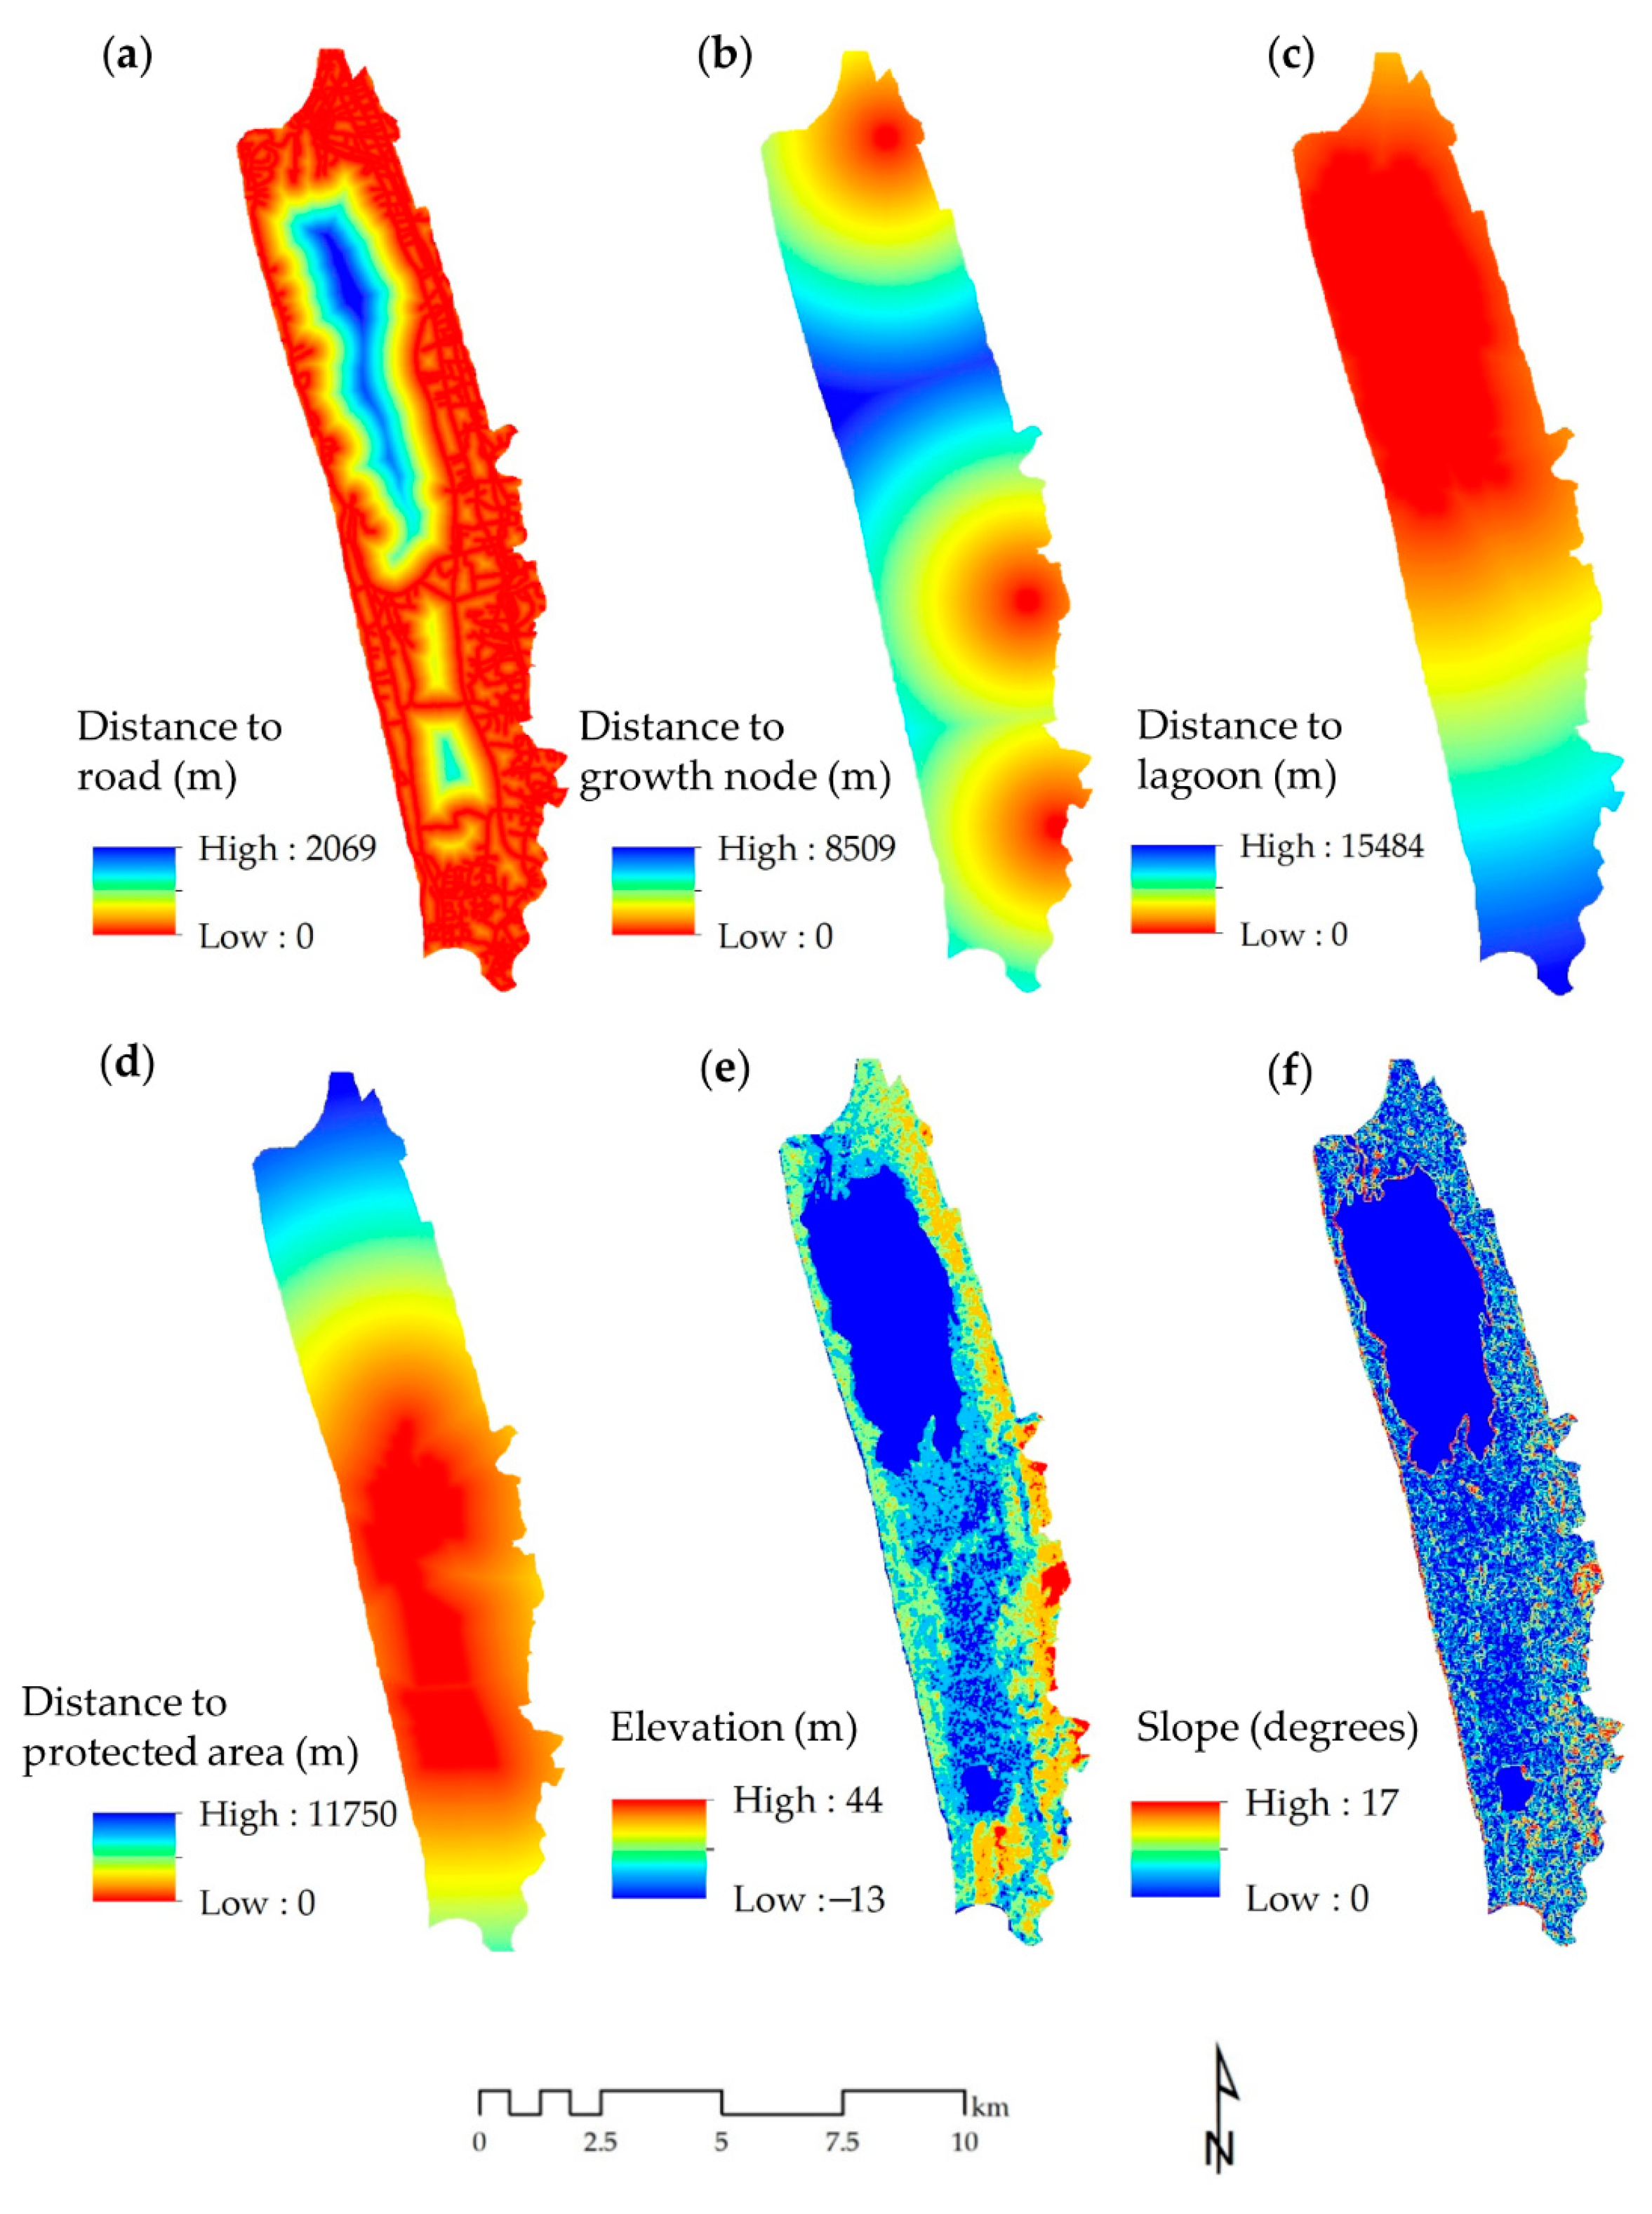
2.3. LUC Change Modeling

2.3.1. Model Calibration and Validation

We used the Land Change Modeler (LCM) [30,31,32], which is available in geospatial monitoring and modeling software called TerrSet (https://clarklabs.org/terrset/, accessed on 1 October 2021), to simulate future LUC changes in the area and examine potential future impacts of urbanization on the natural landscape and ecosystem services of the MMNL (2017–2030). To do this, we first calibrated the model by simulating the observed LUC changes between 2007 and 2017. We considered two LUC transitions: (i) marshland to settlement and (ii) mangrove to settlement. We used the Markov chain algorithm [30,32] to derive a transition matrix that contained the rate or proportion of the area of a particular LUC class that would persist (non-change) or transition to another class (change) from 2007 to 2017 (in our case, these were from marshland to settlement and from mangrove to settlement).
To spatialize the projected quantities of LUC changes from the two transitions considered, we used six spatial variables (variables that we hypothesized to have influenced LUC change patterns in the area) and the multi-layer perception neural network (MLP NN) algorithm [30,32] to model two transition potential maps (one for each transition). These variables included distance to road, distance to growth nodes, distance to the lagoon, distance to the protected areas, elevation, and slope (Figure 4). They were identified and selected based on the literature [33,34,35,36], our knowledge of the study area, and the availability of data. The same set of spatial variables was used for both transitions.
To simulate the LUC changes between 2007 and 2017, we ran the model (LCM) with the following inputs: 1997 and 2007 LUC maps, the six spatial variables for each transition (for the modeling of transition potential maps using the MLP NN algorithm), and a transition matrix for the 2007–2017 period (derived using Markov chain based on the 1997 and 2007 LUC transitions). The output was a simulated LUC map in 2017 that depicted the projected LUC changes from 2007 based on the two LUC transitions considered (marshland to settlement and mangrove to settlement).
We validated the simulation result by calculating the figure of merit (FoM) statistic [18,37,38] for each transition. The FoM was derived based on a three-map comparison technique: LUC 2007 (observed), LUC 2017 (observed), and LUC 2017 (simulated). More specifically, it was derived by taking the ratio of the intersection (H) of the observed change between 2007 and 2017 (H and M) and simulated change between 2007 and 2017 (H and F) to the union of the observed change and simulated change (Equation (1)).
FoM = H ( H + M + F )   ×   100
In Equation (1), H (hits) refers to the quantity of observed change pixels that were simulated as change. M (misses) refers to the quantity of observed change pixels that were simulated as non-change. F (false alarms) refers to the quantity of observed non-change pixels that were simulated as change.

2.3.2. Scenario-Based LUC Change Simulation

The trajectory (quantity and spatial pattern) of future LUC changes generally depends on various factors, such as future changes in various socioeconomic indicators (including development policy-related) and biophysical conditions in the area. In this context, a scenario analysis might be useful as scenarios are aimed at forward-looking adaptive development planning and decision making [39,40]. In fact, scenario analysis has become a useful technique in land change and sustainability research [13,41,42,43,44]. Scenario analysis is a structured process of exploring and evaluating plausible alternative futures [39,45].
In this study, we projected the future impacts of urbanization (2017–2030) on the natural landscape and ecosystem services of the MMNL. We considered two plausible development scenarios: a business as usual (BAU) scenario and an environment protection (EP) scenario.
In the BAU scenario, we allowed the model (LCM) to project and simulate future LUC changes in the MMNL based on the past rates (Markov transition matrix based on the 2007 and 2017 LUC maps) and spatial pattern (transition potential maps) of LUC changes as per the two transitions considered (marshland to settlement and mangrove to settlement). In a recent study, it has been shown that settlements have also been expanding and encroaching into the protected areas (PAs) [9]. In this scenario, we did not introduce any spatial constraints, allowing the observed LUC change pattern to continue. To run the scenario, we used the 2007 and 2017 LUC maps (Figure 3) and the six spatial variables (Figure 4) as inputs and considered 2030 as the end time (year) of the simulation.
In the EP scenario, we used the same data inputs as in the BAU scenario, but we also introduced some plausible policy and development-related assumptions. More specifically, we were interested in the potential impacts of urbanization on the ecosystem services of the MNNL under a scenario in which (i) the urbanization rate would slow down by 20%, and (ii) the two protected areas (PAs) in the area would be completely protected. To do this, first, we revised the Markov transition matrix by withholding (deducting) 20% of the proportion of the area of marshland and mangrove that would transition to settlement by 2030. Second, we introduced a spatial constraint disallowing LUC change to occur in the two PAs. The 20% rate is based on a previous study [37], and our assumption was that the rate (20%) is not that stringent, meaning plausible at given circumstances (e.g., protection of the protected areas, implementation of land use zoning, no illegal settlements, etc.).

2.4. Monitoring ESV Changes

We estimated the past changes in the ESV of the MMNL (1997–2017), as well as the potential future changes based on the BAU and EP scenarios (2017–2030). We considered 10 ecosystem services, namely flood attenuation, industrial wastewater treatment, agriculture production, support to downstream fisheries (fish breeding and nursery), firewood, fishing (fisheries production), leisure and recreation, domestic sewage treatment, freshwater supplies for the local population, and carbon sequestration (Table 1).
We sourced the needed ESV coefficients from an earlier study in the MMNL [11]. We converted the ESV coefficients, which were originally expressed in Sri Lankan Rupee (LKR)/year (2003 price level), into 2020 USD/ha/year equivalents (Equation (2)). To do this, we first expressed the coefficients into 2003 LKR/ha/year. We then converted these 2003 values to the 2020 price level, taking into account inflation. We used a deflator based on the average consumer price index (CPI, a measure of inflation) in 2003 (44.838) and 2020 (135.367) from https://www.imf.org/en/Home (accessed on 1 October 2021). Subsequently, we took the average USD–LKR conversion equivalent (CE) in 2020 (I USD = 183.23 LKR) from https://www.cbsl.gov.lk (accessed on 1 October 2021) and converted the derived 2020 LKR values to 2020 USD equivalents.
ESV   ( 2020   USD ) = ( ESV   LKR   2003 × 2020   CPI   2003   CPI ) 2020   CE
Using the ESV coefficients in Table 1, we estimated the ESV of the MMNL in 1997, 2007, 2017, and by 2030 (under two scenarios) following Equations (3) and (4):
ESV f = k = 1 n A k   ×   VC f
ESV = k = 1 n f = 1 m   A k   ×   VC f
where ESV f   and   ESV refer to the value of ecosystem service f and the ecosystem service value of the MMNL, respectively.   A k refers to the area (ha) of LUC class k, VC f refers to the ESV coefficient of ecosystem service f (USD/ha/year) for LUC class k, and n and m refer to the number of LUC classes and ecosystem services considered, respectively. We considered two LUC classes (marshland and mangrove) and 10 ecosystem services (Table 1).
We also mapped the spatial distribution of the 99 Grama Niladhari (GN) divisions that cover the entire MMNL with their respective ESVs. GN divisions are the smallest administrative divisions in Sri Lanka. To do this, first, we conducted a zonal analysis (tabulate area) to determine the LUC composition and extent in each GN division in 1997, 2007, 2017, 2030 BAU, and 2030 EP using the polygon boundaries of the GN divisions as zones and the LUC maps as inputs. Second, we estimated the ESV of each GN division using Equations (3) and (4).

3. Results

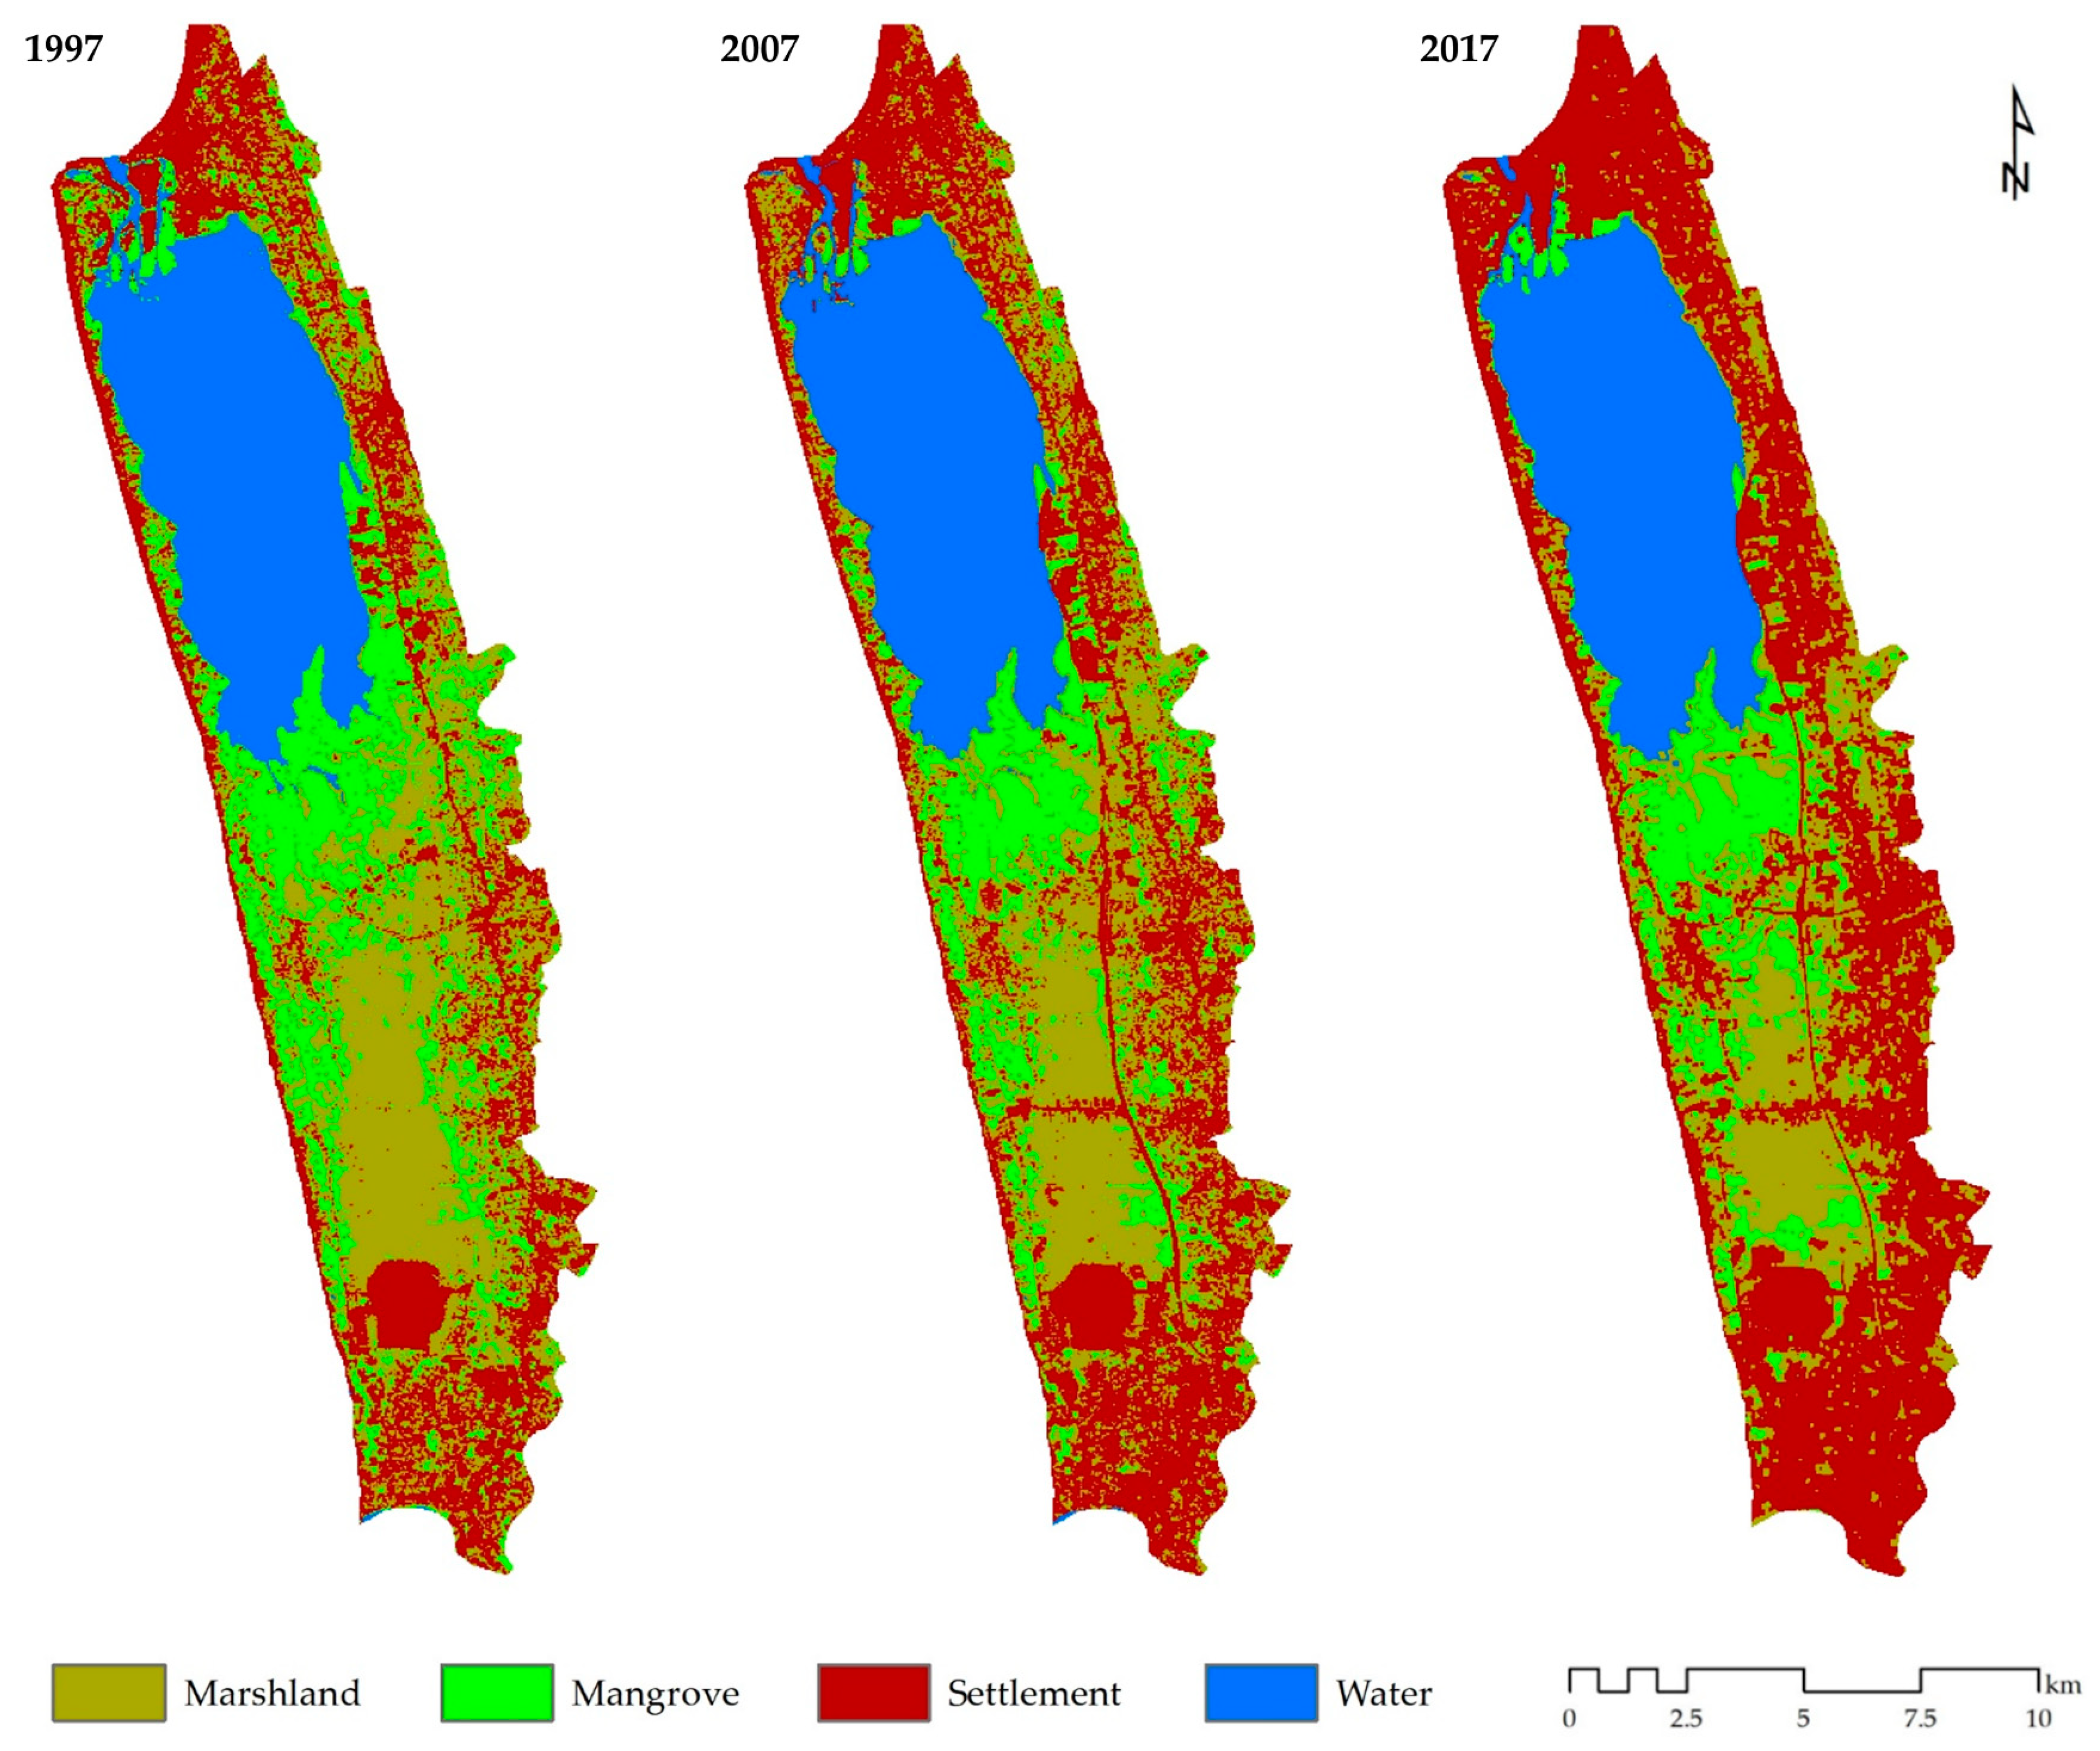
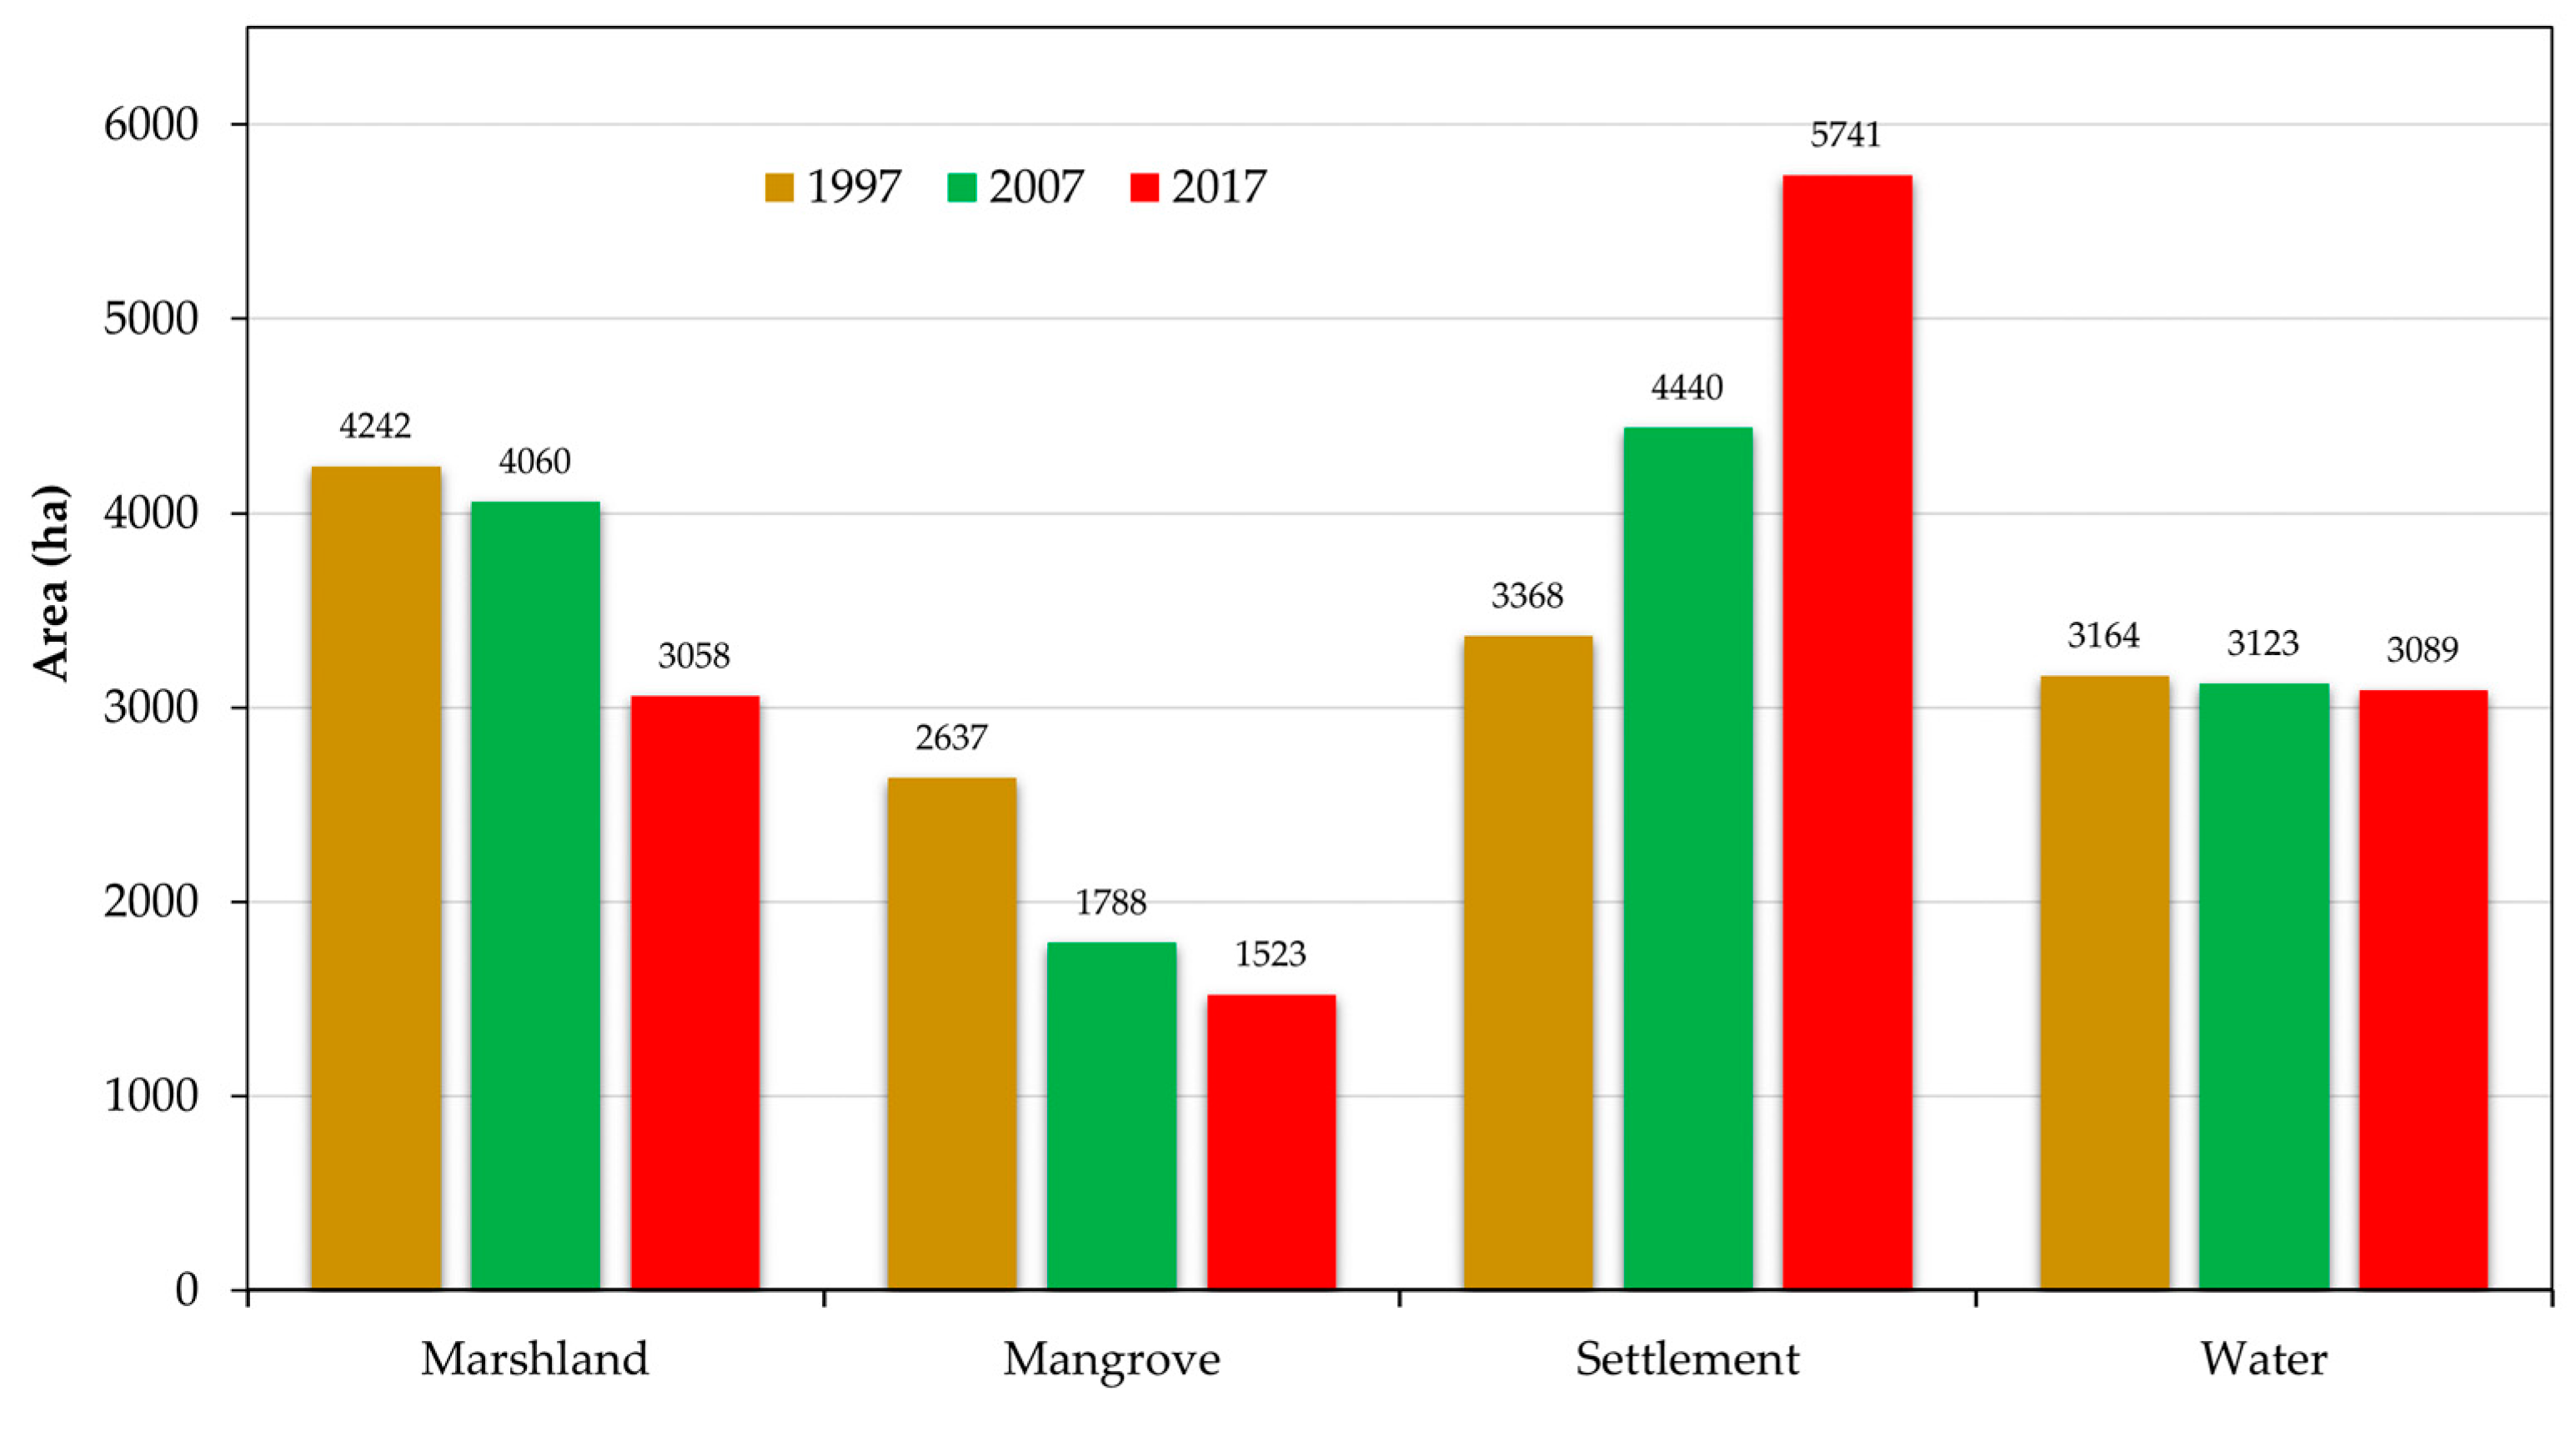
3.1. Changes in LUC and ESV (1997–2017)

Over the past 20 years, the MMNL’s landscape has undergone considerable changes. In 1997, the MMNL had a marshland and mangrove area of 4242 ha and 2637 ha, respectively (Figure 5). However, in 2017, their extent decreased to 3058 ha and 1523 ha, equivalent to a 28% and 42% decrease, respectively. By contrast, the area of the settlement has expanded rapidly over the past two decades at the expense of the MMNL’s marshlands and mangroves, with 3368 ha in 1997 and 5741 ha in 2017, i.e., equivalent to a 70% increase.
As a consequence of the significant loss of marshland and mangrove due to urbanization (settlement expansion), the ESV of the MMNL decreased by USD 8.96 million/year, from USD 26.84 million/year in 1997 to 17.88 million/year in 2017, i.e., equivalent to a 33% decrease (Table 2). Among the ecosystem services considered, flood attenuation, industrial wastewater treatment, agriculture production, and support to downstream fisheries (fish breeding and nursery) were the top services that were affected the most. Altogether, they accounted for over 95% of the total decrease. The ESV loss of flood attenuation accounted for 67% (USD 6.0 million/year).

3.2. Projected Changes in LUC and ESV (2017–2030)

Under the BAU scenario, by 2030, the area of marshland and mangrove in the MMNL would decrease by 1329 ha and 213 ha, respectively, whereas the area of settlement would increase by 1542 ha (Figure 6, Table 3). By contrast, under the EP scenario in which urban expansion rate (settlement expansion) would slow down by 20% (Section 2.3.2), the decrease in the area of marshland and mangrove would be much lower at 1063 ha and 171 ha, respectively. In this scenario, the area of settlement would increase by 1234 ha.
As a consequence of the projected loss of marshland and mangrove by 2030, the ESV of the MMNL would also decrease (Table 4). Under the BAU scenario, the MMNL’s ESV would decrease by USD 6.01 million/year, i.e., equivalent to a 34% decrease relative to 2017 (Table 2). Under the EP scenario, the decrease would be much less at USD 4.79 million/year, i.e., equivalent to a 27% decrease relative to 2017.

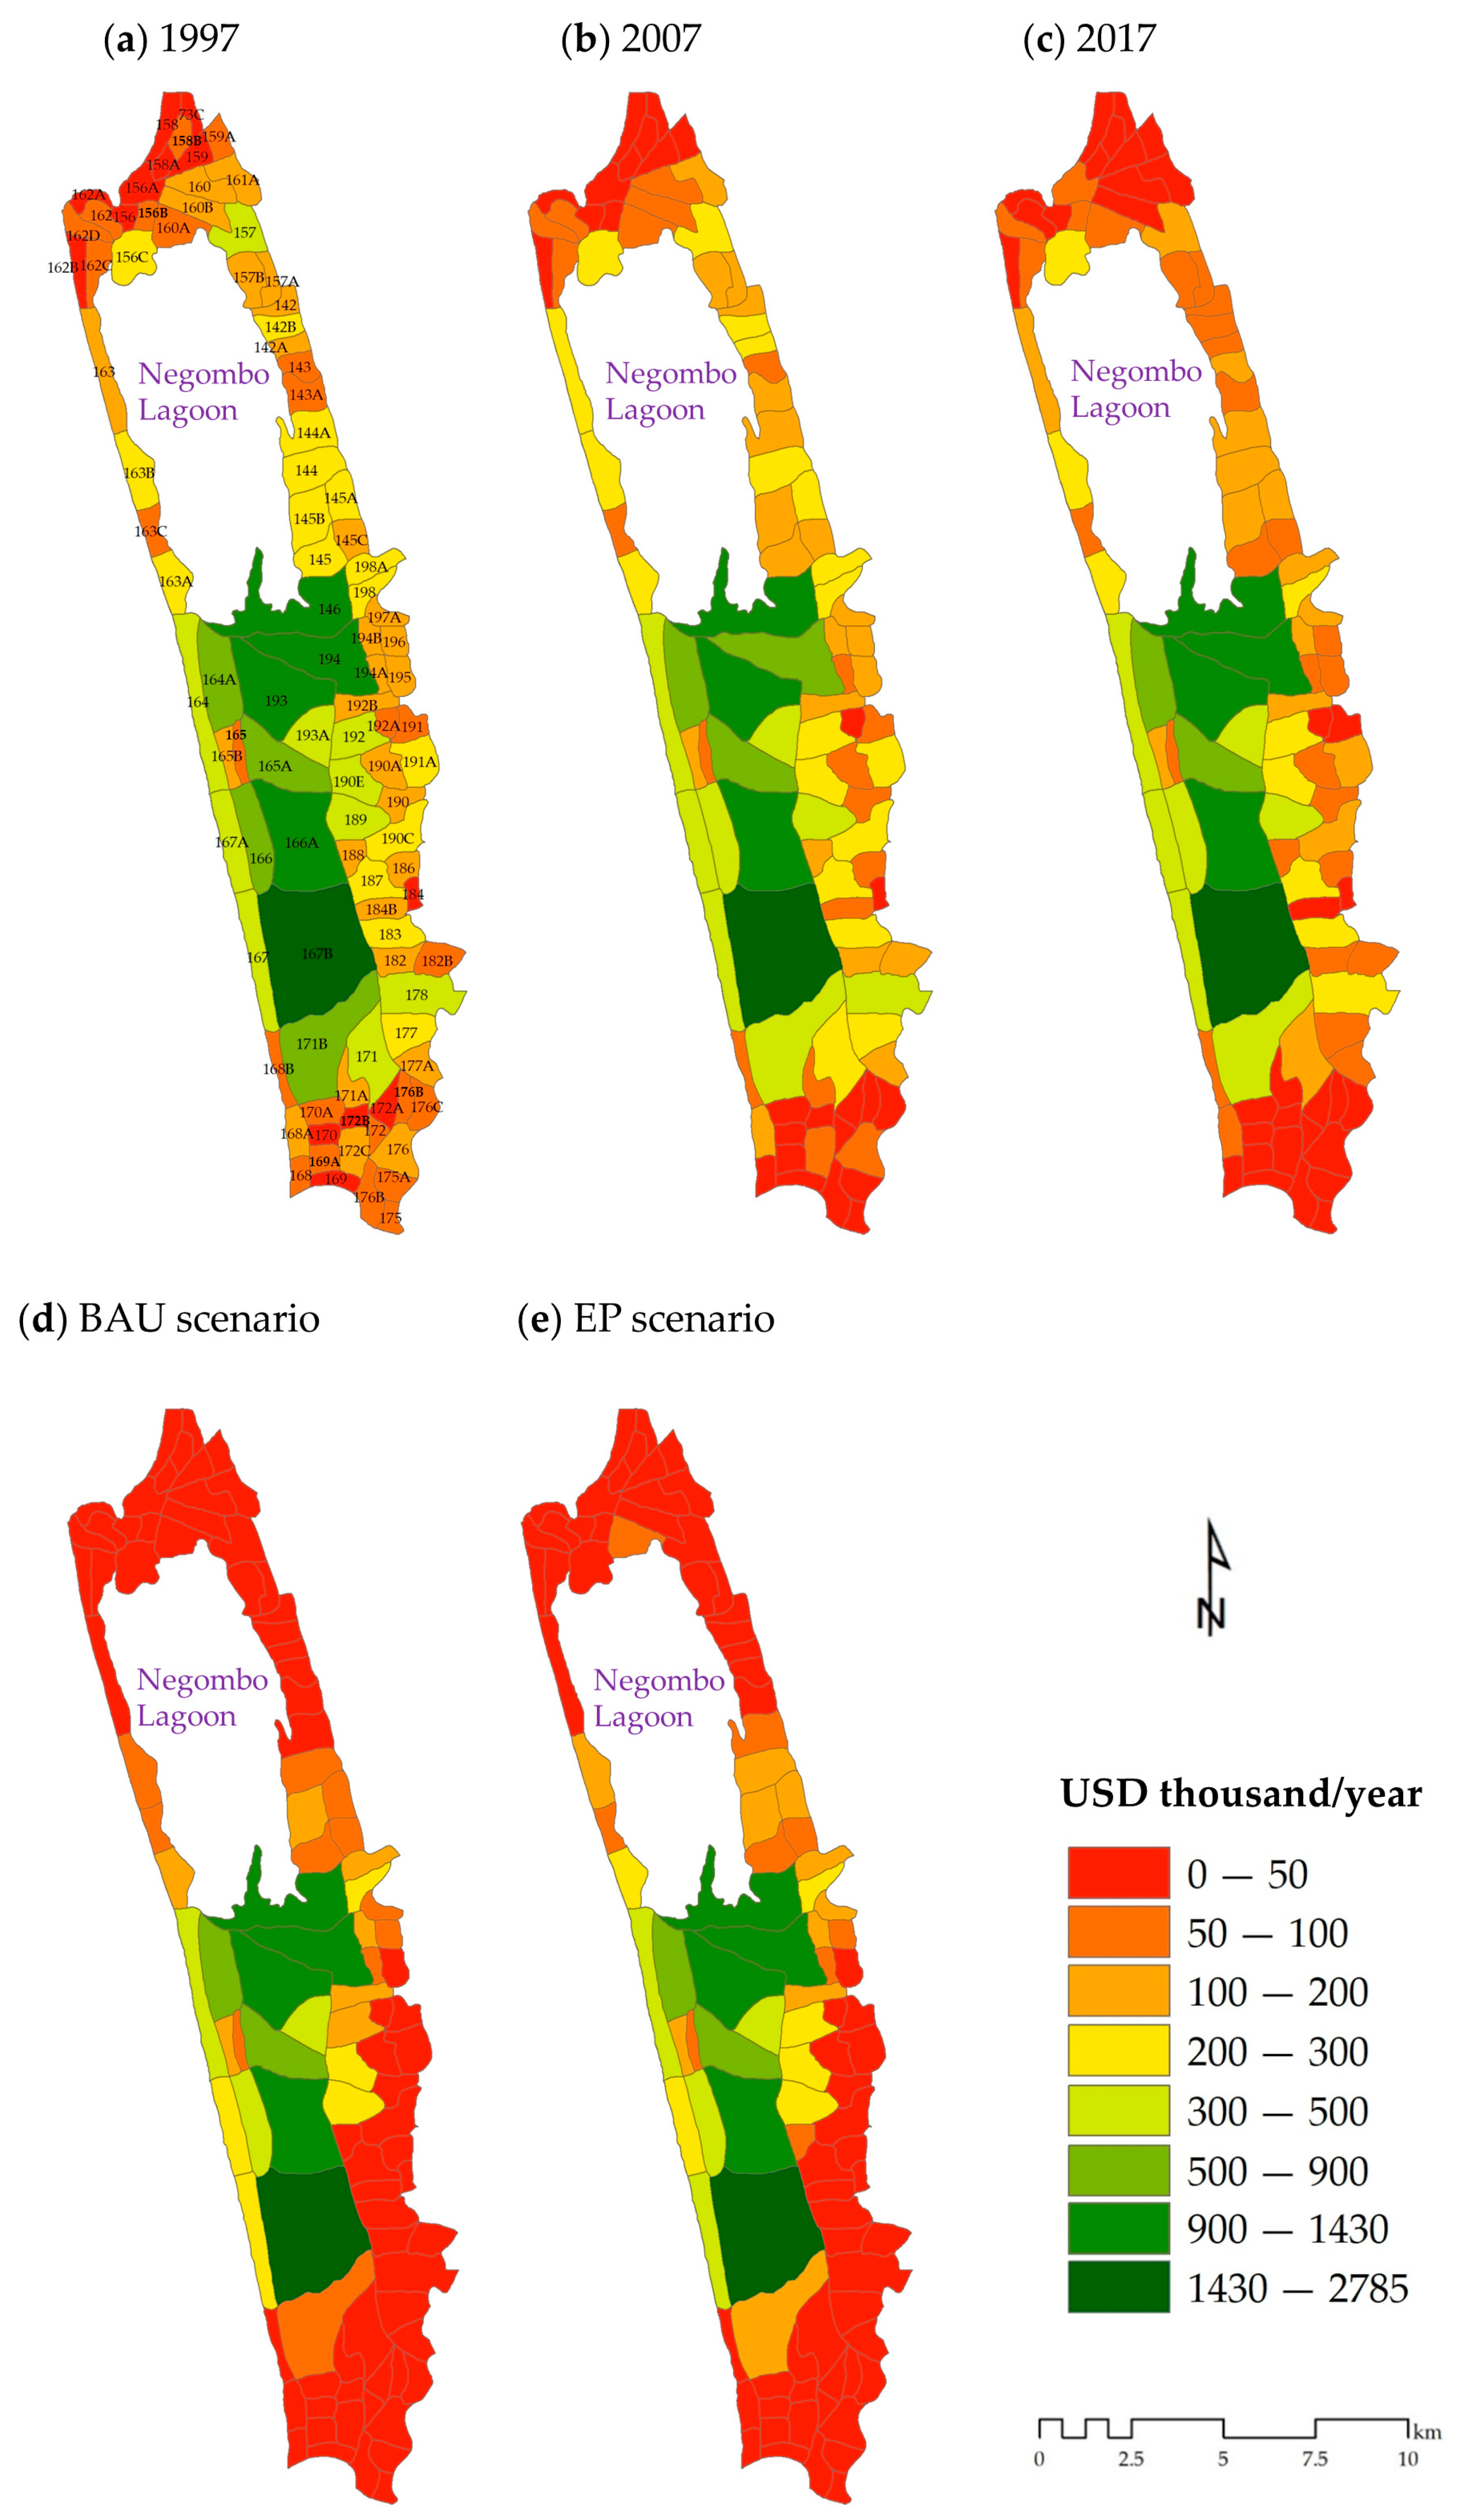
3.3. ESV and Its Changes across the GN Divisions

Figure 7 shows the spatial distribution of the GN divisions in the MMNL with their respective ESVs in three time points. Of the 99 divisions, only three had a positive change between 1997 and 2017, and these are Katunayaka North (143), Munnakkarai North (156A), and Siriwardana Pedesa (156C) (Figure 7, Table A1). The top five ESV-losing divisions over the past 20 years were Kerawalapitiya (171), Pattiyawala (167B), Ambalammulla (146), Bolawalana (157), and Mahabage (178). In both scenarios (BAU and EP), the projected top five ESV-losing divisions were Pattiyawala (167B), Balagala (171B), Kunjawatta (166A), Siriwardana Pedesa (156C), and Mahabage (178). Overall, this GN division-level ESV monitoring can help in landscape and urban planning. For example, the projected top ESV-losing divisions should be given particular attention.

3.4. LUC Change Model Validation

Our LUC change modeling focused on assessing the impacts of urbanization as proxied by settlement expansion on the natural landscape and ecosystem services of the MMNL. Two transitions were considered, namely marshland to settlement and mangrove to settlement, with the FoM being used to validate the LUC change modeling results (Section 2.3.1). The validation results revealed that the marshland to settlement transition had an FoM of 45.4%, whereas the mangrove to settlement transition had 29.5%. These FoM values are within the range of FoM values reported in other LUC change modeling studies. For example, in their LUC change modeling in connection with ecosystem services, Estoque and Murayama [18] recorded an FoM of 43%. In their LUC change modeling in the context of flooding, Johnson et al. [44] had an FoM of 20%. In an earlier seminal review of FoM applications in the validation of LUC change modeling studies, Pontius et al. [38] reported an FoM value range of 1–59%.

4. Discussion

The MMNL is among the 12 priority wetlands in Sri Lanka. The presence of two protected areas within the MMNL (Figure 2) is a direct manifestation of its ecological significance. However, our findings indicate that the sustainability of the MMNL is now in jeopardy; hence, urgent action has to be taken, landscape and urban planning wise.
In the early 2000s, in a seminal study that identified and quantified the ecosystem services of the MMNL, it was reported that the area had been experiencing intense and growing pressure from urbanization [11]. It had been observed that (i) wetland resources had been harvested at high and often unsustainable levels; (ii) lands were being rapidly reclaimed and modified for agricultural, commercial, and residential purposes; and (iii) heavy loads of industrial and domestic wastes were being discharged untreated into the MMNL. With all of these happening, the said study concluded that the MMNL has seriously degraded over time.
Nearly two decades have passed since the conduct of the said study, but the MMNL’s curve of continuous ecological degradation has not been flattened out; instead, the degradation of this valuable urban wetland ecosystem has continued as indicated by our findings. For example, between 2007 and 2017, the MMNL lost another 1002 ha of marshland and 265 ha of mangrove (Figure 5). Between 1997 and 2007, these values were 182 ha and 849 ha, respectively. By contrast, another 1301 ha of natural cover were converted into settlement between 2007 and 2017. This value was even higher than during the 1997–2007 period (1072 ha). Consequently, the ESV of the MMNL has decreased by USD 8.96 million/year over the past 20 years (USD 4.01 million/year between 1997 and 2007, and USD 4.95 million/year between 2007 and 2017) (Table 2). Flood attenuation and industrial wastewater treatments were among the ecosystems that were greatly affected.
The MMNL has long been seen as having prime potential for industrial and urban development, but at the same time, it is considered as a coastal wetland ecosystem of high biodiversity and ecological significance [9,10,11]. Our findings indicate that while urbanization has been continuing at an unprecedented rate, the conservation of this critical urban wetland ecosystem has been neglected. One important earlier observation that remains valid until today is that there seems to be little appreciation of either the economic value attached to the conservation of the MMNL or the high and far-reaching economic costs arising from its degradation [11]. Decisions regarding how land and resources should be used have been based on development initiatives that favor the modification of the wetland for short-term economic gain over long-term benefits and the conservation and sustainability of the MMNL [11]. In fact, the loss of natural cover due to settlement expansion has been observed even within the boundaries of the PAs (Figure 2 and Figure 3).
Our results have also shown that the future (2030) condition of the MMNL can be expected to be worse if the recent (2007–2017) rate and spatial pattern of urbanization (settlement expansion) continues (BAU scenario). It is because the projected ESV loss under this scenario between 2017 and 2030 (USD 6.01 million/year) (Table 4) would be greater than the ESV loss in the past decade (2007–2017, USD 4.95 million/year) (Table 2). This also means that the future of the MMNL will be much worse if the threat of marshland and mangrove loss due to urbanization grows and intensifies. Nonetheless, our study also demonstrates that under the EP scenario, while the continuous decline of the MMNL’s ESV cannot be fully stopped, the rate of loss could be slowed down (USD 4.79 million/year) (Table 4). Hence, between the two scenarios, the EP scenario is the more desirable one for the MMNL.
Our study considered only two basic scenarios, and thus, the exploration of other more complex plausible scenarios can be considered for future research. Examples of more complex scenarios include those that incorporate future trajectories of relevant socioeconomic indicators, such as population growth, changes in economic, land use, and environmental conditions, as well as future development priorities and policy targets. The shared socioeconomic pathways (SSPs) are examples of such scenarios, though they are designed for a global scale analysis [46,47,48]. The adaption of these pathways to local-level analysis could be a future research direction. Other scenarios could focus more on conservation storylines [14] or other more complex and stringent versions of our EP scenario.
Nonetheless, despite their simplicity, the inclusion of our two basic scenarios in the analysis helped us demonstrate that, for the sustainability of the MMNL, it is still possible to flatten its curve of continuous ecological degradation. In fact, the simple full protection of the PAs inside the MMNL (EP scenario) could make a significant positive contribution. Furthermore, with the use of a monitoring scheme built on a state-of-the-art geospatial technique (including GIS, remote sensing, and scenario-based land change modeling) and the concept of ecosystem services, our study also makes important methodological and empirical contributions.
In fact, the economic value of wetland goods and services is rarely factored into LUC change decisions in the MMNL [11]. Our study offers a basic template that can be adopted and improved in future studies and/or considered in landscape and urban planning for the MMNL. In general, the valuation and monitoring of ecosystem services across space and time have many potential uses, including raising of awareness and interest, national income and well-being accounts, specific policy analyses, urban and regional planning, payment for ecosystem services, full cost accounting, and common asset trusts [13,49,50]. We argue that the MMNL can benefit from landscape and urban planning that considers the concept of ecosystem services.

5. Summary and Conclusions

The MMNL is an important urban wetland ecosystem in Sri Lanka, but its sustainability is now in jeopardy due to rapid and uncontrolled urbanization. Swift action must be taken in order to save this valuable urban wetland ecosystem. In this study, to help inform sustainable landscape and urban planning, we examined the impacts of urbanization on the natural landscape and ecosystem services of the MMNL over the past 20 years (1997–2017). We also projected landscape and ESV changes by 2030 under two plausible scenarios. We found that, due to rapid urbanization (settlement expansion equivalent to 70% from 1997 to 2017), the area of the MMNL’s marshland and mangrove had decreased by 1184 ha and 1114 ha, respectively. Consequently, its ESV had decreased by USD 8.96 million/year (33%). If the current rate and spatial pattern of urbanization (2007–2017) continued in the future (BAU scenario), another 1329 ha of marshland and 213 ha of mangrove would be lost by 2030. The projected loss in ESV would be USD 6.01 million/year (34%). However, if the urbanization rate slowed down by 20% and the PAs were completely protected (EP scenario), the future loss of marshland and mangrove would only be around 1063 ha and 171 ha, respectively. The projected loss in ESV would be lower at USD 4.79 million/year (27%). Between the two scenarios, the EP scenario would be the more desirable one that should be considered by local government planners and decision-makers. The past, present, and future ESV maps of the GN divisions produced in this study can be used to identify hotspots. For future research, other more complex and stringent plausible scenarios need to be explored to help flatten the MMNL’s curve of continuous ecological degradation. Overall, the results of this study can help provide landscape and urban planners with information useful to the sustainability of the MMNL. The approach employed is also adaptable and applicable to other urban wetland ecosystems in the country and the rest of the world.

Author Contributions

D.A. conceptualized the study. D.A. and R.C.E. conducted the research, performed the analysis, and wrote the paper. Y.M. and B.M. provided research supervisions. All authors have read and agreed to the published version of the manuscript.

Funding

This work was supported by the Japan Society for the Promotion of Science (JSPS) through a Grant-in-Aid for Early-Career Scientists (20K13262) (PI: Ronald C. Estoque).

Institutional Review Board Statement

Not applicable.

Informed Consent Statement

Not applicable.

Data Availability Statement

All data generated and analyzed in this study are included in this published article.

Acknowledgments

We thank Lucy Emerton for providing some guidance regarding ecosystem service valuation. Likewise, we are thankful to the four anonymous reviewers for their constructive and insightful comments and suggestions.

Conflicts of Interest

The authors declare no conflict of interest.

Appendix A

Table A1. ESV and its changes at the GN division level. Note: The GN code is linked with Figure 7.
GN CodeGN NameESV (USD Thousand/Year)
1997200720172030 BAU2030 EPChange
2017–2030 BAU2017–2030 EP
190AWeligampitiya North167.4078.9052.601.001.0051.6051.60
191AJa-Ela279.00241.20131.400.600.60130.80130.80
165BPulluhena171.30168.20133.80133.80133.800.000.00
175Telangapatha62.2039.4012.400.000.0012.4012.40
169Hekitta57.7017.304.800.000.004.804.80
175AEvariwatta90.8047.7010.900.010.0910.8910.81
176BGalwetiya70.5025.203.900.020.063.883.84
168Palliyawatta South64.1032.7034.100.010.0834.0834.02
169AKurunduhena72.7042.008.100.010.008.098.09
172CNayakakanda South136.6075.8029.200.000.0029.2029.20
170Thimbirigasyaya49.2026.501.300.000.001.301.30
176Wattala140.0071.2013.100.000.0013.1013.10
172Hendala South60.9011.607.100.000.007.107.10
168APalliyawatta North154.70127.6086.600.000.0086.6086.60
172BNayakakanda North41.7029.509.000.000.009.009.00
170AElakanda76.8035.006.400.000.006.406.40
176CWelikadamulla103.4043.907.800.000.007.807.80
172AHendala North50.0019.609.100.000.009.109.10
176AMabola60.9035.1018.200.000.0018.2018.20
171AMatagoda134.3064.5035.100.020.0035.0835.09
177AKerangapokuna151.20129.9084.100.000.9084.1083.20
168BDikovita115.60100.0083.2024.5025.6058.7057.60
177Mattumagala244.20214.9060.203.003.0057.2057.20
171Kerawalapitiya500.10243.80136.5016.2016.20120.30120.30
178Mahabage445.60391.90224.6029.5029.50195.10195.10
171BBalagala607.50468.60412.1054.60104.20357.50307.90
182Welisara194.60146.7083.6029.3029.3054.3054.30
182BElehiwatta118.50131.7058.800.000.0058.8058.80
183Nagoda321.70238.30166.8027.7027.70139.10139.10
184BUswatta153.0086.4039.501.201.9038.3037.60
167Uswetakeiyawa391.80397.40314.90245.80280.5069.1034.40
167BPattiyawala2785.402548.702493.101916.502278.10576.60215.00
184Kandana West28.4020.904.300.000.004.304.30
187Nedurupitiya316.70245.40166.6017.1017.10149.50149.50
186Rilavulla127.10111.4042.703.503.5039.2039.20
188Kalaeliya171.00142.8094.7019.0038.4075.7056.30
190CKapuwatta302.70233.90118.004.104.10113.90113.90
189Wewala428.10368.10297.90183.30224.90114.6073.00
167AParanambalama407.20371.30324.40174.40234.40150.0090.00
190Weligampitiya South153.9080.7055.201.101.1054.1054.10
166Nugape594.10541.90448.80439.30448.809.500.00
166AKunjawatta1658.501529.001458.801139.901198.00318.90260.80
190EIndivitiya383.40263.40255.90170.70211.2085.2044.70
165Bopitiya102.7078.0047.5047.5047.500.000.00
165ABopitiyathuduwa887.70780.10796.20703.00708.3093.2087.90
192Thudella West379.30288.10209.60116.30176.9093.3032.70
192AThudella South65.4039.0014.900.000.0014.9014.90
191Kanuwana88.6076.7014.300.000.0014.3014.30
193ADelathura East462.40334.80326.60326.60326.600.000.00
192BThudella North194.70178.60127.20105.40111.2021.8016.00
194ADehiyagatha South123.30105.9093.6055.8085.9037.807.70
195Kudahakapola South163.40119.4063.804.1018.2059.7045.60
193Delathura West1453.001415.201368.501358.501368.5010.000.00
196Kudahakapola North167.50137.0097.8054.8074.4043.0023.40
164AMaha Pamunugama837.30839.30752.60736.10736.1016.5016.50
194Dandugama1090.30952.301076.70896.30893.40180.40183.30
194BDehiyagatha North158.60147.90120.10120.10120.100.000.00
164Pamunugama532.00521.40464.90460.00464.104.900.80
197AUdammita South159.50156.10109.0094.60107.9014.401.10
198Alawathupitiya227.40224.20205.20196.80205.208.400.00
163AKepungoda218.00289.90188.00140.30181.9047.706.10
198ADambaduraya285.30259.10160.50160.50160.500.000.00
146Ambalammulla1425.801263.201159.501079.401159.5080.100.00
145Bandarawatta West308.80169.5092.9091.9091.801.001.10
145CBandarawatta East167.50175.2089.9085.1089.904.800.00
163CSettappaduwa102.90109.8073.1048.4048.4024.7024.70
145BMookalangamuwa West305.80177.70122.00120.10122.001.900.00
145AMookalangamuwa East273.90212.90137.4072.80131.5064.605.90
144Liyanagemulla South244.80200.60134.1070.50108.5063.6025.60
163BDungalpitiya258.10258.70172.1058.60104.90113.5067.20
144ALiyanagemulla North293.60189.30127.7034.6050.4093.1077.30
143AKatunayaka South81.20140.4063.200.000.9063.2062.30
143Katunayaka North60.8082.50132.100.000.00132.09132.09
142AKurana Katunayaka South213.20215.5058.400.000.0058.4058.40
142BKurana Katunayaka Central265.70256.5080.200.000.0080.1980.19
163Thalahena179.30218.50111.600.010.02111.58111.57
142Kurana Katunayaka North133.60145.8090.300.000.0090.3090.30
157BKurana West196.90150.7045.300.010.0245.2845.27
157AKurana East133.10135.5075.500.090.0275.4175.48
162CPitipana Southeast107.60110.0049.900.000.0049.9049.90
162BPitipana South -West54.4054.008.900.000.008.908.90
156CSiriwardana Pedesa233.60221.10240.500.000.00240.50240.50
156Munnakkarai18.302.0010.500.100.0010.4910.49
160AThaladoowa82.8085.3070.300.0042.8070.2927.50
162DPitipana Central99.7094.3077.300.000.0077.3077.30
157Bolawalana376.00299.30147.000.000.30147.00146.70
156BMunnakkarai East61.0048.1058.900.0026.4058.9032.50
162Pitipana North108.00102.8031.500.000.0031.5031.50
162ADoowa33.7039.1029.100.050.0129.0529.09
160BUdayarthoppuwa South161.4089.0012.400.000.3012.4012.10
160Udayarthoppuwa122.5071.901.200.000.301.200.90
156AMunnakkarai North32.3054.6071.200.0011.2071.2060.00
161AAngurukaramulla209.30124.603.900.000.003.903.90
158AWella Weediya South10.709.601.200.000.001.201.20
159Periyamulla47.3029.206.700.000.006.706.70
158Wella Weediya12.5012.305.000.000.005.005.00
73CKudapaduwa South45.2038.006.200.000.006.206.20
158BWella Weediya East63.7029.900.200.000.000.200.20
159AHunupitiya74.7028.702.000.000.002.002.00

References

  1. Sinclair, M.; Vishnu Sagar, M.K.; Knudsen, C.; Sabu, J.; Ghermandi, A. Economic appraisal of ecosystem services and restoration scenarios in a tropical coastal Ramsar wetland in India. Ecosyst. Serv. 2021, 47, 101236. [Google Scholar] [CrossRef]
  2. Ghermandi, A.; Sheela, A.M.; Justus, J. Integrating similarity analysis and ecosystem service value transfer: Results from a tropical coastal wetland in India. Ecosyst. Serv. 2016, 22, 73–82. [Google Scholar] [CrossRef]
  3. Sustainable Development Goals. Available online: https://sdgs.un.org/goals (accessed on 23 September 2021).
  4. Assefa, W.W.; Eneyew, B.G.; Wondie, A. The impacts of land-use and land-cover change on wetland ecosystem service values in peri-urban and urban area of Bahir Dar City, Upper Blue Nile Basin, Northwestern Ethiopia. Ecol. Process. 2021, 10, 39. [Google Scholar] [CrossRef]
  5. Huang, Q.; Zhao, X.; He, C.; Yin, D.; Meng, S. Impacts of urban expansion on wetland ecosystem services in the context of hosting the Winter Olympics: A scenario simulation in the Guanting Reservoir Basin, China. Reg. Environ. Chang. 2019, 19, 2365–2379. [Google Scholar] [CrossRef]
  6. Tong, C.; Feagin, R.A.; Lu, J.; Zhang, X.; Zhu, X.; Wang, W.; He, W. Ecosystem service values and restoration in the urban Sanyang wetland of Wenzhou, China. Ecol. Eng. 2007, 29, 249–258. [Google Scholar] [CrossRef]
  7. Kharazmi, R.; Tavili, A.; Rahdari, M.R.; Chaban, L.; Panidi, E.; Rodrigo-Comino, J. Monitoring and assessment of seasonal land cover changes using remote sensing: A 30-year (1987–2016) case study of Hamoun Wetland, Iran. Environ. Monit. Assess. 2018, 190, 1–23. [Google Scholar] [CrossRef]
  8. Wu, W.; Zhou, Y.; Tian, B. Coastal wetlands facing climate change and anthropogenic activities: A remote sensing analysis and modelling application. Ocean Coast. Manag. 2017, 138, 1–10. [Google Scholar] [CrossRef]
  9. Athukorala, D.; Estoque, R.C.; Murayama, Y.; Matsushita, B. Impacts of Urbanization on the Muthurajawela Marsh and Negombo Lagoon, Sri Lanka: Implications for landscape planning towards a sustainable urban wetland ecosystem. Remote Sens. 2021, 13, 316. [Google Scholar] [CrossRef]
  10. CEA; IUCN; IWMI. National Wetland Directory of Sri Lanka; The Central Environmental Authority (CEA); The World Conservation Union (IUCN); The International Water Management Institute (IWMI): Colombo, Sri Lanka, 2006; ISBN 9558177547.
  11. Emerton, L.; Kekulandala, L.D.C.B. Assessment of the Economic Value of Muthurajawela Wetland; IUCN-Sri Lanka: Colombo, Sri Lanka, 2003; ISBN 9558177199.
  12. Subasinghe, S.; Estoque, R.; Murayama, Y. Spatiotemporal Analysis of Urban Growth Using GIS and Remote Sensing: A Case Study of the Colombo Metropolitan Area, Sri Lanka. ISPRS Int. J. Geo-Inform. 2016, 5, 197. [Google Scholar] [CrossRef] [Green Version]
  13. Estoque, R.C.; Murayama, Y. Quantifying landscape pattern and ecosystem service value changes in four rapidly urbanizing hill stations of Southeast Asia. Landsc. Ecol. 2016, 31, 1481–1507. [Google Scholar] [CrossRef]
  14. Sun, X.; Crittenden, J.C.; Li, F.; Lu, Z.; Dou, X. Urban expansion simulation and the spatio-temporal changes of ecosystem services, a case study in Atlanta Metropolitan area, USA. Sci. Total Environ. 2018, 622–623, 974–987. [Google Scholar] [CrossRef]
  15. Zhou, D.; Tian, Y.; Jiang, G. Spatio-temporal investigation of the interactive relationship between urbanization and ecosystem services: Case study of the Jingjinji urban agglomeration, China. Ecol. Indic. 2018, 95, 152–164. [Google Scholar] [CrossRef]
  16. Dai, X.; Wang, L.; Huang, C.; Fang, L.; Wang, S.; Wang, L. Spatio-temporal variations of ecosystem services in the urban agglomerations in the middle reaches of the Yangtze River, China. Ecol. Indic. 2020, 115, 106394. [Google Scholar] [CrossRef]
  17. He, Y.; Wang, W.; Chen, Y.; Yan, H. Assessing spatio-temporal patterns and driving force of ecosystem service value in the main urban area of Guangzhou. Sci. Rep. 2021, 11, 1–18. [Google Scholar] [CrossRef]
  18. Estoque, R.C.; Murayama, Y. Examining the potential impact of land use/cover changes on the ecosystem services of Baguio city, the Philippines: A scenario-based analysis. Appl. Geogr. 2012, 35, 316–326. [Google Scholar] [CrossRef]
  19. Yirsaw, E.; Wu, W.; Shi, X.; Temesgen, H.; Bekele, B. Land Use/Land Cover change modeling and the prediction of subsequent changes in ecosystem service values in a coastal area of China, the Su-Xi-Chang region. Sustainability 2017, 9, 1204. [Google Scholar] [CrossRef] [Green Version]
  20. Swetnam, R.D.; Fisher, B.; Mbilinyi, B.P.; Munishi, P.K.T.; Willcock, S.; Ricketts, T.; Mwakalila, S.; Balmford, A.; Burgess, N.D.; Marshall, A.R.; et al. Mapping socio-economic scenarios of land cover change: A GIS method to enable ecosystem service modelling. J. Environ. Manage. 2011, 92, 563–574. [Google Scholar] [CrossRef]
  21. Jayathilake, M.B.; Chandrasekara, W.U. Variation of avifaunal diversity in relation to land-use modifications around a tropical estuary, the Negombo estuary in Sri Lanka. J. Asia-Pacific Biodivers. 2015, 8, 72–82. [Google Scholar] [CrossRef] [Green Version]
  22. Bambaradeniya, C.N.B.; Ekanayake, S.P.; Kekulandala, L.D.C.B.; Samarawickrama, V.A.P.; Ratnayake, N.D.; Fernando, R.H.S.S. An Assessment of the Status of Biodiversity in the Muthurajawela Wetland Sanctuary; IUCN—The World Conservation Union, Sri Lanka Country Office: Colombo, Sri Lanka, 2002; ISBN 9558177172.
  23. Central Environment Authority, Sri Lanka. Available online: http://www.cea.lk/web/?option=com_content&view=article&layout=edit&id=1155 (accessed on 14 June 2021).
  24. Department of Meteorology, Sri Lanka. Available online: https://www.meteo.gov.lk/index.php?lang=en (accessed on 15 June 2021).
  25. Greater Colombo Economic Commision. Environmental Profile of Muthurajawela and Negombo Lagoon; Greater Colombo Economic Commision: Euroconsult, The Netherlands, 1991.
  26. DIVA-GIS, Free, Simple & Effective. Available online: https://www.diva-gis.org/ (accessed on 15 June 2021).
  27. Estoque, R.C.; Murayama, Y. Landscape pattern and ecosystem service value changes: Implications for environmental sustainability planning for the rapidly urbanizing summer capital of the Philippines. Landsc. Urban Plan. 2013, 116, 60–72. [Google Scholar] [CrossRef]
  28. Zhang, X.; Estoque, R.C.; Murayama, Y. An urban heat island study in Nanchang City, China based on land surface temperature and social-ecological variables. Sustain. Cities Soc. 2017, 32, 557–568. [Google Scholar] [CrossRef]
  29. Hou, H.; Estoque, R.C.; Murayama, Y. Spatiotemporal analysis of urban growth in three African capital cities: A grid-cell-based analysis using remote sensing data. J. African Earth Sci. 2016, 123, 381–391. [Google Scholar] [CrossRef]
  30. Eastman, J.R. TerrSet, Geospatial Monitoring and Modeling System, Manual; Clark Labs, Clark University: Worcester, MA, USA, 2016. [Google Scholar]
  31. Eastman, J.R.; Toledano, J.A. A Short Presentation of the Land Change Modeler (LCM). In Geomatic Approaches for Modeling Land Change Scenarios; Lecture Notes in Geoinformation and Cartography; Springer International Publishing AG: Cham, Switzerland, 2018; Volume 6, pp. 499–506. ISBN 9781441980731. [Google Scholar]
  32. Mas, J.F.; Kolb, M.; Paegelow, M.; Camacho Olmedo, M.T.; Houet, T. Inductive pattern-based land use/cover change models: A comparison of four software packages. Environ. Model. Softw. 2014, 51, 94–111. [Google Scholar] [CrossRef] [Green Version]
  33. Peng, K.; Jiang, W.; Deng, Y.; Liu, Y.; Wu, Z.; Chen, Z. Simulating wetland changes under different scenarios based on integrating the random forest and CLUE-S models: A case study of Wuhan Urban Agglomeration. Ecol. Indic. 2020, 117, 106671. [Google Scholar] [CrossRef]
  34. Zhang, Z.; Hu, B.; Jiang, W.; Qiu, H. Identification and scenario prediction of degree of wetland damage in Guangxi based on the CA-Markov model. Ecol. Indic. 2021, 127, 107764. [Google Scholar] [CrossRef]
  35. Ghosh, S.; Das, A. Wetland conversion risk assessment of East Kolkata Wetland: A Ramsar site using random forest and support vector machine model. J. Clean. Prod. 2020, 275, 123475. [Google Scholar] [CrossRef]
  36. Ansari, A.; Golabi, M.H. Prediction of spatial land use changes based on LCM in a GIS environment for Desert Wetlands—A case study: Meighan Wetland, Iran. Int. Soil Water Conserv. Res. 2019, 7, 64–70. [Google Scholar] [CrossRef]
  37. Estoque, R.C.; Murayama, Y. Measuring Sustainability Based Upon Various Perspectives: A Case Study of a Hill Station in Southeast Asia. Ambio 2014, 43, 943–956. [Google Scholar] [CrossRef] [Green Version]
  38. Pontius, R.G.; Boersma, W.; Castella, J.C.; Clarke, K.; Nijs, T.; Dietzel, C.; Duan, Z.; Fotsing, E.; Goldstein, N.; Kok, K.; et al. Comparing the input, output, and validation maps for several models of land change. Ann. Reg. Sci. 2008, 42, 11–37. [Google Scholar] [CrossRef] [Green Version]
  39. Costanza, R.; Kubiszewski, I.; Cork, S.; Atkins, P.W.B.W.B.; Bean, A.; Diamond, A.; Grigg, N.; Korb, W.; Logg-Scarvell, J.; Navis, R.; et al. Scenarios for Australia in 2050. J. Futur. Stud. 2015, 19, 49–76. [Google Scholar]
  40. Estoque, R.C.; Gomi, K.; Togawa, T.; Ooba, M.; Hijioka, Y.; Akiyama, C.M.; Nakamura, S.; Yoshioka, A.; Kuroda, K. Scenario-based land abandonment projections: Method, application and implications. Sci. Total Environ. 2019, 692, 903–916. [Google Scholar] [CrossRef]
  41. Kubiszewski, I.; Costanza, R.; Anderson, S.; Sutton, P. The future value of ecosystem services: Global scenarios and national implications. Ecosyst. Serv. 2017, 26, 289–301. [Google Scholar] [CrossRef]
  42. DasGupta, R.; Hashimoto, S.; Okuro, T.; Basu, M. Scenario-based land change modelling in the Indian Sundarban delta: An exploratory analysis of plausible alternative regional futures. Sustain. Sci. 2019, 14, 221–240. [Google Scholar] [CrossRef]
  43. Chen, G.; Li, X.; Liu, X.; Chen, Y.; Liang, X.; Leng, J.; Xu, X.; Liao, W.; Qiu, Y.; Wu, Q.; et al. Global projections of future urban land expansion under shared socioeconomic pathways. Nat. Commun. 2020, 11, 1–12. [Google Scholar] [CrossRef] [PubMed] [Green Version]
  44. Johnson, B.A.; Estoque, R.C.; Li, X.; Kumar, P.; Dasgupta, R.; Avtar, R.; Magcale-Macandog, D.B. High-resolution urban change modeling and flood exposure estimation at a national scale using open geospatial data: A case study of the Philippines. Comput. Environ. Urban Syst. 2021, 90, 101704. [Google Scholar] [CrossRef]
  45. Estoque, R.C.; Ooba, M.; Avitabile, V.; Hijioka, Y.; DasGupta, R.; Togawa, T.; Murayama, Y. The future of Southeast Asia’s forests. Nat. Commun. 2019, 10, 1829. [Google Scholar] [CrossRef] [Green Version]
  46. O’Neill, B.C.; Kriegler, E.; Ebi, K.L.; Kemp-Benedict, E.; Riahi, K.; Rothman, D.S.; van Ruijven, B.J.; van Vuuren, D.P.; Birkmann, J.; Kok, K.; et al. The roads ahead: Narratives for shared socioeconomic pathways describing world futures in the 21st century. Glob. Environ. Chang. 2017, 42, 169–180. [Google Scholar] [CrossRef] [Green Version]
  47. Riahi, K.; van Vuuren, D.P.; Kriegler, E.; Edmonds, J.; O’Neill, B.C.; Fujimori, S.; Bauer, N.; Calvin, K.; Dellink, R.; Fricko, O.; et al. The Shared Socioeconomic Pathways and their energy, land use, and greenhouse gas emissions implications: An overview. Glob. Environ. Chang. 2017, 42, 153–168. [Google Scholar] [CrossRef] [Green Version]
  48. Popp, A.; Calvin, K.; Fujimori, S.; Havlik, P.; Humpenöder, F.; Stehfest, E.; Bodirsky, B.L.; Dietrich, J.P.; Doelmann, J.C.; Gusti, M.; et al. Land-use futures in the shared socio-economic pathways. Glob. Environ. Chang. 2017, 42, 331–345. [Google Scholar] [CrossRef] [Green Version]
  49. Costanza, R.; de Groot, R.; Sutton, P.; van der Ploeg, S.; Anderson, S.J.; Kubiszewski, I.; Farber, S.; Turner, R.K. Changes in the global value of ecosystem services. Glob. Environ. Chang. 2014, 26, 152–158. [Google Scholar] [CrossRef]
  50. Costanza, R.; de Groot, R.; Braat, L.; Kubiszewski, I.; Fioramonti, L.; Sutton, P.; Farber, S.; Grasso, M. Twenty years of ecosystem services: How far have we come and how far do we still need to go? Ecosyst. Serv. 2017, 28, 1–16. [Google Scholar] [CrossRef]
Figure 3. LUC maps of the MMNL in 1997, 2007 and 2017.
Sustainability 13 11463 g003
Figure 4. Spatial variables used in the modeling of LUC transition potential maps: (a) distance to road, (b) distance to growth node, (c) distance to lagoon, (d) distance to protected area, (e) elevation, and (f) slope.
Sustainability 13 11463 g004
Figure 5. LUC changes in the MMNL (1997–2017).
Sustainability 13 11463 g005
Figure 6. Projected LUC changes (loss of marshland and mangrove and gain of settlement) in the MMNL under the (a) BAU and (b) EP scenarios (2017–2030).
Sustainability 13 11463 g006
Figure 7. GN divisions in the MMNL with their respective ESVs on (a) 1997, (b) 2007 and (c) 2017 under the (d) BAU and (e) EP scenarios. The numbers and letters on the 1997 map refer to the GN codes as presented in Table A1.
Sustainability 13 11463 g007
Table 1. Values of the ecosystem services considered for the MMNL’s marshland and mangrove biomes. Source of original values: Emerton and Kekulandala [11].
Ecosystem ServicesESV Coefficients (2020 USD/ha/Year)
Flood attenuation2607.43
Industrial wastewater treatment871.69
Agriculture production162.67
Support to downstream fisheries (fish breeding and nursery)107.41
Firewood42.75
Fishing (fisheries production)33.62
Leisure and recreation28.36
Domestic sewage treatment23.20
Freshwater supplies for local population20.30
Carbon sequestration4.19
Table 2. ESV changes in the MMNL.
Ecosystem ServicesUSD Million/Year
199720072017Changes
1997–2007% of 19972007–2017% of 2007
Flood attenuation17.9415.2511.94−2.69−14.99−3.31−21.70
Industrial wastewater treatment6.005.104.00−0.90−15.00−1.10−21.57
Agriculture production1.120.950.75−0.17−15.18−0.20−21.05
Support to downstream fisheries (fish breeding and nursery)0.740.630.49−0.11−14.86−0.14−22.22
Firewood0.290.250.20−0.04−13.79−0.05−20.00
Fishing (fisheries production)0.230.200.15−0.03−13.04−0.05−25.00
Leisure and recreation0.190.170.13−0.02−10.53−0.04−23.53
Domestic sewage treatment0.160.130.11−0.03−18.75−0.02−15.38
Freshwater supplies for local population0.140.120.09−0.02−14.29−0.03−25.00
Carbon sequestration0.030.030.020.000.00−0.01−33.33
Total26.8422.8317.88−4.01 −4.95
Table 3. Projected LUC changes in the MMNL under the BAU and EP scenarios (ha).
LUC Class20172030 BAU2030 EPChanges
2017–2030 BAU% of 20172017–2030 EP% of 2017
Marshland3058.471729.891995.66−1328.58−43.44−1062.81−34.75
Mangrove1522.981309.51352.07−213.48−14.02−170.91−11.22
Settlement5741.107283.166974.821542.0626.861233.7221.49
Table 4. Projected changes in the ESV of the MMNL under the BAU and EP scenarios.
Ecosystem Services2017–2030 (BAU)2017–2030 (EP)
Million USD/Year% of 2017% of Total DecreaseMillion USD/Year% of 2017% of Total Decrease
Flood attenuation−4.02−33.6766.89−3.21−26.8867.01
Industrial wastewater treatment−1.35−33.7522.46−1.08−27.0022.55
Agriculture production−0.26−34.674.33−0.21−28.004.38
Support to downstream fisheries (fish breeding and nursery)−0.16−32.652.66−0.13−26.532.71
Firewood−0.07−35.001.16−0.05−25.001.04
Fishing (fisheries production)−0.05−33.330.83−0.03−20.000.63
Leisure and recreation−0.04−30.770.67−0.03−23.080.63
Domestic sewage treatment−0.04−36.360.67−0.03−27.270.63
Freshwater supplies for local population−0.02−22.220.33−0.02−22.220.42
Carbon sequestration0.000.000.000.000.000.00
Total−6.01 100.00−4.79 100.00
Publisher’s Note: MDPI stays neutral with regard to jurisdictional claims in published maps and institutional affiliations.

