1. Introduction
The housing regime in Spain is characterised by the widespread predominance of home ownership versus renting [
1,
2,
3,
4,
5,
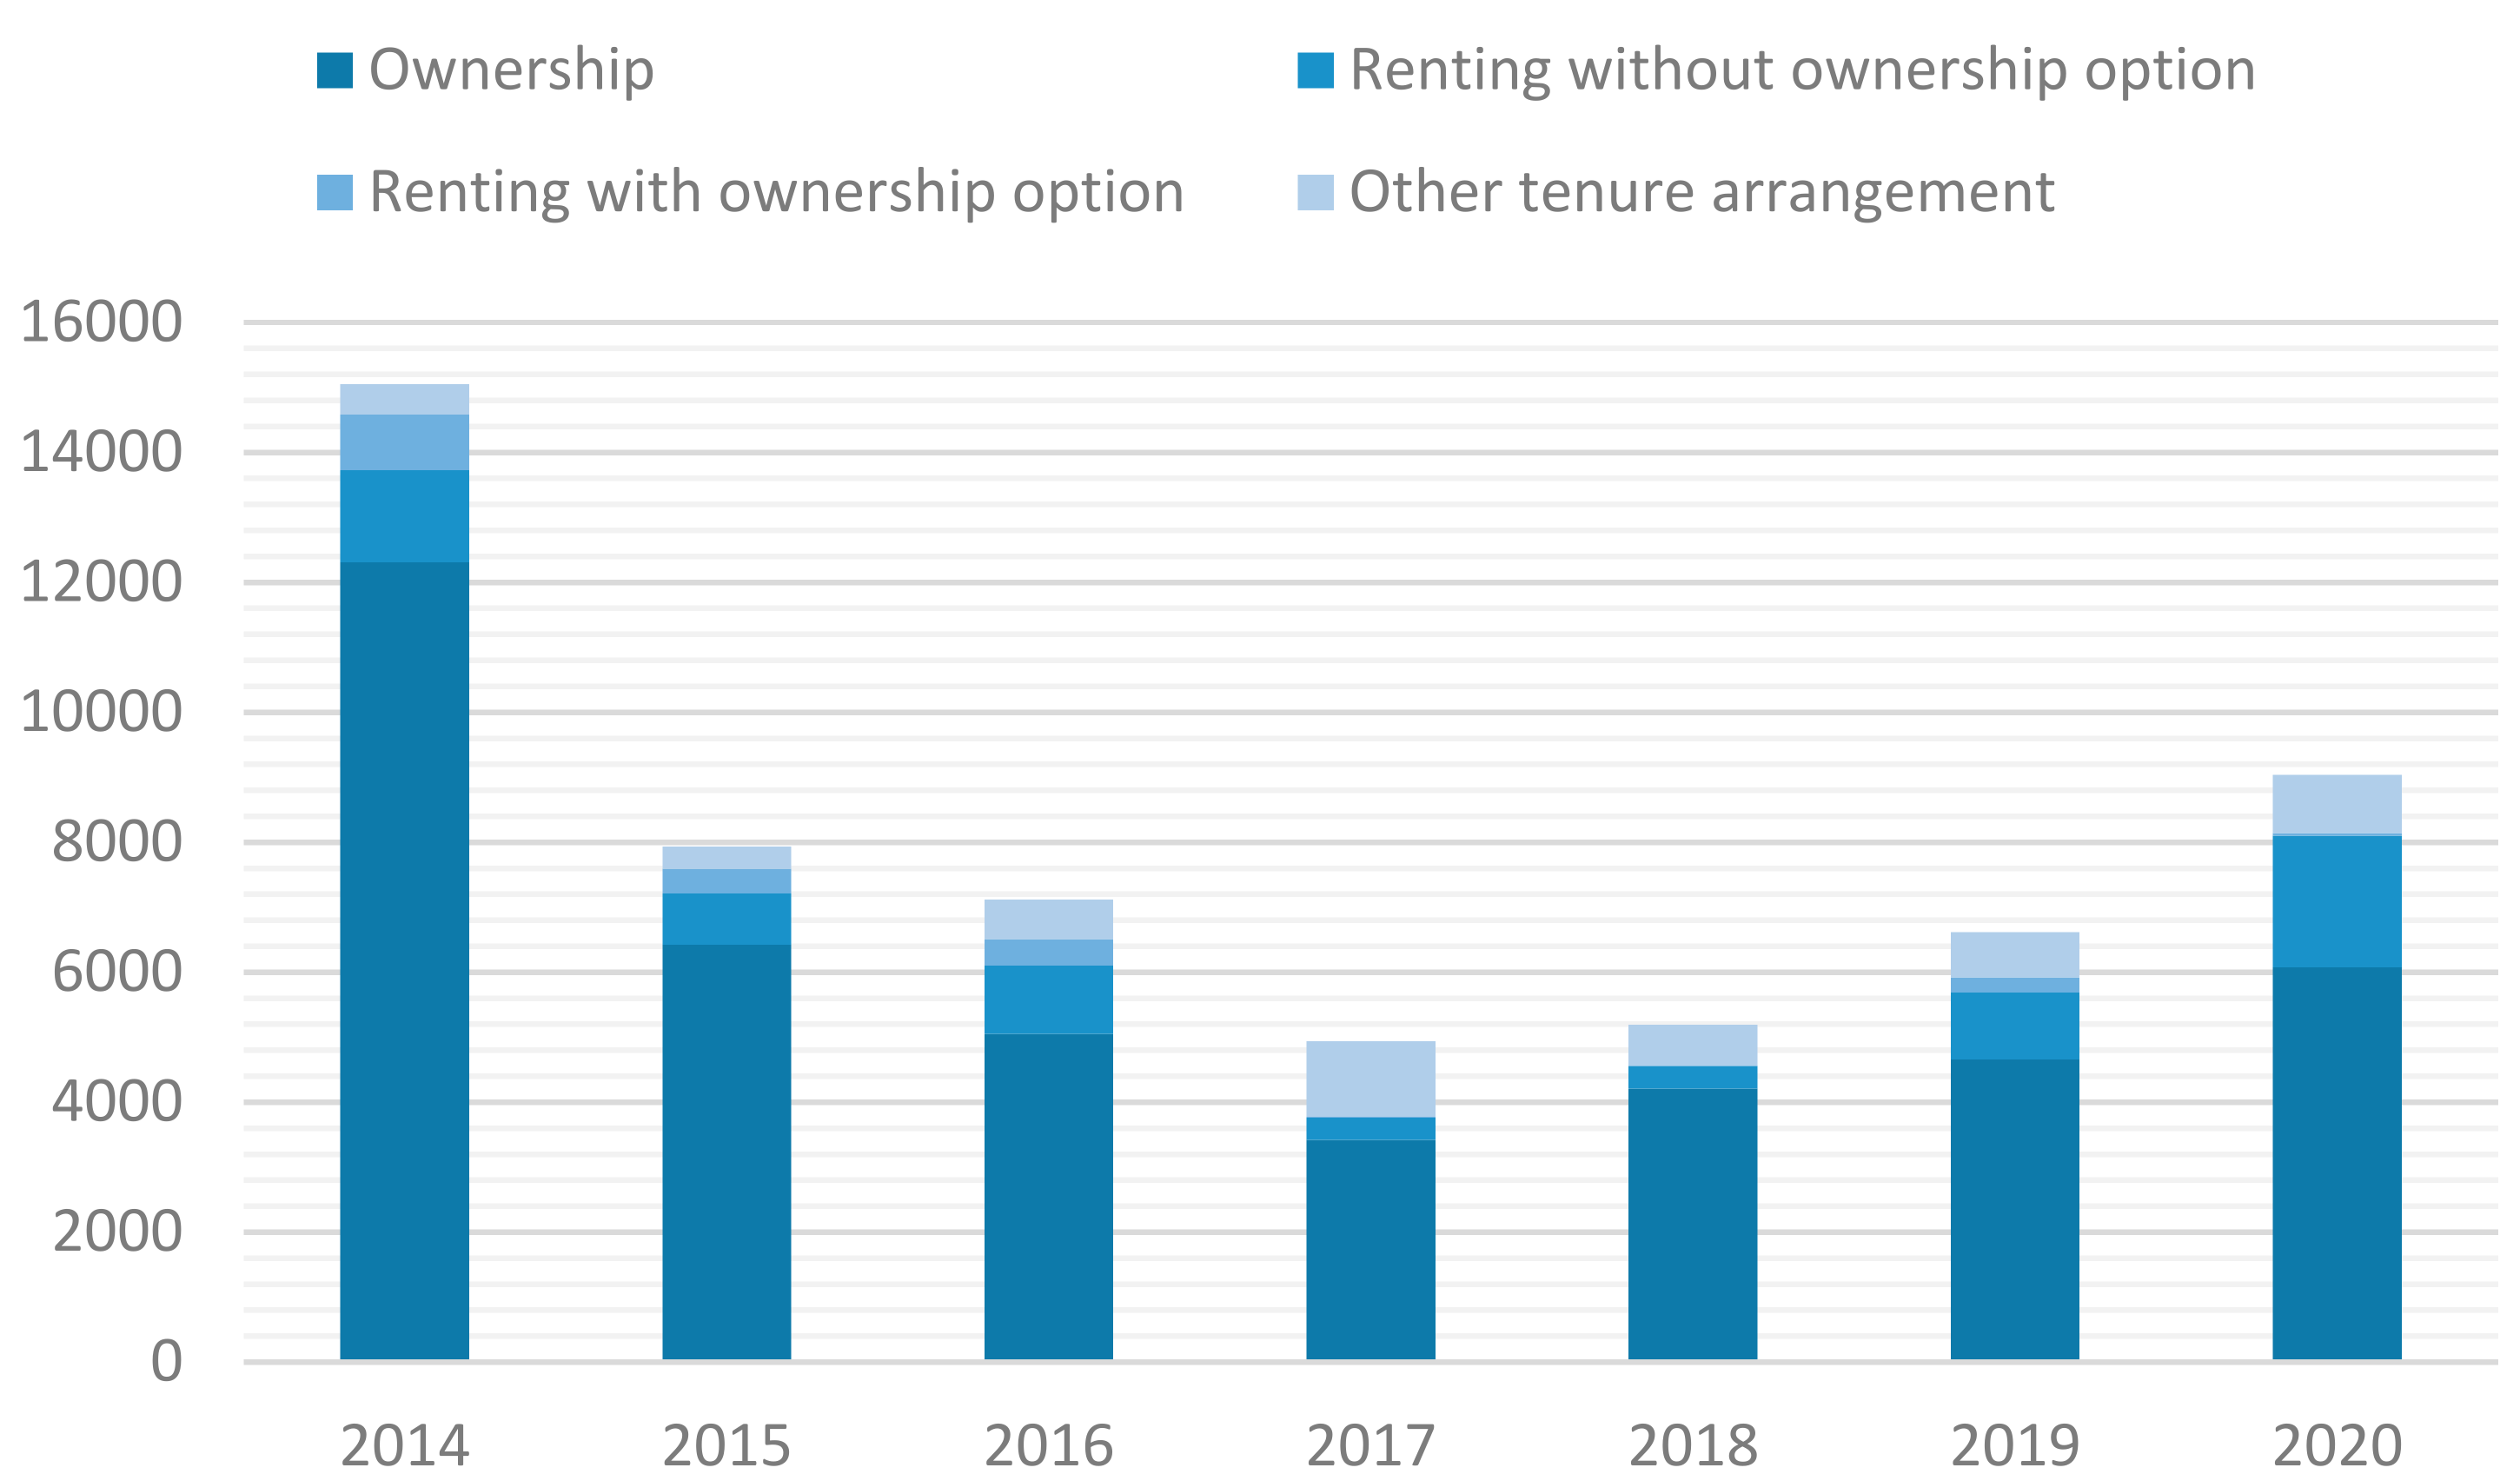
6]. Public housing provision has adopted this general trend (
Figure 1) and is mainly oriented towards promoting access to ownership through financial demand-side financial support [
3,
5]. The heterogeneity of rules on the access and allocation of social housing between regional governments and housing typologies [
7], the temporary protection of the subsidization arrangement [
4,
8], and the predominance of private promotion of new public housing [
8], are the most remarkable features that public housing policies have shown throughout a long-term trajectory.
Public housing provision can contribute to mitigate some of the negative impacts generated by the free housing market in urban areas, such as the difficulty of access to housing for certain population groups [
9,
10,
11,
12,
13] or the increase in prices in the real estate market [
14,
15], linked to gentrification processes [
16,
17,
18,
19]. However, the way public housing is located also shapes the spatial segregation patterns [
20]. The experience of several U.S. cities in the second half of the 20th century shows clear trends: public housing produced a “poverty concentration effect” in host neighbourhoods [
21,
22,
23,
24]. The argument is also plausible the other way round: it is well reported that former public housing residents relocated with vouchers end up in neighbourhoods with slightly lower poverty rates than those in public housing, suggesting a modest “poverty deconcentration effect” [
25]. It is a fact that cuts across the vast majority of cases that there is a greater presence of public housing in disadvantaged neighbourhoods. However, most of the available literature proposes that the way in which public housing is distributed in the urban environment can drive different types of socio-spatial equilibria and segregation processes, not necessarily homogeneous.
The case of Montreal illustrates how a heterogeneous spatial insertion of housing in the socio-residential environment can discourage the formation of strong segregation patterns and even favour social mixing [
27,
28,
29]. Different studies applied to this city point to the variety of ways in which public housing is inserted in the urban area and highlight that only a small proportion of public housing tenants (7%) live in residual spaces [
29].
The case of New York [
30] reveals the existence of a varied casuistry in the spatial distribution of public housing. On the one hand, the authors show the presence of significant local spatial correlations between the share of conventional public housing and extreme poverty rates in neighbouring census tracts. However, they also identify several clusters where the share of public housing correlates inversely with poverty rates, suggesting that there is no immanent relationship between these two characteristics.
Why, in some contexts, does the presence of public housing shape highly marked patterns of segregation and in others it does not? The sizes of public housing stock and projects, their spatial distribution or the degree of social heterogeneity of the beneficiary profiles may be some of the key drivers. The experience of French cities (1982–2012) shows how, while large housing projects built before the 1980s would have increased segregation, smaller projects would have favoured the “social mix”, attracting non-European immigrants to urban areas where they did not previously reside [
31].
Oslo provides a clear example of how a small and spatially dispersed social housing sector makes a minor contribution to ethnic segregation [
32]. A similar underlying logic is found in Montreal, where larger projects are spatially dispersed in neighbourhoods with varying socio-economic profiles [
28]. In Hong Kong, mechanisms to avoid the “poverty concentration effect” have focused on maintaining social heterogeneity and spatial homogeneity in the location of public housing, with successful outcomes [
33].
In Spain, with a low stock of public housing and a wide heterogeneity in the socio-economic profiles of the population eligible for public housing [
7], it is plausible to argue that its location is not one of the main factors in shaping spatial segregation patterns. The urban development that began in the 1960s, with the construction of large blocks of mass social housing had important consequences for the urban fabric in terms of social segregation, insecurity and progressive degradation of the environment and housing [
34,
35,
36,
37,
38]; but these policies were responsive to the widespread housing need at the time and are not largely representative of public housing policies today. Rather, national land legislation provides mechanisms to foster tenure heterogeneity.
In the international context, the study of public housing is approached from multiple perspectives. However, although there are some notable contributions of international scope on the spatial distribution patterns of public housing in the urban environment, this field of study has not occupied a prominent place in Spain. Analysis using explicitly geographical techniques is an issue that has not been examined much before, largely as a consequence of the scarcity of available official statistical sources. This study aims to contribute to narrowing this gap. We argue that, from a cross-sectional approach, the relationship between the spatial distribution pattern of public housing and the socio-residential characteristics of the urban environment reveals the type of impact that the location decision has had on the socio-spatial structure of the population. Thus, this paper addresses these key issues: what is the spatial distribution pattern of the location of public housing in Valencia? How does this pattern relate to socio-spatial inequalities? What factors drive this relationship? With these objectives, different techniques of spatial point pattern analysis and exploratory spatial data analysis (ESDA) are implemented.
2. Materials and Methods
2.1. Data Set
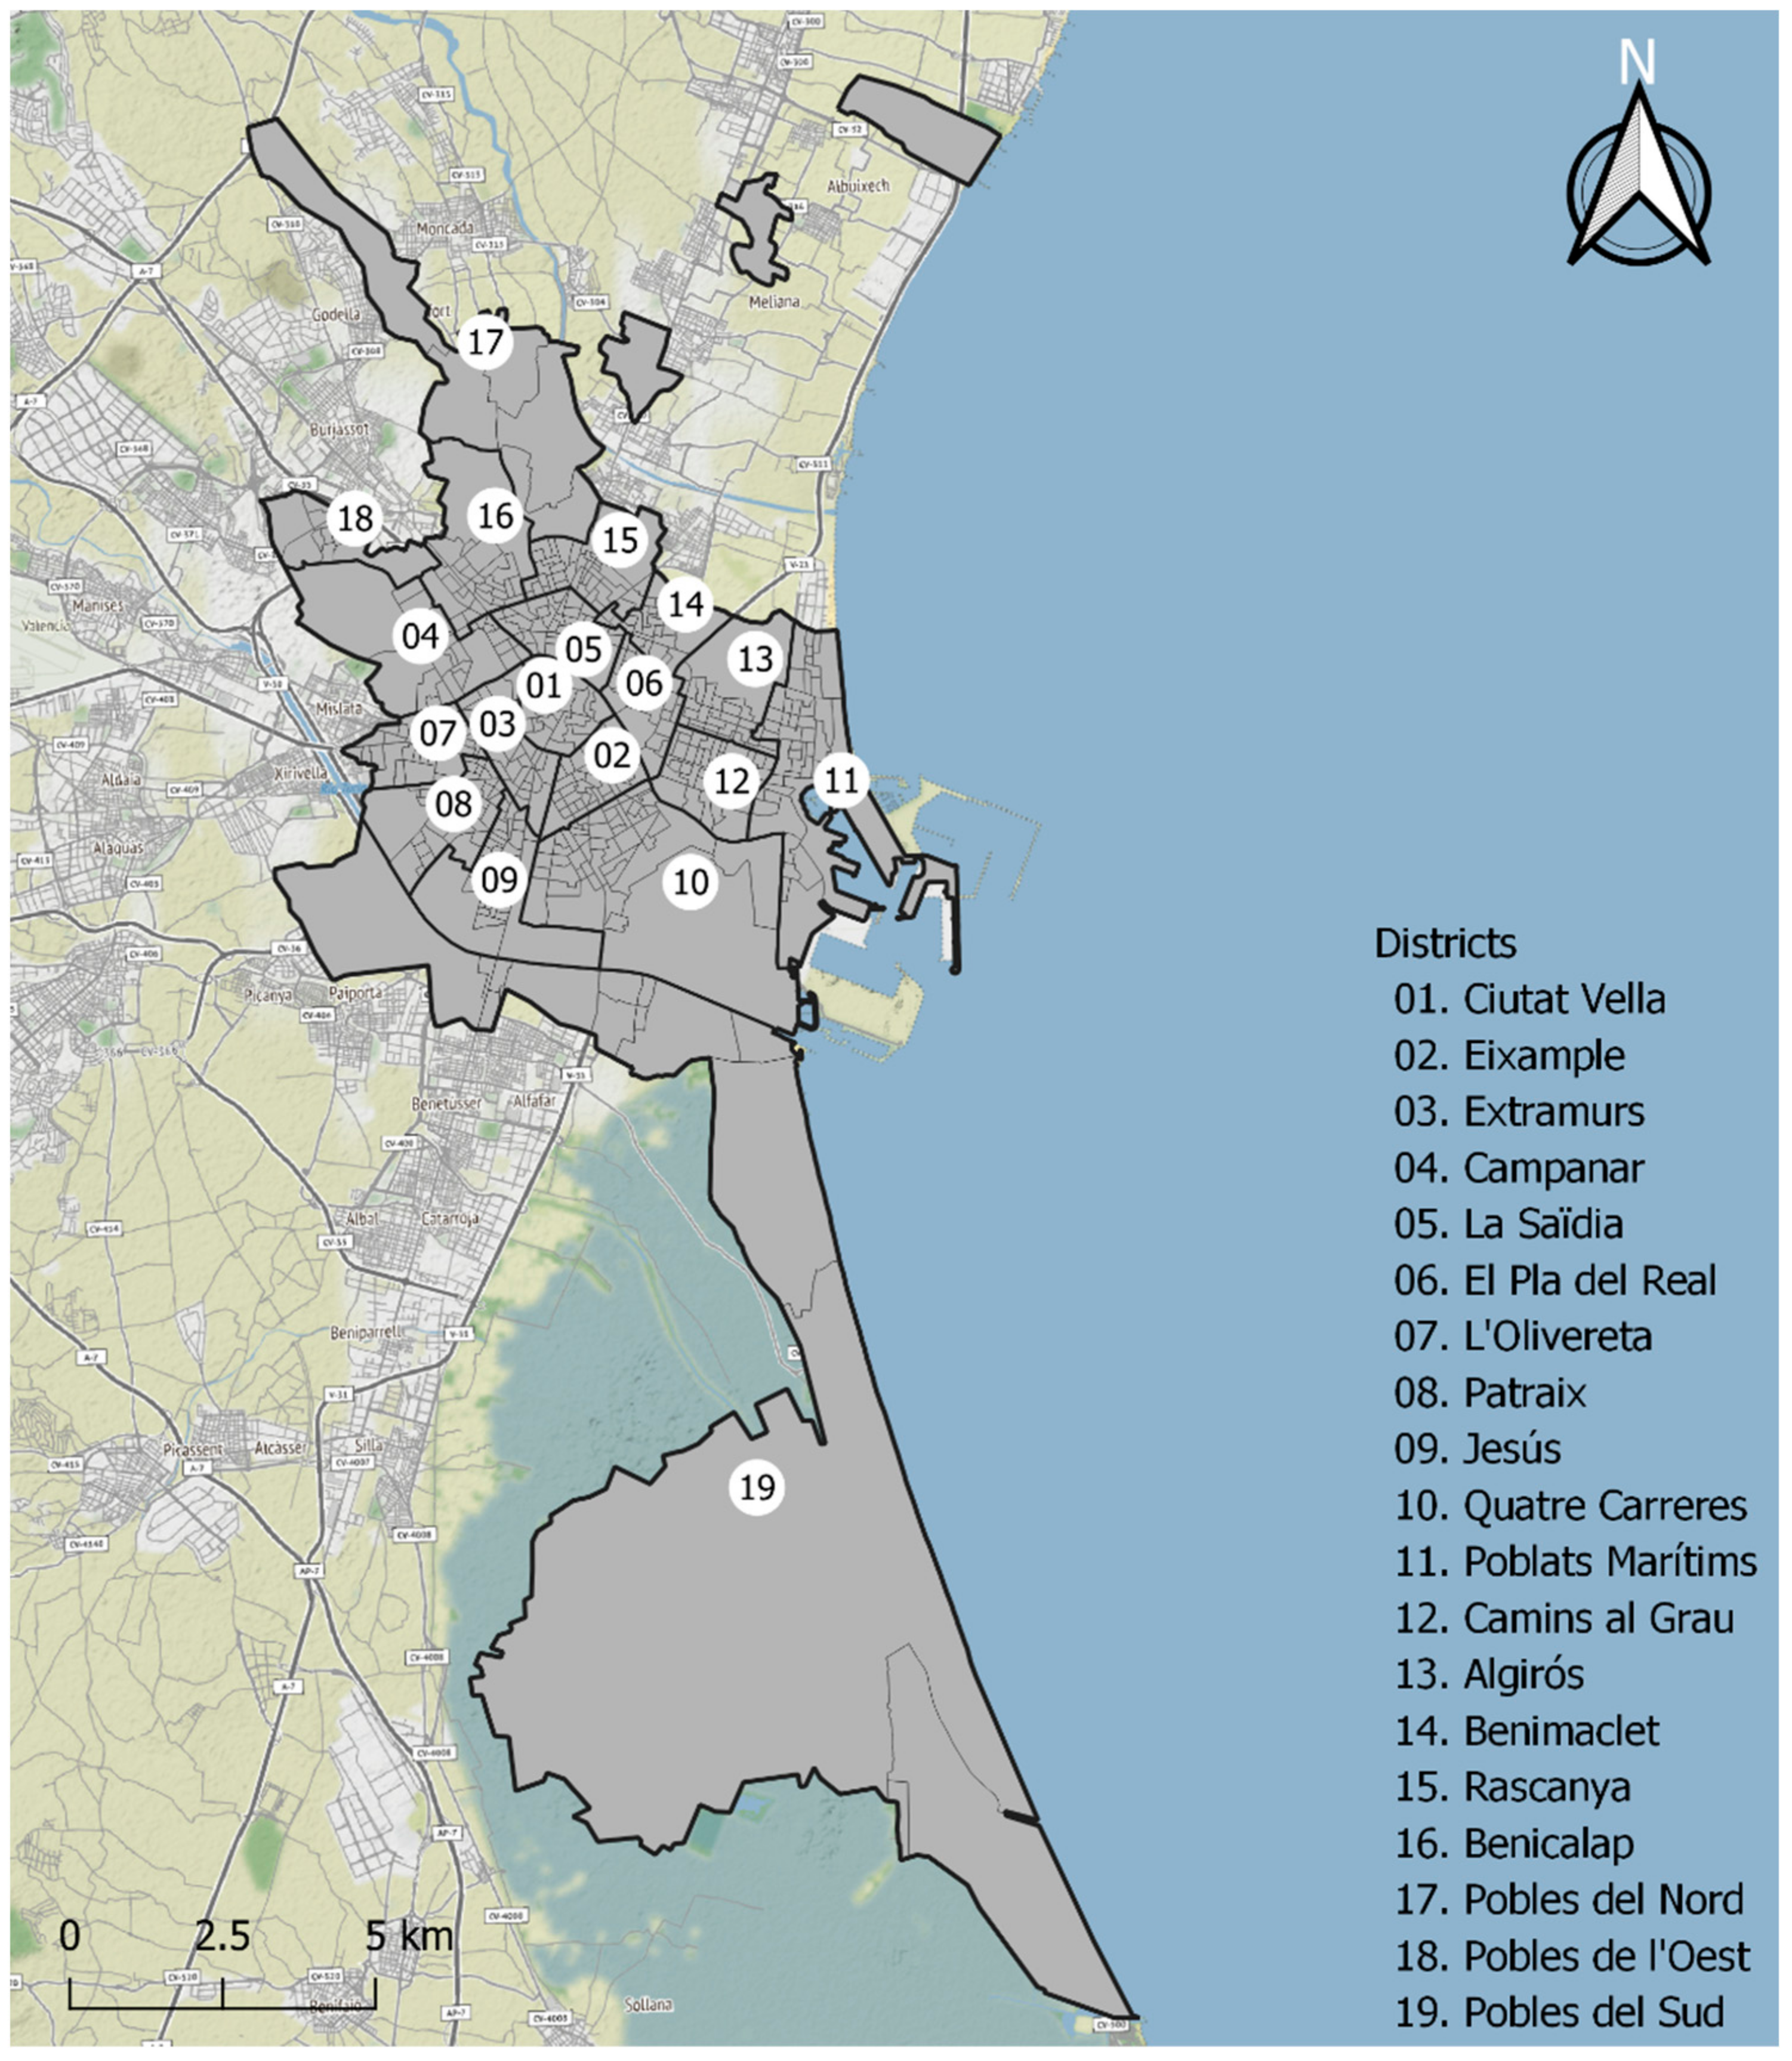
Valencia is the capital city of the Valencian community. Its urban area includes a total of 45 municipalities [
39]. In 2020, it had a population size of 800,215 inhabitants and a surface area of 134.65 km
2, being the third largest municipality in Spain in population size. At the reference period of analysis (2017), the municipality was spatially structured through 19 districts, 88 neighbourhoods (
Figure S1) and 596 census sections (
Figure 2).
From the second half of the 20th century, at the start of the developmentalist period until the present day, Valencia has undergone a considerable process of social and urban transformation. Over this period, the city has gone from having an agricultural sector with an extensive weight in the productive structure to becoming a metropolis of services and a cultural and tourist enclave with international scope [
40,
41]. This shift has been linked, since the 1990s, to several processes of tourist and commercial gentrification in declining neighbourhoods, driven by the urban planning policies of local governments [
42,
43,
44,
45].
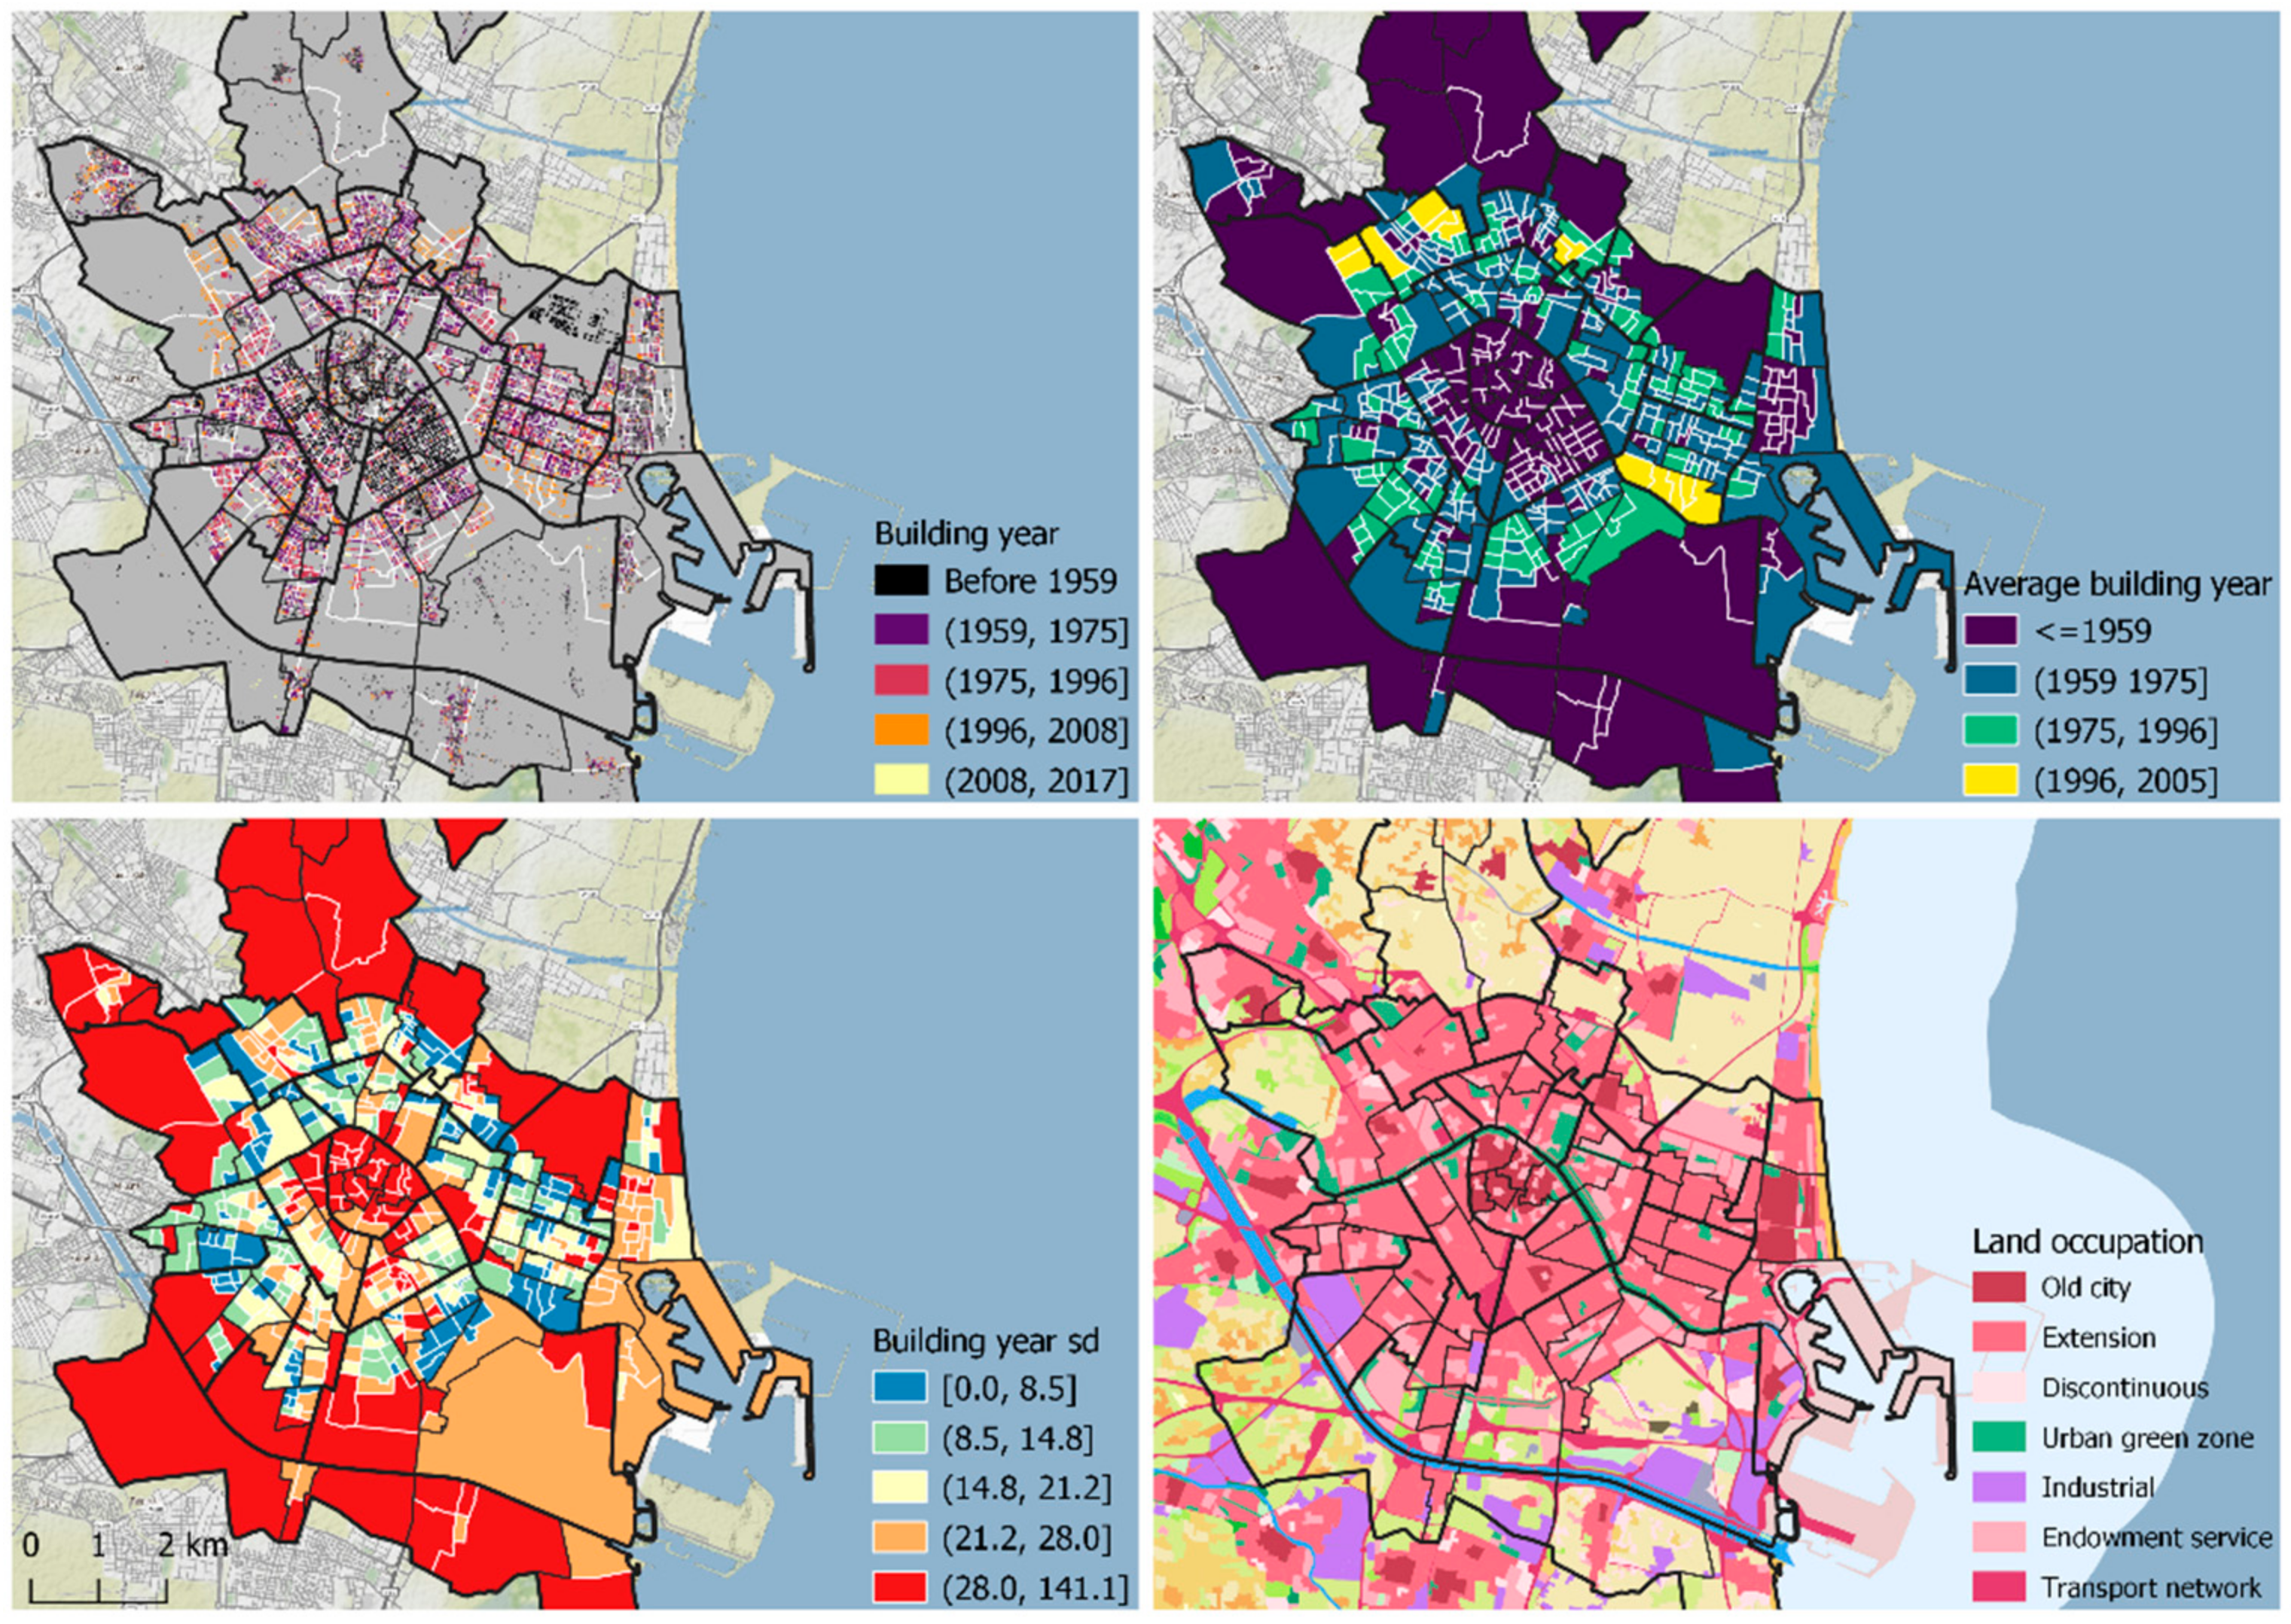
Figure 3 shows some key points of urban and residential development patterns in the city of Valencia. On the top left, functional buildings predominantly destined for residential use are represented by year of construction. On the right is the average year of construction, aggregated at census tract level. The delimitation of intervals follows the criteria established by the author [
46] in the definition of the different phases of the urbanisation process in Spain.
Below left is the map of quintiles of the standard deviation of the year of construction, also aggregated at census tract level. As can be seen, historical and older areas tend to present more segmented patterns of urban development over time than more recently developed areas, as suggested by the presence of a moderate–high negative correlation (r = −0.64, p < 0.01) between the average year of construction of residential buildings and their respective standard deviation.
The land use map (bottom right) allows for a more detailed identification of the spatio-temporal trends in urban and residential development in the city. The map is coherent with the spatial distribution of the descriptive statistics: the old city occupies a central position, together with the first urban extensions. On the periphery, a large part of the old nuclei is located, which present continuity with the urban fabric as a consequence of later developments.
2.2. Variables
In this study we use open data from public sources. The variables obtained from the processing of these data are shown in
Table 1.
A large part of the analysis developed took the census tract as the basic unit of statistical aggregation of data. The vector layer used with the census tracts corresponds to the period 2017 and was obtained from the National Statistics Institute (NSI). The data on low-income population were also obtained from the NSI and are specified at census tract level.
Data on median monthly rent were obtained from the Ministry of Transport, Mobility and Urban Agenda, and are specified for the year 2018. The vector layer, on the other hand, contains the census tracts corresponding to the year 2011, coinciding with the population and housing census, so the limits of some tracts differ with respect to the limits in 2017. To address this problem, the values of the missing census tracts were assigned to the tracts that totally or partially occupy the territory of the previous one. Similarly, the values of the new census tracts were taken from the value of the old tracts that occupied that territory.
The vector layer of Valencia City Council contained the delimitations of the plots intended for public housing, including both those with building permits and those that were built. To obtain a sample of the locations of public housing built before 2017, we intersected the vector layer with the cadastral cartography of the municipality.
The cadastral cartography contains information on all properties according to year of construction, functional status and use, among others. First of all, we removed all buildings that are not mainly used for residential purposes. Next, we excluded all properties whose year of construction ended after 2017. Finally, we filtered the properties by functional status, deleting all those in ruin or declined condition. After the screening process, we intersected the clean cadastral cartography with the vector layer of public housing, obtaining a sample of 124 functional buildings of residential use, totally or partially destined to public housing.
In Spain, the configuration of public housing blocks tends to be heterogeneous. In many cases, the buildings are entirely intended for public housing, but in others they coexist with free market tenure housing, in varying proportions. However, as a proxy for the capacity of the blocks to host public housing beneficiaries, we use cadastral information on the number of dwellings per building. In total, we refer to n = 3643 dwellings located in buildings totally or partially intended for public housing.
The software used for cartographic representation and mapping was QGIS 3.16, with base map © Stamen Terrain.
2.3. Methods
2.3.1. Spatial Autocorrelation Analysis
The socio-residential composition of the census tracts can be characterised according to the presence of a low-income population and the median monthly rent. In Valencia, 12% of the population has an income, per consumption unit, below 40% of the median. The rent for collective housing is 6 euros, while that for single-family housing is 5.5.
However, these levels may vary widely across census tracts. To assess the degree to which the relative weight of each population group is distributed following a pattern of spatial clustering, dispersion or randomness, we use Moran’s index (see seminal work [
52,
53]). This spatial autocorrelation statistic is particularly suitable for assessing the similarity of the socio-residential composition of each census tract with respect to neighbouring tracts and is more sensitive to the degree of clustering rather than to other dimensions of spatial segregation (see [
54]). The values obtained by the indicator range from −1 (maximum negative autocorrelation) to 1 (maximum positive autocorrelation), where 0 indicates the absence of autocorrelation or spatial randomness.
This autocorrelation, by contrast, is global in scope and does not provide information on the spatial heterogeneity present between territorial units. Thus, we also use the local version of this indicator: local Moran’s I [
55]. For a better interpretation, statistically significant clusters are represented in the Local Indicators of Spatial Association’s (LISA) maps. Census tract clusters with the highest value for each variable are labelled with the typology High-High; clusters with the lowest value are labelled Low-Low, and the types Low-High and High-Low indicate that the statistical association between the values of the reference tract and the neighbouring tracts is negative. Statistically non-significant results are represented in white. This family of methods has become highly popular over the last decades to study the spatial distribution patterns of a wide variety of phenomena and is also used to analyse the bivariate relationship between poverty rate and public housing share [
30].
The use of the above methods is appropriate in the case of continuous variables. However, to detect the presence of spatial autocorrelation between census tracts according to whether or not they contain public housing buildings, we employ the local join count statistic [
56], particularly designed for binary variables coded as 0 or 1. Local spatial autocorrelation is assessed in this case through the identification of clusters of neighbouring census tracts where the co-presence of public housing does not respond to a random pattern.
The mentioned techniques were implemented using the free spatial analysis software GeoDa 1.18 [
57].
2.3.2. Spatial Point Pattern Analysis
Aggregation of statistical data to a territorial unit has potential advantages for ESDA, particularly when downscaling analysis is tedious or does not add value. However, this approach has some limitations in the case of data whose main interest lies in geolocation, such as the impossibility of observing specific and disaggregated patterns within and across boundaries. The analysis of spatial points consists in the study of events location and the identification of the ways in which these locations are distributed, namely whether they follow a clustered, random or uniform pattern [
58]. In our case, the set of spatial points under analysis corresponds to the location of public housing buildings.
The intensity function (u) of the point process can be calculated non-parametrically by Kernel density estimation (KDE), obtaining for each spatial location u contained in the analysis region W (whose locations u are spatially structured as a grid) a value of the magnitude of the intensity with which public housing buildings are located, weighted by the number of dwellings. KDE makes it possible to observe local variations at a much higher level of detail than estimates based on territorial units. Although this is one of the most common techniques for the visual identification of geolocated event hotspots, its application in the analysis of the spatial distribution of public housing is not widespread. However, a case study can be cited [
59].
The second option, focused on identifying statistically significant patterns of spatial clustering, is to look for evidence of high intensity in the distribution within a circle of fixed radius, r, centred on each location, u. Under the assumption of complete spatial randomness (CSR), we hypothesise the null hypothesis that the intensity is homogeneous versus the alternative that the intensity is different inside the circle, as opposed to outside. We employ the likelihood ratio test statistic Λ(u) [
60] to obtain a test of homogeneity or heterogeneity in the spatial distribution of public housing buildings, for all locations u in the municipality. The χ
2 distribution function allowed us to identify statistically significant patterns of clustering.
We used the ‘spatstat’ package [
61,
62], embedded in R statistical software, to implement the techniques described in this section.
2.3.3. Quadrant Map Analysis
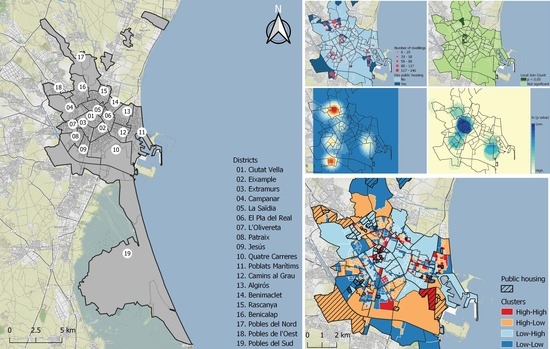
The levels of low-income population and median monthly rent are negatively correlated, albeit with low intensity (r = −0.35, p < 0.01). For this reason, we classify the sections according to the type of interaction between the two variables and represent them in a quadrant map (Figure 6).
A quadrant map is an exploratory analysis method that allows us to visualise the association of two variables in space. It separates the cases into four groups, whose boundaries can be set according to a defined criterion and maps the cases according to the group in which they fall. In this paper, we take the overall value of each variable, for the entire municipality, as a reference. In the case of rent, this corresponds to that of collective housing, as this is the predominant housing typology in general. In the labelling of the clusters, the first term corresponds to the classification of the low-income population, and the second term to the rent. Areas where high values coincide are represented in red, low values in blue and the others in light blue (Low-High) and orange (High-Low).
3. Results
3.1. The Spatial Distribution of Public Housing
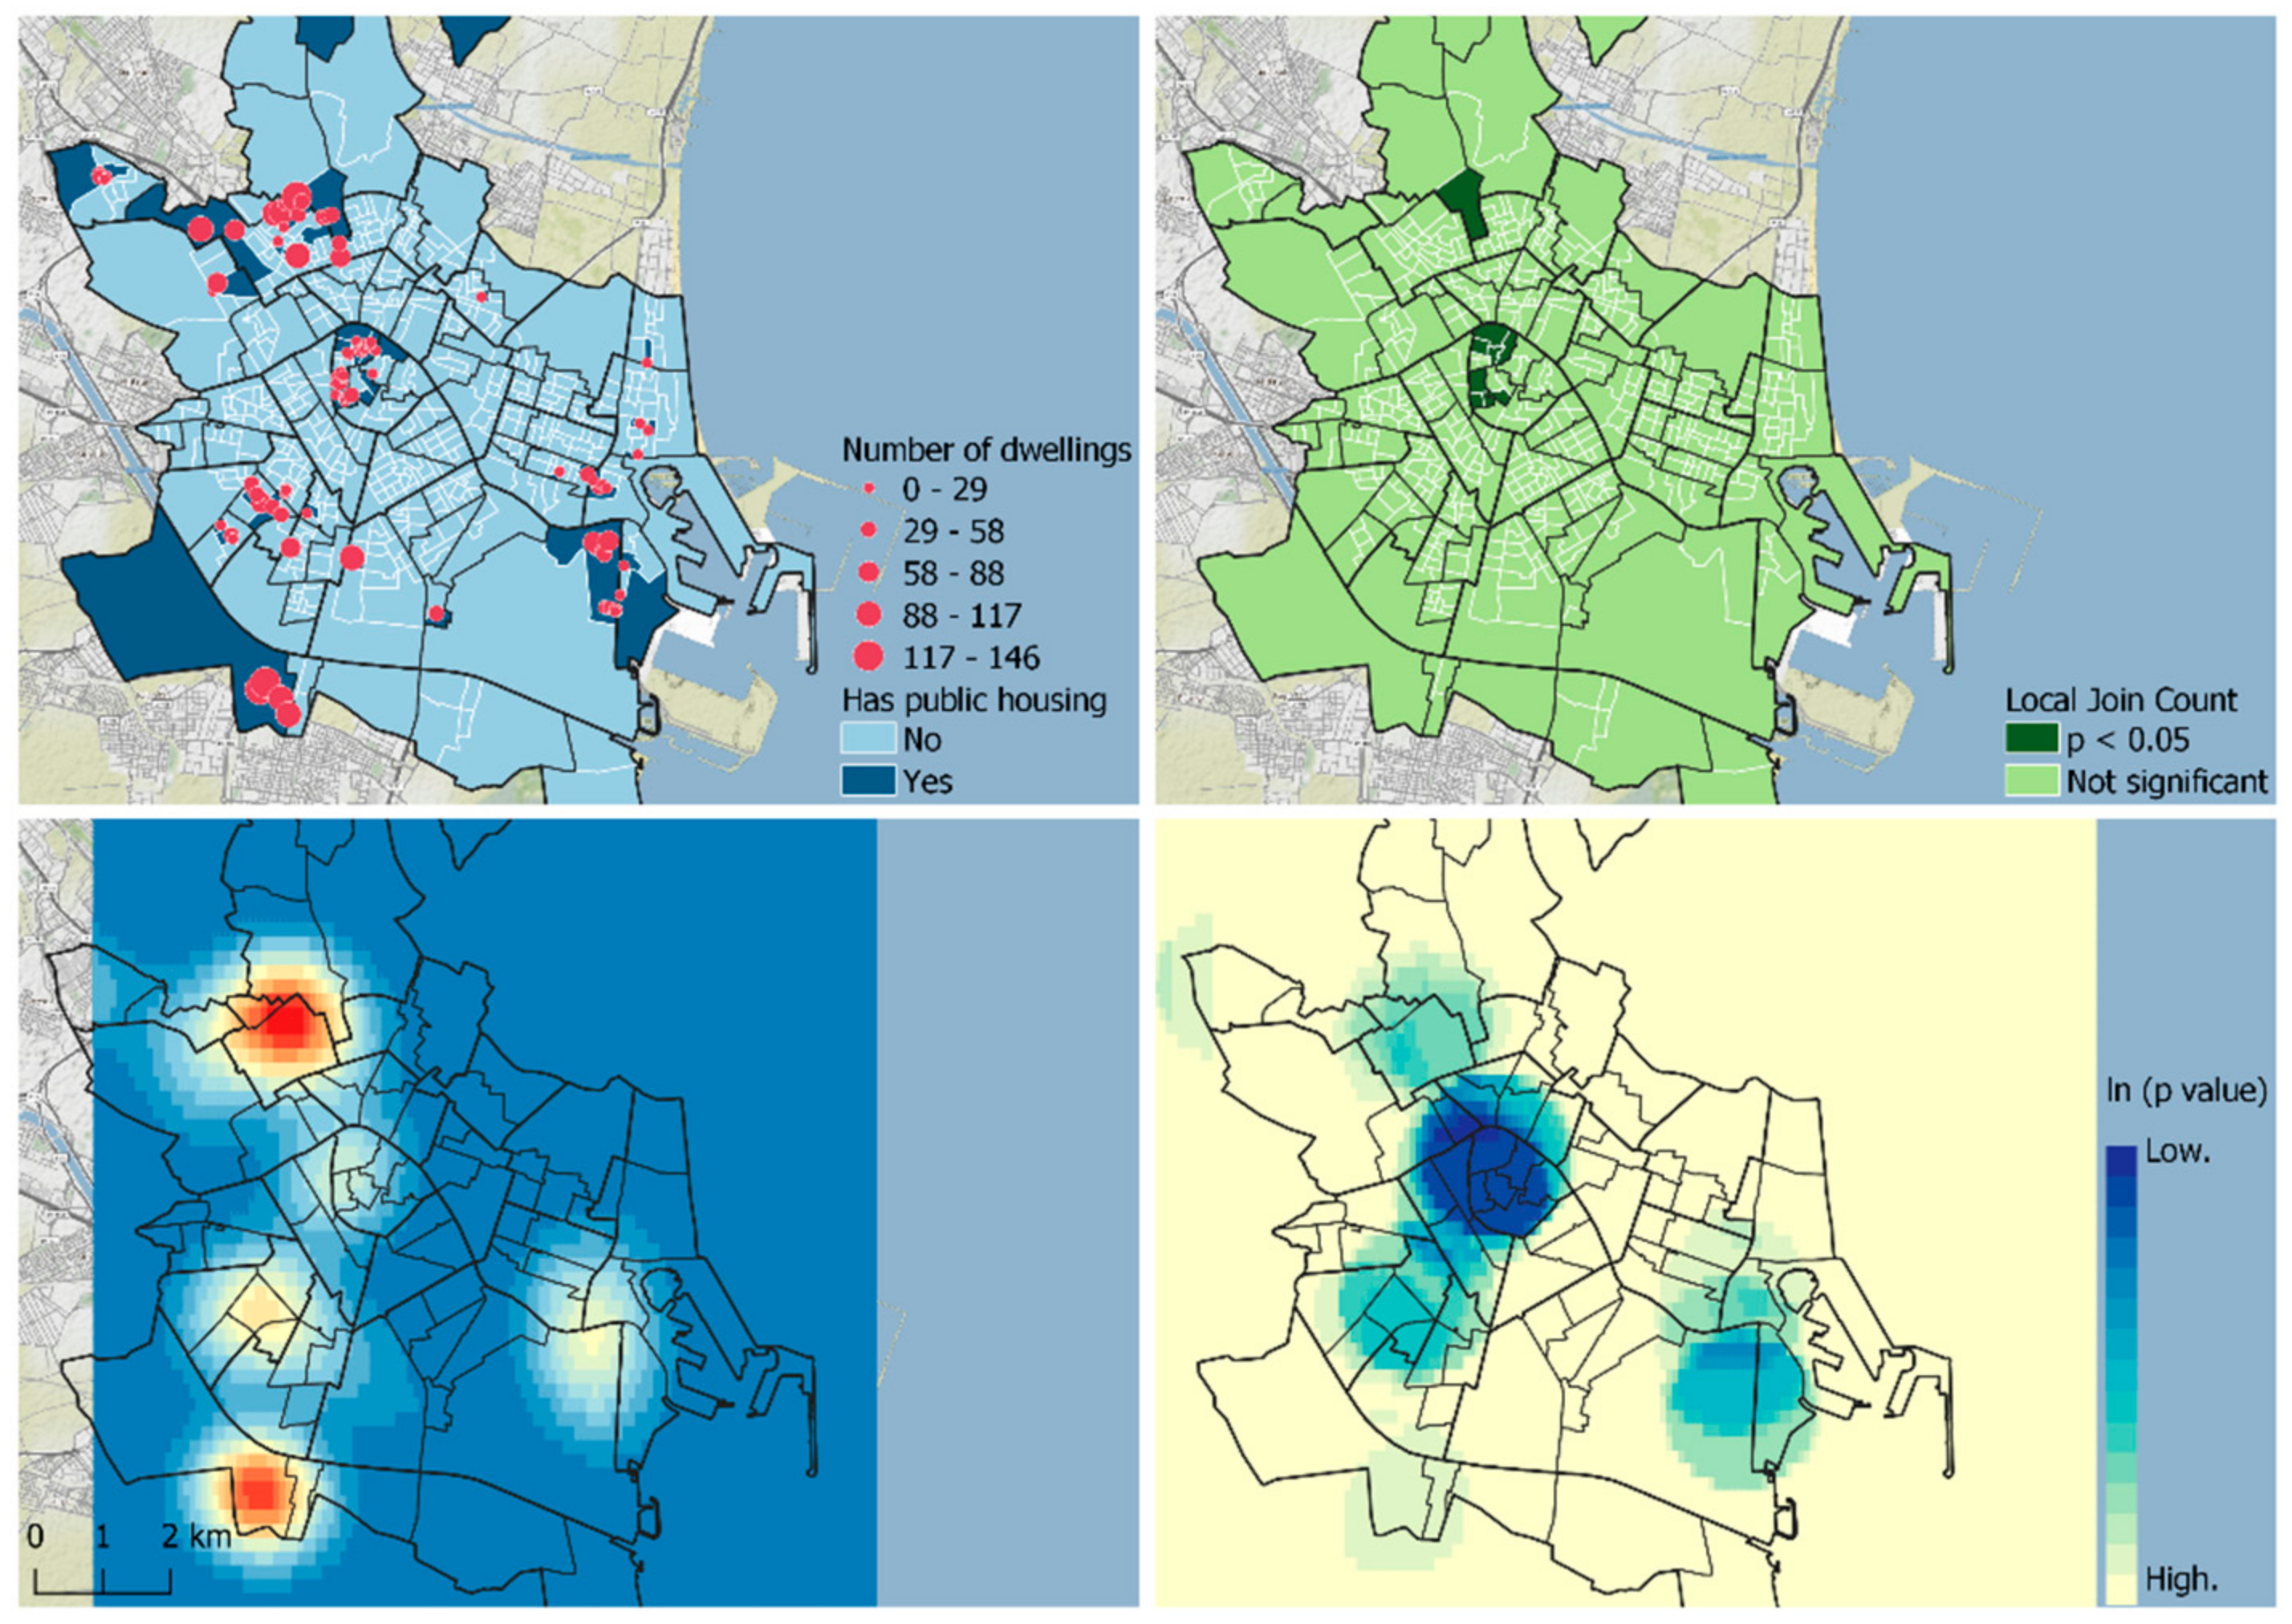
Figure 3 presents a visual summary of the main characteristics of the spatial distribution of public housing in Valencia. In total, 47 census tracts contain at least one public housing building, which represents 7.9% of the total (
Figure 3 top left). In dark green (
Figure 4 top right), we show the tracts with a pseudo
p-value < 0.05 of the local join count statistic, based on 999 permutations. In total, we identify nine tracts, of which eight are located in the Ciutat Vella district, mainly in the neighbourhoods of El Carmen (
n = 4) and El Pilar (
n = 3), and one in the neighbourhood of El Mercat. The remaining tract is located in Poble Nou (Benicalap).
A total of 38 public housing buildings (31%) are located in historic areas, according to the SIOSE classification on land occupation [
47], despite the fact that these areas only represent 9.6% of the total surface area of the residential fabric. The presence of public housing presents a positive point-biserial correlation (r
pb), although of low intensity, with respect to the standard deviation of the year of construction of residential buildings (r
pb = 0.24,
p < 0.01), while it barely correlates with the average year of construction (r
pb = −0.11,
p < 0.01). This trend may be mainly due to the high concentration of buildings in the neighbourhoods of the Ciutat Vella district. It should, however, be stated that the capacity of these buildings to host a large number of dwellings for public housing and, therefore, the beneficiary population, is limited by urban planning regulations in an area that is declared a protected historical site and is of great heritage interest.
Global Moran’s I of the percentage of public housing over total housing is 0.021, which indicates that, aggregating the data at the census tract level, the variable presents practically zero spatial autocorrelation. Alternatively, to assess the spatial distribution of public housing buildings from their geolocation, we employ two spatial point analysis techniques: Gaussian KDE and the Λ(u) statistic [
60].
Figure 4 (bottom left) presents the results of the KDE, weighted by the number of dwellings and with an isotropic standard deviation of 600 m. The colour scale ranges from dark red (indicating maximum location density) to bluish yellow (indicating lower density). Areas in blue correspond to the lower interval, where values are close to 0.
The Λ(u) statistic assesses the contrast in the spatial distribution of housing inside and outside a circle of fixed radius centred on each location u of a centroid grid, assuming conditions of CSR (see [
60]).
Figure 4 (bottom right) presents the
p-value associated with the statistic, in natural logarithmic colour scale. The deep blue areas indicate a lower probability that the highest locational intensity within each circle is a random event.
These spatial point analysis techniques allow us to identify a pattern of partial agglomeration and mostly peripheral dispersion of public housing in Valencia. Partial agglomeration, because several clusters of public housing blocks stand out. The one with the greatest weight is located in Benicalap, in the northern peripheral crown. The second one is located in Faitanar, on the southern boundary of the municipality. Amongst the secondary sites, the one located in the Patraix district, particularly in the Safranar neighbourhood, stands out; as well as the peripheral axis formed by the La Punta neighbourhood, located in the Cuatro Caminos district, and the Poblados Marítimos district.
Peripheral dispersion does not seem obvious when taking into account only the presence or absence of public housing or the probability of randomness in locational intensity of the blocks. However, when weighting by the number of dwellings, the KDE reveals that the central district (Ciutat Vella) loses weight as a location for public housing. The urban characteristics of the district do not allow for large blocks of collective housing, so the projects located in the area are mainly of small and medium size. On the other hand, the blocks are larger in size in the case of the peripheral partial agglomerations in the north and south of the municipality.
3.2. Spatial Patterns of Insertion of Public Housing in the Socio-Residential Environment
The analysis in the previous section shows the existence of a pattern of partial agglomeration and mostly peripheral dispersion of public housing in the municipality. In general, the existence of an association between the presence of public housing in the urban space and its urban and residential development trajectory could be stated: public housing blocks tend slightly to be located in sections with a more staggered development over time. However, the spatial distribution patterns of public housing according to the socio-economic characteristics of the environment in which it is located are not taken into account. In the following sections, we analyse this association.
3.2.1. Spatial Distribution of Socio-Residential Characteristics
Global Moran’s I points to the existence of positive spatial autocorrelation patterns in both cases, with I = 0.36 for the low-income population, and I = 0.56 for the median monthly rent. Next, we will analyse how this autocorrelation manifests locally.
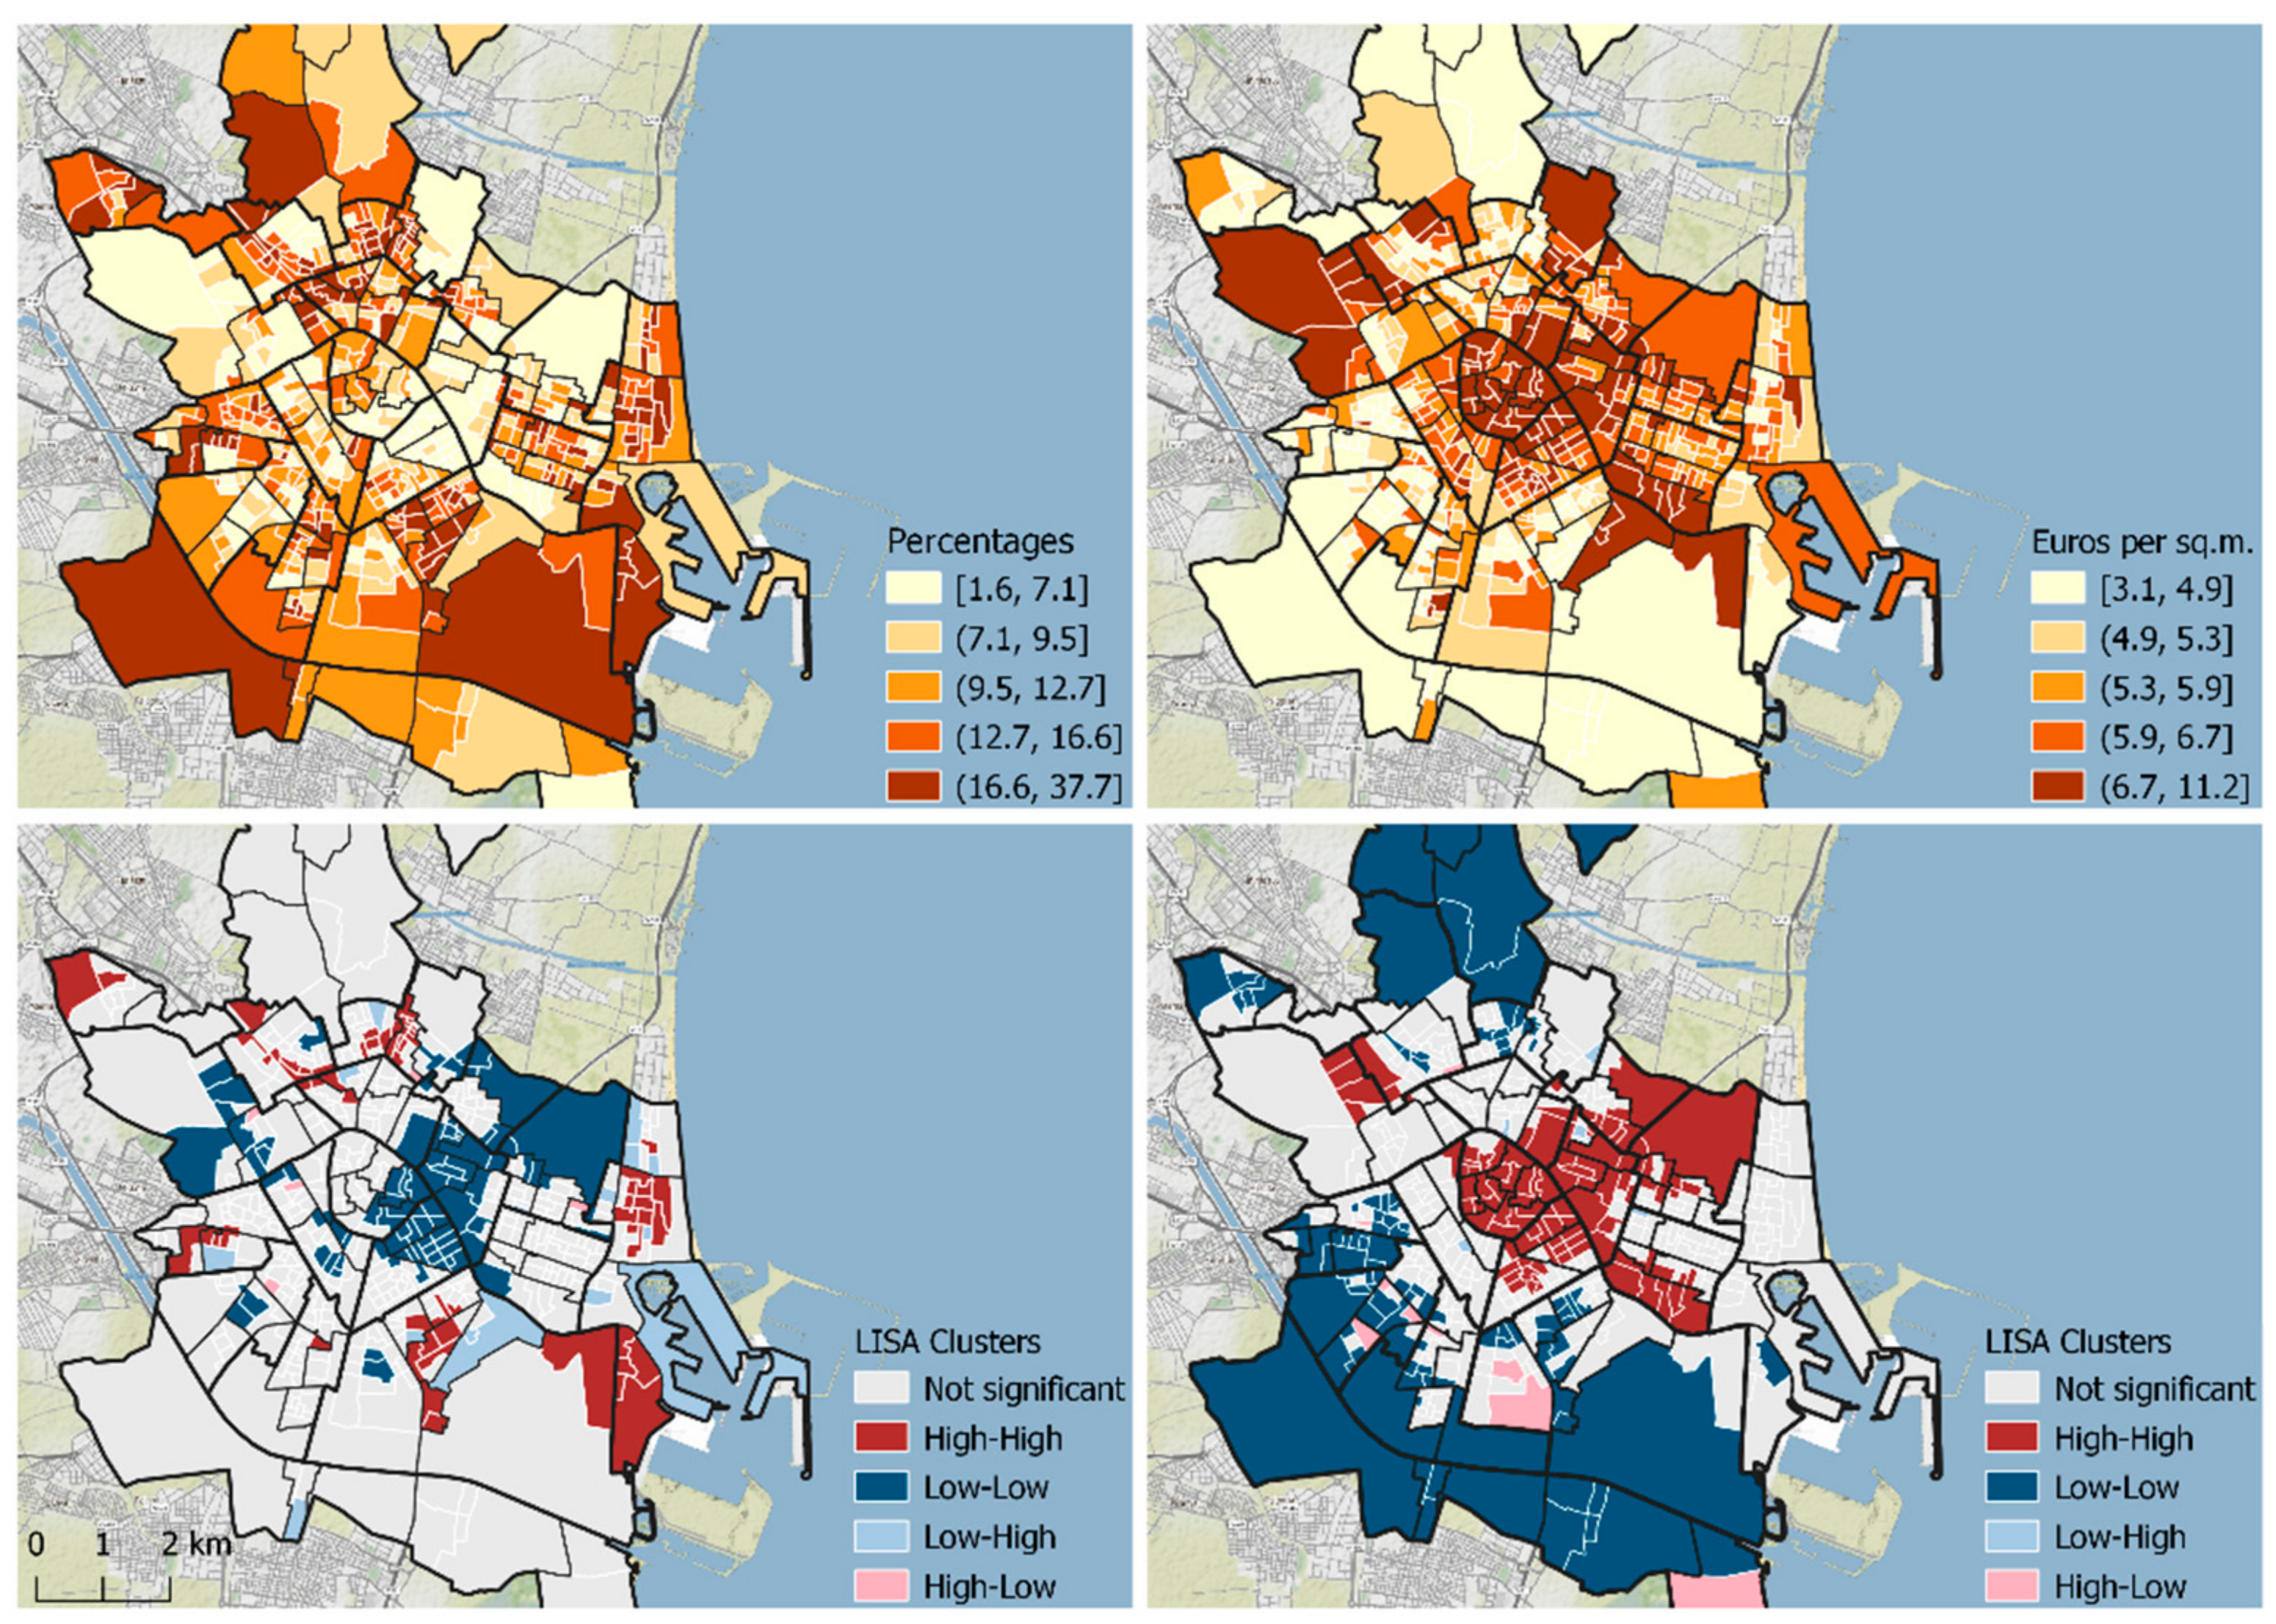
As in the case of public housing, the spatial distribution of the low-income population (
Figure 5 left) is characterised by the formation of scattered High-High clusters (10.6% of the total census tracts) mainly in peripheral areas, covering core areas of the districts of Benicalap, Rascanya and L’Olivereta, and several sections of the districts of Quatre Carreres, Poblats Marítims (particularly in the neighbourhoods of Cabanyal—Canyamelar and Nazaret) and Pobles de l’Oest. Low-Low clusters (15.1%) are distributed in large areas belonging to the districts of Ciutat Vella, L’Eixample, Extramurs and Pla del Real, as well as in the neighbourhoods of Penya-Roja (Camins al Grau district), Trinitat (La Saïdia), Benimaclet, Sant Pau—Campanar and La Carrasca (Algirós).
The spatial distribution of the median monthly rent follows a far clearer pattern of clustering than in the previous case. It is characterised by the formation of an extensive Low-Low cluster (18%) in the south-western area of the last peripheral crown, and in Pobles del Nord and Pobles de l’Oest. The High-High clusters (17.3%), on the other hand, follow a very similar spatial distribution to the Low-Low clusters of the low-income population, but have a greater presence in the Camins al Grau district.
Table 2 shows how public housing is located in these census tracts. In the case of the low-income population, the vast majority of buildings (64.5%) are located in tracts that do not form clusters. Of the remaining buildings, 25% are located in High-High clusters, although they would only account for 16.1% of the dwellings. The rest are distributed between Low-Low (6.5%) and Low-High (4%) clusters.
These patterns differ markedly in the case of monthly rent. Buildings located in census tracts that do not form statistically significant clusters account for 42.7%. The remaining buildings are distributed between the High-High (29.8%) and Low-Low (27.4%) clusters, indicating the lack of an unambiguous form of insertion in the environment. The capacity of blocks located in Low-Low clusters (39.1% of dwellings), however, is significantly higher than in High-High clusters (13.9%).
3.2.2. Association Patterns between Socio-Residential Characteristics and Public Housing
The effect sizes between census tracts with public housing and census tracts without public housing in median monthly rent and percentage of low-income population is hardly remarkable (
Table 3). The point-biserial correlation coefficient between the presence of public housing and both variables (r
pb = 0.02 with respect to low-income population; r
pb = 0.05 with respect to rent) does not reveal a significant overall association either.
Taking the census tract as a statistical unit, and estimating for each district, however, the situation changes: the patterns of association appear to be heterogeneous across census districts (
Table 4). In Ciutat Vella, where 27.4% of public housing buildings (
n = 34) and 8.7% of dwellings (
n = 317) are located, the coefficient is 0.66 (
p < 0.01). As highlighted in the previous section, the buildings are predominantly located in the neighbourhoods of El Carmen and El Pilar, where the levels of low-income population are higher than in the rest of the district. However, it should be noted that these levels are not particularly high compared to other neighbourhoods in the city where no public housing buildings are located.
In the rest of the districts, the association of public housing with both variables returns highly variable coefficient sizes, ranging from −0.63 to 0.63, although in no other case are they statistically significant at p < 0.05.
3.2.3. Socio-Residential Categories
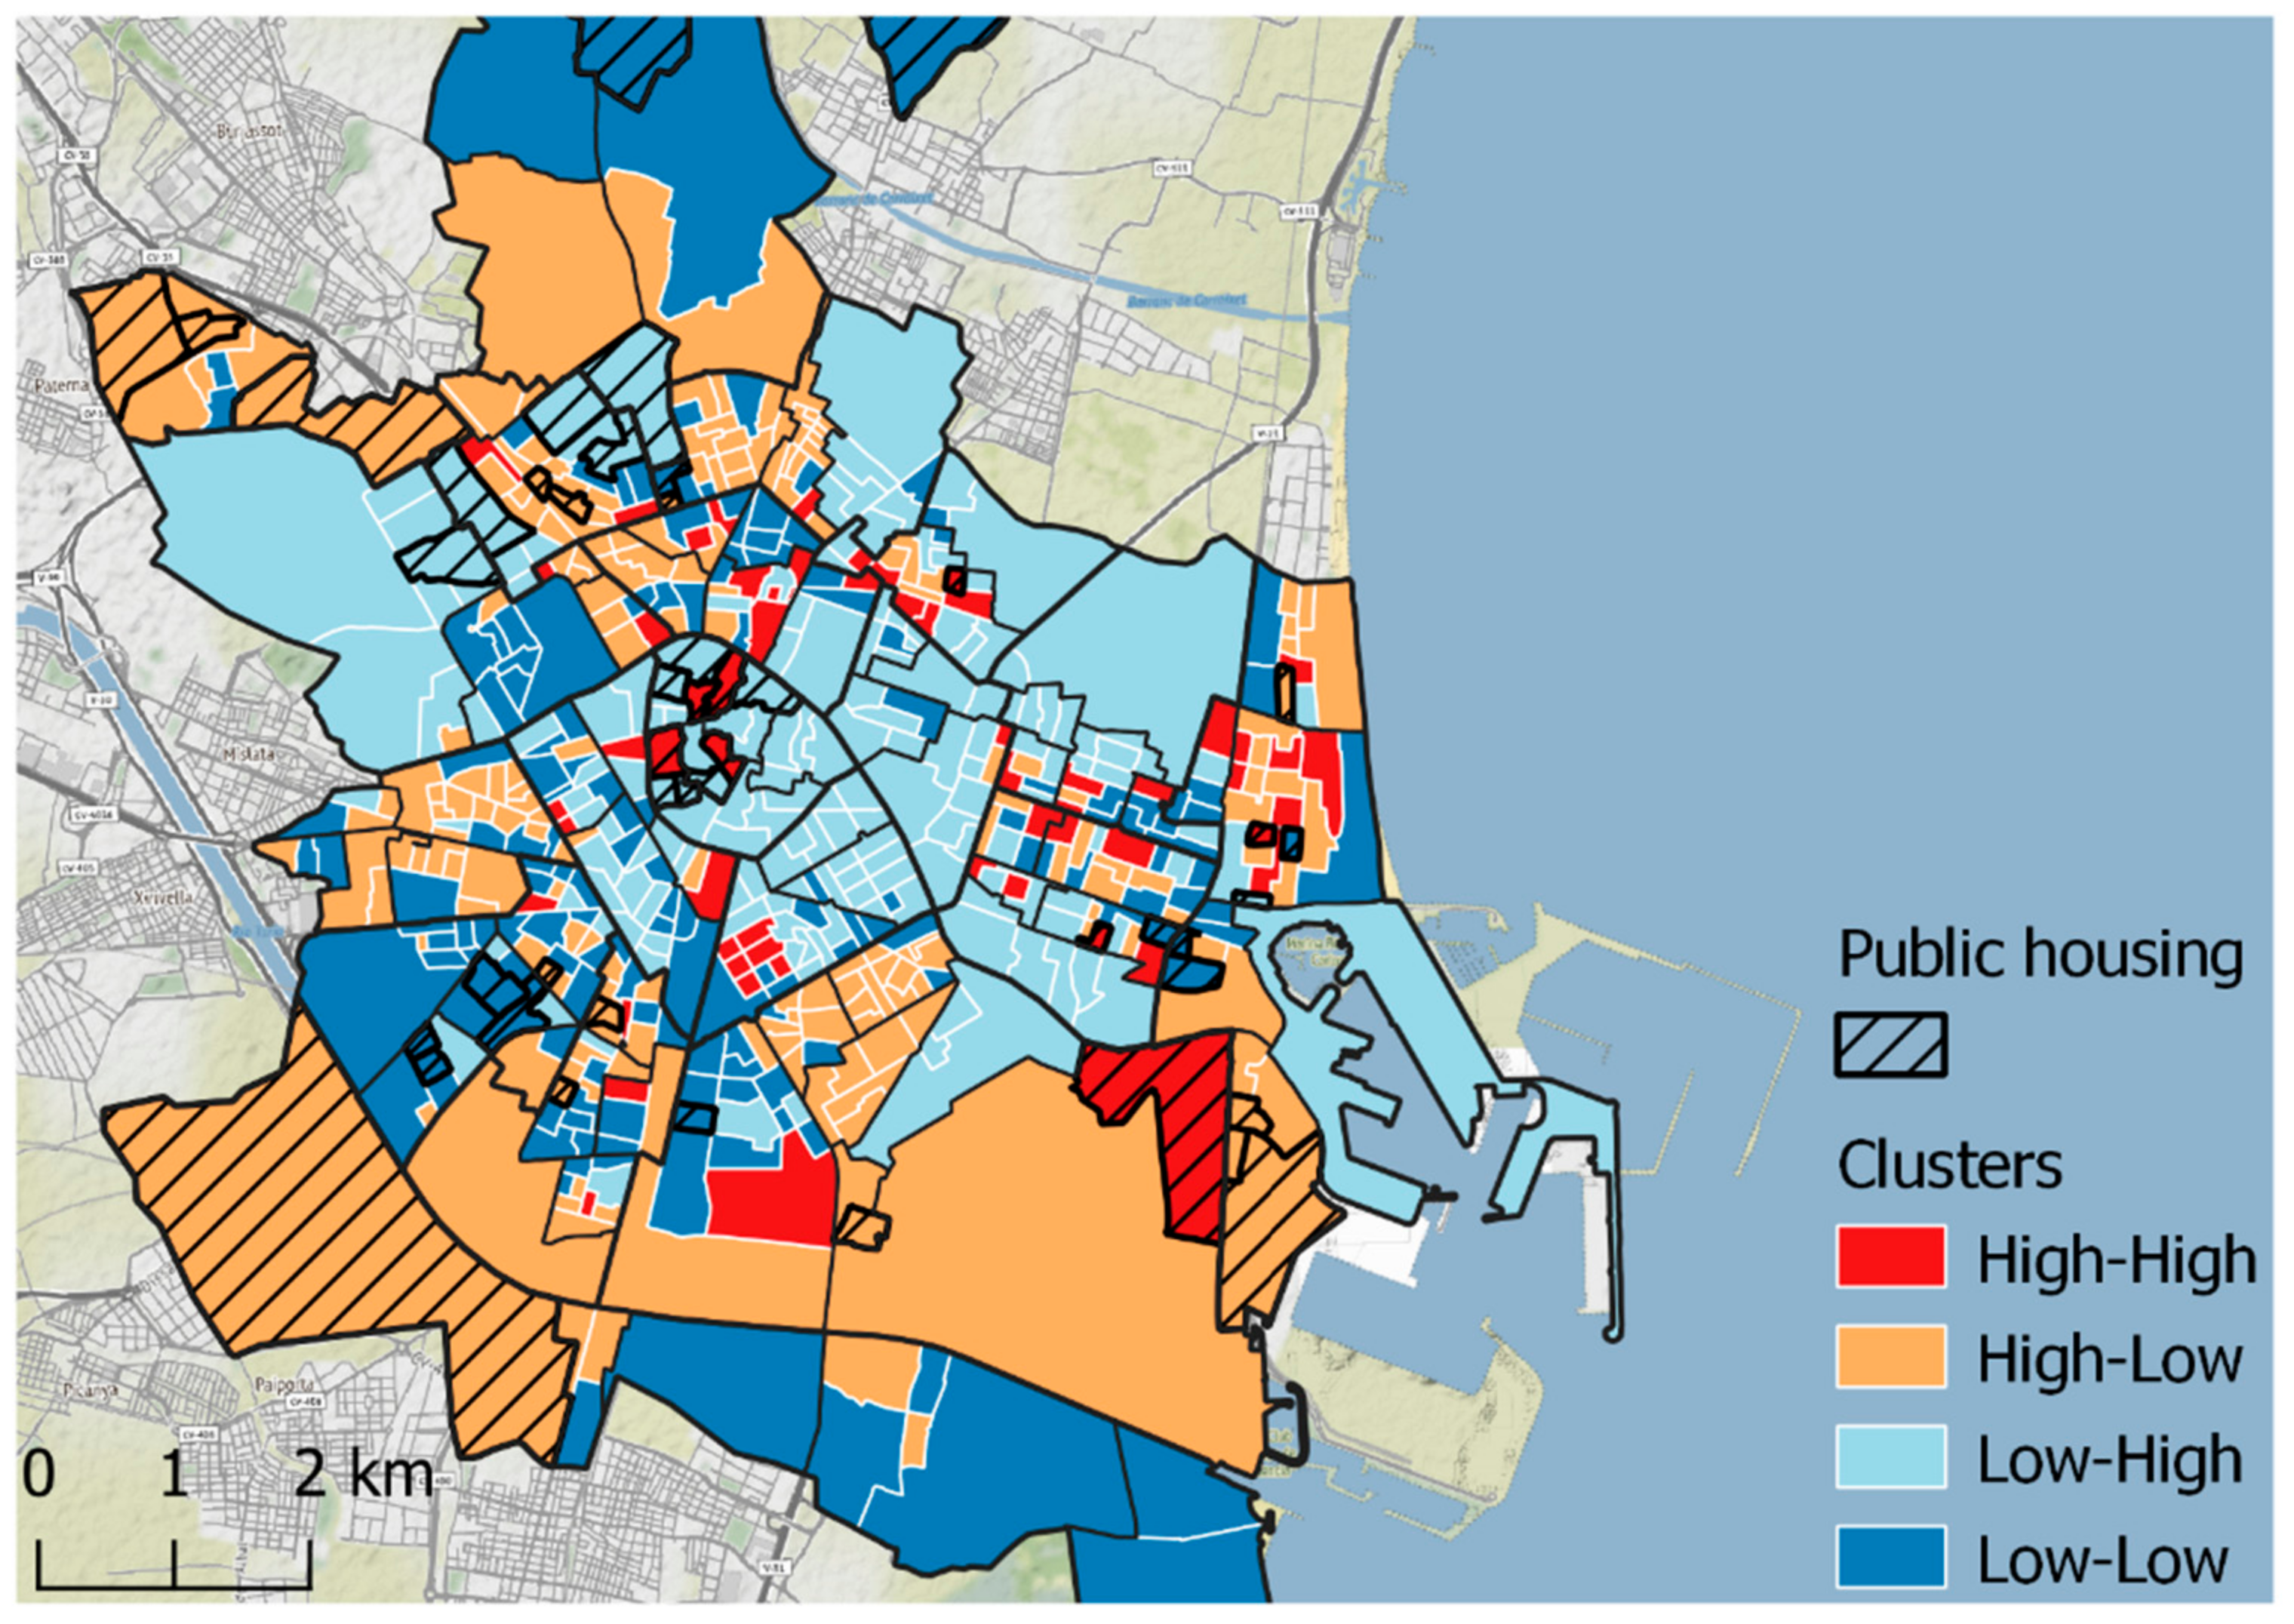
Figure 6 presents the quadrant map of the variables corresponding to the median monthly rent and the low-income population.
Table 5 presents a detailed summary of the results. As can be seen, most public housing buildings are located in High-High tracts (38.71%), although they belong to an atypical category of interaction (only 9.7% of the sections fall into this group). The High-High clusters do not show as clear a spatial clustering pattern as the other clusters and can be identified as areas with a certain level of social segmentation, where there occurs simultaneously an above-average presence of low-income population and higher rental prices.
The remaining buildings are located, to a lesser extent, in the High-Low cluster (24.19%), which corresponds mostly to socially vulnerable urban areas and deprived neighbourhoods; the Low-High cluster (19.35%), which corresponds predominantly to socio-residentially advantaged areas; and in the Low-Low cluster (17.74%). The location of dwellings in public housing blocks, on the other hand, is notably higher in the High-Low cluster (35.85%). The rest of the dwellings are located, in this order, in the Low-High cluster (25.89%), the Low-Low cluster (21.63%) and the High-High cluster (16.63%).
Table S1 systematically reports the differences between clusters, based on several hypothesis tests. Only the ANOVA test does detect significant differences in the absolute number of public housing buildings at
p < 0.01, with F (3, 592) = 5.862. The post-hoc Tukey’s test shows that statistically significant pair differences (
p < 0.01) occur between the HL-HH, LH-HH and LL-HH clusters, i.e., between the High-High cluster and each of the other cluster typologies. This fact could suggest that the location of public housing has produced a slight “poverty concentration effect” on socially segmented neighbourhoods, although, in any case, of a very limited and spatially heterogeneous scope. None of the other ANOVA tests could find significant differences between clusters for any of the variables related to the presence of public housing. At
p < 0.1, only
t-tests found significant differences in the total number of blocks between H low-income and L low-income clusters (
t = 1.709); and H Rent and L Rent clusters (
t = 1.697), which is consistent with the rest of the findings.
4. Discussion
This study has revealed that public housing in Valencia (Spain) follows a spatial distribution pattern of partial agglomeration and mostly peripheral dispersion, thus providing an answer to the first question. However, this pattern does not seem to be univocally related to the socio-spatial inequalities characteristics of the environment. In the same direction as other studies applied to cities such as Montreal [
27,
28,
29], our analysis shows that in Valencia there does not seem to be a single trend in terms of the spatial insertion of public housing. Rather, it could be noted the existence of multiple local casuistries, which vary according to the socio-economic characteristics of the neighbourhood and its patterns of urban and residential development.
As shown above, a large percentage of the blocks (38.7%) is located in sections where there is a simultaneous above-average presence of low-income population and higher rent prices (High-High cluster), even though this typology accounts for only 9.7% of the total number of census tracts. The simultaneous coexistence of two inversely correlated characteristics (r = −0.35, p < 0.01), together with a relatively high presence of public housing buildings, suggests that its location may have driven a slight “poverty concentration effect” in these neighbourhoods. Indeed, the fact that a census tract has a high percentage of low-income population and above-average median monthly rent is an atypical form of interaction between the two variables. However, this would be a narrow and spatially heterogeneous effect. Public housing blocks are present, to a greater or lesser degree, in all socio-residential neighbourhood profiles.
The key factors for this not being a generalised and wide-ranging trend would lie in the heterogeneity of profiles eligible for public housing, the size of the projects and the spatial dispersion in their location. As stated by Alberdi [
7], in Spain some 80% of households have an income below the ceiling for access to some form of public housing. This represents a wide range of potential beneficiaries and thus a great variability in their socio-economic profiles. Due to the availability of data, the different typologies of arrangements are not considered in this study, so it would not be difficult to accept that low-income beneficiaries have been located to a greater extent in the High-High clusters.
When the size of the blocks (number of dwellings) is taken into account, the location pattern becomes less obvious. Most of the buildings located in the High-High clusters are of small or medium size, which would have contributed to reduce this “poverty concentration effect”. It is reported that this is the case of Montreal, where, in addition, larger projects are scattered throughout the neighbourhoods, especially in the middle and upper-middle class sectors, where they are over-represented [
28]. The experience of French cities also supports the idea that small projects are more likely to drive “social mixing” [
31].
The spatial distribution pattern of public housing in the municipality, closer to dispersion than clustering, may have discouraged the formation of large low-income population hotspots. Although, in general, the predominant trend is towards peripheralisation, the case of the central district Ciutat Vella should be noted, as it presents some characteristics that differentiate it from the rest. As a whole, it has the highest spatial clustering of public housing buildings, but these are mainly located in the El Carmen and El Pilar neighbourhoods, which also have comparatively higher levels of low-income population than the rest of the old city neighbourhoods. Urban policies designed in the 1990s faced the need to protect part of the social structure of a physically and socially degraded area in the initial stages of a transformation process [
40]. An example of this would be the provision of public housing formulated in a broader urban planning instrument, such as the Special Plan for the Protection and Interior Reform (PEPRI) Barrio del Carmen, approved in 1991.
Considering the impacts on urban space of the location of public housing, and in relation to the above, it is possible that the clustering of public housing in this area has contributed to mitigating some of the worst effects of the social structure reconfiguration, although it is methodologically complicated to establish what the real extent is. As can be seen in the previous section, the “local” district-level relationship between the presence of public housing and low-income population is positive and statistically significant, in contrast to the vast majority of districts. The effects on housing rental prices, on the other hand, might have been very limited, or counteracted by the intense processes of touristification of traditionally residential urban areas. However, it should be noted that, although the district contains 27.4% of the public housing buildings (n = 34) of the entire municipality, it would only contain 8.7% of the dwellings (n = 317). This is mainly due to the particular urban configuration of the district, which concentrates most of the historic centre of the city and is mostly composed of low and medium-rise buildings with little surface area.
5. Conclusions
Our study aimed to carry out an exploratory analysis of the main characteristics of the spatial distribution of public housing in the city of Valencia. In general, although the study reveals that public housing follows certain patterns in its spatial distribution, the results show that there is no single trend in terms of the insertion of public housing in the socio-residential environment.
The implemented analysis faces some limitations, mainly derived from the availability of data. Firstly, this study constitutes a “snapshot” of the main characteristics of the spatial distribution of public housing buildings at a given point in time. However, as Apparicio et al. [
29] stated, public housing environments are not frozen in time and may have changed, due to filtering or gentrification, or to spatial and urban transformation processes. The study could be complemented with the use of methods to automatically generate urban growth boundaries [
63].
Secondly, and related to the previous limitation, causal mechanisms and the localised impact of the spatial distribution of housing are not assessed in more detail. At this point, it is worth noting the methodological difficulties of undertaking this task with only cross-sectional information.
Finally, we have analysed data at the aggregate level, but the absence of micro-data or aggregated data at a lower scale (e.g., at the block level) hampers the purpose of drawing concrete conclusions about the population benefiting from public housing. The dynamics analysed in this study are essentially ecological.
Moreover, in Spain there are hardly any recent studies on the spatial distribution of public housing with an intrinsically geographical focus. In any case, it is advisable to improve the availability and scope of data on public housing and to promote applied research on the causes and socio-spatial impacts derived from its location in urban space, in order to adequately inform policy-making processes.


