Article

Harvest Rates of Rheophilic Fish Vimba vimba, Chondrostoma nasus, and Barbus barbus Have a Strong Relationship with Restocking Rates and Harvest Rates of Their Predator Silurus glanis in Lowland Mesotrophic Rivers in Central Europe

Institute for Evaluations and Social Analyses (INESAN), Sokolovská 25, 186 00 Prague, Czech Republic
Sustainability 2021, 13(20), 11379; https://doi.org/10.3390/su132011379
Submission received: 6 September 2021 / Revised: 29 September 2021 / Accepted: 11 October 2021 / Published: 15 October 2021

Abstract

:
The European catfish Silurus glanis (Linnaeus, 1758) is an expanding apex piscivorous predator whose predation may drive fish harvest rates and fish populations. This study aimed to analyze the relationships between intensive catfish stocking/harvesting and harvest rates of putative catfish prey–three rheophilic fish species: vimba bream Vimba vimba, nase Chondrostoma nasus, and barbel Barbus barbus (Linnaeus, 1758). The GAM (generalized additive model) was used to analyze the relationships between the harvest rate and the stocking intensity rate of the catfish and the three rheophilic fish species. The harvest rates and stocking intensity rates were obtained from mandatory angling logbooks collected from 38,000 individual recreational anglers by the Czech Fishing Union on 176 fishing sites over the years 2005–2017 in central Bohemia and Prague (the Czech Republic). Our results show that a higher intensity of catfish stocking and harvesting resulted in a lower harvest rate of rheophilic fishes. Conversely, the stocking rates of rheophilic fishes were not significantly correlated to their harvest rates. In conclusion, a significant negative relationship was found between the harvest rate and the restocking rates of rheophilic fishes and their predator, suggesting that fisheries managers should not perform intensive stocking of both catfish and rheophilic fishes on the same rivers.

1. Introduction

The European catfish Silurus glanis (Linnaeus, 1758) is an apex predatory fish species in the freshwater ecosystems of central Europe. Its populations are expanding due to climate change, river damming, and introductions [1,2,3]. Catfish predation may potentially drive freshwater ecosystems and wild fish populations. The predation pressure may be further increased by an intensive catfish stocking that causes unnaturally high predation pressure on local fishes. Conversely, anglers can significantly reduce the catfish populations through intensive angling [4,5]. The possible negative effect of catfish predation on local fish populations has been discussed [1,2,3,5]. While the catfish occupies various habitats, it mostly lives in larger rivers which are the natural habitat of the rheophilic fish species.
Rheophilic fish species are globally threatened organisms [6]. The rheophilic fishes are a fish species that prefer to live, hunt, and reproduce in fast-moving waters. Their populations are decreasing due to anthropogenic actions—mainly river fragmentation, removal of shelters and spawning sites, water pollution, protection of piscivorous cormorants and otters, and angling pressure [7,8,9,10]. Despite intensive stocking efforts, a reintroduction of the rheophilic fishes failed to stabilize their populations in central Europe due to river fragmentation and poor environmental conditions [11]. Conversely, catfish reintroductions were successful even outside of its native habitats—and catfish stocking has become a potential driver of the harvest rates of many prey fish species [5].
The harvest rates of fish species are mostly driven by fish stocking, angling pressure, angler preferences, fishing gear used, angling restrictions, and environmental conditions [12,13,14,15]. Strong positive relationships between fish stocking and fish harvesting within the same fish species exist [13,16]. In addition, significant negative relationships between the stocking of predatory fish species and the harvest rates of their prey were also reported, showing that the intensive stocking of predators can lead to lower harvest rates of their prey [17]. Even though multi-species stocking management could lead to different harvest rates in comparison to single species restocking, the analyses of multi-species relationships between stocking and harvest rates are still rare.
Fish stocking is usually performed for two reasons—either to provide fish for angling purposes or to bolster the wild fish populations. For angling purposes, species like the common carp Cyprinus carpio (Linnaeus, 1758), rainbow trout Oncorhynchus mykiss (Walbaum, 1792), or piscivorous fishes are stocked. For the bolstering of the wild populations, naturally occurring fish species that are negatively affected by anthropogenic pressure are stocked. The stocking of multiple species is performed because fisheries managers want to satisfy both the anglers (who fish for fun and food) and the conservationists (who want to stabilize the wild populations). While both reasons for stocking are acceptable (and functioning) in a vacuum, the problem is that stocking is performed on the same rivers simultaneously. When multi-species stocking is done at the wrong intensity and with the wrong mix of species, it can have negative effects on the harvest rates of fishes and the wild fish populations alike. This is because the stocked fish compete for food, shelter, and habitats. In particular, there is a concern that the intensive stocking of catfish could lead to lower harvest rates of the rheophilic fishes because it is performed on the same rivers. The author believes that he can help to partially enlighten this problem by analyzing this very precisely collected data on harvest rates and restocking rates. This data set has several advantages over the data sets used by other studies.
Previous studies either collected the data from a few rivers and streams or over a short period. They also analyzed only one fish species at a time and did not try to build multi-species models [13,16,
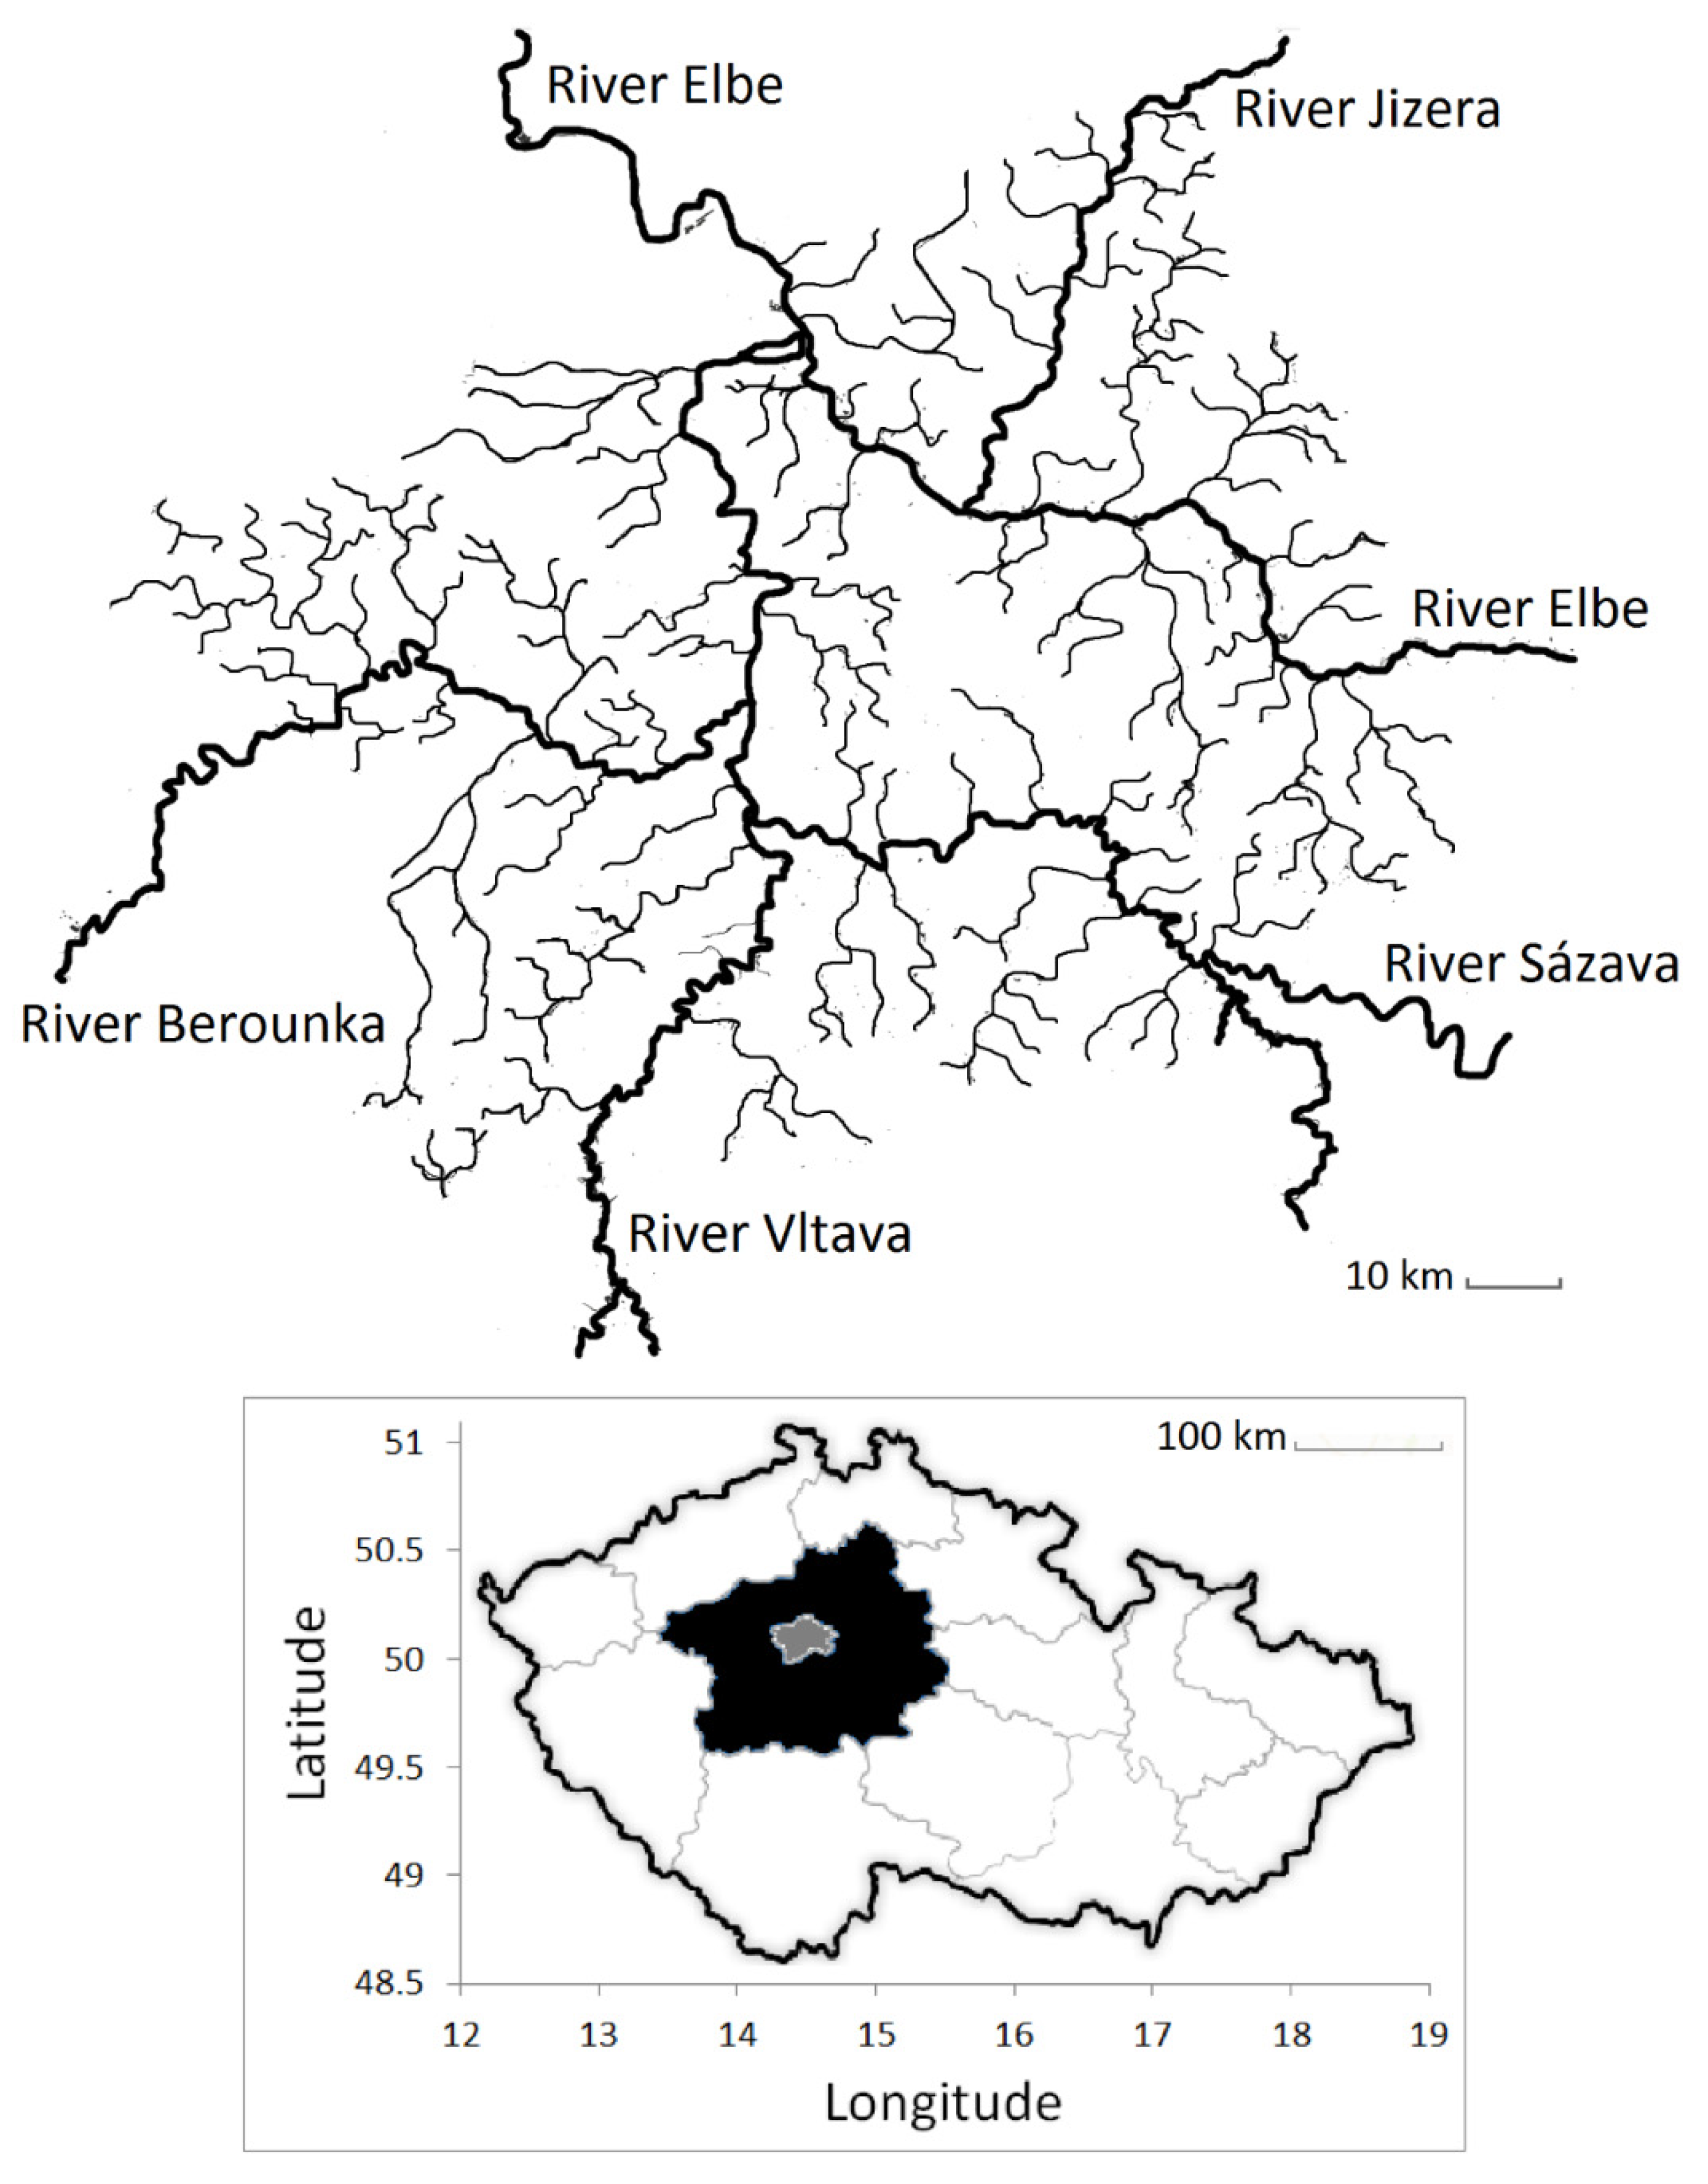
17]. Therefore, the multi-species interactions between fish harvesting and fish stocking remain unknown. This study aimed to bridge this knowledge gap by newly analyzing the harvesting–stocking relationship between catfish and three rheophilic fishes. The study utilized the precisely collected and relatively worldly unique data on fish harvesting and fish stocking that has been collected by the Czech Fishing Union since 2005 [11]. The Union has been collecting the harvest rates and the stocking rates of all four fish species on each individual river and stream in the region, allowing a spatial-temporal comparison of the data.
This study aimed to analyze the relationship between the harvest rate and the stocking intensity of the predator European catfish and the harvest rates of its prey, the rheophilic fish species (Barbus barbus, Chondrostoma nasus, and Vimba vimba-Linneaus, 1758) in lowland mesotrophic rivers in Prague and the Czech Republic in central Europe. It also aimed to analyze the correlation between the harvest rate and an angling effort together with a fishery magnitude. It was expected that the stocking intensity of the rheophilic fishes would be positively correlated with their harvest rates. It was also expected that intensive catfish stocking would be negatively correlated with the harvest rate of rheophilic fishes. It was then expected that intensive catfish harvesting would be negatively correlated with harvest rates of rheophilic fishes. Finally, it was necessary to investigate if the angling effort and the size of a fishery also have a significant relationship with the harvest rates of the rheophilic fishes. It was expected to discover which factors are strongly correlated with the harvest rates of the rheophilic fishes. It was hypothesized that the harvest and stocking intensity of the catfish together with the stocking intensity of the rheophilic fishes would be more important than the effort and the fishery size.

2. Materials and Methods

2.1. Study Area

This study was carried out on lowland mesotrophic rivers that are 30–250 m wide, cover an area of 150 km2, and have a fish biomass of 150–300 kg per ha [18]. They are situated in the city of Prague and the agricultural region of central Bohemia (49.5°–50.5° N, 13.5°–15.5° E), the Czech Republic, central Europe (Figure 1). The regions cover an area of 11,500 km2, are in the temperate zone, and belong to the North Sea Drainage area and the Elbe River Basin.
The studied rivers are separated into individual fishing sites—river stretches that are divided by obstacles or structures (a dam, a weir, a bridge, or a hydro-power plant). The 176 fishing sites studied here are 4–160 ha large (median 9 ha) and located in 38 rivers.

2.2. Studied Fish Species

The European catfish S. glanis is a native large-growing non-migratory piscivorous fish species. A previous study from this area confirmed a strong relationship between the catfish stocking intensity and its harvest rate [19]. Vimba bream V. vimba and barbel B. barbus are native medium-sized non-migratory omnivorous fish species. Nase Ch. nasus is a medium-sized non-native non-migratory omnivorous fish species. While the local catfish populations were expanding over the years 2000–2018 [5], the rheophilic fish populations were decreasing [10,20,21].
All four studied species—the barbel, the nase, the vimba bream, and the European catfish—have a cumulative daily bag limit of either 7 kg of fish or two individual fish (whichever comes first). They have minimum legal angling sizes: nase—30 cm TL, vimba bream—25 cm TL, barbell—40 cm TL, and catfish—70 cm TL (total length). Nase, vimba bream, and barbel have a closed season from 16 March to 15 June. The catfish has a closed season from 1 January to 15 June. Listed rules applied over the years 2005–2017 [11].

2.3. Fish Stocking

Local fisheries managers stocked the catfish and all three rheophilic species into the studied rivers annually (Table A1 in Appendix A). They stocked all sizes of the studied species: the rheophilic fish (5–30 cm TL) and the catfish (5–100 cm TL). Most fish (approximately 90% by biomass) were stocked as yearlings (the rheophilic fish: 2–10 cm TL, the catfish: 5–20 cm TL). The fisheries managers reported the numbers, the biomass, and the sizes of the stocked fish into mandatory stocking logbooks. The information on the sizes and the biomass of the stocked fish was obtained from aquaculture managers who hatch and grow the fish in local and regional hatcheries. The Czech Fishing Union is the sole authority that stocks fish on the studied fishing sites [11].
To estimate the effect of the rheophilic fish stocking intensity on their harvest rates in each individual year, 3–5 year-old data on fish stocking prior to the year when the fish was harvested were used. For catfish, 0–10 year-old data prior to the year when the catfish was harvested were used. For example, to estimate the effect of the rheophilic fish stocking on their harvest rates in the year 2010, data on the fish stocking from the years 2005–2007 were used. The time lag between the restocking year and the harvest year was calculated based on an estimated growth and survival rate of the rheophilic fish species and the catfish from fish growth and survival studies [21,22,23,24].

2.4. Data Collection

The Czech Fishing Union collected and processed the data from personal angling logbooks and restocking reports – and the data were processed by the author of this study. The Union provided an annual summary of harvest rates, angling visits, stocking activities, and activities of angling guards from each fishing site individually (Table A2 and Table A3 in Appendix B). The data were analyzed from non-private fishing sites only (80% of water surface in the area). This way, the data were analyzed from 38,219 individual anglers over 2005–2017. Since each angler who fishes in the study area must obtain a fishing permit together with a fishing license (and must also report all killed fish into a mandatory angling logbook), the data were collected from almost all anglers (over 99%) who fished on the studied fishing sites. Each angler was a member of one local angling organization and passed a knowledge test on angling rules and fish biology before obtaining an angling license. Each angler delivered a filled angling logbook and a summary of fishing visits and killed fish for the whole year (Table A4, Table A5 and Table A6 in Appendix C). Anglers did not provide angling hours—only the number of fishing trips was provided. Each angler received a new angling logbook only after submitting the old filled one—this ensured that over 99% of the anglers who fished in the study area submitted a full summary of killed fish (Czech Fishing Union, unpubl. data). Anglers did not report released fish (only killed fish were reported). As a rule, the anglers can release all caught fish—they do not have to kill every single fish they catch. However, they had to release all the fish that (1) were caught during the closed season, (2) did not meet the minimum or maximum legal angling size, or (3) exceeded a daily bag limit. Anglers measured each killed fish to the nearest cm (TL, total length) and assigned weight using species-specific length–weight tables. Those were pre-provided by the Fishing Union and were based on length-weight equations from FishBase. Each angler was at least 18 years old (or a child with a supervision of an adult) and used no more than two fishing rods. No boats, nets, or other fishing techniques were allowed—anglers used only rods.
Professional angling guards (15 people) and amateur angling guards (1000 people) performed random checks of the anglers in the field (20,000–40,000 annually). The guards checked if the anglers wrote down each killed fish (including the date, the ID of a fishery, the species, and the size) and submitted the date of the check into their angling logbook. This ensured a relative quality of the reported data. In case of any rule violation, the guards confiscated the angling logbook and the killed fish and fined the angler. The angler was banned from fishing until January of the next year.

2.5. Data Analysis

The statistical program R [25] was used for statistical testing. The distributions of the fish harvest and stocking rates were tested by Shapiro–Wilk normality tests.
The harvest rates of fishes were not normally distributed (p < 0.001 for each tested species), the package for generalized additive models (GAM) was used to fit the models of the harvest rates [26]. The GAM assumptions were checked and assessed regarding the quality of the models according to statistical studies [27,28,29,30]. The GAM was used because it is an extension of the generalized linear model (GLM) with a smoothing function, and it is composed of a sum of smooth functions of covariates instead of (or in addition to) the standard linear covariate effects. The GAM was preferred to GLM because it allowed to fit the models with non-linear functions with more precision. It allowed to model non-linear data while maintaining explainability.
Three models were constructed—one for each species (vimba bream, nase, and barbel). The response variable in each model was the harvest of rheophilic fish species per effort per hectare. The fishing effort was calculated as the number of fishing trips (visits) per year. The fixed factors in all three models were: (1) the angling effort, (2) the surface area of a fishing site, (3) the size (the median body weight) of the stocked rheophilic fish species, (4) the stocking intensity of the rheophilic fish species, (5) the harvest rate of the catfish, and (6) the stocking intensity of the catfish. The fishing site was added as a random factor to exclude the effect of individual fishing sites on the harvest rates and because individual fishing sites (river stretches) were connected, allowing the stocked fish to migrate between the fishing sites [31]. Collective annual data from one fishing site were used as one observation in the analyses. Gamma error distribution with log link function was used in the models because the data had continually distributed positive values. A minimum probability level of p = 0.05 was accepted for all two-tailed statistical tests. Bonferroni correction was applied in all three models because multiple groups were tested for differences. This method of fisheries data analysis was previously used to analyze fish harvest rates in different research papers [32,33,34,35].

3. Results

The surveyed anglers fished on the studied fishing sites 6.8 million times, and they harvested 107.5 tons of the rheophilic fish and 237 tons of the catfish (Table A7 in an Appendix D). The rheophilic fish and the catfish made 0.7% and 2% of the overall fish harvest by biomass, respectively. The anglers harvested 4.8, 3.0, 1.5, and 11.8 times more barbel, nase, vimba bream, and catfish (respectively) than what the fisheries managers stocked.
It was found that the harvest and stocking rates of the catfish were strongly correlated with the harvest rates of barbel, nase, and vimba bream (Table 1, Table 2 and Table 3). A higher intensity of catfish stocking and harvesting resulted in a lower harvest rate of the rheophilic fish. An angling effort also strongly influenced the rheophilic fish harvest rates—each angler harvested less fish on intensively fished rivers. Conversely, the stocking rates of the rheophilic fish did not significantly affect their harvest rates.
Native rheophilic fish species with higher harvest rates showed stronger relationships with the stocking rates and the harvest rates of the catfish. Barbel was the most intensively harvested rheophilic fish species—and showed the strongest relationship with the catfish stocking intensity and its harvest rate (Table 1). Conversely, nase was the least intensively harvested rheophilic fish species and showed the weakest relationship with the catfish stocking and harvesting (Table 2). The harvest rate of native species (babel and vimba bream) was more affected by the catfish angling and restocking than the harvest of the non-native nase (Table 3).

4. Discussion

The harvest rate of the rheophilic fishes was significantly correlated with the stocking intensity and harvest rate of the catfish together with the angling effort. This finding supports the initial hypothesis, although it was expected that the angling effort would be less significantly correlated. The size of the fishery proved to be insignificantly correlated with the harvest rates, which supports the hypothesis. The relationship between the prey harvest rate and the predator stocking rate could be driven by the predator–prey relationship between the catfish and the rheophilic fishes. In central Europe, catfish predation is further combined with predation by otters Lutra lutra (Linnaeus, 1758), cormorants Phalacrocorax carbo (Linnaeus, 1758), and gray herons Ardea Cinerea (Linnaeus, 1758) [7,36]. River damming, water pollution (mainly organic pollution and microplastics), and removal of hideouts further pressure the rheophilic fish populations [8,9,10,21]. The anglers, the fisheries managers, and the representatives of angling clubs are concerned that the catfish expansion threatens the rheophilic fishes [37]. The managers say that the intensive catfish stocking could directly cause the decreased harvest of the rheophilic fishes. This is because the highly predated fish populations are more timid and harder to exploit by the anglers [38]. The wild fish populations adapted to the increased predation pressure by hiding which makes them less vulnerable to angling. Conversely, the higher harvest rates of the catfish could be caused by the fact that the hatchery-reared restocked catfish have more aggressive personalities than wild fish which makes them more likely to be predated and to actively seek prey and get harvested [39,40]. However, harvest rates are also driven by angling preferences.
The anglers could have switched their angling preferences from the rheophilic fishes to the stocked catfish. The rheophilic fishes are not strongly preferred by the anglers while the catfish is a “tier one” angling target. The anglers have gained access to high-quality fishing gear and a great know-how regarding trophy-sized catfish angling. Catfish angling has become a popular sport in Europe over the last 5–10 years [3,4,19]. Its popularity launched introductions outside of the native range of the catfish, and the catfish became an expansive or even an invasive species [3,4,19]. Angling “selfies” with a catch of a trophy-sized catfish have flooded the angling discussion forums on Facebook and Twitter. The promotion of catfish angling further encourages more anglers to specialize in catfish angling. Conversely, intensive catfish angling can cause a decrease in the local catfish populations which can release the rheophilic fish populations from the catfish predation pressure [5]. This would explain the significant negative relationship between the harvest rates of the catfish and the rheophilic fish species.
The harvest rate of the rheophilic fishes was not significantly influenced by their stocking management. This result contradicts the initial hypothesis. The rheophilic fishes were likely stocked at a too low an intensity to be significantly harvested by the anglers. The stocked rheophilic fish were also too small to be immediately harvested, due to the relatively high minimum legal angling size of each restocked species. Stocked fish usually have a high post-stocking mortality, a higher vulnerability to predation, low adaptive skills, and an underdeveloped ability to catch wild prey [41]. Most stocked fish survive in the wild for several months at maximum [42]. They often have a lower survival rate in comparison to the wild fish [43] but exceptions to this rule have also been reported [44].
The angling effort strongly affected the harvest rates of the rheophilic fishes. Previous studies also agreed that the harvest rates of fish are driven by the angling effort [33,35,45,46]. The angling effort is relatively hard to estimate because each angler fishes at a different intensity. This brings errors to the data analysis.
The angling logbooks provided information on the angling effort and the harvest rates, but they are partially erroneous. The anglers may provide the incorrect size of the killed fish (e.g., they kill a 50 cm large catfish and write down a 70 cm catfish instead to meet the minimum legal angling size), they could incorrectly identify the killed fish (e.g., misinterpreting a nase for a vimba bream), they may not comply with the angling rules (e.g., ignoring the minimum angling size limits), they might prefer a specific fish species (e.g., releasing a caught barbel to make room for a common carp), and they often release the caught fish [47,48,49].
Statistical analyses bring other errors. The analysis of multiple p-values increases the chance to incorrectly reject a null hypothesis. We made 21 statistical analyses at a 0.05 alpha level, meaning that some of the hypotheses were likely incorrectly rejected.

5. Conclusions

It was found that significant relationships exist between the harvest rates and the stocking rates of the rheophilic fishes and their predator. The fisheries managers should take them into a consideration and reconsider the intensive restocking of both species together on the same rivers. A simultaneous stocking did not provide an increased harvest of all species. There are two possible explanations: either the catfish could pressure the rheophilic fishes through a predation, or the anglers have lost their interest in rheophilic fish angling and switched to catfish angling instead. Either way, the fisheries managers are losing their money because they must pay for the restocked rheophilic fishes. It is proposed that fisheries managers should not stock the catfish together with the rheophilic fishes at a high intensity. Optimally, the managers should choose only one option for each river: either to exclusively stock catfish or to exclusively stock rheophilic fishes. If they stock both catfish and rheophilic fishes, the harvest rate will likely plummet. In future studies, it is suggested that the inter-species relationships should be further studied because they could be based on the prey–predator interactions and have a significant use in national species conservation plans.

Funding

This research was funded by the Operation Programme Research, Development and Edu cation: European Structural and Investment Funds, and by the Ministry of Education, Youth and Sports of the Czech Republic, grant number/registration number CZ.02.2.69/0.0/0.0/18_054/0014660” as a part of the project “Setting the conditions and the environment for international and cross-sector cooperation”.

Institutional Review Board Statement

Not applicable.

Informed Consent Statement

Not applicable.

Data Availability Statement

The data used to support the findings of this study will be available from the corresponding author upon request. Since the data are owned by a third party, a consent will be needed from this party as well.

Acknowledgments

The representatives of the Czech Fishing Union (Pavel Horáček, Dušan Hýbner, Jaroslava Fryšová) provided fisheries data.

Conflicts of Interest

The author declares no conflict of interest.

Appendix A

Table A1. The summary of the stocking of the catfish and the rheophilic fish species. Note: sd = standard deviation.
BarbelNaseVimba BreamCatfish
YearStocked Fish [kg per ha]sdSize of Stocked Fish [kg]sdStocked Fish [kg per ha]sdSize of Stocked Fish [kg]sdStocked Fish [kg per ha]sdSize of Stocked Fish [kg]sdStocked Fish [kg per ha]sdSize of Stocked Fish [kg]sd
1995NANANANANANANANANANANANA0.0550.0260.090.01
1996NANANANANANANANANANANANA0.0320.0030.020.01
1997NANANANANANANANANANANANA0.0420.0040.030.01
1998NANANANANANANANANANANANA0.0600.0060.190.04
1999NANANANANANANANANANANANA0.0500.0260.070.02
20000.050.020.0110.0020.0110.0130.0050.0010.210.170.00030.00020.0570.0220.020.01
20010.060.030.0190.0040.0250.0250.0050.0020.120.790.00070.00020.0640.0240.030.01
20020.060.030.0220.0040.0030.0030.0080.0020.120.780.00070.00020.0770.0350.030.02
20030.090.060.0180.0030.0170.0120.0030.0020.090.590.00350.00050.0860.0360.070.02
20040.090.060.0120.0060.0030.0020.0040.0030.090.070.00400.00090.0890.0370.040.04
20050.040.020.0080.0050.0580.0080.0030.0020.080.050.00150.00050.1100.0350.060.04
20060.050.020.1020.0410.0080.0050.0780.0140.070.040.22000.17000.1300.0480.060.01
20070.030.020.0050.0040.0060.0060.0010.0010.050.020.00200.00100.1000.0270.440.31
20080.040.020.0100.0030.0160.0020.0030.0010.140.130.00210.00120.1500.0370.370.28
20090.030.020.0100.0090.0030.0010.0170.0020.050.030.01190.01180.1500.0400.650.23
20100.030.010.0080.0020.0090.0090.0120.0040.020.010.00280.00110.0900.0232.311.66
20110.030.010.0060.0060.0060.0050.0030.0020.010.010.00220.00080.1200.0291.010.27
20120.020.020.0050.0050.0040.0030.0060.0050.010.010.00070.00020.1900.0570.120.06
20130.020.010.0080.0070.0020.0010.0010.0010.020.010.00540.00520.1300.0360.110.09
20140.100.010.0090.0010.0060.0050.0010.0010.010.010.00310.00300.1800.4300.370.07
20150.070.010.0120.0020.0040.0020.0010.0010.030.010.00690.00160.2200.0622.480.88
20160.030.030.0360.0060.0400.0260.0170.0030.040.030.01090.00170.2000.0562.440.82
20170.010.010.0030.0030.0200.0200.0030.0020.010.010.00380.00280.1800.0436.442.19

Appendix B

Table A2. An example of two annual angling reports from two very different fishing sites: a large popular fishing site on the Elbe River.
The ID of Fishing Site The Name of Fishing SiteArea [ha]
401038Elbe River162
Fish SpeciesCatch [Individual Fish]Yield [kg]
carp50865696
tench1820
bream681762
chub56
perch568636
barbel00
nase00
vimba bream00
pike223250
zander811908
European catfish205230
European eel3236
brown trout11
rainbow trout2528
grayling00
brook trout00
asp1213
whitefish00
common huchen00
grass carp209234
silver carp33
crucian carp1213
burbot00
other fish species12531403
Total914410,241
ParametersValue
Catches per ha [individual fish]44.12
Yield per ha [kg]48.18
The number of individual anglers2135
The number of anglers that caught at least one fish2011
The number of all angler visits12,853
The number of visits per angler6.12
Catches per angler [individual fish]2.88
Yield per angler [kg]3.12
The number of visits per ha127.14
The number of angler guard notes in all angling logbooks623
Table A3. An example of two annual angling reports from two very different fishing sites: a small and a less popular fishing site on the Chotýšanka stream.
The ID of Fishing SiteThe Name of Fishing SiteArea [ha]
413048Chotýšanka Stream2
Fish SpeciesCatch [Individual Fish]Yield [kg]
carp00.0
tench00.0
bream00.0
chub00.0
perch00.0
barbel00.0
nase00.0
vimba bream00.0
pike00.0
zander00.0
European catfish00.0
European eel00.0
brown trout123.5
rainbow trout62.3
grayling00.0
brook trout10.3
asp00.0
whitefish00.0
common huchen00.0
grass carp00.0
silver carp00.0
crucian carp00.0
burbot00.0
other fish species00.0
Total86.1
ParametersValue
Catches per ha [individual fish]12.00
Yield per ha [kg]2.88
The number of individual anglers6
The number of anglers that caught at least one fish3
The number of all angler visits21
The number of visits per angler6.5
Catches per angler [individual fish]1.5
Yield per angler [kg]0.5
The number of visits per ha11
The number of angler guard notes in all angling logbooks1

Appendix C

Table A4. An example of a fishing permit.
The Fishing Permit
The ID of Fishing Site Validity Dates (from-to)Name, SurnameIssued byThe Date of Issue
4110511 January 2012–31 December 2012Karel DubPrague 41.1.2012
Table A5. A report of killed fish.
The Report of the Killed Fish
The DateThe ID of Fishing SiteSpeciesNumberWeight [kg]Size [cm]
9 June 2013411051common carp12.952
15 June 2013411051common carp12.161
16 August 2013411058pikeperch12.452
25 August 2013411062pikeperch12.865
16 September 2013411062European catfish19.892
9 September 2013411062pike12.846
16 October 2013411062Vimba bream10.637
Table A6. A summary of killed fish for the whole year.
Summary of Killed Fish for the Whole Year
Common CarpEuropean Catfish
The ID of Fishing SiteThe Name of Fishing SiteCatches [n]The Total Weight [kg]Catches [n]The Total Weight [kg]
411088Elbe2624.1112.6
411088Elbe 26818.721.6

Appendix D

Table A7. The harvest rates of the studied fish species in comparison to the overall fish harvest over the years 2005–2017.
SpeciesHarvested Fish (n)Harvested Fish (kg)Harvested Fish (kg) per Effort per ha The Size of Harvested Fish (kg)
barbel30,22655,4380.00811.83
nase31,43310,4740.00150.33
vimba bream99,78841,5450.00610.42
European catfish21,475237,3310.034711.05
all fish species12,925,86714,906,2952.17801.15

References

  1. Copp, G.H.; Robert Britton, J.; Cucherousset, J.; García-Berthou, E.; Kirk, R.; Peeler, E.; Stakėnas, S. Voracious invader or benign feline? A review of the environmental biology of European catfish Silurus glanis in its native and introduced ranges. Fish Fish. 2009, 10, 252–282. [Google Scholar] [CrossRef]
  2. Britton, J.R.; Cucherousset, J.; Davies, G.D.; Godard, M.J.; Copp, G.H. Non-native fishes and climate change: Predicting species responses to warming temperatures in a temperate region. Freshw. Biol. 2010, 55, 1130–1141. [Google Scholar] [CrossRef]
  3. Cucherousset, J.; Horky, P.; Slavík, O.; Ovidio, M.; Arlinghaus, R.; Boulêtreau, S.; Britton, R.; García-Berthou, E.; Santoul, F. Ecology, behaviour and management of the European catfish. Rev. Fish Biol. Fisher 2018, 28, 177–190. [Google Scholar] [CrossRef] [Green Version]
  4. Cerri, J.; Ciappelli, A.; Lenuzza, A.; Zaccaroni, M.; Nocita, A. Recreational angling as a vector of freshwater invasions in Central Italy: Perceptions and prevalence of illegal fish restocking. Knowl. Manag. Aquat. Ec. 2018, 419, 38. [Google Scholar] [CrossRef]
  5. Vejřík, L.; Vejříková, I.; Kočvara, L.; Blabolil, P.; Peterka, J.; Sajdlová, Z.; Jůza, T.; Šmejkal, M.; Kolařík, T.; Bartoň, D.; et al. The pros and cons of the invasive freshwater apex predator, European catfish Silurus glanis, and powerful angling technique for its population control. J. Environ. Manag. 2019, 241, 374–382. [Google Scholar] [CrossRef]
  6. FAO. The State of World Fisheries and Aquaculture—2010 (SOFIA); Food and Agriculture Organisation of the United Nations (FAO): Rome, Italy, 2010. [Google Scholar]
  7. Suter, W. Are Cormorants Phalacrocorax carbo wintering in Switzerland approaching carrying capacity? An analysis of increase patterns and habitat choice. Ardea 1995, 83, 255–266. [Google Scholar]
  8. Dudgeon, D.; Arthington, A.H.; Gessner, M.O.; Kawabata, Z.I.; Knowler, D.J.; Lévêque, C.; Nailman, R.J.; Prieur-Richard, A.H.; Soto, D.; Stiassn, M.L.J.; et al. Freshwater biodiversity: Importance, threats, status and conservation challenges. Biol. Rev. 2006, 81, 163–182. [Google Scholar] [CrossRef]
  9. Lajus, J.; Kraikovski, A.; Lajus, D. Coastal Fisheries in the Eastern Baltic Sea (Gulf of Finland) and Its Basin from the 15 to the Early 20th Centuries. PLoS ONE 2013, 8, e77059. [Google Scholar] [CrossRef]
  10. Piria, M.; Simonović, P.; Zanella, D.; Ćaleta, M.; Šprem, N.; Paunović, M.; Tornjanovic, T.; Gavrilovic, A.; Pecina, M.; Spelic, I.; et al. Long-term analysis of fish assemblage structure in the middle section of the Sava River—The impact of pollution, flood protection and dam construction. Sci. Total Environ. 2019, 651, 143–153. [Google Scholar] [CrossRef]
  11. Lyach, R. The effect of fishing effort, fish stocking, and population density of overwintering cormorants on the harvest and recapture rates of three rheophilic fish species in central Europe. Fish Res. 2020, 223, 105440. [Google Scholar] [CrossRef]
  12. Van Poorten, B.T.; Post, J.R. Seasonal fishery dynamics of a previously unexploited rainbow trout population with contrasts to established fisheries. N. Am. J. Fish Manag. 2005, 25, 329–345. [Google Scholar] [CrossRef]
  13. Jankovský, M.; Boukal, D.S.; Pivnička, K.; Kubečka, J. Tracing possible drivers of synchronously fluctuating species catches in individual logbook data. Fish. Manag. Ecol. 2011, 18, 297–306. [Google Scholar] [CrossRef]
  14. Askey, P.J.; Johnston, N.T. Self-regulation of the Okanagan Lake kokanee recreational fishery: Dynamic angler effort response to varying fish abundance and productivity. N. Am. J. Fish Manag. 2013, 33, 926–939. [Google Scholar] [CrossRef]
  15. Matsumura, S.; Beardmore, B.; Haider, W.; Dieckmann, U.; Arlinghaus, R. Ecological, angler, and spatial heterogeneity drive social and ecological outcomes in an integrated landscape model of freshwater recreational fisheries. Rev. Fish Sci. Aquac. 2019, 27, 170–197. [Google Scholar] [CrossRef]
  16. Wiley, R.W.; Whaley, R.A.; Satake, J.B.; Fowden, M. Assessment of stocking hatchery trout: A Wyoming perspective. N. Am. J. Fish Manag. 1993, 13, 160–170. [Google Scholar] [CrossRef]
  17. Snow, R.A.; Shoup, D.E.; Porta, M.J.; Patterson, C.P. Effects of Wintertime Stocking of Rainbow Trout on the Forage Community of an Oklahoma Impoundment. N. Am. J. Fish Manag. 2019, 39, 289–298. [Google Scholar] [CrossRef]
  18. Vostradovský, J.; Pivnička, K.; Čihař, M.; Poupě, J. Species diversity, abundance, biomass and yield of fishes in the Elbe River and its tributaries. Bohem. Cent. 1995, 23, 121–127. [Google Scholar]
  19. Lyach, R.; Remr, J. Changes in recreational catfish Silurus glanis harvest rates between years 1986–2017 in Central Europe. J. Appl. Ichthyol. 2019, 35, 1094–1104. [Google Scholar] [CrossRef]
  20. Tonolla, D.; Bruder, A.; Schweizer, S. Evaluation of mitigation measures to reduce hydropeaking impacts on river ecosystems–a case study from the Swiss Alps. Sci. Total Environ. 2017, 574, 594–604. [Google Scholar] [CrossRef]
  21. Keckeis, H.; Kamler, E.; Bauer-Nemeschkal, E.; Schneeweiss, K. Survival, development and food energy partitioning of nase larvae and early juveniles at different temperatures. J. Fish Biol. 2001, 59, 45–61. [Google Scholar] [CrossRef]
  22. Bekcan, S.; Dogankaya, L.; Cakirogullari, G.C. Growth and body composition of European catfish (Silurus glanis L.) fed diets containing different percentages of protein. Isr. J. Aquacult.-Bamid. 2006, 58, 137–142. [Google Scholar]
  23. Hamáčková, J.; Prokeš, M.; Kozák, P.; Peňáz, M.; Stanny, L.A.; Policar, T.; Baruš, V. Growth and development of vimba bream (Vimba vimba) larvae in relation to feeding duration with live and/or dry starter feed. Aquaculture 2009, 287, 158–162. [Google Scholar] [CrossRef]
  24. Kamiński, R.; Wolnicki, J.; Sikorska, J.; Garcia, V. Effects of temperature on growth, survival and body composition in larvae of barbel, Barbus barbus (L.). Aquacult. Int. 2013, 21, 829–841. [Google Scholar] [CrossRef]
  25. R Core Team. R: A Language and Environment for Statistical Computing; R Foundation for Statistical Computing: Vienna, Austria, 2020; Available online: http://www.R-project.org/ (accessed on 1 September 2021).
  26. Hadfield, J.D. MCMC Methods for Multi-Response Generalized Linear Mixed Models: The MCMCglmm R Package. J. Stat. Softw. 2010, 33, 1–22. [Google Scholar] [CrossRef] [Green Version]
  27. Bates, D.; Maechler, M.; Bolker, B.; Walker, S. Fitting Linear Mixed-Effects Models Using lme4. J. Stat. Softw. 2015, 67, 1–48. [Google Scholar] [CrossRef]
  28. Nakagawa, S.; Johnson, P.C.; Schielzeth, H. The coefficient of determination R 2 and intra-class correlation coefficient from generalized linear mixed-effects models revisited and expanded. J. R. Soc. Interface 2017, 14, 213–217. [Google Scholar] [CrossRef] [Green Version]
  29. Zuur, A.F.; Ieno, E.N.; Elpick, C.S. A protocol for data exploration to avoid common statistical problems. Methods Ecol. Evol. 2010, 1, 3–14. [Google Scholar] [CrossRef]
  30. Quinn, G.P.; Keough, M.J. Experimental Design and Data Analysis for Biologists; Cambridge University Press: Cambridge, UK, 2002. [Google Scholar]
  31. Coelho, R.; Infante, P.; Santos, M.N. Comparing GLM, GLMM, and GEE modeling approaches for catch rates of bycatch species: A case study of blue shark fisheries in the South Atlantic. Fish Oceanogr. 2020, 29, 169–184. [Google Scholar] [CrossRef]
  32. Humpl, M.; Pivnička, K.; Jankovský, M. Sport fishery statistics, water quality, and fish assemblages in the Berounka River in 1975–2005. Folia Zool. 2009, 58, 457–465. [Google Scholar]
  33. Boukal, D.S.; Jankovský, M.; Kubečka, J.; Heino, M. Stock-catch analysis of carp recreational fisheries in Czech reservoirs: Insights into fish survival, water body productivity and impact of extreme events. Fish Res. 2012, 119–120, 23–32. [Google Scholar] [CrossRef]
  34. Lyach, R. The effect of a large-scale angling restriction in minimum angling size on harvest rates, recapture rates, and average body weight of harvested common carps Cyprinus carpio. Fish. Res. 2020, 223, 105438. [Google Scholar] [CrossRef]
  35. Lyach, R.; Remr, J. Does harvest of the European grayling, Thymallus thymallus (actinopterygii: Salmoniformes: Salmonidae), change over time with different intensity of fish stocking and fishing effort? Acta Ichthyol. Piscat. 2020, 50, 53–62. [Google Scholar] [CrossRef] [Green Version]
  36. Musil, P.; Janda, J.; Denie, H. Changes in Abundance and Selection of Foraging Habitat in Cormorants Phalacrocorax-Carbo in South Bohemia (Czech-Republic). Ardea 1995, 83, 247–253. [Google Scholar]
  37. Rees, E.A.; Edmonds-Brown, V.R.; Alam, M.F.; Wright, R.M.; Britton, J.R.; Davies, G.D.; Cowx, I.G. Socio-economic drivers of specialist anglers targeting the non-native European catfish (Silurus glanis) in the UK. PLoS ONE 2017, 12, e0178805. [Google Scholar] [CrossRef] [PubMed] [Green Version]
  38. Andersen, K.H.; Marty, L.; Arlinghaus, R. Evolution of boldness and life history in response to selective harvesting. Can. J. Fish. Aquat. Sci. 2018, 75, 271–281. [Google Scholar] [CrossRef] [Green Version]
  39. Monk, C.T.; Arlinghaus, R. Encountering a bait is necessary but insufficient to explain individual variability in vulnerability to angling in two freshwater benthivorous fish in the wild. PLoS ONE 2017, 12, e0173989. [Google Scholar] [CrossRef]
  40. Rosengren, M.; Kvingedal, E.; Näslund, J.; Johnsson, J.I.; Sundell, K. Born to be wild: Effects of rearing density and environmental enrichment on stress, welfare, and smolt migration in hatchery-reared Atlantic salmon. Can. J. Fish. Aquat. Sci. 2017, 74, 396–405. [Google Scholar] [CrossRef] [Green Version]
  41. Sundström, L.F.; Petersson, E.; Höjesjö, J.; Johnsson, J.I.; Järvi, T. Hatchery selection promotes boldness in newly hatched brown trout (Salmo trutta): Implications for dominance. Behav. Ecol. 2004, 15, 192–198. [Google Scholar] [CrossRef] [Green Version]
  42. Klinard, N.V.; Matley, J.K.; Halfyard, E.A.; Connerton, M.; Johnson, T.B.; Fisk, A.T. Post-stocking movement and survival of hatchery-reared bloater (Coregonus hoyi) reintroduced to Lake Ontario. Freshw. Biol. 2020, 65, 1073–1085. [Google Scholar] [CrossRef]
  43. Larocque, S.M.; Johnson, T.B.; Fisk, A.T. Survival and migration patterns of naturally and hatchery-reared Atlantic salmon (Salmo salar) smolts in a Lake Ontario tributary using acoustic telemetry. Freshw. Biol. 2020, 65, 835–848. [Google Scholar] [CrossRef]
  44. Weber, R.E.; Weber, M.J. Behaviour and survival of wild versus stocked fingerling walleye. Fish. Manag. Ecol. 2020, 27, 429–443. [Google Scholar] [CrossRef]
  45. Lyon, J.P.; Tonkin, Z.; Moloney, P.D.; Todd, C.; Nicol, S. Conservation implications of angler misidentification of an endangered fish. Aquat. Conserv. 2018, 28, 1396–1402. [Google Scholar] [CrossRef]
  46. Lai, E.K.; Mueller, U.; Hyndes, G.A.; Ryan, K.L. Comparing estimates of catch and effort for boat-based recreational fishing from aperiodic access-point surveys. Fish. Res. 2019, 219, 105305. [Google Scholar] [CrossRef]
  47. Essig, R.J.; Holliday, M.C. Development of a recreational fishing survey: The marine recreational fishery statistics survey case study. Am. Fish Soc. Symp. 1991, 12, 245–254. [Google Scholar]
  48. Pollock, K.H.; Jones, C.M.; Brown, T.L. Angler Survey Methods and Their Applications in Fisheries Management; American Fisheries Society Special Publication: Bethesda, MD, USA, 1994; p. 371. [Google Scholar]
  49. Mosindy, T.E.; Duffy, M.J. The use of angler diary surveys to evaluate long-term changes in muskellunge populations on Lake of the Woods, Ontario. Environ. Biol. Fish 2007, 79, 71–83. [Google Scholar] [CrossRef]
Figure 1. Map of the study area where the fishing logbooks were collected: highlighted rivers (upper picture) and the highlighted regions of Prague (grey shaded) and the central Bohemia (black shaded) in the Czech Republic (lower picture).
Sustainability 13 11379 g001
Table 1. Results of the models describing the relationship between the fisheries factors and the harvest rates of the three studied rheophilic fish species: Barbel.
Response VariableFixed VariablesEstimate95 CI: Low95 CI: UppSD (Slope)p-Value
Harvest of barbelintercept1.33 × 10−39.11 × 10−42.12 × 10−31.54 × 10−30.03
stocking intensity of barbel1.28 × 10−27.99 × 10−31.54 × 10−27.62 × 10−30.11
size of restocked barbel3.35 × 10−11.81 × 10−14.78 × 10−13.25 × 10−10.30
angling effort−1.61 × 10⁻⁷−1.98 × 10−71.38 × 10−71.76 × 10−70.03
surface area−6.21 × 10⁻²−4.77 × 10⁻²−5.39 × 10−25.14 × 10−10.33
harvest of catfish−4.55 × 10⁻¹−5.25 × 10⁻¹−4.12×10−11.23 × 10−1<0.01
stocking intensity of catfish−7.42 × 10⁻²−8.93 × 10⁻²−4.45 × 10−22.68 × 10−20.01
Additional information on the model: DF = 3 219, R2 = 0.63. Significant factors are in bold. Note: 95 CI = 95% confidence interval, DF = degrees of freedom.
Table 2. Results of the models describing the relationship between the fisheries factors and the harvest rates of the three studied rheophilic fish species: Nase.
Response VariableFixed VariablesEstimate95 CI: Low95 CI: UppSD (Slope)p-Value
Harvest of naseintercept−3.32 × 10⁻⁴−4.12 × 10⁻⁴−3.11 × 10−41.41 × 10−40.02
stocking intensity of nase1.88 × 10−22.32 × 10−21.73 × 10−21.62 × 10−30.16
size of restocked nase−4.41 × 10⁻¹−4.78 × 10⁻¹−3.86 × 10−11.16 × 10−10.22
angling effort−8.51 × 10⁻⁸−8.58 × 10⁻⁸−8.33 × 10−83.89 × 10−80.03
surface area−4.27 × 10⁻¹−3.51 × 10⁻¹−4.91 × 10−11.19 × 10−10.44
harvest of catfish−1.85 × 10⁻²−1.88 × 10⁻²−1.83 × 10−22.24 × 10−20.04
stocking intensity of catfish−1.28 × 10⁻³−1.30 × 10⁻³−1.25 × 10−31.40 × 10−30.04
Additional information on the model: DF = 3 219, R2 = 0.29. Significant factors are in bold. Note: 95 CI = 95% confidence interval, DF = degrees of freedom.
Table 3. Results of the models describing the relationship between the fisheries factors and the harvest rates of the three studied rheophilic fish species: Vimba bream.
Response VariableFixed VariablesEstimate95 CI: Low95 CI: UppSD (Slope)p-Value
Harvest of vimba breamintercept−1.14 × 10⁻⁴−1.27 × 10⁻⁴−8.91 × 10−52.42 × 10−60.01
stocking intensity of vimba bream2.68 × 10−33.11 × 10−32.12 × 10−33.53 × 10−30.46
size of restocked vimba bream9.74 × 10−31.21 × 10−26.88 × 10−31.32 × 10−10.94
angling effort2.25 × 10−82.88 × 10−81.35 × 10−82.92 × 10−80.04
surface area−2.71 × 10⁻¹−2.41 × 10⁻¹−3.41 × 10−12.48 × 10−10.23
harvest of catfish−5.55 × 10⁻²−7.28 × 10⁻²−5.27 × 10−22.42 × 10−20.02
stocking intensity of catfish−4.22 × 10⁻⁴−6.41 × 10⁻⁴−3.48 × 10−42.55 × 10−30.04
Additional information on the model: DF = 3 219, R2 = 0.40. Significant factors are in bold. Note: 95 CI = 95% confidence interval, DF = degrees of freedom.
Publisher’s Note: MDPI stays neutral with regard to jurisdictional claims in published maps and institutional affiliations.

