1. Introduction
With increasing urbanization, the number of highly dense megacities climbs [
1]. The resulting growth in production and consumption in cities increases demand for urban freight transport [
1]. As a solution, app-based platform technologies that facilitate crowd-shipping form an emerging service that connects supply (i.e., delivery couriers) with demand (i.e., customers) [
2]. For example, the market of on-demand meal delivery platforms such as Grubhub (
www.Grubhub.com, accessed on 5 February 2021) and Eat24 (
www.eat24.com accessed on 5 February 2021) is increasing and generated a revenue of US
$107.4 billion worldwide in 2019 [
3] and Domino’s Pizza Inc. delivers more than a million orders per day [
3]. On-demand meal delivery can be divided into platform-to-customer delivery such as Deliveroo and restaurant-to-customer delivery such as Domino’s. The latter service can either be provided by the restaurant itself as with Domino’s or restaurants can outsource the delivery service to aggregator platforms such as Delivery Hero and Just Eat [
3]. However, the expectation of customers to receive the order in less than an hour and only a few minutes after it has been cooked [
4], makes consolidation of deliveries difficult, which increases the vehicle kilometer travelled (VKT) and the occupied road space.
The delivery process usually follows the following process: The online platform receives an order and sends a delivery request to couriers who meet specific criteria (e.g., close geographical proximity, good ratings). Then the courier, who accepted the delivery request, picks up the order and deliveries it to the customer. Sometimes multiple deliveries are combined into one delivery tour.
On-demand meal providers, who commonly rely on crowdsourced delivery couriers (e.g., bicycle couriers), show an increasing interest in shared sidewalk autonomous delivery robots (SADRs). Companies that are testing/have tested SADRs for on-demand meal delivery include Domino’s Pizza Inc, Starship Technologies, Dispatch, Marble (partnering with Yelp and Eat24), and Thyssenkrupp (partnering with TeleRetail) [
5]. SADRs have been used successfully in other industries such as hospitals to deliver drugs [
6], garbage collection systems [
7], and parcel delivery [
8]. While the benefits of using SADRs for on-demand meal delivery services include cheaper delivery costs, faster delivery times [
5] and reduced energy consumption [
9], the drawbacks include limited range [
10], and safety concerns [
5]. SADRs are problematic given that they can be an obstacle for pedestrians, and they can become a deadly projectile when they are hit by a car [
5]. SADRs don’t fit into existing vehicle categories and therefore cause legislative gaps [
11]. There is generally a lack of regulations for SADRs in the U.S. [
5]. Most regulations ensure that SADRs must yield to pedestrians. Whether SADRs have to yield to cyclists, have insurance, braking systems or lights varies [
5]. Additionally, weight limits, maximum speed, allowed technology, and co-existing common rules (i.e., traffic rules, carrying of hazardous materials, etc.) change depending on the regulation [
11].
Regulating parking of mobility services (e.g., ride hailing, micromobility) and delivery services (e.g., on-demand meal delivery) has been a major challenge in cities due to the difference in parking behavior compared with private motor vehicles [
12]. The inconsiderate parking of shared dockless bicycles and scooters is one of the biggest problems caused by micromobility [
13] in cities. They impede pedestrian and wheelchair travel [
12], are a tripping hazard [
12], block bus stops [
14], and park on tactile guidance systems [
15] and footpaths [
15]. Cities were suddenly faced with the challenge of removing illegally parked or abandoned shared bicycles and scooters, which caused additional costs [
15]. Ride-hailing services and commercial vehicles are found to disproportionally double park or block driveways and bike lanes [
12] causing not only congestion but also safety hazards [
12]. One of the main concerns raised by the deployment of autonomous vehicles is that parking pricing has an opposite effect on autonomous vehicles than on traditional vehicles: While parking pricing is seen as a key option to disincentivize private car usage, parking charges could incentivize autonomous vehicles to drive around without passengers [
16]. Autonomous vehicles can avoid parking charges by driving to a remote but free parking spot after the customer has been dropped off. Even worse, they could keep moving as fuel costs are usually only a fraction of parking charges [
16].
In recent years, policymakers have started to regulate these new forms of mobility. For example, some cities banned dockless bike-sharing systems [
14,
17], some cities started regulating free-floating bike sharing [
15] (e.g., Vienna, Singapore, Tianjin, China, Melbourne, Amsterdam, and Seattle) and implemented parking infrastructures such as geo-fences, electric fences, and corrals [
13]. Early research shows that parking violations are rare in streets with these types of parking facilities [
12]. Also, loading bays [
12] and other forms of delivery bay management have been suggested to organize curb site demand [
18]. However, regulations for the parking of autonomous delivery vehicles such as SADRs are still limited but required to ensure that cities can accommodate these new mobility and delivery services.
Most measures evaluating the environmental performance of urban freight focus on emissions [
19]. However, reducing land consumption [
20] as well as increasing land use efficiency [
21] is increasingly a key objective for policymakers. With increasing congestion, parking pressure, housing shortages, and increasing urbanization, it is crucial to use space effectively in cities. Given that every square meter devoted to streets and parking locations is lost for other purposes such as housing and parks, it is important to optimize transport activities so that they require the least amount of space.
Overall, increasing the efficiency of land usage in cities is beneficial from a sustainability viewpoint. This could be achieved by optimizing the parking policies of mobility services or by new delivery methods. Parking, and especially off-street parking, is seen as hostile to pedestrians and reduces available land for more useful investment [
22]. Hence, it is crucial to optimize both the moving and parking of vehicles to maximize the sustainability of a city.
Most papers evaluating autonomous vehicles compare the parking requirements and the VKT of autonomous vehicles separately. This is problematic for the evaluation of autonomous vehicles as they can avoid parking by continuing to drive. This paper overcomes this problem by applying the land consumption evaluation methodology developed by Schnieder et al. [
23] which combines the legally required area for parking and moving of a transport unit into a single metric. Traditional measures used to evaluate traffic such as VKT, traffic volume or the number of parking spaces cannot be used to assess the land consumption fairly given that, for example, traveling by car requires more space than by bicycle at any given time. However, travel by car can sometimes be quicker. Thus, the area is occupied for a shorter time [
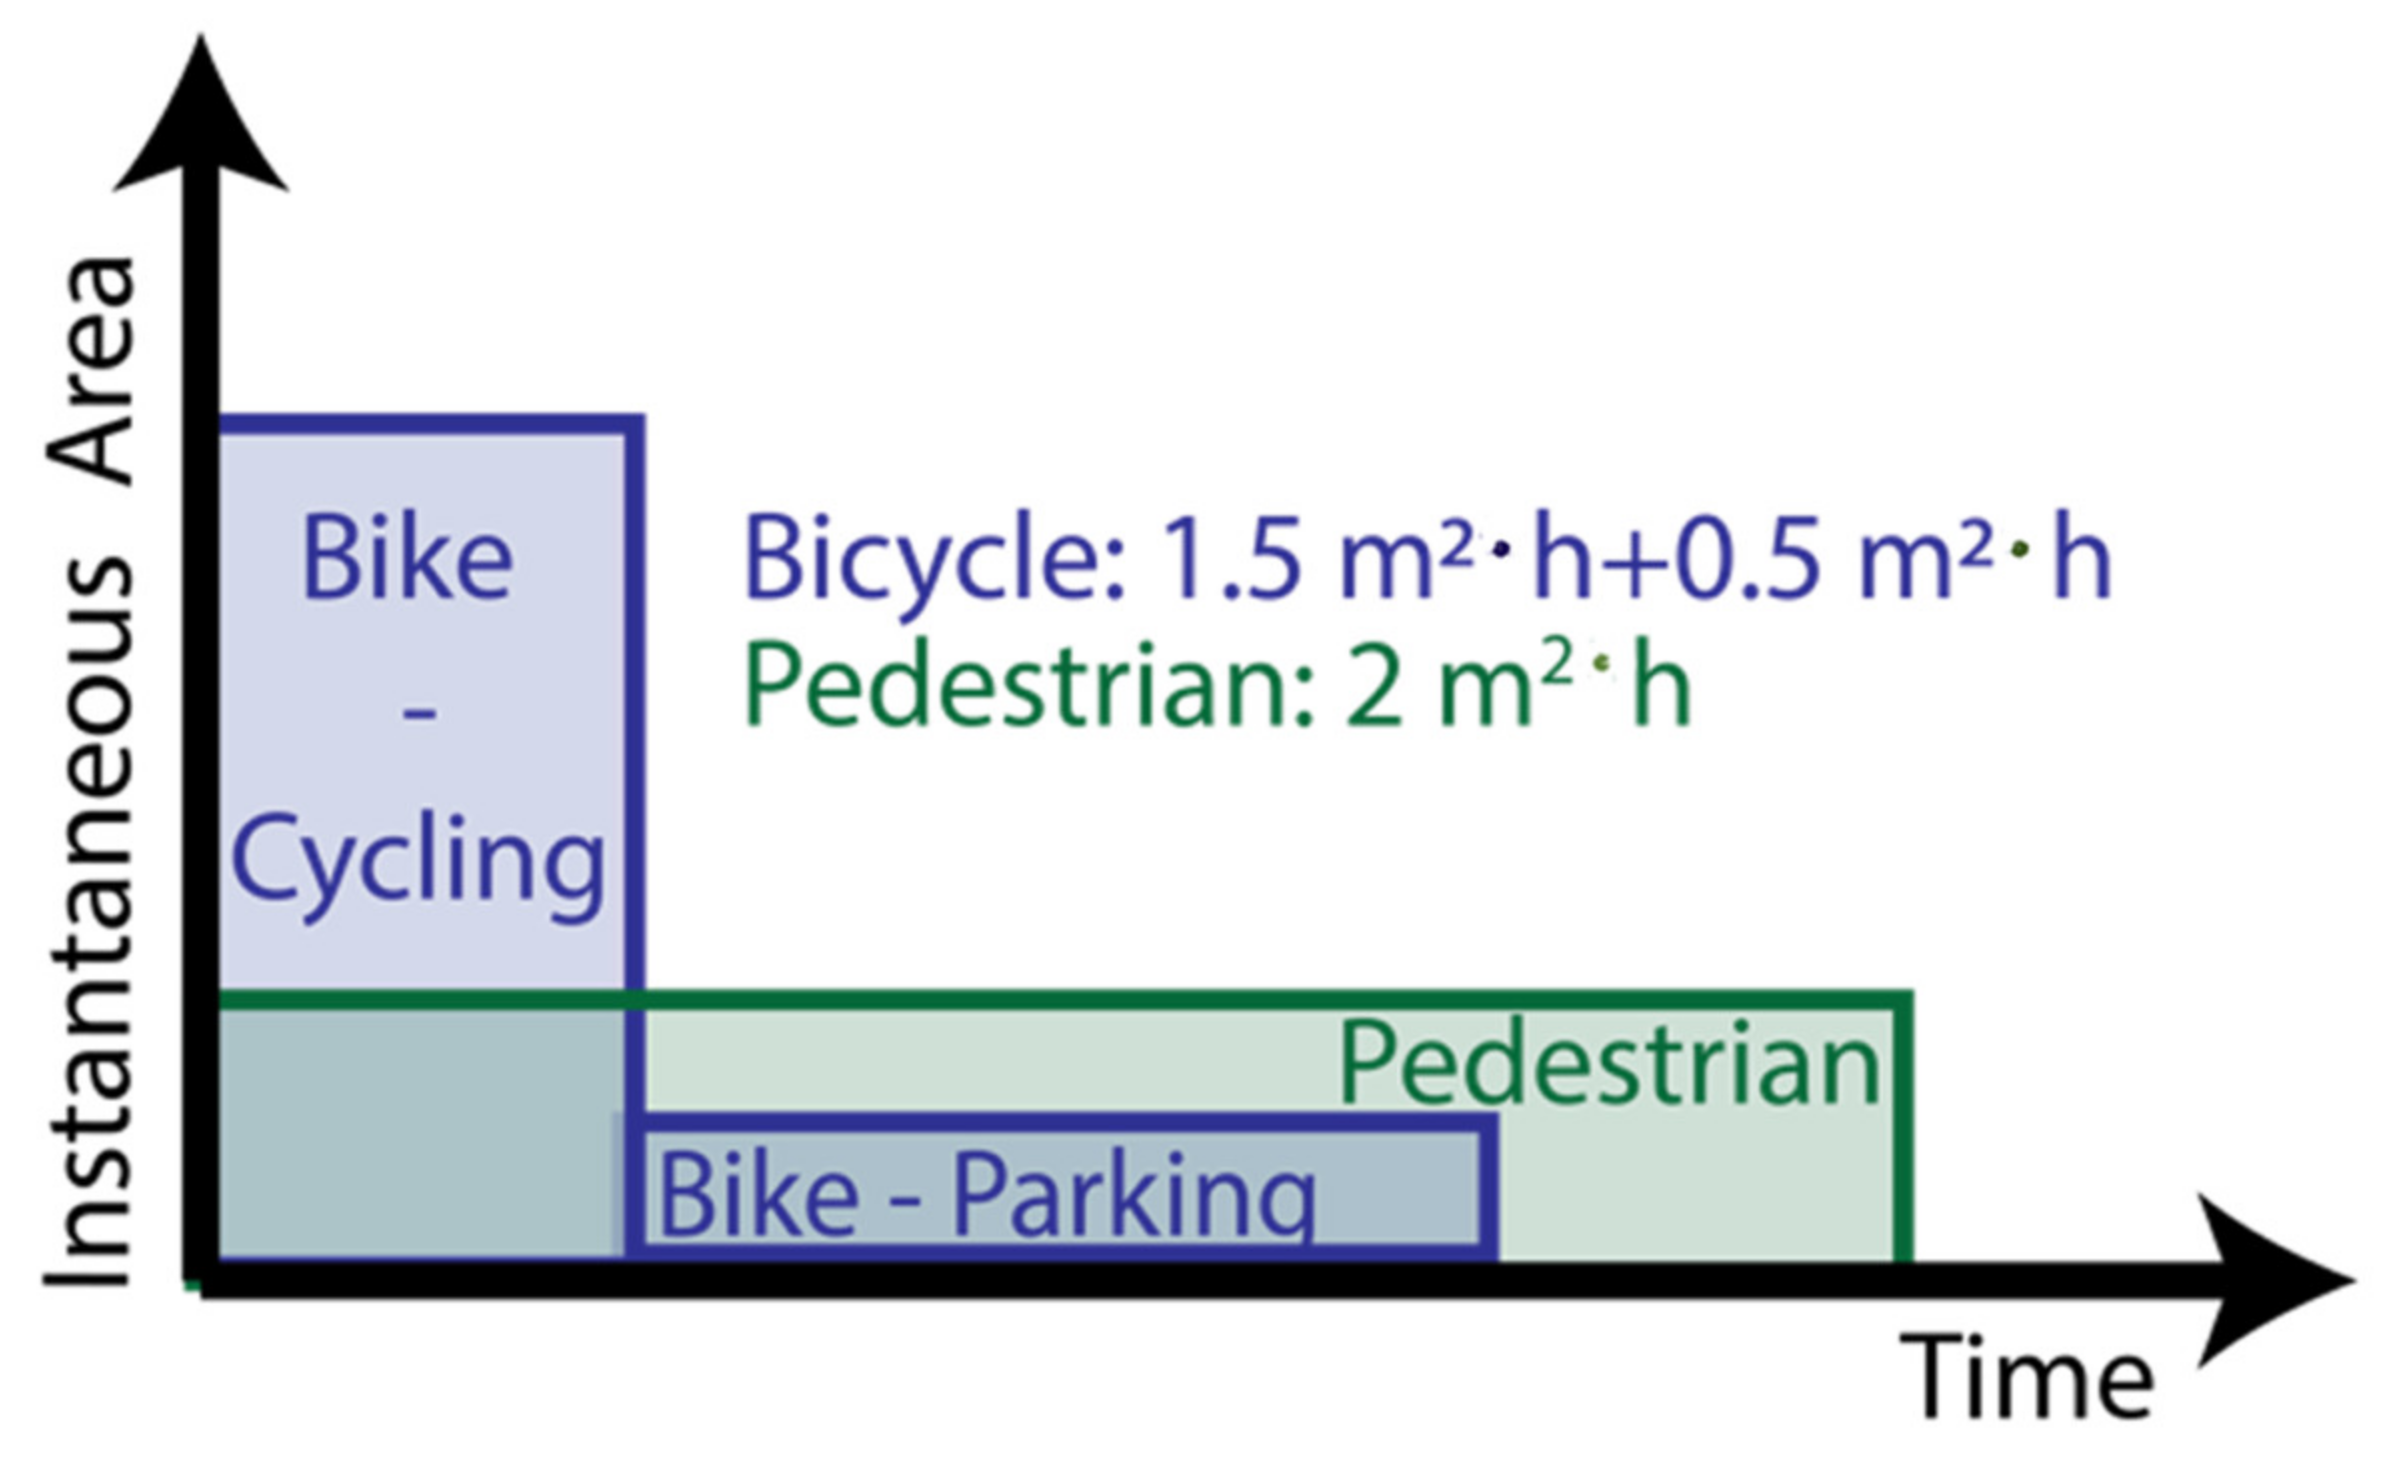
23]. The time-area concept addresses this problem, by measuring the “ground area consumed for movement and storage of vehicles, as well as the amount of time for which the area is consumed” Bruun et al. [
24]. In simple terms, the required area is multiplied by the duration for which it is occupied. The reader is referred to Schnieder et al. [
23] for a more detailed overview of the time-area concept. The concept of combining time and area is easy to understand when comparing parking requirements: 3 cars parked for one hour requires the same time-area as 1 car parked for 3 h [
23].
The contribution of this paper is to adapt the evaluation method developed by Schnieder et al. [
23] to assess the land use of on-demand meal delivery services. Therefore, operating strategies (i.e., shared fleets vs. fleets operated by a restaurant), parking policies (i.e., parking at restaurants, parking at customers, no parking), and scheduling options (i.e., direct delivery vs. tour-based delivery) are simulated and evaluated based on their time-area requirements. The method has been applied to a case study of on-demand meal delivery in New York City (NYC). Additionally, the time-area requirements of on-demand meal delivery trips in the UK are calculated using GPS traces instead of a simulation.
The paper is structured as follows: At first, the relevant literature is reviewed with a focus on external effects, the time-area concept and on-demand meal delivery simulations. Then the methodology for the first study, which uses GPS traces of on-demand meal delivery trips in Loughborough and Liverpool (UK), is explained. Afterwards, the methods of the second and the third study are explained. Both are simulations of on-demand meal delivery services in NYC. The second study simulates various operating strategies (i.e., shared fleets and fleets operated by restaurants) and parking policies (i.e., parking at the restaurant, parking at the customer or no parking) and the third study simulates scheduling options (i.e., one meal per vehicle, multiple meals per vehicle). Next, the calculation of the time-area is explained. Finally, the results are presented and discussed.
3. Methods
This paper covers three studies: one real-world case study and two simulations. The first study (i.e., the real-world case study) uses GPS traces of on-demand meal delivery trips by UberEats and Deliveroo riders in Loughborough and Liverpool (UK). The second study compares the time-area requirement of on-demand meal delivery of bicycle couriers with SADRs in NYC applying various parking policies and operating strategy changes. The simulation is applied to various operating area sizes and various waiting times (i.e., utilization). The third study simulates only one operating area size and compares scheduling options (i.e., direct vs. tour-based delivery) in NYC. In the second study, the customers can order a meal from any of the 150 restaurants, while in the third study, the customer orders the meal from a specific restaurant. The simulations can be divided into 3 steps: (1) demand/ order list creation, (2) routing/scheduling, (3) time-area calculation.
3.1. Study 1: GPS Traces (Loughborough/Liverpool)
GPS traces of twelve delivery tours with a total length of 25 h and 328 km have been recorded by a Deliveroo and UberEats courier. Three recordings took place in Loughborough, UK between Sunday the 13th of June and Tuesday the 15th of June 2021 during lunch time or dinner time. Sometimes only half of the shift has been recorded due to the battery running low. Nine recordings of full delivery shifts took place in Liverpool, UK between Tuesday the 20th of July and Saturday the 24 July 2021. In most cases, two recordings have been conducted each day (i.e., lunch time approximately at 12.00–14.30, dinner time at approximately 18.00–20.00, and until 21.30 on Friday and Saturday). A survey has been conducted of two delivery couriers who each work around 30 h per week. The couriers stated that the way they deliver meals varies. They sometimes pick up a meal at one restaurant and deliver it to the customer before picking up another meal. Other times they pick up multiple meals from a restaurant at the same time and deliver them to multiple customers afterward. Recently, it has become possible to pick up meals from multiple restaurants and deliver them to multiple customers.
3.2. Study 2: Policy and Operating Strategies (Simulation, NYC)
A list of orders has been created by a binomial random number generator, based on a dataset of on-demand meal delivery statistics in New York City [
55], a list of all addresses in NYC [
56], and the population density [
57]. Survey data has been chosen given that on-demand meal delivery companies are generally reluctant to share trip data [
53]. The simulation is performed in python using libraries including seaborn [
58] and matplotlib [
59] for the graphics. QGIS has been used to compile the raw datasets [
60]. The location of Citi bike sharing stations has been used as the location of restaurants [
61]. Bike sharing stations have been chosen as they are strategically placed in the city and offer easy access by foot and by bike. The density of bike sharing stations is higher in the city center and reduces further outside, which is the same for restaurants. For example, the density of bike sharing station is on average twice as high in Manhattan Core than in Inner Brooklyn. The study includes ten operating areas around the center point of 40.764940, −73.977080. Each operating area covers 0.00457 degrees (~0.55 km) further to the east and west and 0.00455 (~0.7 km) to the north and south than the next smaller one (
Table 3).
A dataset with 150 addresses of customers receiving on-demand meal deliveries and 150 restaurants for each of the 100 simulations for every operating area have been randomly selected. The closest restaurant for each customer has been determined as a possible parking spot to wait for the next order. One hundred and fifty trips per simulation have been chosen as this is representative of 1.3 to 24 days’ worth of orders depending on the operating area, vehicle, and average waiting time. One transport unit is able to fulfill only one order at a time.
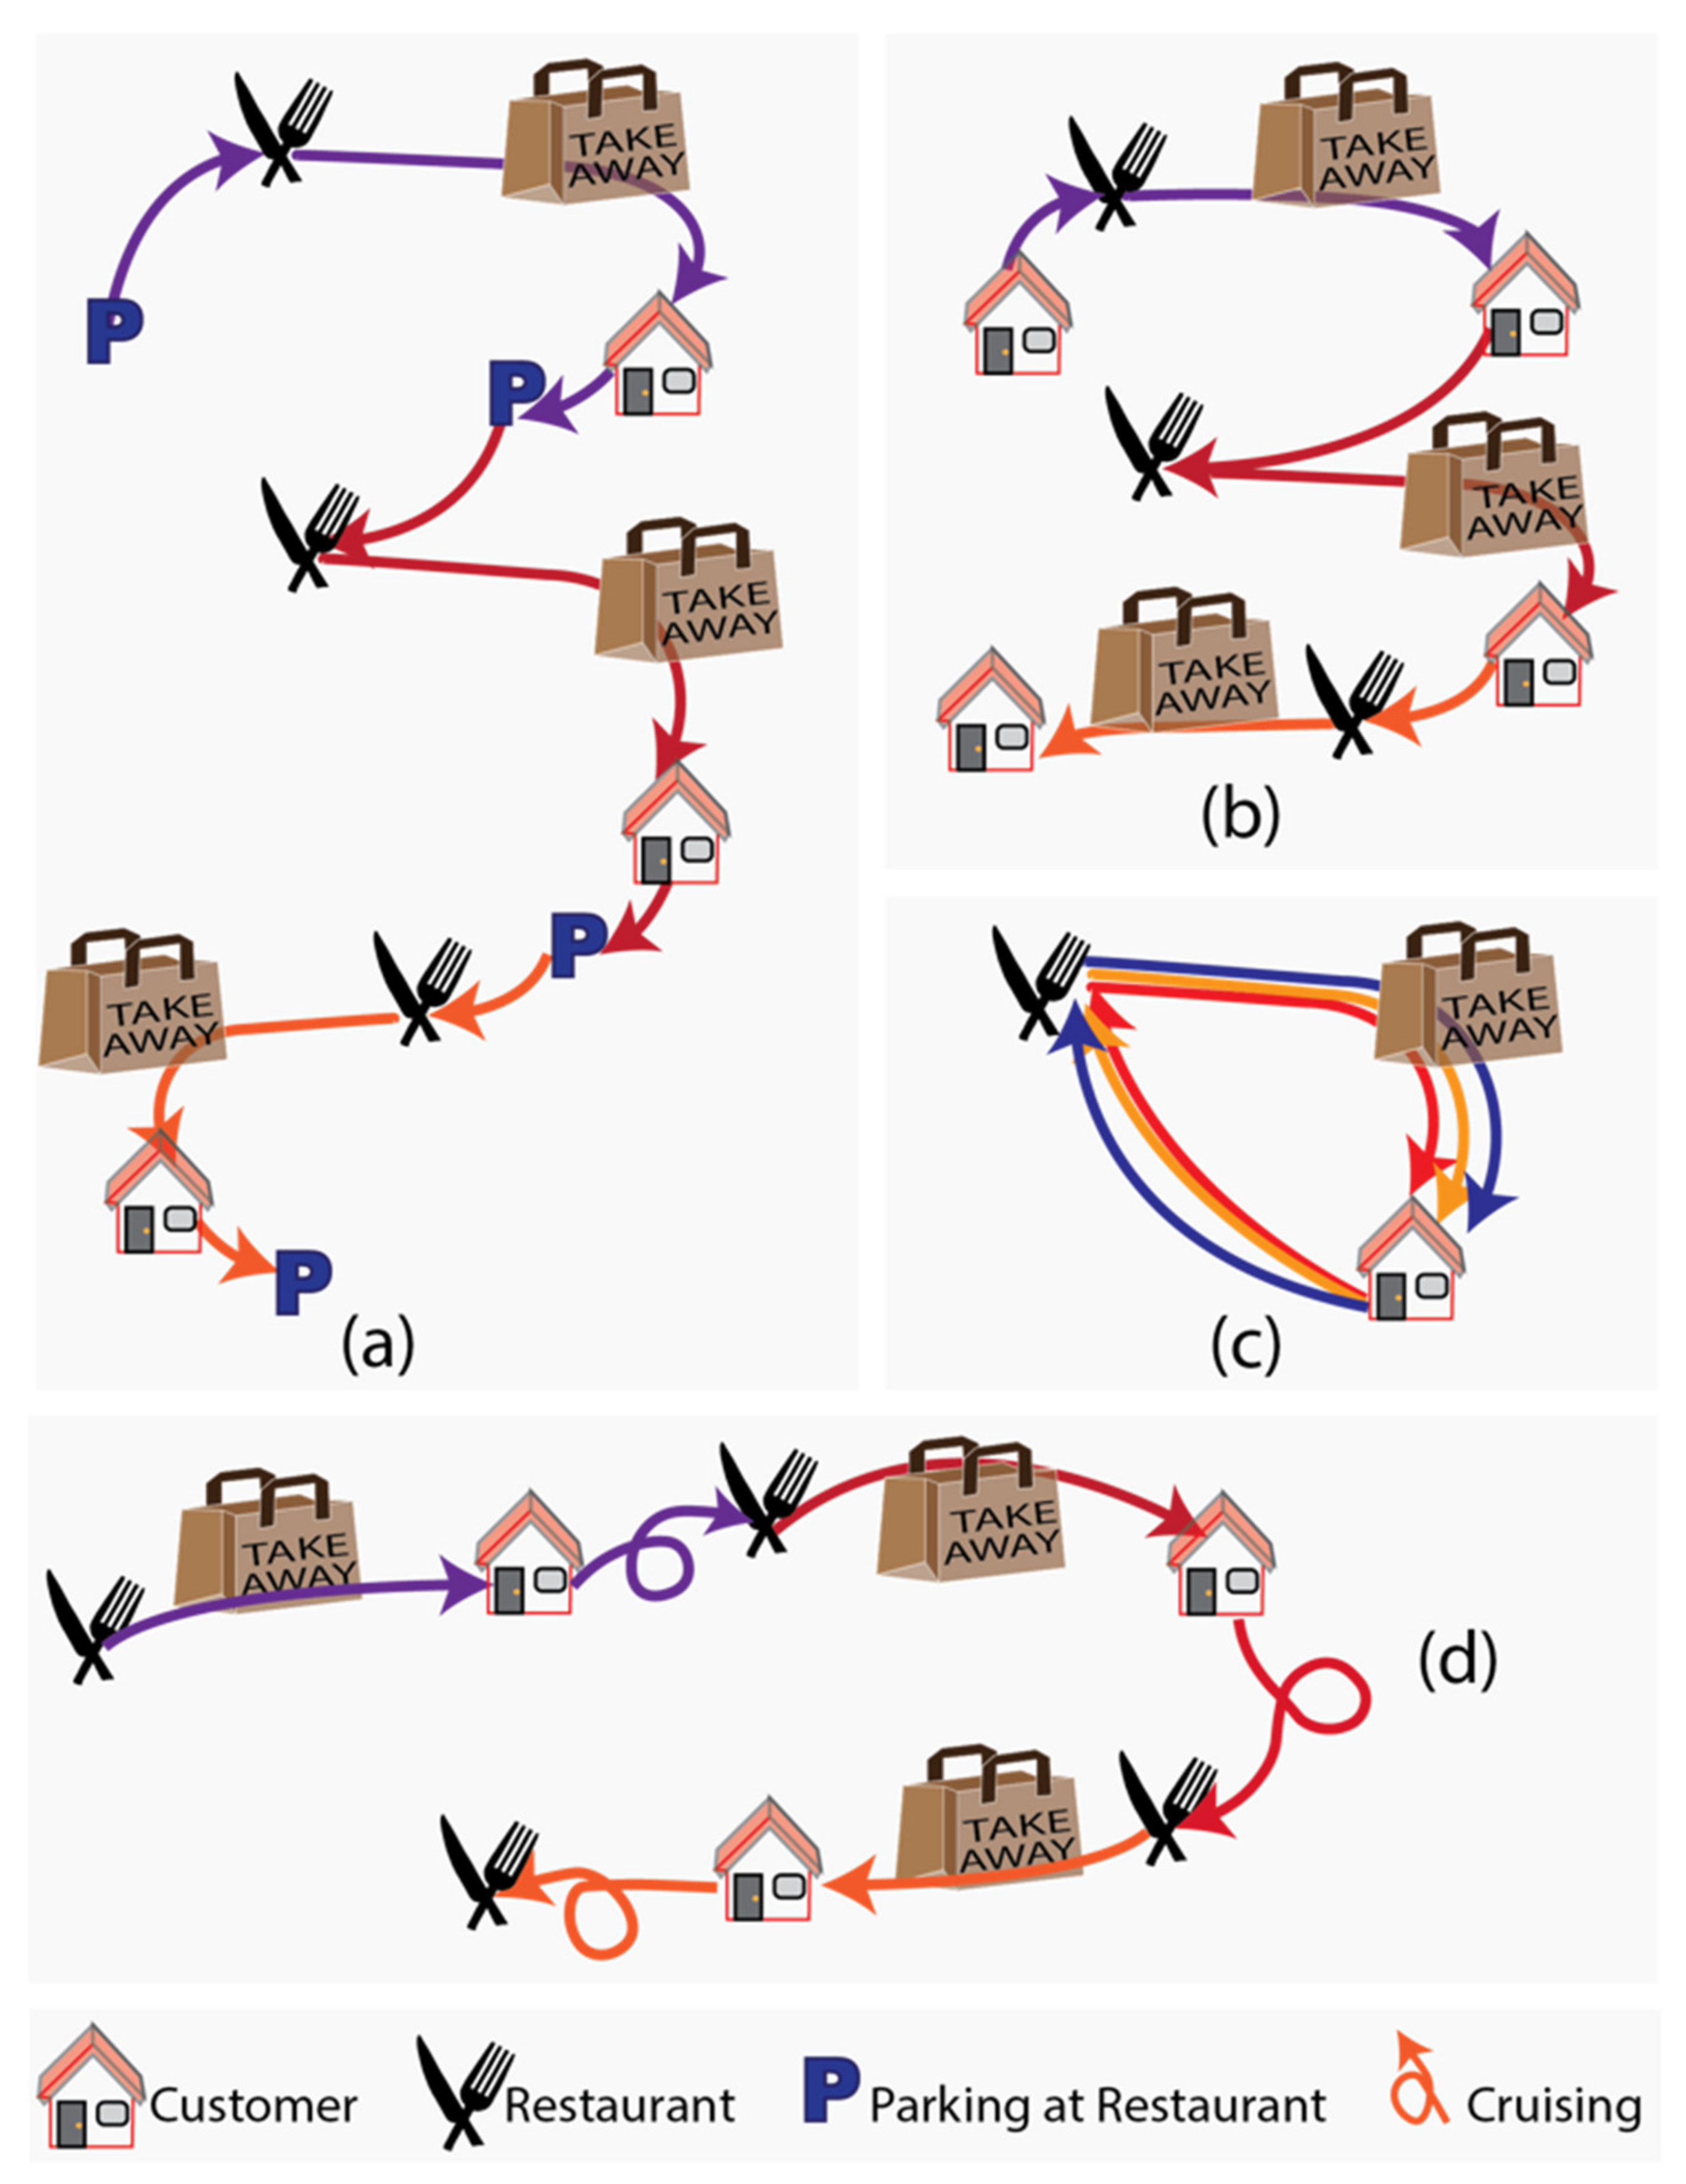
Figure 3 shows the trips involved in the completion of orders for all 4 scenarios. In (a) it is assumed that the SADRs and bicycle couriers are not allowed to wait at the customer’s home for the next order as this would block the footpath or parking spots and couriers should be allowed to wait indoors protected from the weather. SADRs and bicycle couriers travel to and wait at the nearest restaurant after completing an order. This rule increases the VKT and policymakers might decide to forbid additional travel and rather have SADRs wait at the last customer’s address for the next order, which is simulated in (b). In (c) the SADRs and couriers are dedicated to a restaurant and return to the restaurant after an order. In (d) SADRs and bicycle couriers have to pay a parking fee whenever they are standing and therefore keep moving to avoid these charges.
A locally hosted open-source routing machine (OSRM) [
62] and the street network from Open Street Map (OSM) [
63] have been used to calculate the trip distance and duration of the shortest route. The OSRM pedestrian routing profile has been used for SADRs as they are able to travel on footpaths. The OSRM bicycle profile has been used for bicycle couriers.
To account for the waiting time between two orders, eight average waiting times between two trips have been simulated using eight truncated normal distributions with a mean of i minutes, a lower limit of zero minutes, and an upper limit of i*2 min. The integer i = 1, 2, 4, 8, 16, 32, 64, and 128. All 80 scenarios (10 operating areas by eight average waiting times and 150 orders each) are simulated 100 times each. It is assumed the delivery service runs 24/7.
The handover time has been determined based on the survey and GPS traces of on-demand meal delivery services in the UK. It is defined as the time between arrival at the customer’s address and leaving again including the time required for finding a parking spot and walking to the customer. One responder stated that it usually takes less than 30 s or between 30 s to 1 min to hand over a meal. According to the second responder, it takes in most cases 60–90 s to hand over a meal, but handover times of 0–2 min are common as well. Based on the GPS data of twelve delivery tours (Tour 1: 1:04 h, 16 km; Tour 2: 2:35 h, 22 km; Tour 3: 1:19 h, 21 km; Tour 4: 2:32 h, 30 km; Tour 5: 2:29 h, 34 km; Tour 6: 2:18 h, 31 km; Tour 7: 1:37 h, 24 km; Tour 8: 2:14 h, 33 km; Tour 9: 1:55 h, 27 km; Tour 10: 2:20 h, 27 km; Tour 11: 1:49 h, 20 km, Tour 12: 3:00 h, 43 km) the handover time is on average 73 s (median: 68 s, std: 40 s). These observations are similar to the data from the survey. The time required to pick up a meal from a restaurant varies (mean: 3:14 min, median: 1:05 min, std: 224 s). Approximately 30 % of the meal pickups are longer than 5 min. A reason for this is that it is unknown whether the bicycle courier really picked up a meal at that restaurant or maybe just makes a toilet break or waits in the restaurant for the next order request. Hence, the handover time at the customer’s home has been used as the handover time at restaurants as well. Note: the handover time observed during a study of parcel delivery trips with vans in London [
64] is much larger compared with the handover time for on-demand meal delivery observed in this study (mean: 4.1 min, min: 1.6 min, max: 6.8 min, std: 1.2 min). A possible reason could be that customers are expecting a meal delivery, while a parcel might be delivered at a time when the customer is not expecting it. Also, the study in London uses vans, whereas the GPS traces used in this study are from bicycle couriers, who may be able to find a parking spot closer to the customer. It might be debatable whether the handover time of on-demand meal delivery services in UK cities is similar to the handover time observed in NYC. However, the handover time is only affected by the time it takes the customer to answer the door and the time required for the courier to walk from their bicycle to the door and back. Hence, it is not affected by the urban structure, type of streets, traffic and pedestrian volume, etc., and therefore should be relatively similar.
3.3. Study 3: Scheduling: Tour-Based vs. Direct Delivery (Simulation, NYC)
The first simulation assumes that each meal is delivered as a direct delivery tour and each courier serves various restaurants. While this is a common delivery option according to the responders in the previously mentioned survey, both responders state that it is also common for couriers to pick up multiple orders at one restaurant and deliver them in a single tour. According to one of the responders, it is nowadays also possible to first pick up meals from multiple restaurants and then deliver them to multiple customers as a tour.
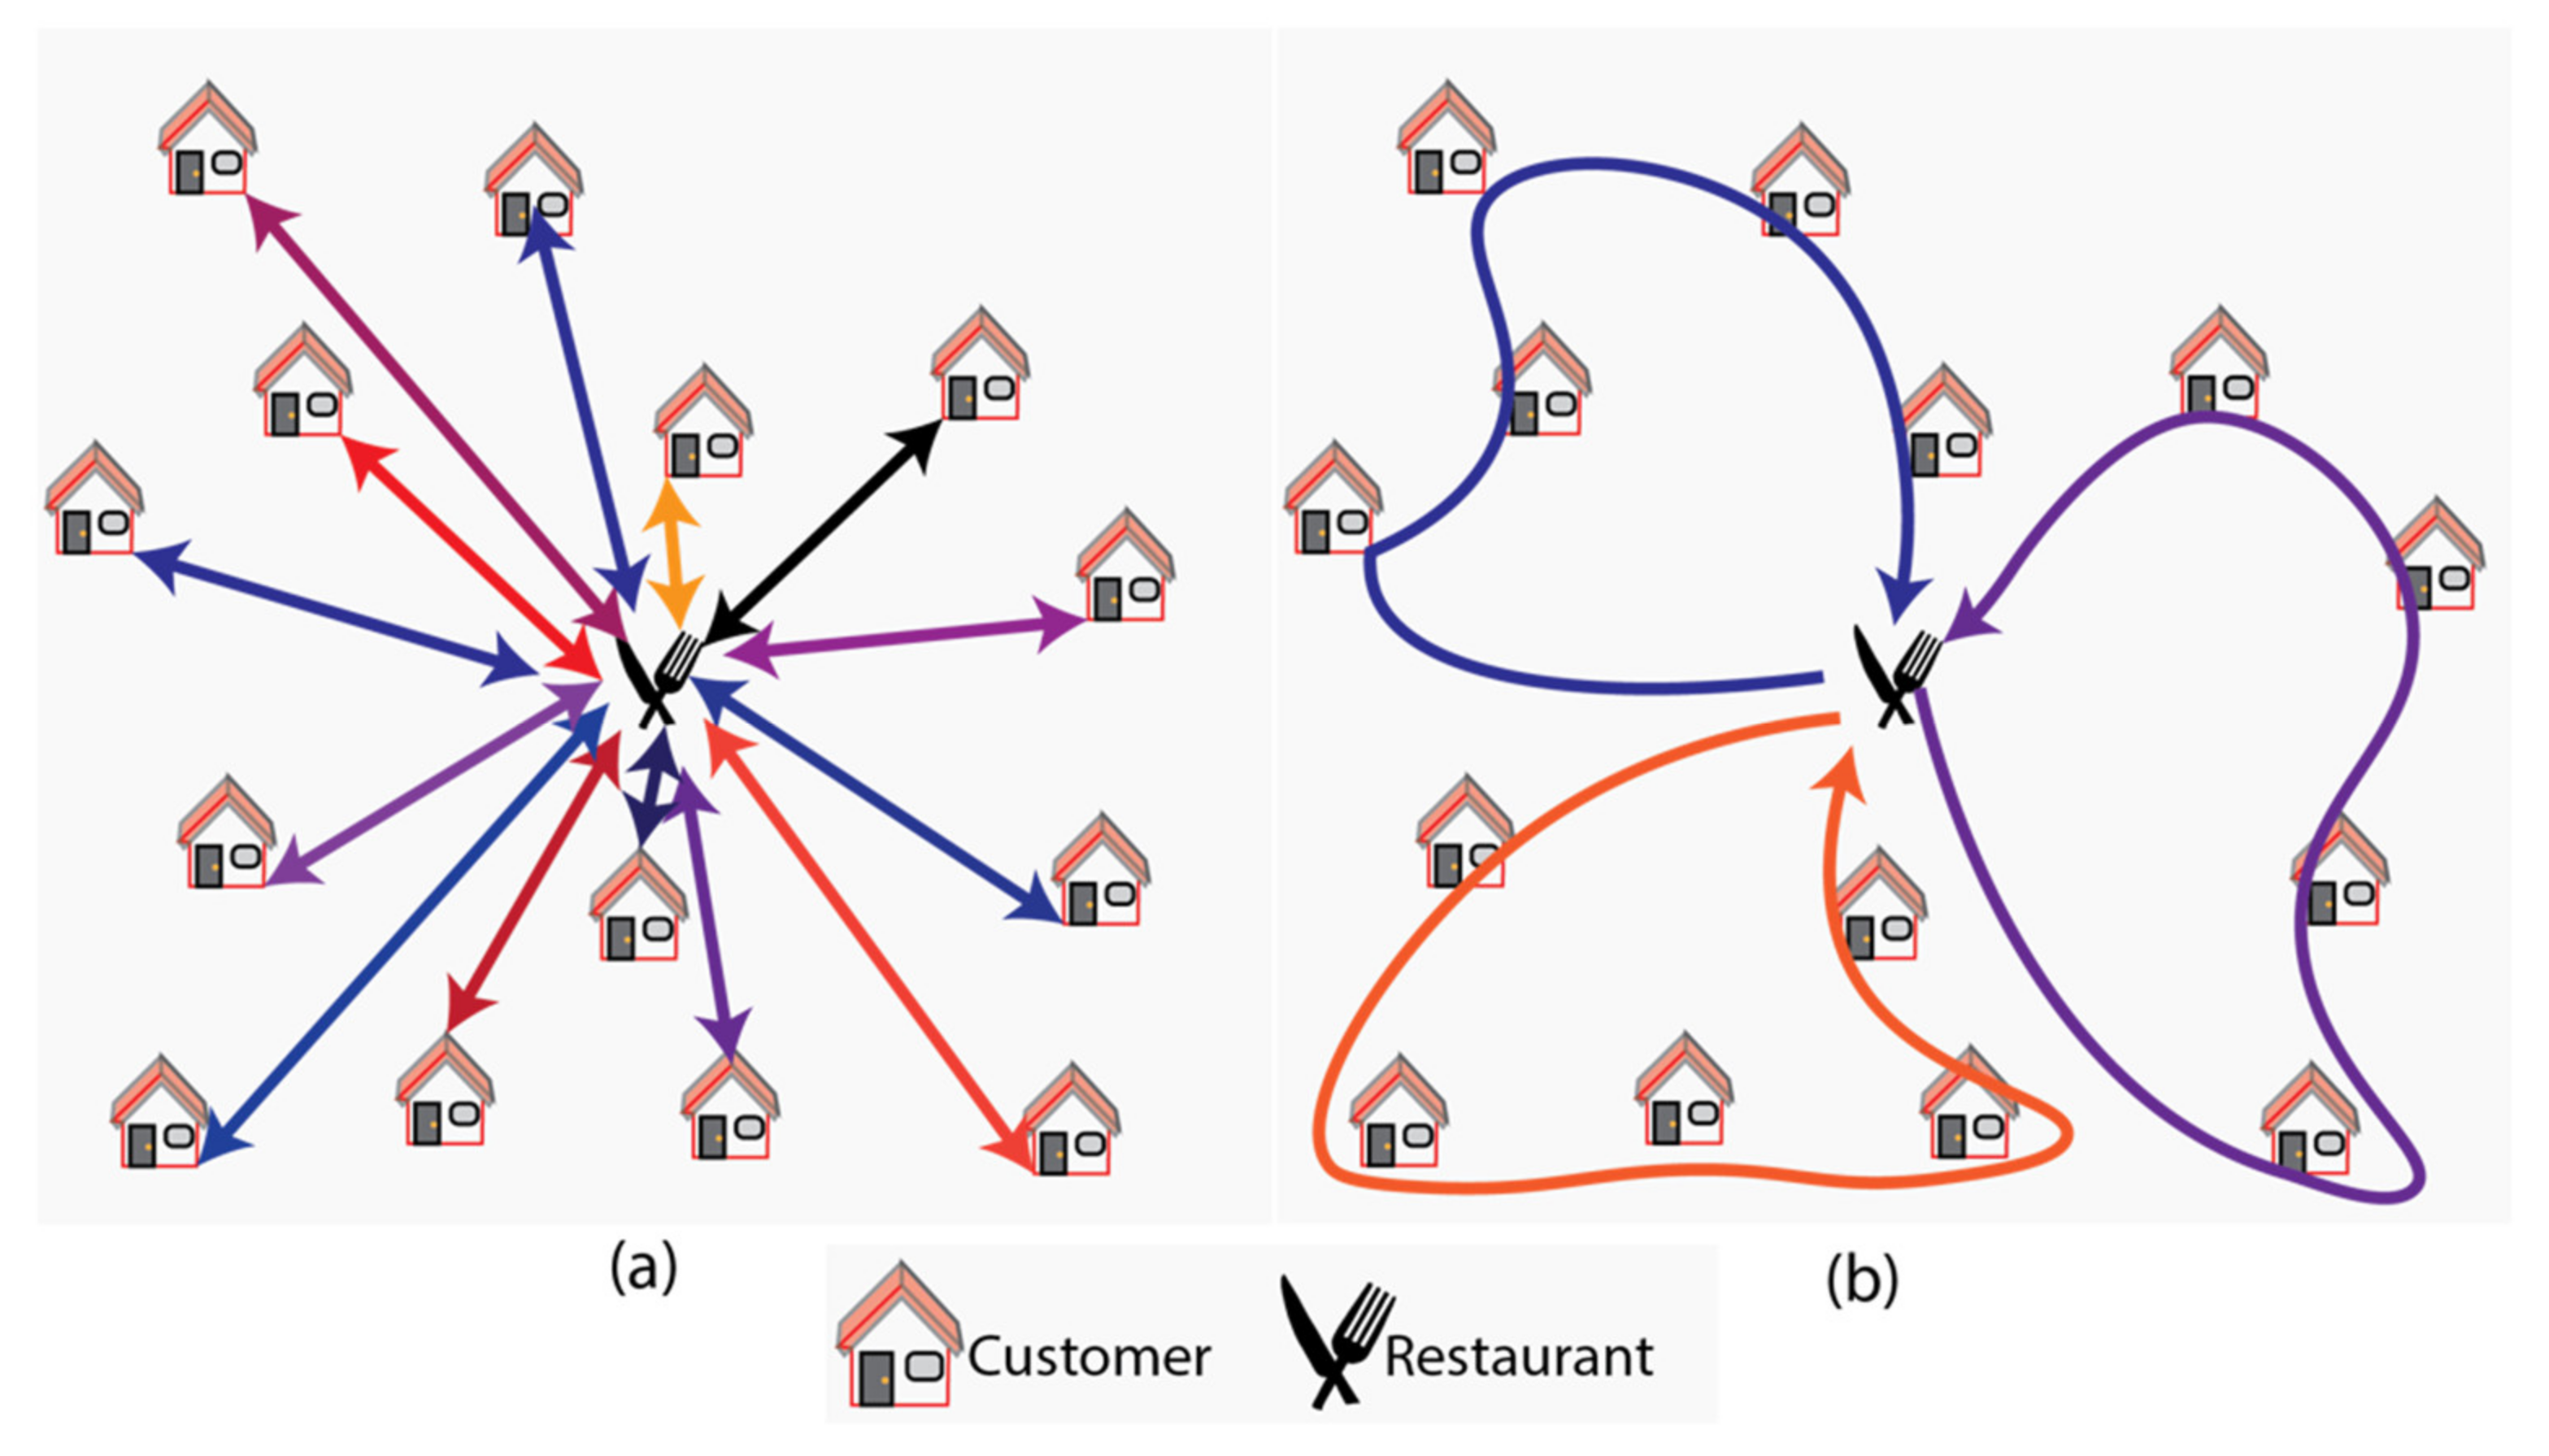
The third study, which compares different scheduling options (i.e., tour-based vs. direct delivery) (
Figure 4), uses the same demand for on-demand meal deliveries as the second study. Due to the low speed of SADRs only the smallest operating area is used as it would otherwise be impossible to combine multiple deliveries into one tour and still obey the maximum 30 min delivery time. It is assumed that all vehicles are owned by the restaurant and park at this restaurant after a delivery tour. The closest restaurant to the center of the operating area has been selected. The vehicles are a small van, SADRs, and a bicycle courier. Each mode has been simulated with two different scheduling options; (1) delivering one meal at a time on a first come first serve basis, without any waiting time in between deliveries (SADR-1, Bicycle-1, Small Van-1); and (2) delivering 30 meals during each of the 5 timeslots by a SADR-X, Bicycle-X, or Small Van-X. The roundtrip delivery duration needs to be less than 31.2 min (30 min delivery plus 1.2 min handover time). If a vehicle is not required during a timeslot, it is parked at the restaurant and counts towards the time-area requirements. To ensure an efficient utilization, the vehicles will start with the next tour once the previous tour is finished even if this time is slightly before or after the beginning of the next timeslot.
The following tour scheduling algorithm (1) applies a similar method to the routing algorithm named farthest insertion algorithm:
Input: travel time matrix for all 30 customers and the restaurant
Output: List of customers ordered into tours
Select the furthest customer from the restaurant and name it customer A
While travel time is <31.2 min and not all customers are served
If ‘new customer’ exists delete it from the travel time matrix
Add the customer closest to customer A to the list and name it ‘new customer’
Calculate the traveling salesman problem for all customers on the list and customer A and the restaurant (roundtrip)
If travel time is >31.2 min
Delete the ‘new customer’ from the list and place it back into the travel time matrix
Calculate the traveling salesman problem for all customers on the list and customer A and the restaurant (roundtrip)
Else
Calculate the traveling salesman problem for all customers on the list and customer A and the restaurant (roundtrip)
The algorithm selects the furthest customer away first and its neighboring customers, to ensure that the last tour only covers customers close to the restaurant. Like most Traveling salesman solvers, this algorithm will not necessarily find the best tour allocation [
65].
3.4. Time-Area Requirements
As illustrated in Schnieder et al. [
23], the time-area concept can consider either the area legally required for safe operation or the share of the provided infrastructure. Using the area legally required for safe operation is more appropriate to the scenarios evaluated in this paper given that bicycles and SADRs do not have a dedicated right-of-way. This means that ground space not used by bicycle couriers or SADRs can be used by other modes of transport (i.e., cars, pedestrians). The equation does not consider the value of land given that considering the value would unfairly impact poorer neighborhoods as stated earlier Schnieder et al. [
23]. The time-area requirements have been estimated based on the following equation described in Schnieder et al. [
23] (
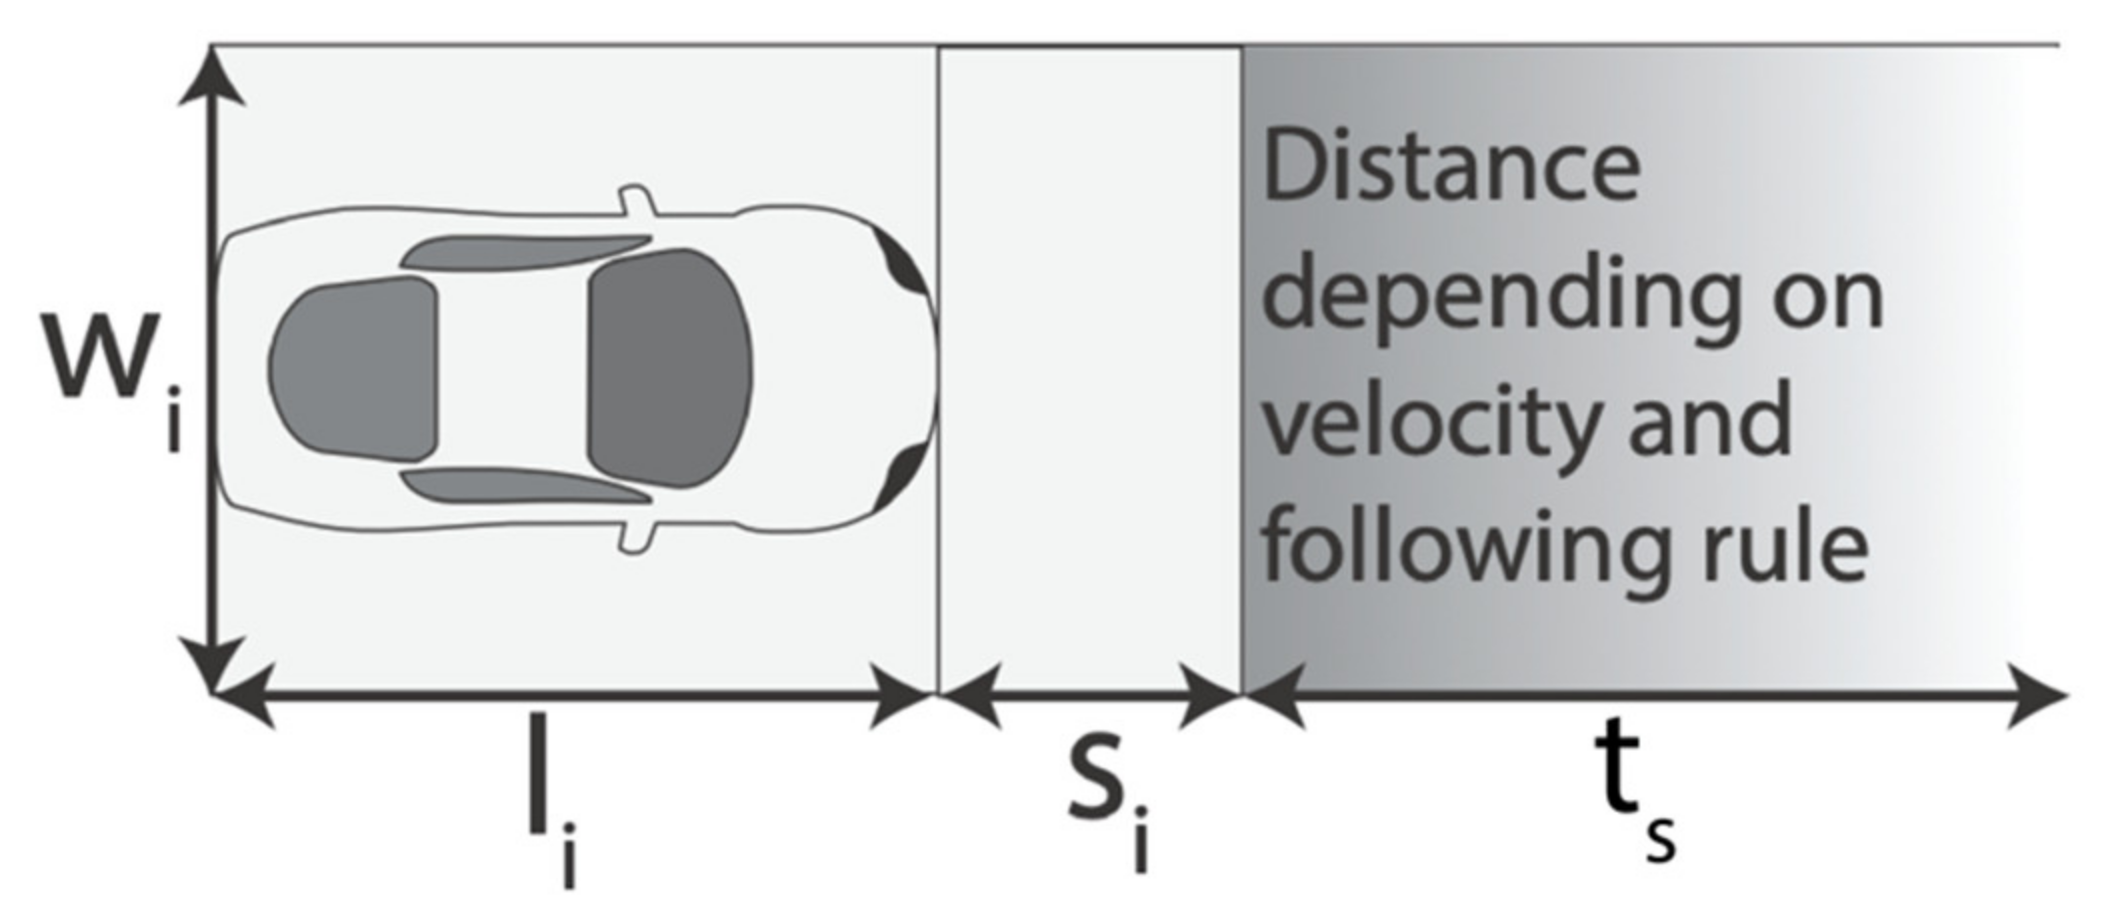
Figure 5):
: Time-area required for trip
: Length of vehicle
: Safety distance kept when vehicles are standing
: Following rule (e.g., 2 s rule)
: Trip distance
: Trip duration
: Width of the lane/right-of-way
For a derivation of the formula, the reader is referred to Schnieder et al. [
23]. The safety distance
is the distance that is maintained between two standing vehicles at a traffic light or while parking parallel to the curb. Without
the distance kept between vehicles when the velocity is close to 0 would be just a few centimeters. However, the safety distance to the front for bicycles is set to 0 to accommodate the overestimation of the width of the bicycle while standing still (i.e., the dynamic width of a bicycle while cycling is much larger than the width while standing). An explanation of the specifications adopted and comparison with other published research can be found in Schnieder et al. [
23]. The size of a typical SADR is based on the Starship delivery robot [
66]. The parameter
is the safe separation distance that is kept between two following vehicles. Given that time-area Equation (2) applies to standing and moving transport units, the order duration is taken as the length of the entire order plus the waiting time until the next order.
Table 4 shows the specifications of the time-area requirements for simulations of last-mile delivery vehicles estimated by Schnieder et al. [
23] and the resulting instantaneous area requirements. The speed profile refers to the profiles in open-source routing machine (OSRM).
Table 5,
Table 6 and
Table 7 show the resulting instantaneous area requirements.
3.5. Limitations
For simplicity, it is also assumed that the time-area requirements of the bicycle courier when walking the last meters to the customer are included in the time-area requirements of the bicycle.
The utilization is assumed to be the same for shared vehicles and restaurant-owned vehicles. In reality, it is possible that the average utilization is higher for shared vehicles as they serve multiple restaurants which ideally might have their peak demands at different times of the day (e.g., bakeries at breakfast and pizzerias evening/night). Vehicles operated by a single restaurant will have a lower utilization during times outside of the peak demand of the restaurant’s products. By assuming the same utilization for all, the simulation compares the worst case for shared vehicles with the normal case for dedicated vehicles. Otherwise, it could be argued that shared vehicles perform better in simulations due to the assumption that restaurants have their peak demand at different times of the day, which might not be the case in reality. For the same reason, the order of the trips has not been optimized in the simulation and instead a random order of the meal orders has been adopted.
5. Discussion
Regulating delivery services using autonomous vehicles is a challenge that will soon be faced by policymakers. The environmental performance of urban freight is in most cases focused on emissions [
19], which neglects the importance of allocating land effectively. Given that every square meter devoted to streets is lost for other purposes such as housing or parks [
23], reducing land consumption [
20] as well as increasing the land use efficiency [
21] is increasingly a key objective for policymakers.
The time-area concept is especially useful for this aim as it can be used to compare modes of transport that have different sizes and velocities, and it combines the requirements of moving and standing transport units in one metric. The latter makes the time-area concept especially useful for autonomous vehicles, which can avoid parking charges by continuing to drive.
This paper has applied the time-area concept to simulations of on-demand meal delivery services in NYC as well as to GPS traces of real on-demand meal delivery tours in the UK. Different vehicles (i.e., SADRs and bicycle couriers, small delivery vans), using different operating strategies (i.e., shared vs. dedicated fleets), following various parking policies (i.e., parking at restaurants, parking at the customer’s home, and no parking policies), and two scheduling options (i.e., direct vs. tour-based delivery) are simulated and evaluated.
The GPS traces (Loughborough and Liverpool) show that the on-demand meal delivery bicycle is only stationery for around 30% of the time. This result is interesting given that parcel delivery vans are stationary for 62% of the delivery time in London [
64]. It would be worth investigating the reasons for this. Doing so enables companies to identify options to increase the efficiency of last-mile delivery by reducing handover time. Possible reasons include (i) bicycle couriers may be able to park closer to the customer than delivery vans, (ii) high-rise buildings in London may make deliveries more difficult, (iii) parcel delivery locations may be closer together than the on-demand meal delivery location, or (iv) a meal delivery customer might be more aware of the delivery time point than a customer waiting for a parcel.
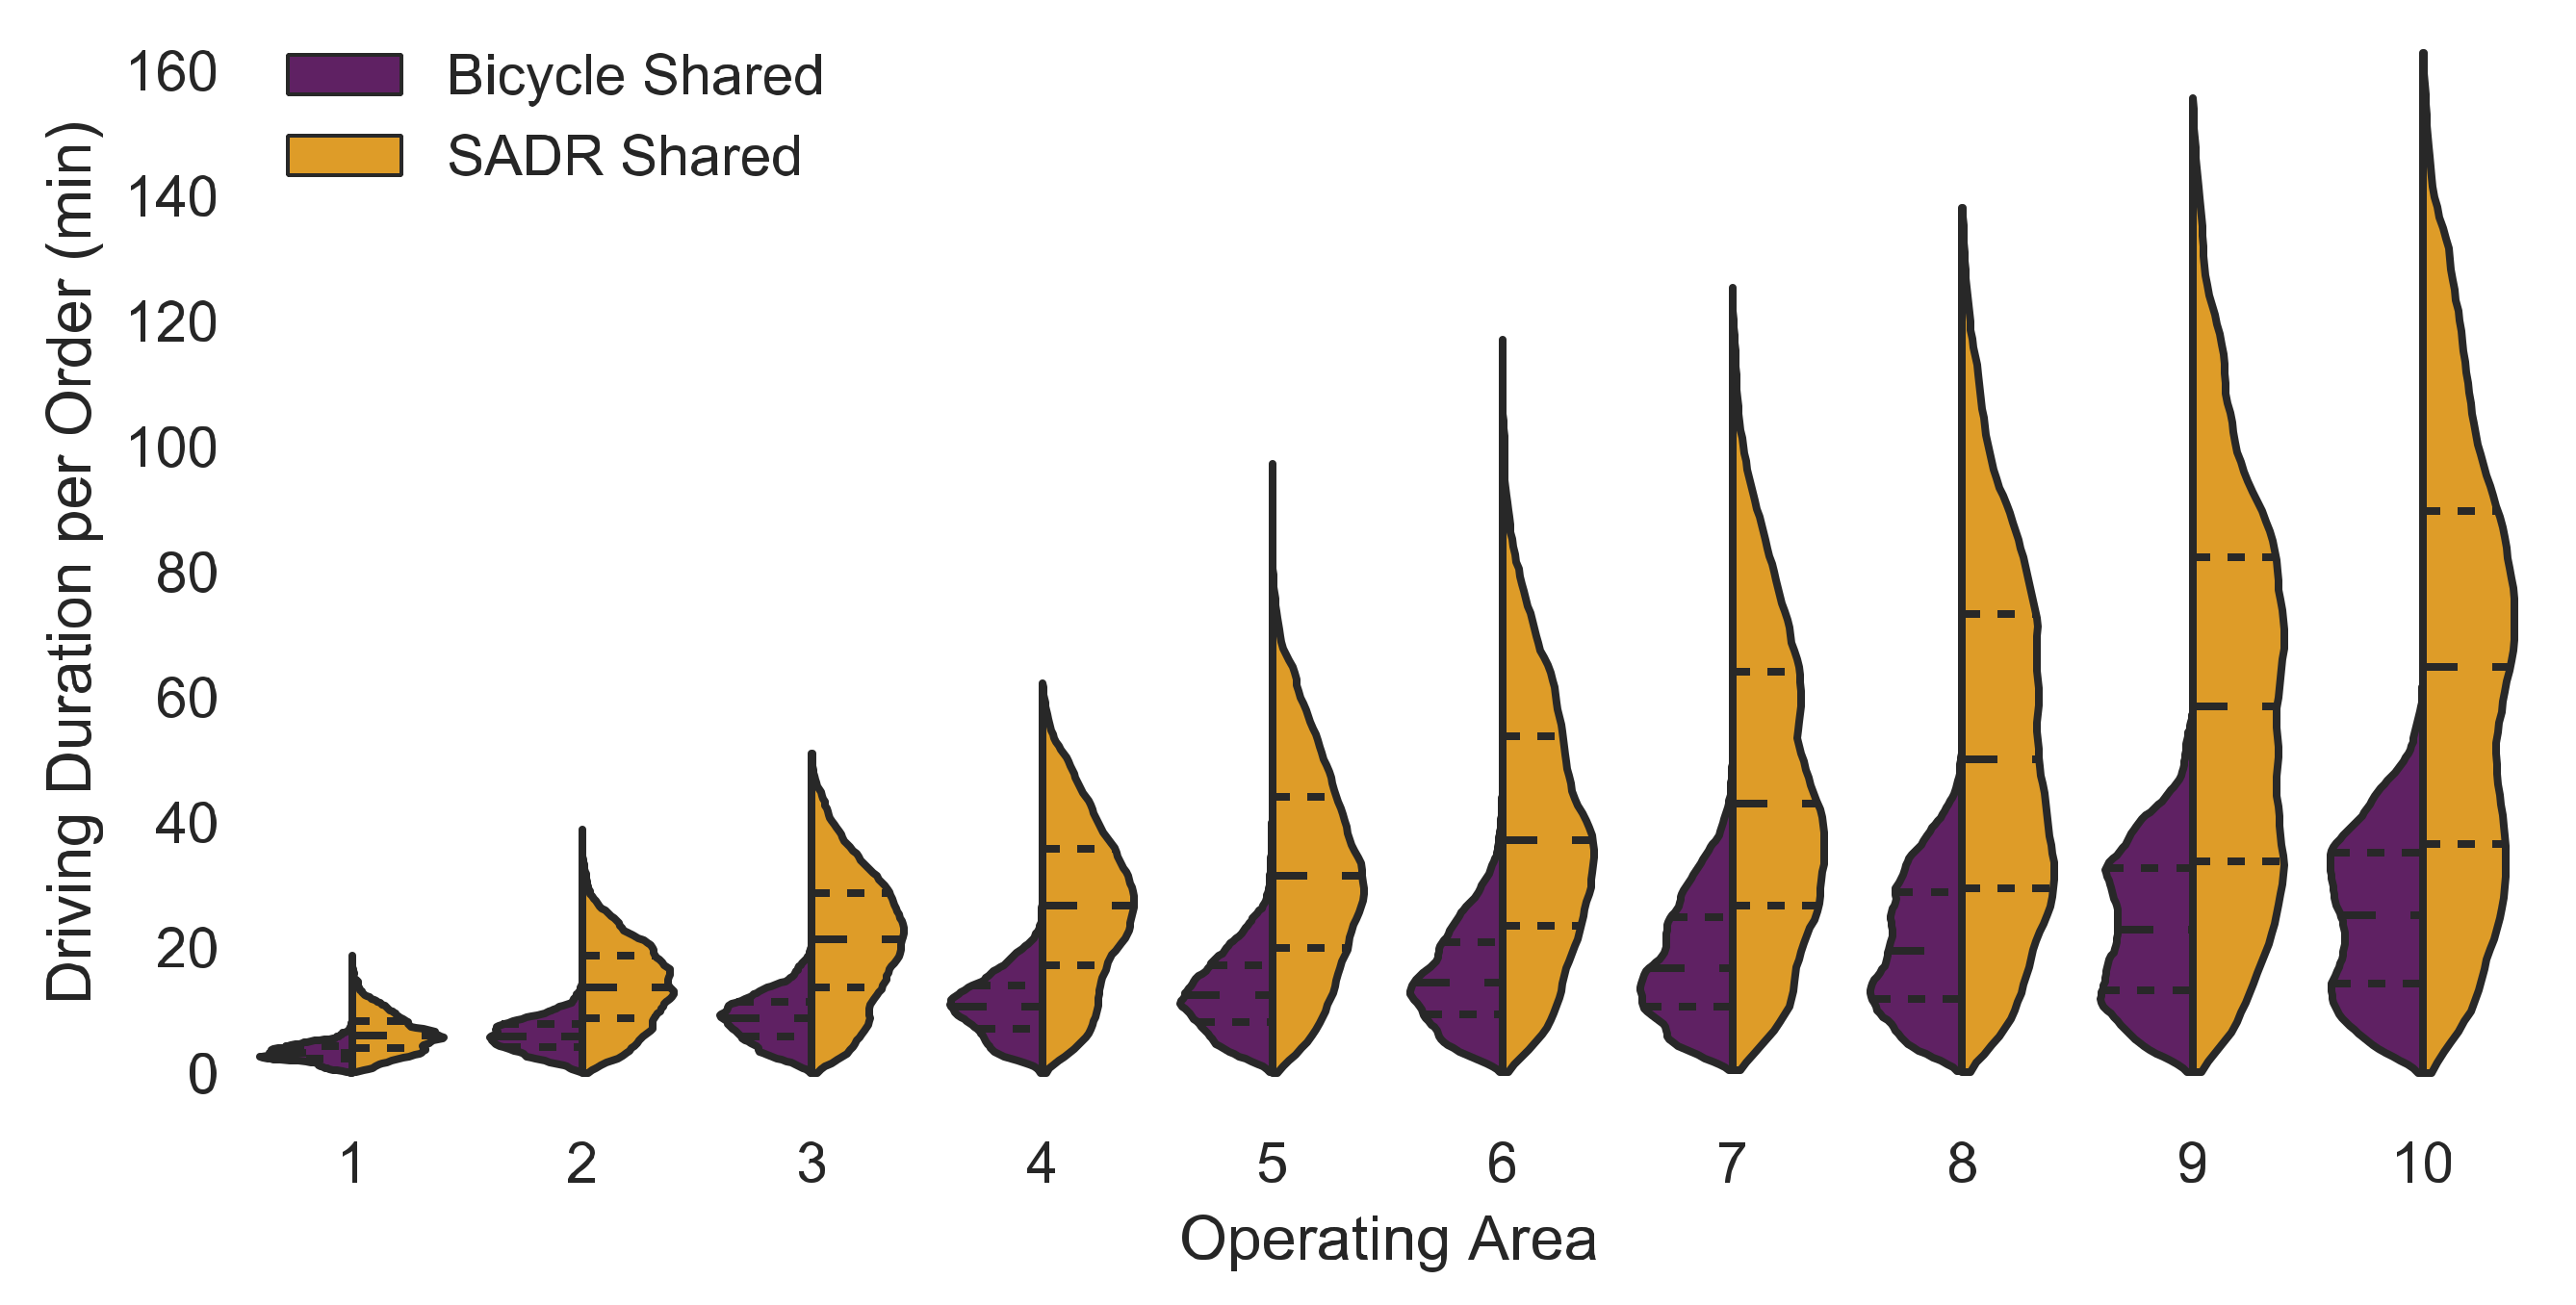
When comparing the simulation of study 2 for NYC with the results from the GPS traces from Loughborough and Liverpool, it can be seen that the key-performance indicators based on GPS traces and operating area 5 (simulation) with less than 16 min wait between orders are similar (e.g., distance per order is around 5 km). Also, the time-area requirements are similar.
The results of the second study show that SADRs can only operate in very small operating areas due to their current safe operating speeds being too slow to deliver hot meals within the recommended time frame in large operating areas. The area-time requirements of SADRs are around half of the time-area requirements for cycling couriers. This result is another argument in favor of the ‘15-min city’. The ’15-min city’ refers to a city structure where all residents can walk or ride a bike to reach daily errands (i.e., work, school, shopping) within 15 min [
69]. The ‘15-min city’ not only enables people to meet their mobility needs, it also allows for the implementation and use of innovative forms of last-mile delivery. Completely segregated cities or residential suburbs, that don’t have any restaurants, are not a good fit for SADRs.
Operating strategy changes (i.e., shared vs. restaurant owned), and two of the parking policies (parking at restaurant vs. parking at customer), have only small effects on the time-area requirements.
Under no circumstances should policymakers disincentivize parking for autonomous delivery vehicles (e.g., implementing parking charges) as this would incentivize autonomous vehicles to drive around instead of parking. Doing so increases the time-area requirements by 2–5 times assuming average speeds in cities. Thus, parking charges are as counterproductive for SADRs as they are for autonomous passenger vehicles [
16]. A better strategy would be to use a time-area based road pricing method. When cars are the main mode of transport, charging fees per trip is reasonable (i.e., parking charges). However, the shape, size, and average speed can vary between autonomous vehicles, micromobility, and cycling. Consequently, a per vehicle charge would not be fair. The time-area concept would allow policymakers to define a fair charge for each transport activity exactly based on the ground area and time they occupy. By doing so policymakers would incentivize modes of transport that use land more effectively, which maximizes sustainability.
Increasing the travel time (i.e., reducing the travel speed) increases the time-area requirements only by a fraction of this increase, as seen in the sensitivity analysis. The same applies to increasing the vehicle length. If the vehicle width is increased, the time-area requirements increase by the same percentage.
Combining multiple deliveries into one tour reduces the time-area requirement by 60 %-65 %, when using SADRs, bicycles or small vans (study 3). This highlights the benefits of aggregator platforms and sharing resources (i.e., delivery vehicles). Instead of having multiple providers who own, run and optimize their own fleet of vehicles, it would be better for them to collaborate to take advantage of economies of scale by increasing the likelihood that multiple customers live close together.
As previously stated, utilization is the same for shared vehicles and restaurant-owned vehicles in the simulation, even though shared vehicles could achieve a higher utilization if they serve restaurants which have their peak demands at different times of the day. A bakery might have their peak demand at breakfast and pizzerias in the evening. Nevertheless, it has been assumed that the utilization is the same to ensure that shared vehicles are not only performing better due to the assumed higher utilization, which might not be the case in reality. The order of the trips has not been optimized for the same reason. Nevertheless, a follow up study could investigate whether a utilization increase could realistically be achieved (using real data), and the effect of this increase on the time-area requirements.
The differences between the time-area requirements of each mode of transport are clearly visible in study 3: A SADR delivering only one meal at a time has a 23% smaller time-area requirement than a bicycle courier delivering multiple meals per tour. This again highlights the importance of the economics of scale, given that bicycle couriers can achieve similar time-area requirements to a SADR if they deliver multiple meals per tour.
A small van requires 3 times as much time-area compared to a bicycle assuming that both deliver multiple meals per tour. Therefore, policymakers should discourage the use of cars to deliver meals in cities as well as build the city so that delivery by bicycle or SADR is easily possible.
6. Conclusions
The paper evaluates the land consumption of on-demand meal delivery services such as UberEATS and Deliveroo based on the time-area concept. The time-area concept measures the area required for a transport activity and the duration for which it is occupied. The contribution of the paper is twofold: First, the paper calculates the time-area requirements of GPS traces of on-demand meal delivery tours in Liverpool and Loughborough (UK). Second, on-demand meal delivery trips using bicycle couriers and SADRs are simulated for NYC. Various operating strategies (i.e., shared fleets and fleets operated by restaurants), parking policies (i.e., parking at the restaurant, parking at the customer or no parking), and scheduling (i.e., one meal per vehicle, multiple meals per vehicle) are simulated.
The dataset of GPS traces includes 25 h and 327 km worth of data for two cities in the UK. Most of the data has been recorded in Liverpool. The Loughborough dataset is, with 5 h and 59 km, relatively small and does not, in contrast to the Liverpool data, include full delivery trips. The results show that the time-area requirement is around 300 m2·min per order.
The simulations show that SADRs are only an option for small operating areas, but their time-area requirements are only around half of that of bicycle couriers. If bicycle couriers deliver multiple meals per tour while SADRs deliver one meal at a time, SADRs still require 23% less time-area. Delivering meals by small vans can never be recommended.
