Article

Tillage Impacts on Initial Soil Erosion in Wheat and Sainfoin Fields under Simulated Extreme Rainfall Treatments

1
Department of Soil Science & Plant Nutrition, Faculty of Agriculture, Yozgat Bozok University, Yozgat 66900, Turkey
2
Department of Soil Science & Plant Nutrition, Faculty of Agriculture, Harran University, Sanliurfa 63290, Turkey
3
Department of Forest Engineering, Faculty of Forestry, Kahramanmaras Sutcu Imam University, Kahramanmaras 46100, Turkey
4
Alata Horticultural Research Institute, Ministry of Agriculture and Forestry, Mersin 33740, Turkey
5
Department of Physical Geography, University of Trier, 54296 Trier, Germany
6
Soil Erosion and Degradation Research Group, Department of Geography, Valencia University, Blasco Ibàñez 28, 46010 Valencia, Spain
7
School of Engineering and Built Environment, Griffith University, Nathan, QLD 4111, Australia
*
Author to whom correspondence should be addressed.
Sustainability 2021, 13(2), 789; https://doi.org/10.3390/su13020789
Submission received: 23 November 2020 / Revised: 2 January 2021 / Accepted: 11 January 2021 / Published: 15 January 2021

Abstract

:
The main aim of this research was to determine the potential effects of different tillage systems (TT: traditional tillage and RT: reduced tillage) on runoff and erosion at two different locations (Kahramanmaras and Tarsus, Southern Turkey) under (i) fallow, (ii) wheat (Triticumaestivum L.), and (iii) sainfoin (Onobrychissativa L.) crops. Rainfall simulations with intensity of 120 mm h−1 and 30-min duration, representing a typical extreme thunderstorm in this area, were used. We quantified the elapsed time to runoff generation (ET), total runoff volume (R), soil loss (SL), sediment concentration (SC), and runoff coefficient (RC). At both locations, the fallow plots indicated the first runoff response ranging between 1.2 and 3.1 min, while the range was between 9.4 and 8.9 min for the sainfoin plots. The highest runoff coefficient was recorded for the fallow parcel in Tarsus (57.7%), and the lowest runoff coefficient was recorded for the sainfoin parcel in Kahramanmaras (4%). For both study sites, the fallow plots showed higher soil erosion rates (871 and 29.21 g m−2) compared with the wheat plots (307 and 11.25 g m−2), while sainfoin recorded the lowest soil losses (93.68 and 3.45 g m−2), for Tarsus and Kahramanmaras, respectively. Runoff and sediment yield generated from sainfoin and wheat parcels under the RT system were less than under the TT system at the Kahramanmaras location. At the Tarsus location, the effect of soil tillage on soil and water losses was insignificant on the sainfoin planted plots. The reduced tillage system was successful in reducing sediment yield and runoff generated from parcels growing wheat and sainfoin compared to traditional tillage in Tarsus location, but runoff and soil loss were found to be very high compared to parcels constructed in the Kahramanmaras location.

1. Introduction

Agricultural production can contribute to the sustainability of humankind if practices are environmentally friendly [1,2]. To ensure the sustainability of both agricultural production and agroecosystem services, the soil must be properly managed [3,4]. A proper agricultural management scheme and implementation of appropriate strategies require the understanding of all soil functions and processes that occur such as organic carbon cycles [5], nutrient losses and gains [6], or the activation of soil erosion [6,7]. For many years, different management practice scenarios have been tested under different circumstances and techniques to understand the resilience of soils [8,9,10]. Tillage, one of the common soil management systems, plays an important role in the soil matrix and has triggered debates [11,12,13]. One of the aims of tillage practice is to reduce the bulk density of the soil to ensure regular air and water movement through the soil profile [14,15]. For primary tillage such as ploughing, hydraulic conductivity can increase after tractor passing but can decrease during the growing season due to the settling of the soil structure and raindrop impact [16,17]. Activities like these can cause soil degradation and threaten soil quality [18]. In all cases, tillage comes with negative consequences by allowing redistribution of the material and disconnection of the most critical flow paths [19,20].
Reduced tillage is described as any type of farming system that involves less cultivation than conventional tillage [21]. Typically, a reduced tillage system does not involve ploughing or disc cultivation unless necessary, but items of equipment are generally used in the second soil preparation (shallow disc cultivator and harrow) after the first crop harvesting [22]. Reduced soil tillage systems are considered as more environmentally friendly and are aimed at improving soil physical quality and also decreasing the risk of drought and water logging [23]. Additionally, some recent investigations have indicated that reduced tillage systems can increase soil organic matter content, improve soil biodiversity, and contribute to the reduction of input costs [24,25,26]. It is a well-known reality that soil compaction is reduced with minimum tillage practices in the medium and the long term compared to conventional repeated tillage systems [22]. Some authors have even highlighted that no-tillage increases organic matter and reduces soil erosion [27].
Another issue concerning tillage practices is erosion due to the activation of hotspots of runoff generation. Tillage erosion can be identified as an important soil degradation process that reveals changes in soil productivity, environmental quality, and landscape evolution [27,28]. On the other hand, tillage controls soil surface micro-topography parameters such as roughness and shear strength that affect the partitioning of rainfall into infiltration and runoff [29]. The effects of the different tillage systems on soil properties under cultivation of different plants have been widely investigated [30,31,32,33,34,35,36]. This is more so along the Mediterranean climate zone, which is subjected to high extreme meteorological variability and, for this reason, agricultural soils are more susceptible to erosion [37,38,39]. Therefore, the effects of different soil management practices on soil and water losses should be investigated in these areas. Case studies on this topic in Turkey located in the Mediterranean climate zone are rare, especially those dealing with extreme rainfall intensities.
According to data obtained by the Dynamic Erosion Model and Monitoring System [39], a maximum of 642 Mg yr−1 of water erosion is registered in Turkey. On average, 8.24 Mg ha−1 yr−1 is displaced as a result of erosion. In Turkey, the factors that have an impact on the spatial and quantitative changes of soil loss are listed as 14.3% rainfall, 3.4% soil type, 47.6% topographical changes, and 34.8% the absence of vegetation [39]. Considered in terms of land use, 38.7% of the soil displacement occurs in agricultural areas in Turkey. According to the records of the Turkish General Directorate of State Hydraulic Works, 154 million Mg yr−1 of soil is mobilized by rivers and 248.6 million Mg yr−1 by water erosion in agricultural areas. Erosion rates on 26.5% of the agricultural land in the Mediterranean are classified as moderate to severe erosion [40,41].
Turkey experiences different climate types, especially along the coastal areas close to the Black Sea and the Mediterranean coastline, which are subjected to extreme rainfall events. It has been determined that the rainfall erosivity has reached high values, especially in the coastal areas of these two regions. RUSLE-R in these coastal areas exceeds the value of 2750 MJ mm ha−1 h−1 yr−1. Soil loss is also high in the inland areas of Turkey, but little research has been carried out in these regions. There is no information on the use of in situ experiments to assess the initiation of soil erosion processes under different soil management systems (tilled and bare soils vs not tilled), especially in the traditional and extended cultivated fields in Turkey under sainfoin or wheat crops. Therefore, the main goal of this research is to investigate the effects of traditional and reduced tillage on the runoff and sediment yield of Turkish wheat and sainfoin areas under extreme rainfall events. To achieve this goal, we constructed and tested a modified rainfall simulator [42], and rain simulation experiments were carried out. These experiments were performed to determine the initial total volume of runoff, the starting time of surface flow, the sediment yield, and the sediment concentration. We hypothesize that this research sheds light on how high soil erosion rates can be reduced depending on the type of soil management system considered.

2. Materials and Methods
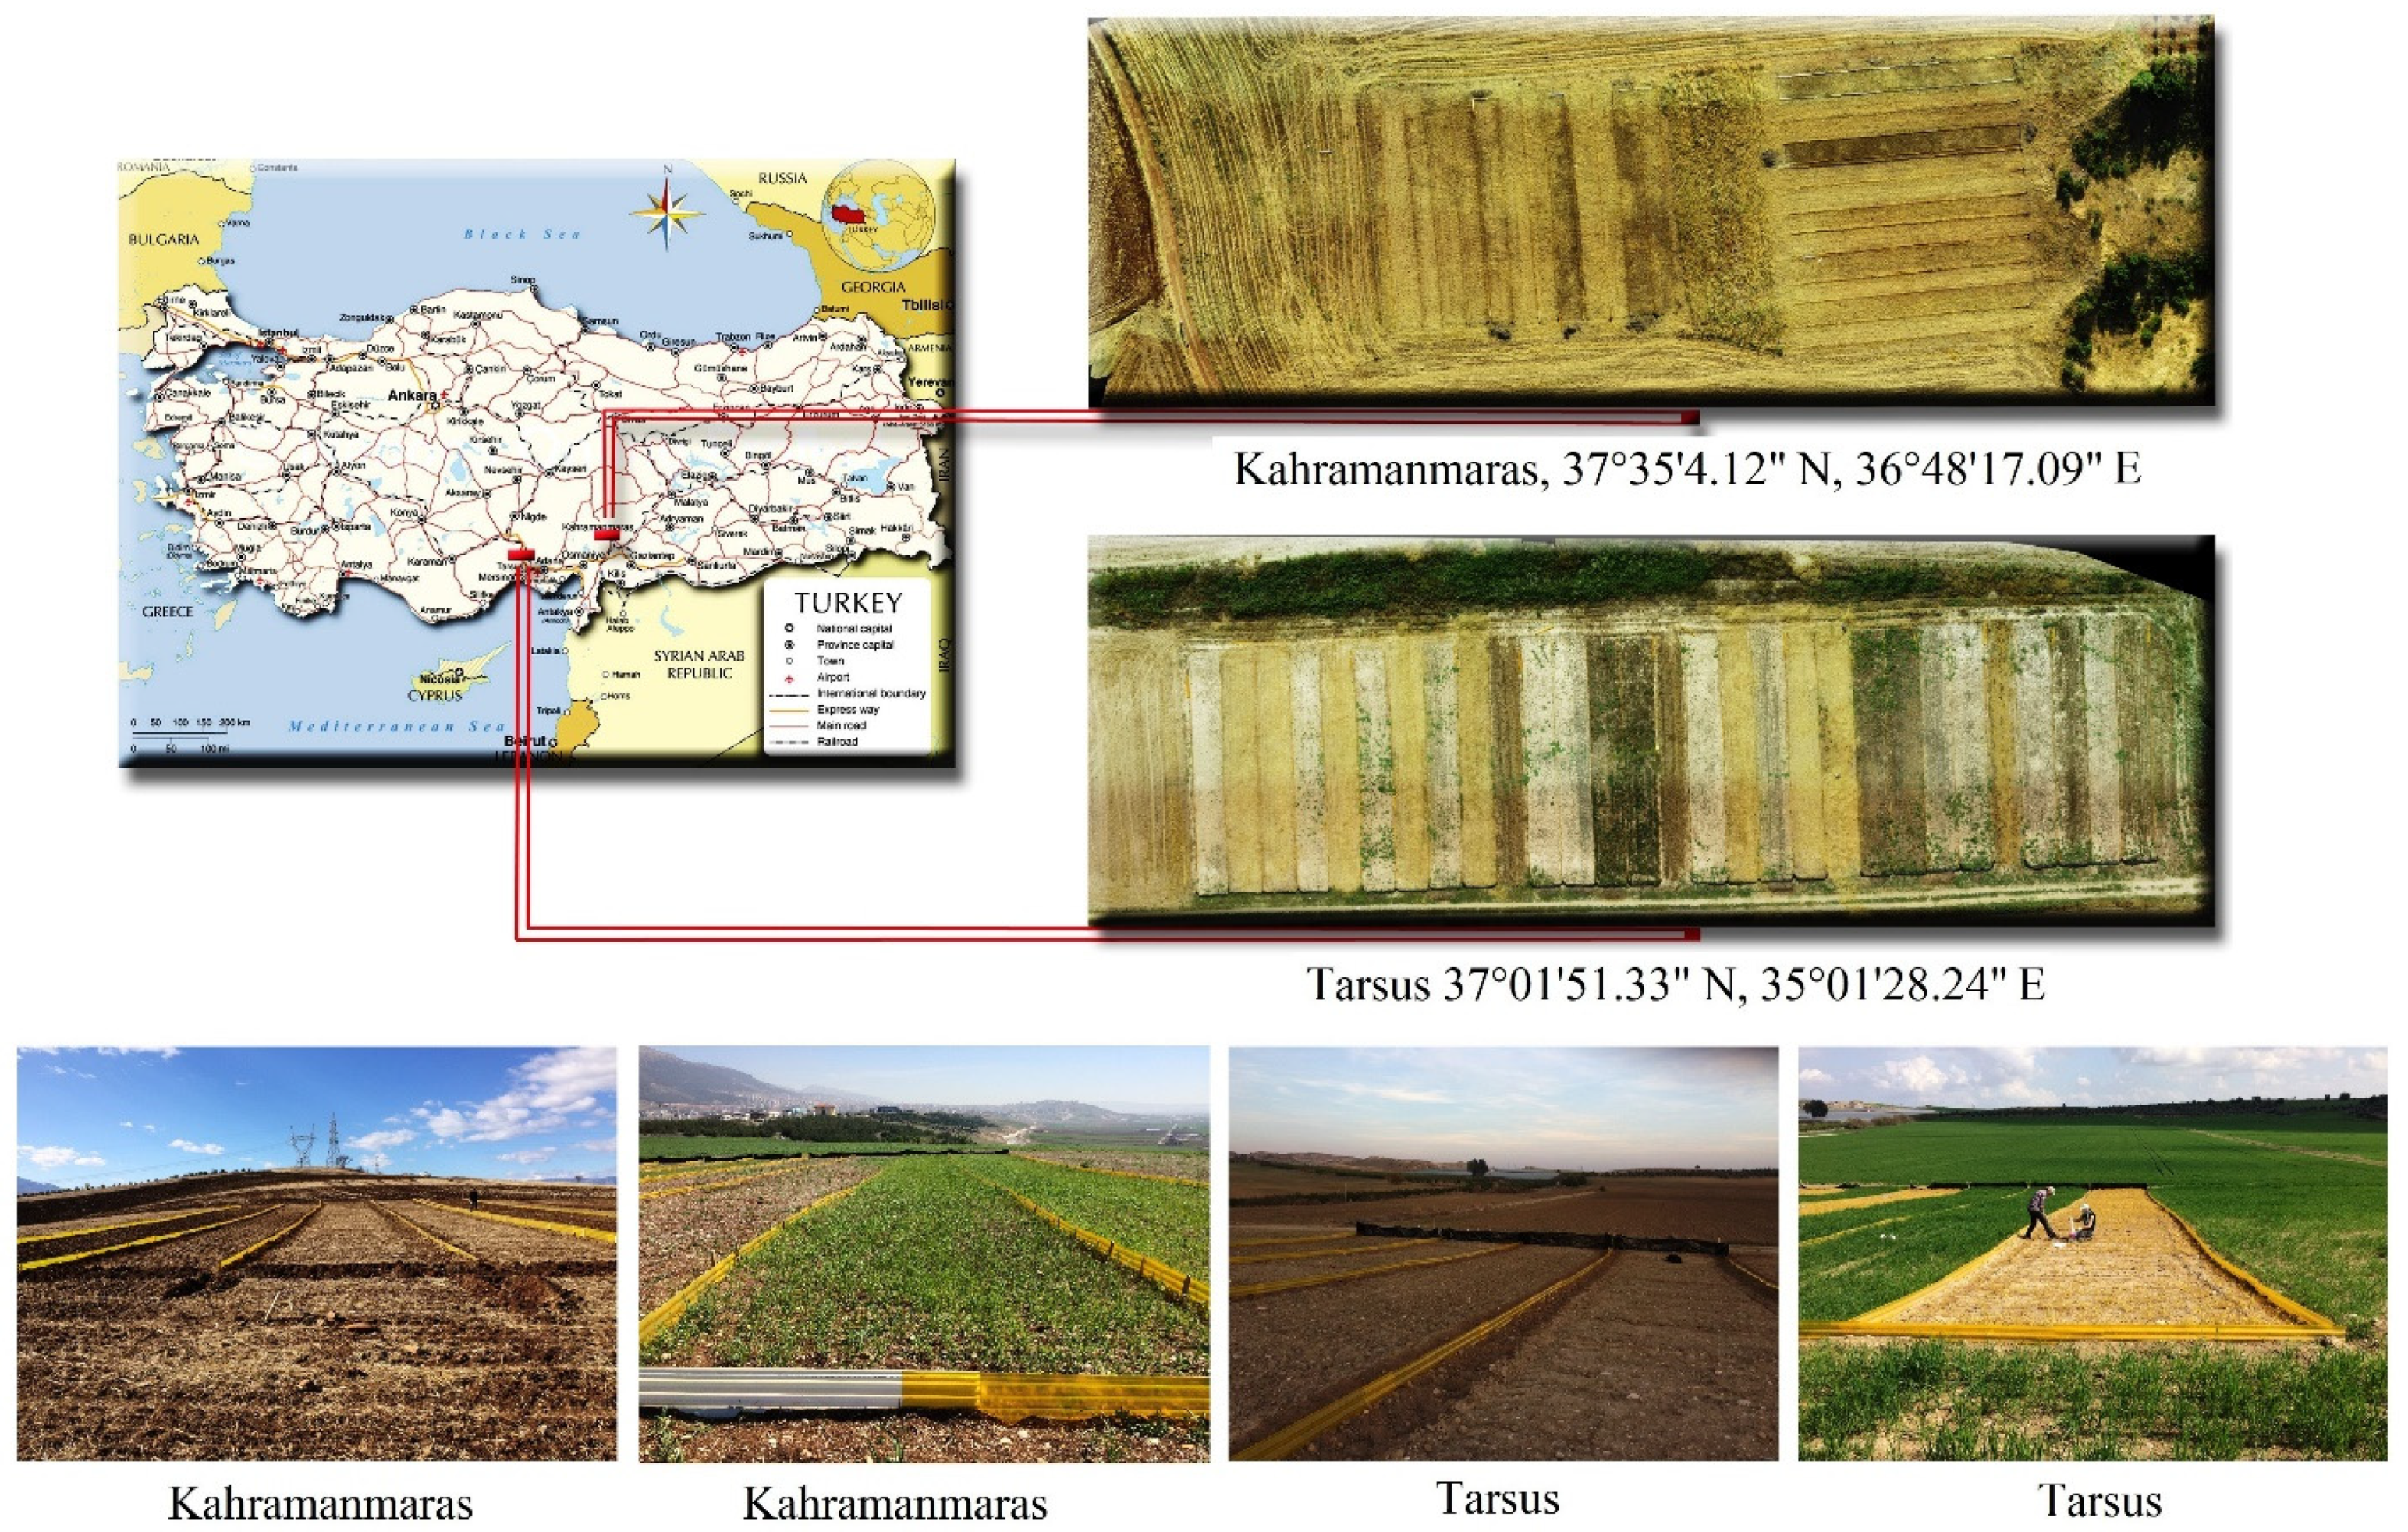
2.1. Study Areas

The two study areas (Tarsus and Kahramanmaras, about 250 km apart) are located in Southern Turkey (Figure 1). Tarsus (Mersin), the first study site, is composed of experiment parcels established on the land of “Topcu Research Station” in the Alata Horticultural Research Institute under the supervision of the General Directorate of Agricultural Research and Policies, Ministry of Agriculture and Forestry. The experimental plots are located at 37°01′51.33″ N (latitude) and 35°01′28.24″ E (longitude), and the elevation is 81 m.a.s.l. The second study area is located in the Agricultural Research Area of Kahramanmaras Sutcu Imam University, Kahramanmaras city, and the experimental plots are located at 37°35′4.12″ N (latitude) and 36°48′17.09″ E (longitude) with an elevation of 526 m.a.s.l.
Tarsus location has an average annual precipitation of 700 mm, and the average annual temperature is 19.1 °C [43,44]. For the Kahramanmaras location, the mean annual temperature is 16.9 °C, and annual precipitation reaches 725 mm [44]. The climate type of these two locations can be classified as Csa following the Köppen–Geiger classification [44]. The annual RUSLE-R values (2005–2014) for Tarsus and Kahramanmaras are 1490.26 and 638.35 MJ mm ha−1 h yr−1, respectively [40]. The long term monthly average rainfall and temperature of both locations are given in Table 1 [43,44].
The soil properties of these two locations are very different from each other. In Tarsus, the soil can be classified as Typic Xerochrepts [45]. These soils are formed on conglomerate-marl alternate parent materials and are situated along hill slopes with high and slightly undulating reliefs of about 12% inclination. The soils of the Kahramanmaras can be classified as Vertic Haploxerept [46]. This soil is consolidated on the middle and low parts by old lime-free parent material. It contains a large amount of coarse gravel material. The inclination is about 18%. The soil properties before performing the rainfall simulations are presented in Table 2 [47].

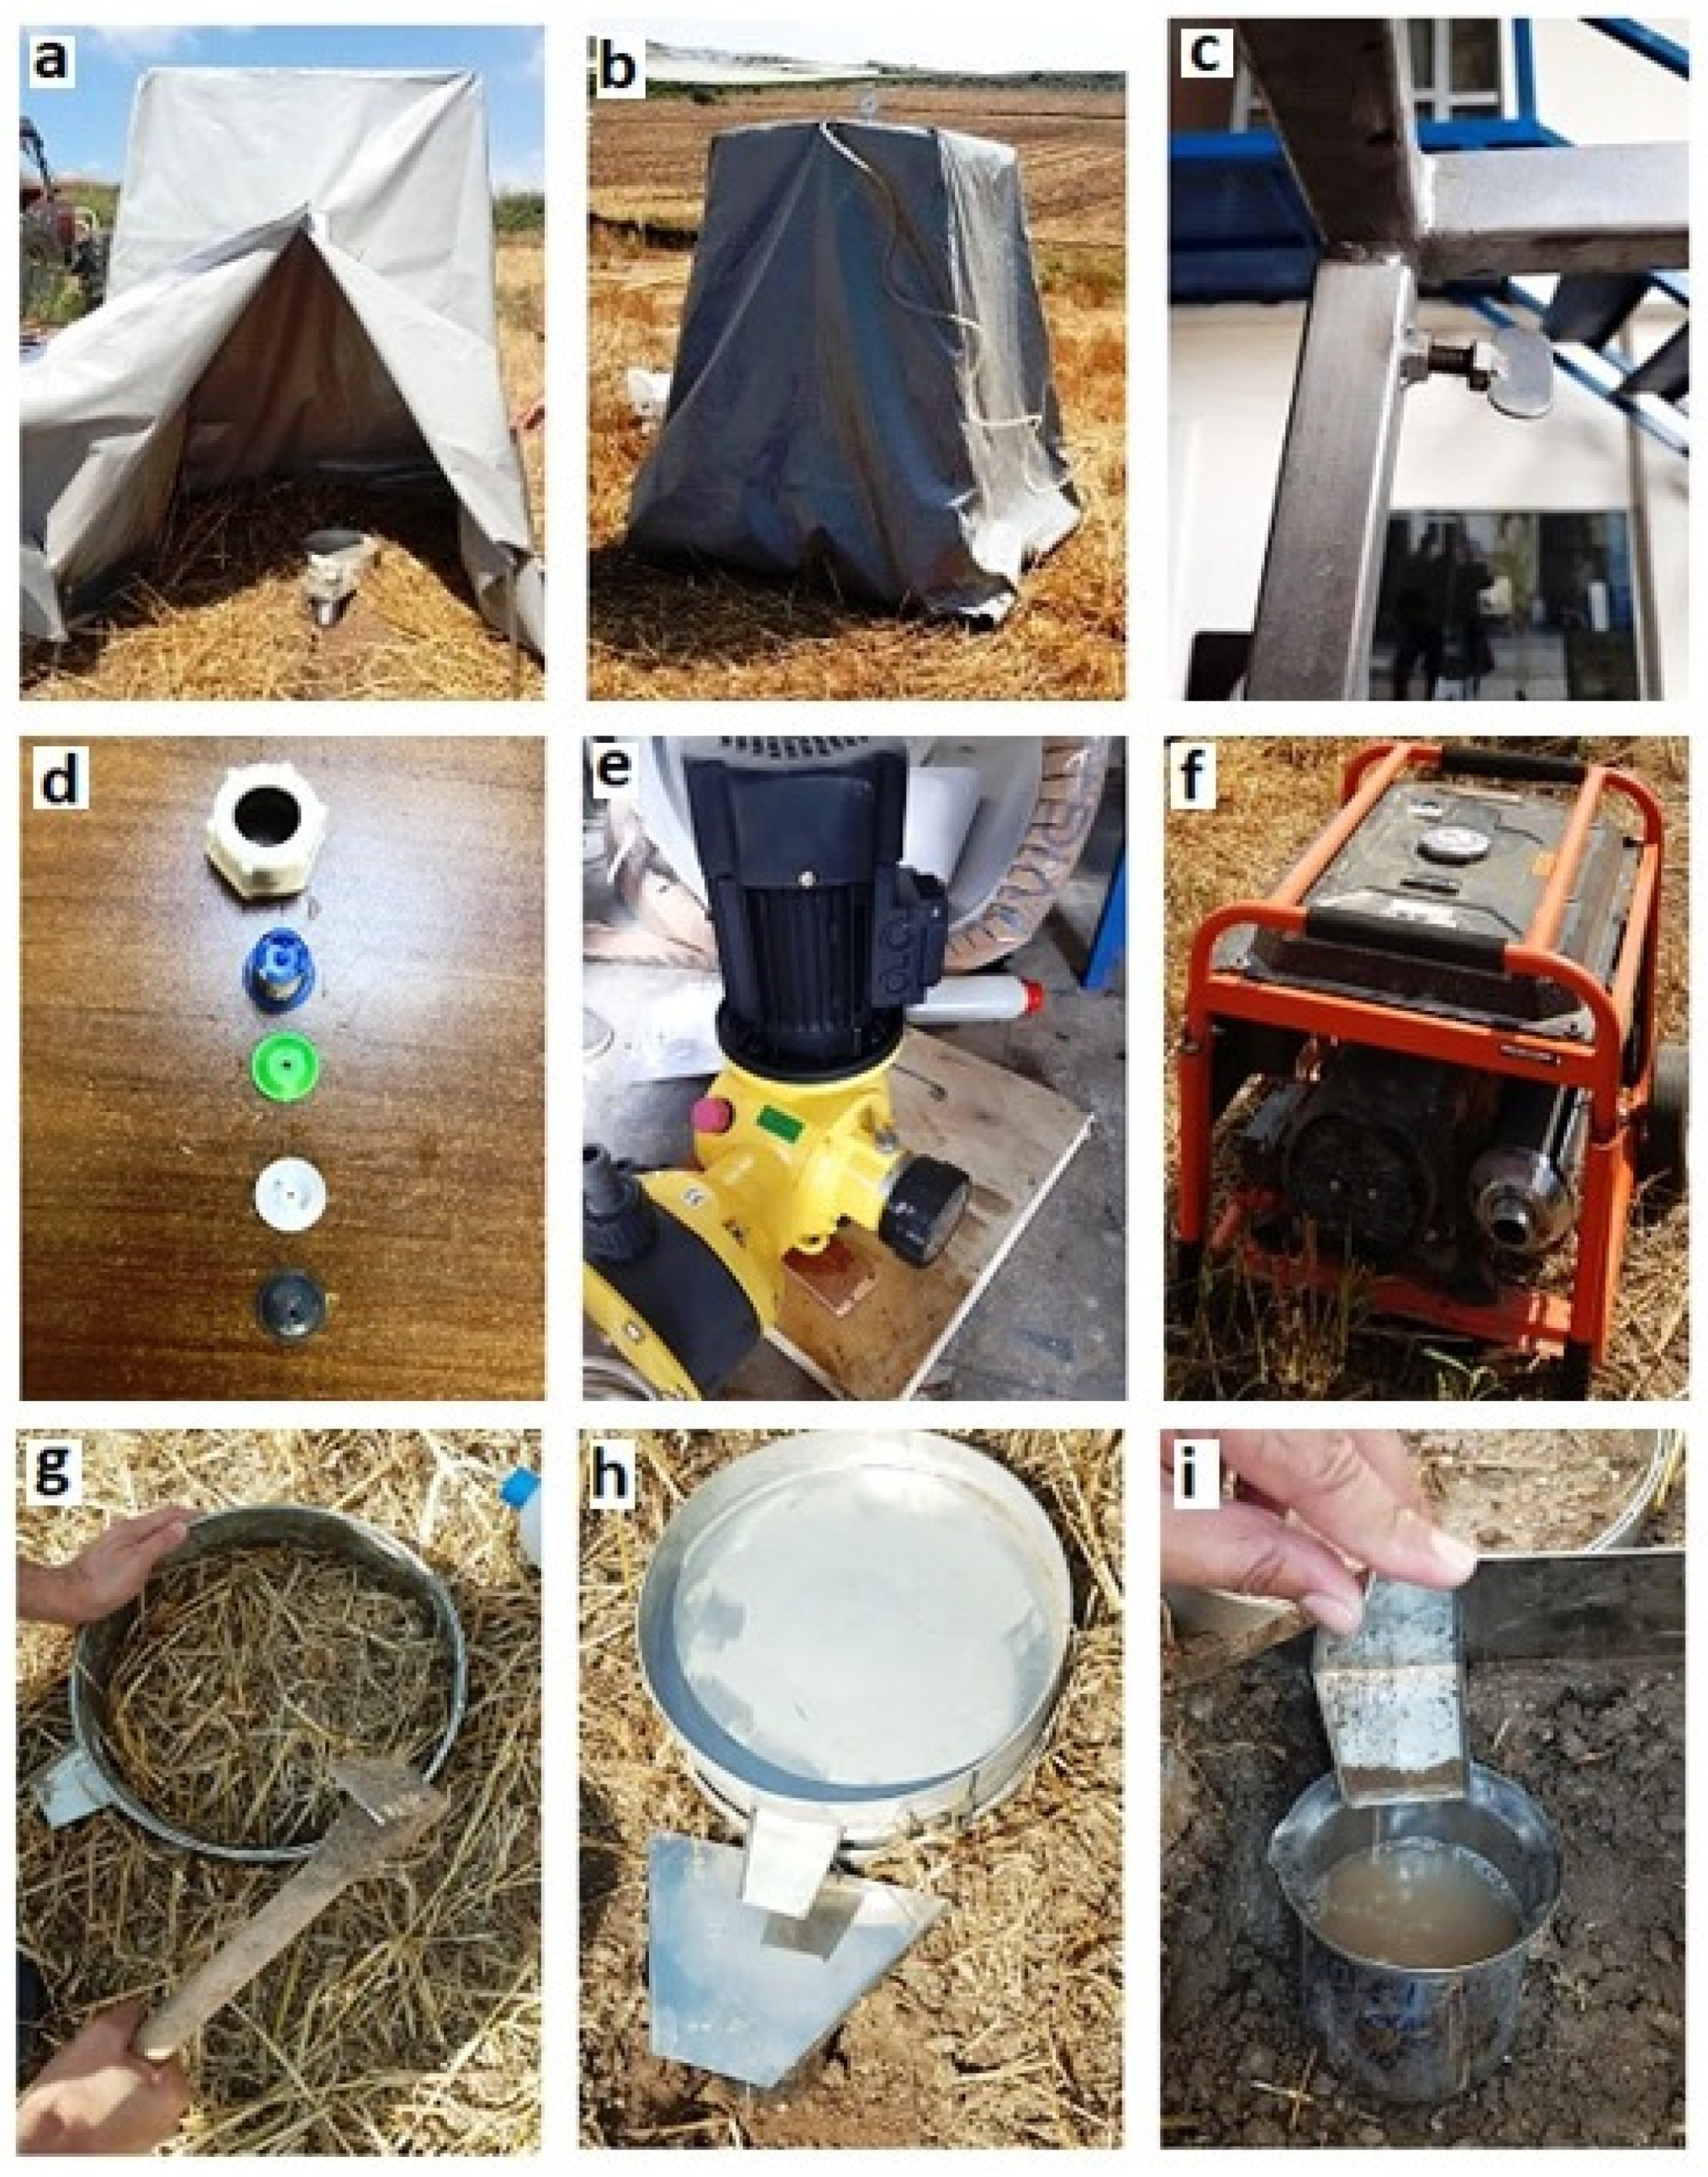
2.2. Rainfall Simulator

The rainfall simulator used in this study was a modified version developed by Rodrigo-Comino et al. [42]. This simulator is a spraying model where the aluminum chassis consists of a square metal frame (1 × 1 m) carrying the sprinkler head and a manometer to measure the pressure of the water supply. Additionally, the nozzle and four telescopic metal legs that hold this frame were new additions. The height of each leg can be adjusted by a screw system that allows the outlet of the sprinkler head to be adjusted from the vertical position to the horizontal, regardless of the inclination of the ground, and to get the best adjustment for the calibration. The chassis ensures that the sprinkler head is up to 2 m above the ground level. The simulator has a cover made of rubber that protects it against the wind.
The sprinkler on the simulator is a HARDI-1553 cone-type individual sprayer. This sprinkler was supplied from Hardi International’s branch in Germany (Wedemark, Germany). This nozzle consists of an external screw, filter, gasket, drop size adjuster cone, and swirl particle that adjusts the droplet spectrum. The single sprinkler is located at the center of the metal ring. With the help of an electric pump, tap water from a tank connected to the tractor is delivered to the sprinkler head. A gasoline-powered generator is used as the power source of the pump. Figure 2 depicts the rainfall simulator and the supporting parts.
A 30 cm diameter of a metal ring (area of 0.07 m2) was used to demarcate the sprinkling area. It includes a triangular-shaped funnel that conveys the water and sediment to a small container. Before starting the simulated rainfall, the ring plot was inserted into the soil surface to a depth of 2 cm using a gummi hammer. During the hammering process, the bottom of the flow funnel was aligned with the soil surface.

2.3. Plot Design and Sampling Strategy

At each location, 24 plots were prepared according to a randomized block design in factorial order with three replications. The length and width of each plot were 35 and 5 m, respectively, giving an area per plot of 175 m2 [48]. Two tillage systems (TT: traditional tillage and RT: reduced tillage) and two different crops (W: wheat and S: sainfoin) were assessed in both experimental areas. In the TT plots, the deep plough was applied once every year, and the soil was cultivated twice using a disc harrow. The planted seedbed was prepared by using a float. The wheat and sainfoin were cultivated using seed sowing machines. The seed varieties of wheat (Triticumaestivium L.) and the sainfoin (Onobrychis Sativa L.) were used, as they are the most commonly used in these regions [48]. For the RT plots, wheat and sainfoin seeds were scattered by hand after preparing the seedbed using a coulter and a roller pair (combination). Sowing was carried out in late fall for both tillage methods at the two locations.
To evaluate the effects of the management systems on the soil and water losses, fallow plots were also prepared at each location. Thus, the total number of plots per location was 24 (2 tillage systems × 2 crops × 2 fallows × 3 replications). Along with the seeds, 200 kg ha−1 of DAP fertilizer (18% NH4+-N, 46% P2O5, w/w) was applied as a base fertilizer. In addition, spring fertilization of CAN fertilizer (13% NH4+-N, 13% NO3−-N, w/w) was carried out in March at a rate of 200 kg ha−1. Weeds were controlled by manual hand picking without the need for chemicals [47].
The plant cultivation experiment was conducted over three years. At the end of the first year, in June, the wheat was harvested. However, the sainfoin was not harvested in the first year, since it was not matured. The same procedures were applied for the wheat plots during each planting period, but the sainfoin was sown only once. After the second year, both plants were harvested during each harvesting period. Approximately one month after the end of the three-year plant cultivation experiment, and after the last harvest, the rainfall simulation experiments were conducted on the plots.

2.4. Rainfall Simulation Procedure

The simulator was calibrated under laboratory conditions. For the calibration, a circular pot (calibration tray) made from a metal sheet with dimensions approximately the size of the rainfall ring plot completely covered the experimental areas. In this study, the drop falling distance was set to 2 m. The simulator was run with 120 mm h−1 intensity for 30 min on each parcel. According to the meteorological data, the average intensities of rainfall in these regions are below the intensity selected for the simulated rainfall. It is known that about 90% of erosion in this region is caused by several high-intensity rainfall events during the year [49]. In addition, it was found that this extreme rainfall intensity was the best in order to reach the highest Christiansen uniformity coefficient (UC). The calibration obtained a UC value of 0.98 with 60 repetitions, which is in agreement with other studies using similar devices [49,50].
During the rainfall simulation on the field, when the desired rainfall intensity occurred, the calibration tray was moved over the rim, and the stopwatch was started at the same time. They were covered with a thin sheet of metal so that the rain falling into the collection funnel did not modify the surface flow. The time from the start of the simulated rainfall to the onset of surface runoff was recorded as the first variable (ET: elapsed time to runoff generation). During thirty minutes of simulated rainfall, the surface runoff and sediment yield were collected at 5-min intervals. Total runoff (R) and soil loss (SL) were evaluated as the second and third variables. Sediment concentration (SC = SL/R), and runoff coefficient (RC = R/total rainfall) were then calculated. The sediment and runoff water values collected at the 5-min intervals were evaluated with distribution graphs and the time intervals the soil water losses were delayed or at which time the losses reached the highest point were determined. Prior to the measurement of the runoff and soil loss, the collection containers were allowed to rest for a sufficient time to settle the sediments. Then, the volume of runoff water siphoned from the containers was measured and recorded. The remaining sediment was expressed in weight after drying in an oven at 105 °C.

2.5. Statistical Analysis

An ANOVA test was applied to the data to evaluate the effects of the various factors (tillage, plant, and location) on the measured variables and whether the results show a normal distribution (Shapiro–Wilk test). In addition, a Duncan test (α = 0.05) was used for multiple comparisons, and the t-test was used for binary comparisons of the locations. These statistical analyses were performed using SPSS v.20 (IBM, New York, NY, USA) following the same procedures carried out by Efe et al. [51].

3. Results

3.1. General Initial Soil Erosion Results

Table 3 shows some descriptive statistics of the variables measured at the end of the rainfall simulations on the 24 plots under wheat and sainfoin cultivation by applying traditional tillage (TT) and reduced tillage (RT) systems in Tarsus and Kahramanmaras. As seen in Table 3, the elapsed time to runoff generation (ET) ranged between 42 and 662 s for the Tarsus plots, while this variable ranged between 166 and 654 s for the Kahramanmaras plots. While the runoff varies between 10.9–38 L m−2 for the Tarsus plots, the minimum and maximum values of this variable for the Kahramanmaras plots were 2.0 and 14.3 L m−2, respectively. The mean soil loss for the Tarsus plots was 535.8 g m−2, and 18.3 g m−2 for the Kahramanmaras plots. The mean sediment concentration for the Tarsus plots was 2.4 g L−1, and 18.2 g L−1 for the Kahramanmaras plots. For the runoff coefficient, the mean values for the Tarsus and the Kahramanmaras plots were 42.5 and 11.4%, respectively.

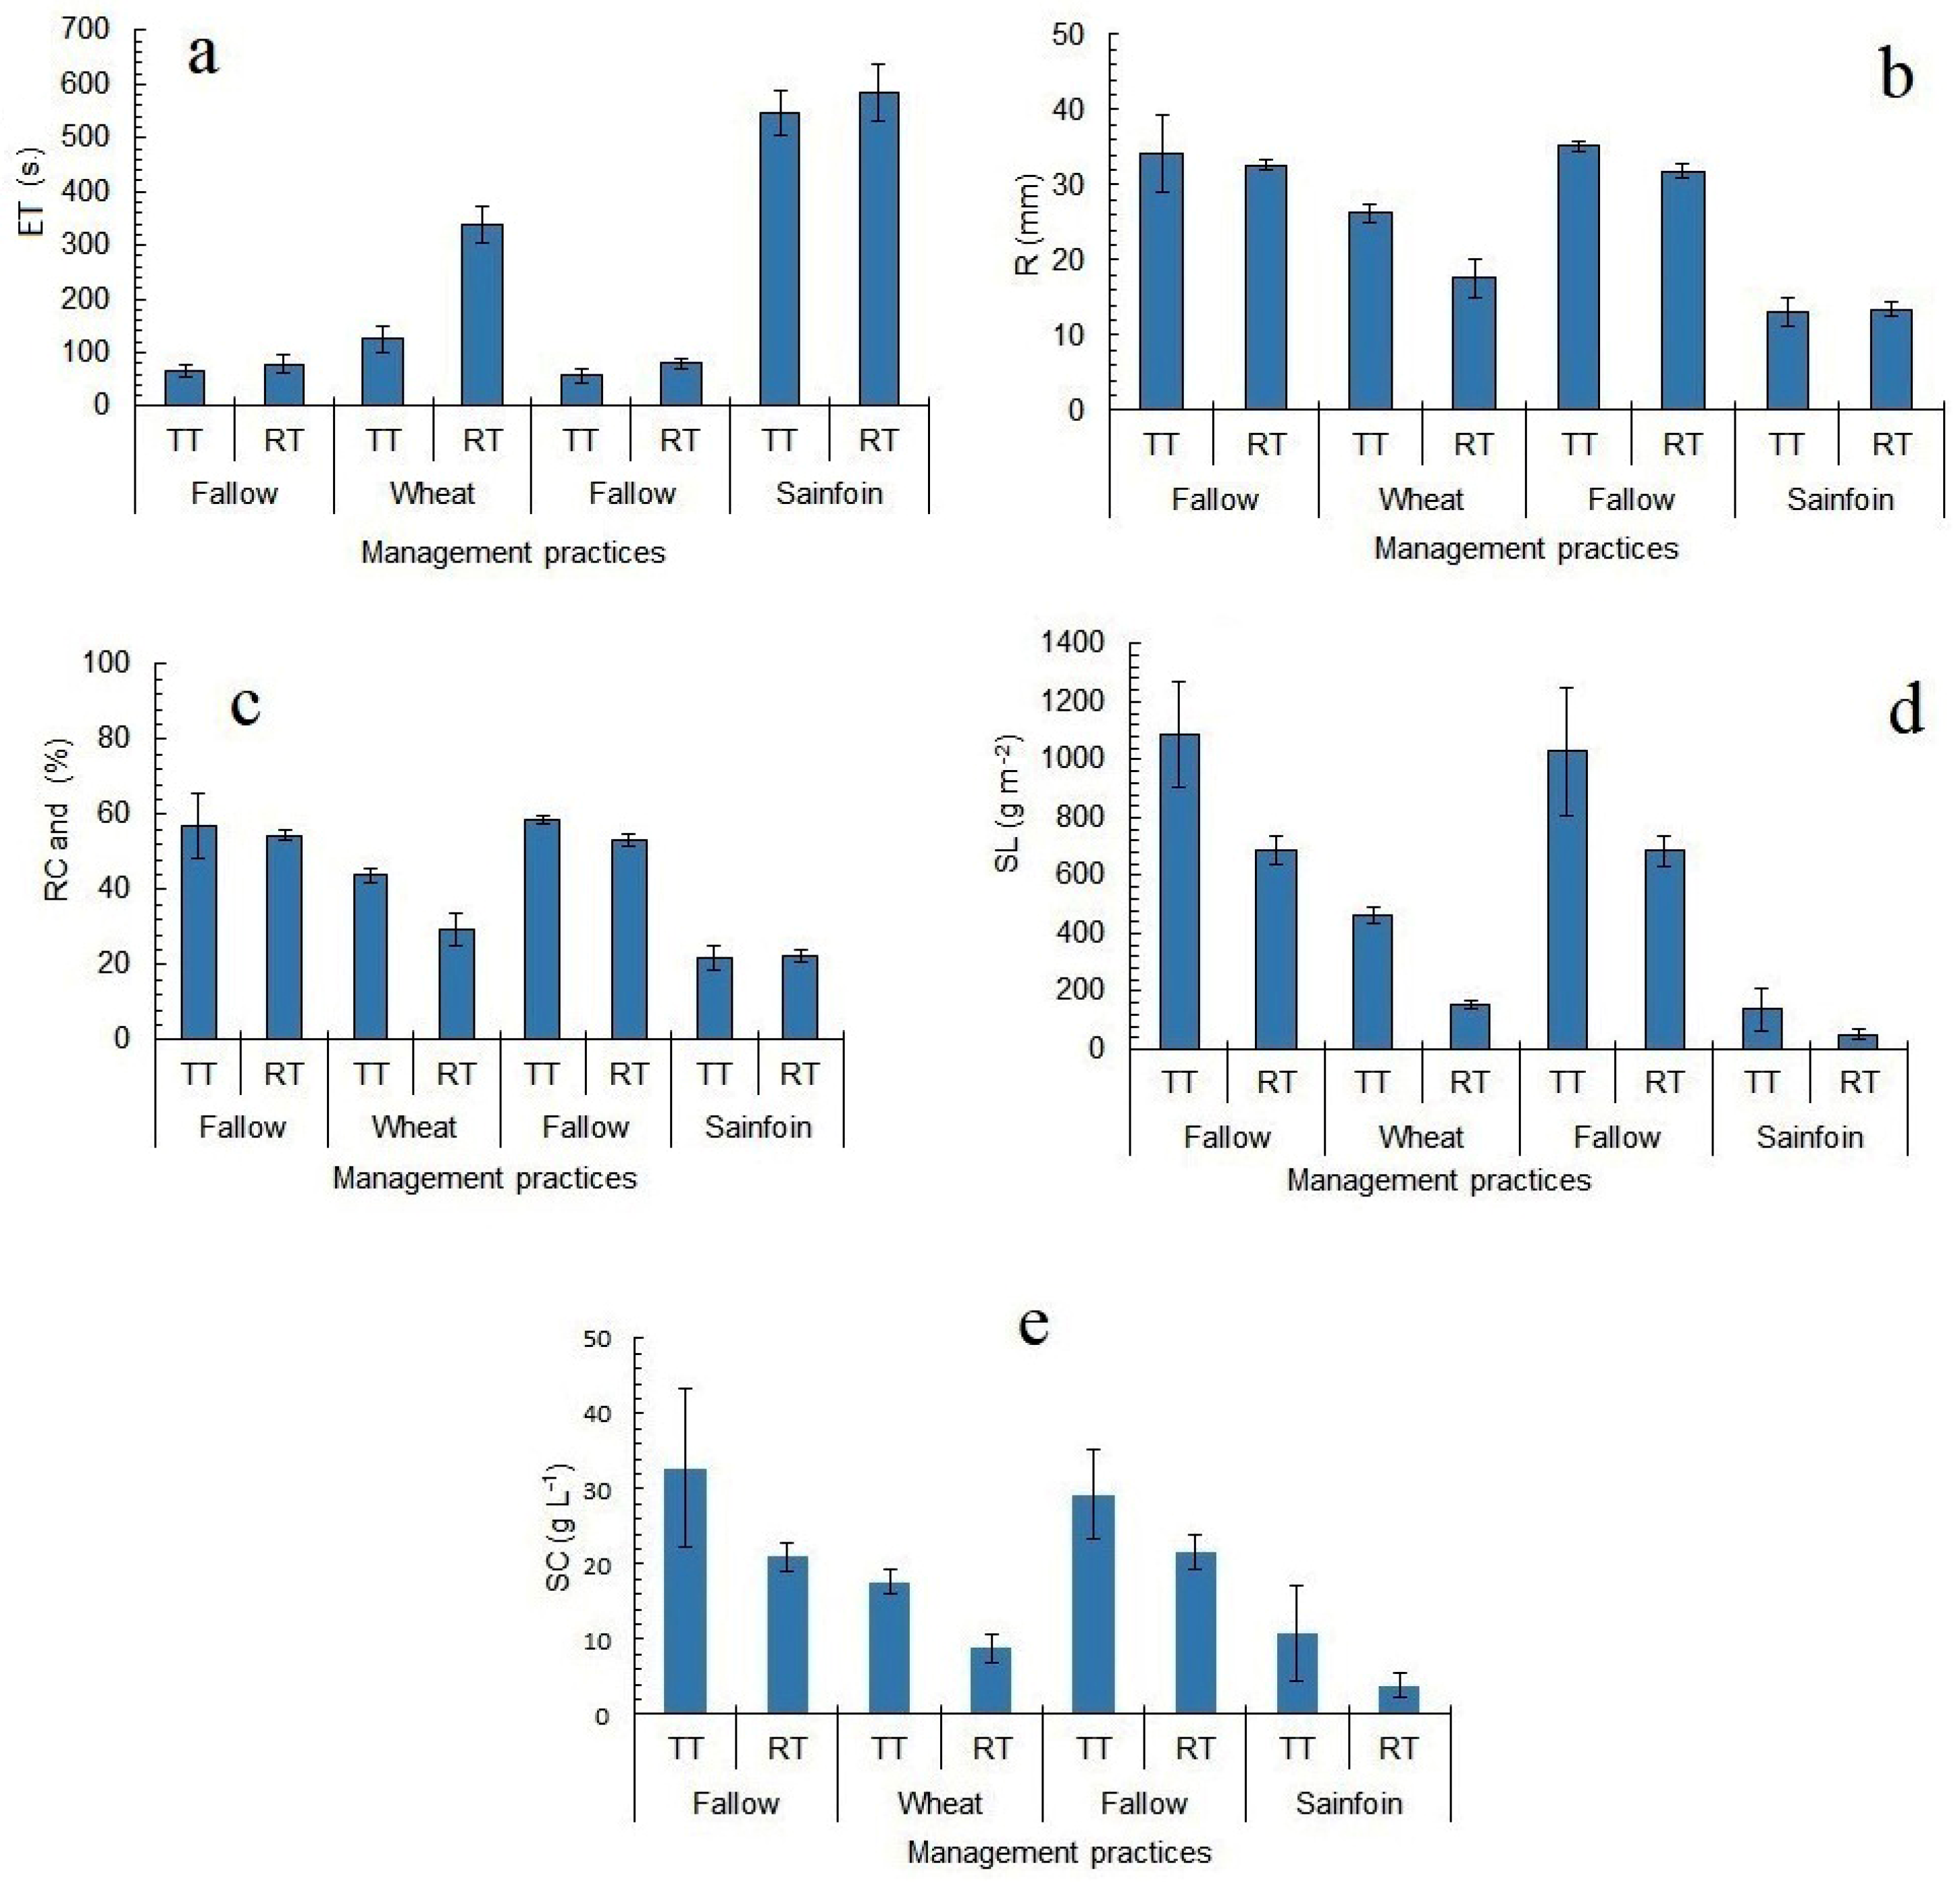
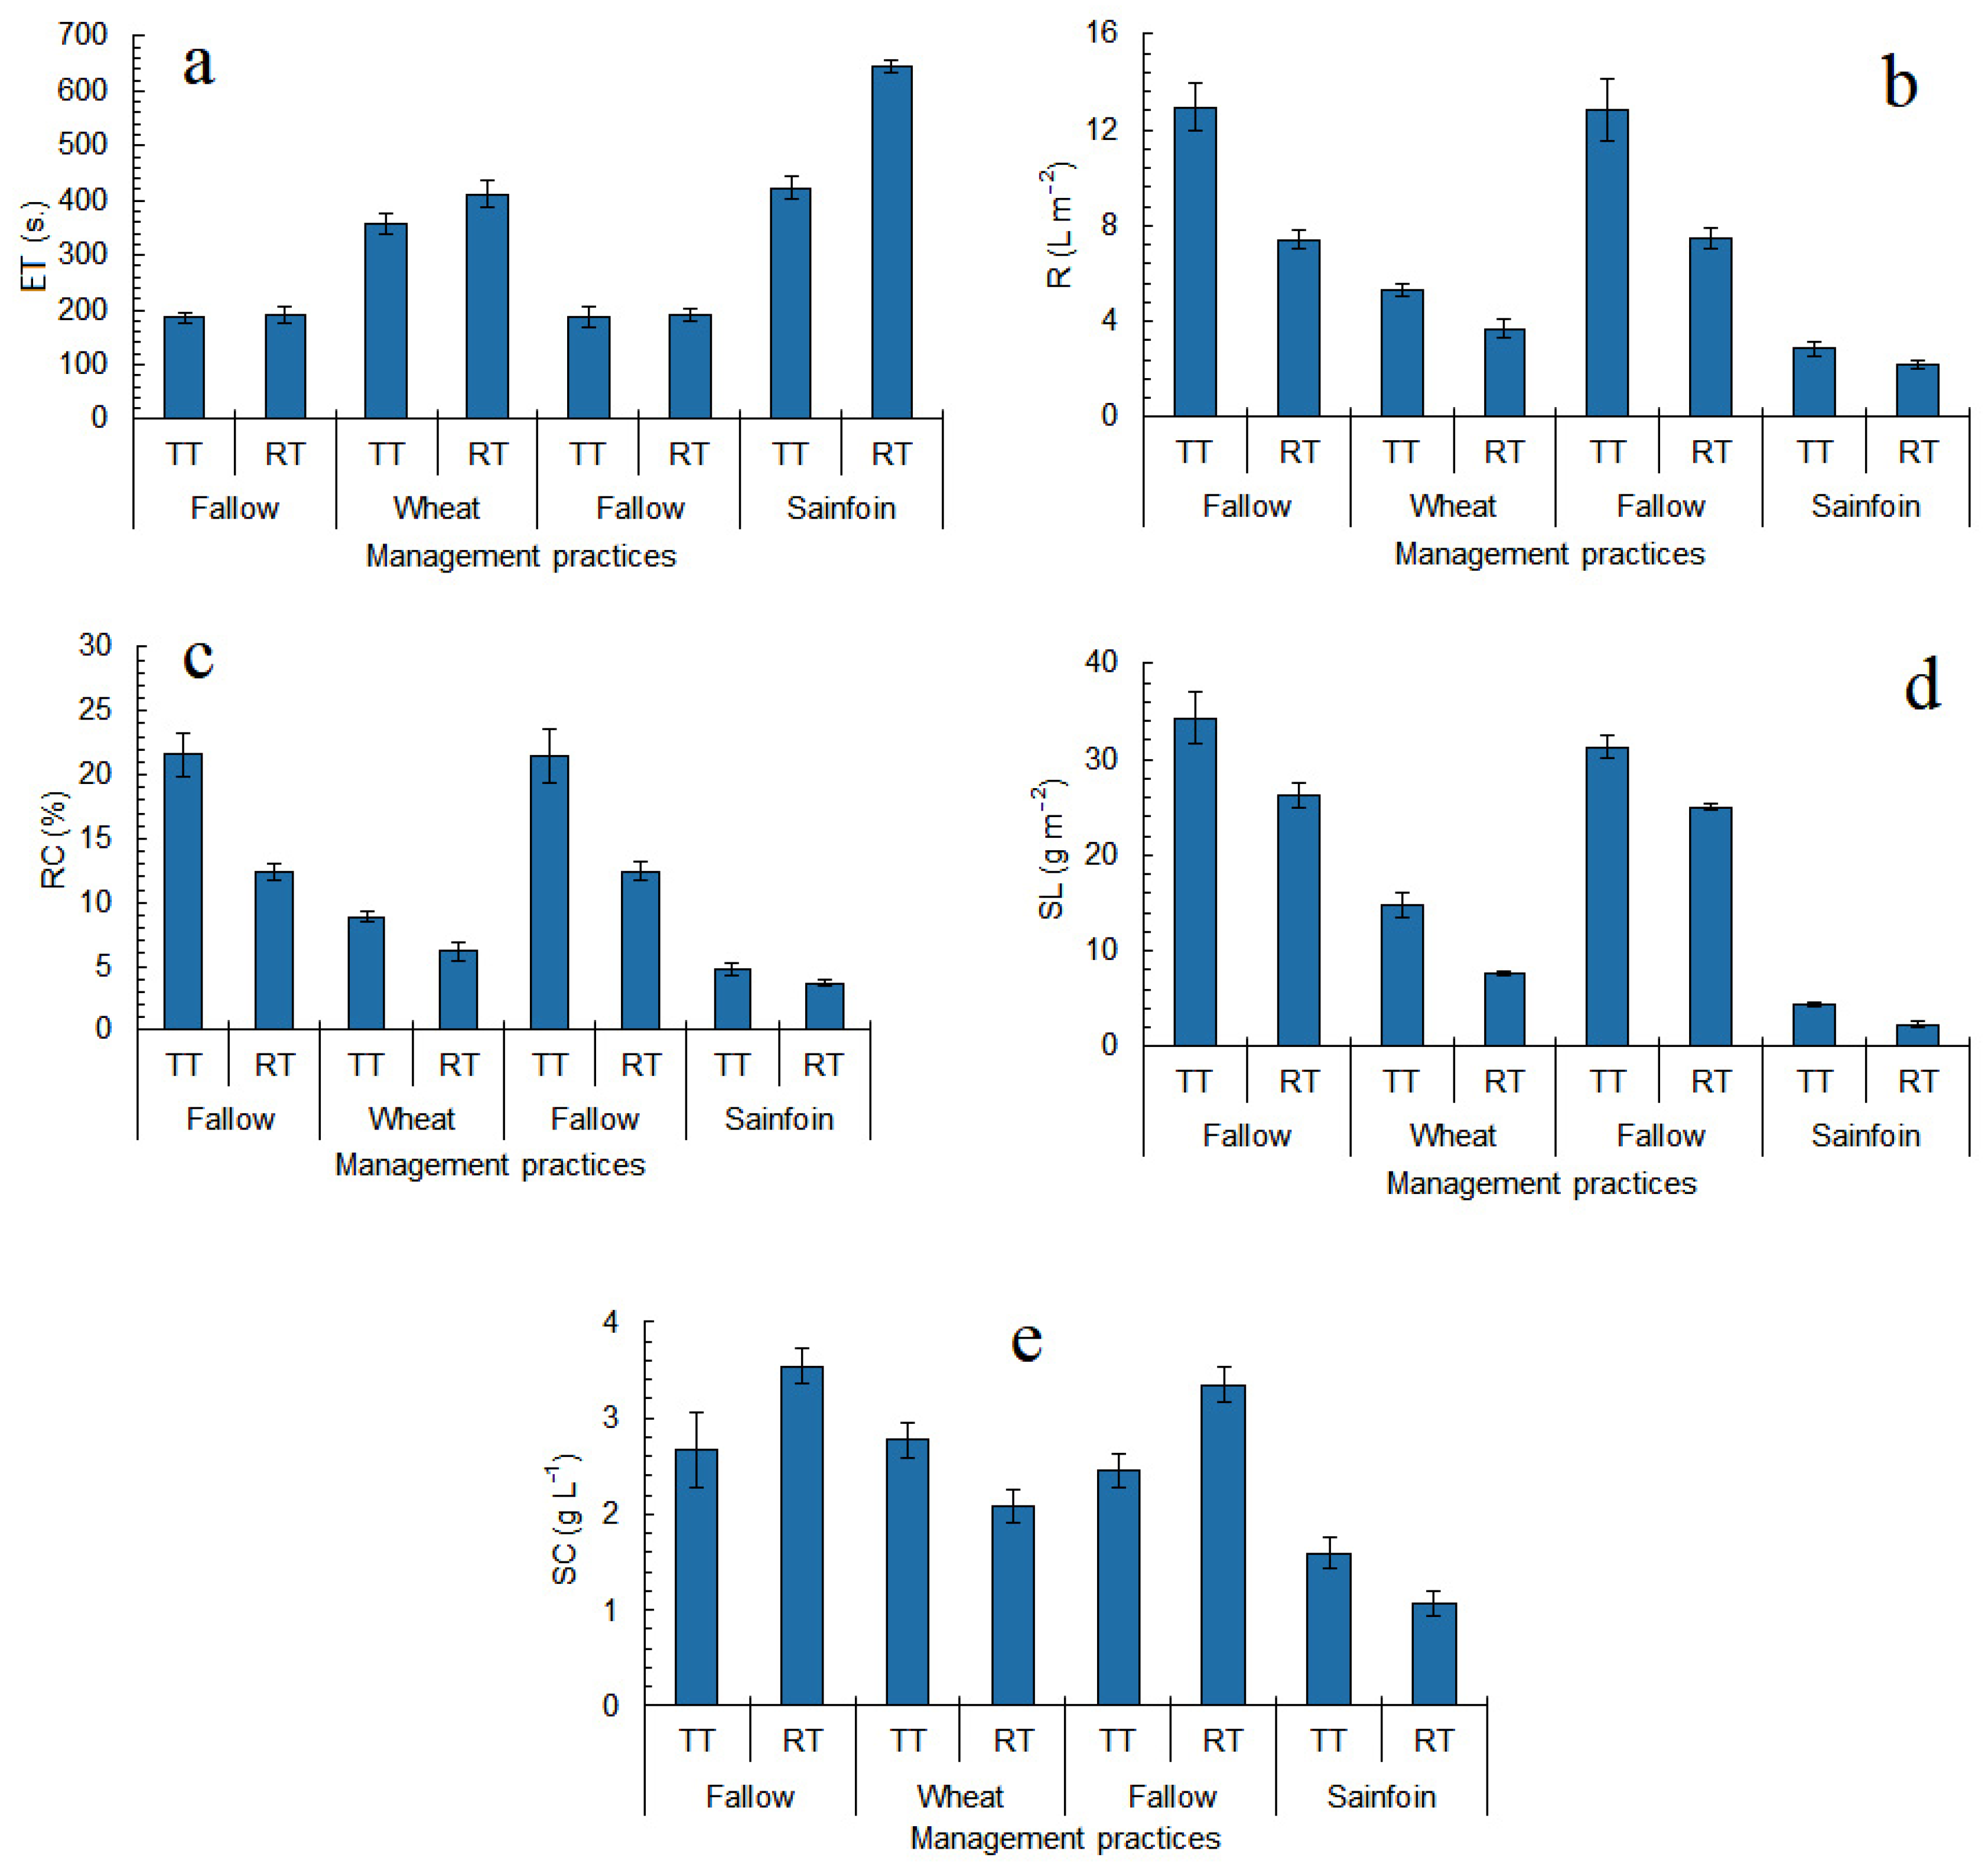
3.2. Effects of Tillage and Crop on Measured Variables

The results of the ANOVA test applied to the dataset obtained from the simulated rainfall trials are presented in Table 4. At Tarsus, tillage (A: TT and RT) has an effect on all of the measured variables at the 1% significance level (p < 0.001). Depending on the crop (B: fallow, wheat, and sainfoin), some effects were observed at the 1% significance level (p < 0.001). At this location, A x B interaction does not affect SC, but has a significant effect on R and RC at the 1% significance level (p < 0.01). In addition, tillage and crop interaction are significant on ET (p < 0.001), and on SL (p < 0.05). As observed in Table 4, the effect of the crop on all measured variables was significant at the 1% level (all p < 0.001) for the plots at Kahramanmaras. The A × B interaction also affected all variables at even the 5% significance level. For this location, the effect of tillage (A) on SC was not statistically significant but was statistically significant on all the other measured variables (p < 0.001).

3.3. Determining the Most Suitable Crop and Management System

The effects of the management practices on the measured variables on the plots in Tarsus are depicted in Figure 3. In general, the fallow plots showed the quickest response to runoff, followed by the wheat crop plots, and then the sainfoin plots (see Figure 3a). With respect to runoff generation on the fallow and the sainfoin plots, no statistical differences between the two tillage systems were observed, while the contrary was displayed by the wheat crop plots with the reduced tillage (RT) system exhibiting about three times shorter response time compared with the traditional tillage (TT) system.
A similar runoff response pattern was observed for the Kahramanmaras plots (Figure 4a) with the exception that there were distinguishable differences for the two tillage systems for the sainfoin plots, the RT showing a delayed runoff response. Wheat cultivation delayed the beginning of runoff in plots with TT and RT. The onset of runoff (644 s) on the sainfoin plots with RT was the longest. Statistically, the runoff response time on the wheat plots with RT (412 s) and that on TT sainfoin plots (422 s) are the same.
As depicted in Figure 3b, the maximum runoff (35.1 L m−2) at Tarsus was observed to occur on the fallow plots with TT, with the amount on the fallow plots with RT being slightly lower. There were no significant statistical differences among the sainfoin plots with TT and RT, but they registered the lowest runoff amounts of about 13.53 L m−2. Considering the runoff on the wheat plots, the RT system registered 17.7 L m−2, while the TT plots recorded a significantly higher value of 26.3 L m−2.
In general, the plots at the Kahramanmaras (Figure 4b) site recorded lower values of runoff compared to their counterparts at the Tarsus site. At the end of the simulated rainfall duration of 30 min, the lowest amount of runoff was observed on the sainfoin plots with RT (2.21 L m−2), which was close to the amount for the TT (2.85 L m−2). Wheat cultivation generated runoff amounts of 5.34 and 3.71 L m−2 with the TT and the RT, respectively, but higher than those on the sainfoin plots (2.85 and 2.21 L m−2). The bar charts showing the mean values of runoff coefficient at the Tarsus and Kahramanmaras sites are shown in Figure 3c and Figure 4c, respectively. In general, the runoff coefficients are lower at the Kahramanmaras site (0.03–0.22) compared to the values at the Tarsus site (0.2–0.6); the sainfoin plot recorded the lowest, below 5%, followed by the wheat plots (6–10%).
At Tarsus, the plots with the highest sediment yield were the fallow with TT (1085 g m−2 and 1029 g m−2). The plot with the lowest sediment yield is the sainfoin with RT, recording a value of 51 g m−2. On the other hand, the sediment yield on the sainfoin plots with TT and the wheat plots with RT are statistically similar (152 and 137 g m−2, respectively) as demonstrated in Figure 3d. At the Kahramanmaras location, the highest sediment yields were measured for the fallow plots with TT (34.31 and 31. 31 g m−2), followed by the fallow plots with RT (26.27 and 24.97 g m−2). Wheat cultivation registered sediment yields as 14.78 g m−2 for TT and 7.71 g m−2 for RT, but the lowest sediment yields were recorded for the sainfoin plots (TT: 4.52 g m−2, RT: 2.36 g m−2). Thus, the treatment with the highest resistance against soil loss due to simulated rainfall was the sainfoin crop with RT (Figure 4d). As expected, a decrease in sediment concentrations was achieved by cultivating either wheat or sainfoin. The lowest sediment concentration occurred on the sainfoin plots with RT (4 g L−1) and also on the wheat plots with RT (9 g L−1). According to Figure 3e, plots are listed as fallow > wheat > sainfoin in terms of sediment concentration. As observed in Figure 4e, the sediment concentration is highest on the fallow plots, especially with RT. The sediment concentration of the TT wheat and fallow plots are not significantly different. The lowest sediment concentration was calculated for the sainfoin plots (TT: 1.59 g L−1, RT: 1.06 g L−1).
Duncan’s Multiple Range Test (DMRT) was carried out using the mean values of the measured variables for the cropping conditions (fallow, wheat, or sainfoin) of the trial plots established at both locations, and the results are compared in Table 5. Sainfoin is the most successful plant in delaying ET at both Tarsus and Kahramanmaras locations. In both locations, the fallow plots registered the highest values of R. The sainfoin plots registered the lowest values of R, and thus sainfoin was more successful than wheat in reducing R value. The fallow plots obtained the highest SL and SC values, and the lowest values were registered on the sainfoin plots. Not surprisingly, the maximum RC was observed on the fallow plots. Although both tillage methods and planting conditions had a similar effect on the measured variables at both locations in general, there is a significant difference between the values of the measured variables at the Tarsus and Kahramanmaras locations. As presented in Table 6, statistically there is no difference between the ET values of Kahramanmaras and Tarsus locations. On the other hand, these two locations exhibit statistical differences from each other in terms of R, RC, SL, and SC.

4. Discussion

The effect of climate change on soil erosion, a major threat to the environment, depends primarily on the change in the erosivity of the rainfall and human impacts. Agricultural practices are key drivers in changing plant biomass and subsequently affect vegetation cover, which intercepts the raindrops [52]. Some studies using the Atmosphere-Ocean Global Climate Change Models developed by the UK Meteorological Office’s Hadley Center and the Canadian Center for Climate Modeling and Analysis [53,54] concluded that rainfall erosivity may increase in the study region due to climate change. Therefore, understanding the impact of extreme rainfall events on soil erosion, and developing appropriate control measures, must be a priority. The effect of climate change on vegetation cover, and the mechanisms by which the biomass change affects runoff and erosion, are extremely complex. It is projected that the changes in soil surface conditions, such as surface roughness, sealing, and crusting, may even be worse due to climate change (e.g., more concentrated rainfall events and higher temperatures). Thus, the amount of soil and water losses may be affected by climate change.
The intensity of agricultural practices in southern Turkey, and the fact that the land remains bare (without vegetation cover) after the harvesting period in July–August until it is cultivated again in November, increases the risk of soil erosion, as other authors have demonstrated along the Mediterranean gradient [55,56]. For this reason, the potential negative impacts of various agricultural practices (e.g., tillage, cover crop, etc.) on erosion have been studied in this region, which is becoming more and more extremely vulnerable to erosion. Although many such studies have been carried out, especially in the 2000s, the number of studies on specific products with in situ measurements that are important for a particular region, and taking into consideration extreme rainfall events, are limited, for Turkey in particular. Such studies are needed to shed light on the problem for policy makers and farmers in the region, and the involved scientists. As a step in this direction, fallow plots and wheat and sainfoin crop plots, which are important agricultural fields in this territory, were established in two different representative locations in Turkey.
From the results and statistical assessments, the time required for the beginning of runoff initiation is extended by the RT (reduced tillage) system (Figure 3a and Figure 4a). As a consequence, smaller amounts of runoff occurred in both locations for the RT system compared to the TT (traditional tillage) system (Figure 3b and Figure 4b) and, thus, lesser amounts of sediment were transported (Figure 3c and Figure 4c). In both Tarsus and Kahramanmaras locations, the runoff in the trial plots with RT decreased compared to the plots with TT (Figure 3e and Figure 4e). Tillage system determines soil and water losses in wheat and sainfoin crops. Reduced tillage diminishes the soil losses under intense thunderstorms. These results could be attributed to the fact that the soil with reduced tillage has a lower volumetric weight, higher macroporosity, higher aggregate stability, and shows more elevated infiltration rates compared to the soil with traditional tillage, particularly for long-term periods [57,58]. It is known that reduced tillage positively affects soil structure in the medium- and the long-term [59], and this positive effect is because of carbon sequestration, macroporosity continuity [60], and reduced soil compaction as a result of reduced field traffic by the tractors [61]. Although the traditional tillage systems can increase soil porosity in the short-term, they negatively affect the physical properties of the soil in the long term, as other authors have demonstrated [23,62,63].
Some scholars investigating the effects of different management practices on erosion in different agricultural areas [64] have concluded that the amount of sediment formed under simulated rainfall was decreased by applying reduced tillage. Additionally, with simulated rainfall of various intensities ranging from 20 to 120 mm h−1, Poulenard et al. [65] concluded that runoff coefficient and sediment yield increased in the tilled soil compared to the soil without tillage. These researchers working on different soil types in two different locations attributed the difference in runoff and amount of the sediment yield between the locations to tillage, and that tillage could have different effects on different soils.
From this study, the achievement of reducing soil and water losses under extreme simulated rainfall using the RT method could also be attributed to the soil physical properties of the RT plots that are less disturbed than those of TT plots, which were tilled for three years. These TT plots are more vulnerable to erosion under extreme rainfall events. Therefore, our results corroborate the findings of the above-mentioned literature.
As observed in Figure 3d, the sediment concentration in the RT plots was lower than the TT plots at Tarsus. However, considering only the fallow plots in Kahramanmaras (Figure 4d), the sediment concentration in the RT system was higher than that of the TT plots. Since there is stubble in the cultivated plots after harvest, fragmentation occurs to a large extent by this mechanism. Because the fallow plots are bare (no vegetation cover), both slaking and raindrop impact mechanisms played a major role in the fragmentation of soil aggregates on these plots, since they directly hit the bare soil surface. The raindrop falling on the bare soil surface not only provides the fragmentation by transferring its energy to the soil, but also contributes to the transport of fragmented soil particles and the slurry soil–water formation in the direction of the slope [66]. For the above-mentioned reasons, the sediment yield of the fallow plots and the runoff thereof could be higher than in the cultivated plots at both locations. Consequently, the runoff coefficient of the fallow parcels is higher than the wheat and the sainfoin parcels.
Plant species grown in agricultural areas can also affect the amount of soil and water loss. Sainfoin is the most efficient crop to control the soil and water losses. In this study, since the start time of runoff on the sainfoin parcels was the longest, the runoff and soil loss values for the sainfoin parcels were less than those of the wheat plots in both locations (Figure 3 and Figure 4). Fallow plots are the ones with the highest soil and water losses. This result could be attributed to the fact that forage plants, especially perennials, leave more organic debris on the soil than annual grains and have a positive effect on soil aggregation and pore continuity in the long term [66,67]. Including perennial forage crops in cropping patterns is considered one of the best ways to increase agricultural sustainability [68]. As the origin of the organic matter changes, the effect of organic matter on aggregate stability may also change [69].
In both locations, water losses from the sainfoin plots are less than those of the wheat and the fallow plots, and this is related to ET (Figure 3a,b, and Figure 4a,b). This can be attributed to the continuity of porosity because of the effects of the roots. Since wheat is an annual plant, it can increase the infiltration rate in the soil to a certain level, but the effects of the roots of the sainfoin, which is a perennial plant, on aggregate formation will be greater. Therefore, the structural stability under the sainfoin continued for a longer period, and the infiltration rate got higher, thus preventing the increase of runoff with time. In the future, it would be useful to produce a hydrograph to comment on the distribution of the runoff over time. Possibly, the previous two comments are related to this variation over time.
The fact that the sediment yields in the traditionally tilled fallow plots were the highest in the first 5 min of rainfall and then continued to decrease could be attributed to the low structural strength of the parcels, which were densely tilled each year, and also to the simulated rainfall performed during a very dry season. Although there is bonding between the soil peds due to drying, the bonding in the fallow plots without biological factors is much weaker than in the cultivated parcels. Therefore, when a rainfall with intensity as high as 120 mm h−1 was applied to the soil, a large amount of soil was transported from the dry and unprotected plot surface in the first 5 min. Afterwards, small pebbles in the soil were exposed. The raindrops falling on these pebble fragments, which serve as amour, lose the energy required to break up and dislodge the soil particles. Additionally, the larger mass pebbles are difficult to be carried in suspension. Therefore, it is thought that the amount of sediment transported decreases with time although the rainfall intensity remained constant. This can be attributed to the fact that the water permeability in the soil does not decrease much during rainfall due to the protected structural strength. On the wheat plots, the roots of the plants and the residues blended with the soil provided a certain degree of structural stability. However, the structure having a certain amount of strength becomes more vulnerable in the long term compared to the sainfoin plots due to the tillage performed each year. The increase in sediment yield in the wheat plots with a low rate of growth up to a certain moment during the simulated rainfall but increasing with a very steep rate of growth after the breakpoint can be attributed to those factors described as structural stability.
In a study conducted under simulated rainfall produced by a field-type sprinkler [70], the relationship between soil susceptibility to erosion, macro-aggregate strength, and organic carbon content of surface soil was investigated for various tillage methods. The researchers revealed that there has been a strong relationship between the macro-aggregate strength and the organic carbon content of the surface soil and that the amount of sediment and runoff measured in the initial 30 min of simulated rainfall depends on the strength of the macro-aggregates. Therefore, the researchers stated that macro-aggregate strength and organic carbon content of soils were the variables that could be used to evaluate soil erosion, especially when comparing different soil management practices.
Considering the locations where the trials were established and the comparisons using the measured variables, it is seen that all measured variables, except for the time required for the initiation of runoff, show a great difference between the locations. For example, while the average amount of runoff in the Tarsus location is 25.5 L m−2, about 25% of this value was registered in Kahramanmaras (6.85 L m−2). While the average amount of sediment yield for the plots in Tarsus location is more than 500 g m−2, which is considered a very high value, Kahramanmaras registered only 18.27 g m−2. Kahramanmaras is also more desirable compared to the Tarsus location in terms of runoff coefficient. This could be due to the differences in the genetic and physicochemical properties of the soils in the trial plots. For example, since surface stoniness minimizes rill formation [71,72,73], lesser amounts of finger erosion and erosion between fingers were observed in Kahramanmaras soil, which had a stoniness value of 15%, and as a result, the amount of runoff and sediment yield of the plots were lower than those of Tarsus plots. On the other hand, the WAS value of Kahramanmaras soil, which is classified as Vertic Haploxerept, is 76.1%. The WAS value of Tarsus soil, which is classified as Typic Xerochrepts, is 29.1% (Table 2). Higher aggregate stability means that the soil structure is stable, and it indicates the presence of temporal and spatial pore continuity in the soil. Since the WAS value, which is an indicator of the resistance of macroaggregates (1–2 mm) to water, is very high in the soil at Kahramanmaras, the runoff value and the sediment yield of this soil were lower than those of Tarsus soil. Another significant difference between these two soil types is the saturated hydraulic conductivity. While this value is 5.75 cm h−1 for the vertic soil of Kahramanmaras, it is 2.61 cm h−1 for the ochric soil of Tarsus (Table 2). For soil having a higher hydraulic conductivity, it is expected that runoff will be less and, consequently, the sediment yield will decrease after reaching saturation conditions under simulated rainfall.

5. Conclusions

There is a contrasted response between the two study sites: Tarsus and Kahramanmaras. The reduced tillage system was successful in reducing sediment yield and runoff generated from parcels growing wheat and sainfoin compared to traditional tillage in Tarsus location, but runoff and soil loss were found to be very high compared to parcels constructed in the Kahramanmaras location. Therefore, different reduced-tillage systems should be developed to cope with extreme rainfall conditions in the Tarsus location and similar environments. The effect of high-intensity rainfall on erosion should be tested for each specific crop of the respective regions, and management recommendations should be developed accordingly. In order to eliminate the negative effects of climate change on the agricultural environments in the Mediterranean Turkish climate zone, there is a need to develop efficient management practices in the future. The findings of this study could inform farmers, scientists, and legislators considering sustainable agriculture and ecological balance in the future.

Author Contributions

Conceptualization: T.Y. and A.C.; methodology: T.Y., T.D., K.K., V.G., J.R.-C., Y.G.-A., and A.C.; software: T.Y.; validation: T.Y., A.C., and R.G; formal analysis: T.Y., T.D., K.K., and V.G.; investigation: T.Y., R.G., T.D., and K.K.; resources: R.G.; data curation: T.Y. and J.R.-C.; writing—original draft preparation: T.Y. and J.R.-C.; writing—review and editing: A.C. and Y.G.-A.; visualization: T.Y. and Y.G.-A.; supervision: A.C.; project administration: R.G.; funding acquisition: R.G. All authors have read and agreed to the published version of the manuscript.

Funding

This research was funded by The Scientific and Technological Research Council of Turkey (TUBITAK), grant number 114R052.

Institutional Review Board Statement

Not Applicable.

Informed Consent Statement

Not Applicable.

Data Availability Statement

Not Applicable.

Acknowledgments

This project was under an EU COST action Connecteur (Code: ES1306). The used nozzles were gifted by HARDI International Co. We would like to thank the aforementioned organizations.

Conflicts of Interest

The authors declare no conflict of interest.

Abbreviations

AWCavailable water content for the plant
BDbulk density
Cclay content
CaCO3total calcium carbonate
ETelapsed time to runoff generation
FCfield capacity (moisture content at −33 kPa suction)
Ksatsaturated hydraulic conductivity
pHsoil reaction measured in saturation paste
PWPpermanent wilting point (moisture content at −1500 kPa suction)
Rtotal runoff volume
RCrunoff coefficient
Ssand content
SATwater content in saturation paste
SCsediment concentration
SCLsandy clayey loam
Sisilt content (USDA)
SLsandy loam
SLsoil loss
Slttotal salt content measured in saturation paste
SOMtotal soil organic matter content
WASwet aggregate stability of macro-aggregates of 1–2 mm particle size

References

  1. Raclot, D.; Le Bissonnais, Y.; Louchart, X.; Andrieux, P.; Moussa, R.; Voltz, M. Soil tillage and scale effects on erosion from fields to catchment in a Mediterranean vineyard area. Agric. Ecosyst. Environ. 2009, 134, 201–210. [Google Scholar] [CrossRef]
  2. Sharma, N.K.; Singh, R.J.; Mandal, D.; Kumar, A.; Alam, N.M.; Keesstra, S. Increasing farmer’s income and reducing soil erosion using intercropping in rainfed maize-wheat rotation of Himalaya, India. Agric. Ecosyst. Environ. 2017, 247, 43–53. [Google Scholar] [CrossRef]
  3. Keesstra, S.; Mol, G.; de Leeuw, J.; Okx, J.; de Cleen, M.; Visser, S. Soil-related sustainable development goals: Four concepts to make land degradation neutrality and restoration work. Land 2018, 7, 6792. [Google Scholar] [CrossRef] [Green Version]
  4. Visser, S.; Keesstra, S.; Maas, G.; De Cleen, M. Soil as a Basis to Create Enabling Conditions for Transitions Towards Sustainable Land Management as a Key to Achieve the SDGs by 2030. Sustainability 2019, 11, 133. [Google Scholar] [CrossRef] [Green Version]
  5. Álvaro-Fuentes, J.; Plaza-Bonilla, D.; Arrúe, J.L.; Lampurlanés, J.; Cantero-Martínez, C. Soil organic carbon storage in a no-tillage chronosequence under Mediterranean conditions. Plant Soil 2014, 376, 31–41. [Google Scholar] [CrossRef] [Green Version]
  6. Atucha, A.; Merwin, I.A.; Brown, M.G.; Gardiazabal, F.; Mena, F.; Adriazola, C.; Lehmann, J. Soil erosion, runoff and nutrient losses in an avocado (Perseaamericana Mill) hillside orchard under different groundcover management systems. Plant Soil 2013, 368, 393–406. [Google Scholar] [CrossRef] [Green Version]
  7. Berhe, A.A.; Barnes, R.T.; Six, J.; Marín-Spiotta, E. Role of soil erosion in biogeochemical cycling of essential elements: Carbon, nitrogen, and phosphorus. Annu. Rev. Earth Planet. Sci. 2018, 46, 521–548. [Google Scholar]
  8. Duguma, L.A.; Hager, H.; Sieghardt, M. Effects of land use types on soil chemical properties in smallholder farmers of central highland Ethiopia. Ecology 2010, 29, 1–14. [Google Scholar] [CrossRef]
  9. Al-Shammary, A.A.G.; Al-Sadoon, J.N.A. Influence of tillage depth, soil mulching systems and fertilizers on some thermal properties of silty clay soil. GJAR 2014, 2, 18–32. [Google Scholar]
  10. Ayoubi, S.; Mokhtari, J.; Mosaddeghi, M.R.; Zeraatpisheh, M. Erodibility of calcareous soils as influenced by land use and intrinsic soil properties in a semiarid region of central Iran. Environ. Monit. Assess. 2018, 190. [Google Scholar] [CrossRef]
  11. Mehra, P.; Baker, J.; Sojka, R.E.; Bolan, N.; Desbiolles, J.; Kirkham, M.B.; Ross, C.; Gupta, R. Chapter five—A review of tillage practices and their potential to impact the soil carbon dynamics. Adv. Agron. 2018, 150, 185–230. [Google Scholar] [CrossRef]
  12. O’Brien, P.L.; Daigh, A.L.M. Tillage practices alter the surface energy balance—A review. Soil Tillage Res. 2019, 195, 104354. [Google Scholar] [CrossRef]
  13. Wang, X.-B.; Cai, D.-X.; Hoogmoed, W.B.; Oenema, O.; Perdok, U.D. Potential effect of conservation tillage on sustainable land use: A review of global long-term studies. Pedosphere 2006, 16, 587–595. [Google Scholar] [CrossRef]
  14. Lampurlanes, J.; Cantero-Martinez, C. Soil bulk density and penetration resistance under different tillage and crop management systems and their relationship with barley root growth. Agron. J. 2003, 95, 526–536. [Google Scholar] [CrossRef] [Green Version]
  15. Buczko, U.; Bens, O.; Hüttl, R.F. Tillage effects on hydraulic properties and macroporosity in silty and sandy soils. Soil Sci. Soc. Am. J. 2006, 70, 1998–2007. [Google Scholar] [CrossRef]
  16. Gristina, L.; Keesstra, S.; Novara, A. No-till durum wheat yield success probability in semi arid climate: A methodological framework. Soil Tillage Res. 2018, 181, 29–36. [Google Scholar] [CrossRef]
  17. Kiani-Harchegani, M.; Sadeghi, S.H.; Asadi, H. Comparing grain size distribution of sediment and original soil under raindrop detachment and raindrop-induced and flow transport mechanism. Hydrol. Sci. J. 2018, 63, 312–323. [Google Scholar] [CrossRef]
  18. Bone, J.; Head, M.; Barraclough, D.; Archer, M.; Scheib, C.; Flight, D.; Voulvoulis, N. Soil quality assessment under emerging regulatory requirements. Environ. Int. 2010, 36, 609–622. [Google Scholar] [CrossRef] [Green Version]
  19. Keesstra, S.D.; Davis, J.; Masselink, R.H.; Casalí, J.; Peeters, E.T.; Dijksma, R. Coupling hysteresis analysis with sediment and hydrological connectivity in three agricultural catchments in Navarre, Spain. J. Soils Sediments 2019, 19, 1598–1612. [Google Scholar] [CrossRef] [Green Version]
  20. Arnaez, J.; Lasanta, T.; Ruiz-Flaño, P.; Ortigosa, L. Factors affecting runoff and erosion under simulated rainfall in Mediterranean vineyards. Soil Tillage Res. 2007, 93, 324–334. [Google Scholar]
  21. Buttar, G.S.; Sidhu, H.S.; Singh, V.; Jat, M.L.; Gupta, R.; Singh, Y.; Singh, B. Relay planting of wheat in cotton: An innovative technology for enhancing productivity and profitability of wheat in cotton-wheat production system of South Asia. Exp. Agric. 2013, 49, 19–30. [Google Scholar] [CrossRef] [Green Version]
  22. Yildirim, M.; Dumlupinar, Z.; Taner, A. Effects of conventional and reduced tillage methods on some traits of wheat in cotton-wheat system. KSU J. Agric Nat. 2018, 21, 678–685. [Google Scholar] [CrossRef] [Green Version]
  23. Crittenden, S.J.; Poot, N.; Heinen, M.; van Balen, D.J.M.; Pulleman, M.M. Soil physical quality in contrasting tillage systems in organic and conventional farming. Soil Tillage Res. 2015, 154, 136–144. [Google Scholar] [CrossRef]
  24. Morris, N.; Miller, P.; Froud-Williams, R. The adoption of non-inversion tillage systems in the United Kingdom and the agronomic impact on soil, crops and the environment: A review. Soil Tillage Res. 2010, 108, 1–15. [Google Scholar] [CrossRef]
  25. Soane, B.D.; Ball, B.C.; Arvidsson, J.; Basch, G.; Moreno, F.; Roger-Estrade, J. No-till in northern, western and south-western Europe: A review of problems and opportunities for crop production and the environment. Soil Tillage Res. 2012, 118, 66–87. [Google Scholar] [CrossRef] [Green Version]
  26. Ji, B.; Zhao, Y.; Mu, X.; Liu, K.; Li, C. Effects of tillage on soil physical properties and root growth of maize in loam and clay in central China. Plant Soil Environ. 2013, 7, 295–302. [Google Scholar] [CrossRef] [Green Version]
  27. Al-Kaisi, M.M.; Yin, X.; Licht, M.A. Soil carbon and nitrogen changes as influenced by tillage and cropping systems in some Iowa soils. Agric. Ecosyst. Environ. 2005, 105, 635–647. [Google Scholar] [CrossRef]
  28. De Alba, S.; Lindstrom, M.; Schumacher, T.E.; Malo, D.D. Soil landscape evolution due to soil redistribution by tillage: A new conceptual model of soil catena evolution in agricultural landscapes. Catena 2004, 58, 77–100. [Google Scholar]
  29. Zhao, L.; Hou, R.; Wu, F.; Keesstra, S. Effect of soil surface roughness on infiltration water, ponding and runoff on tilled soils under rainfall simulation experiments. Soil Tillage Res. 2018, 179, 47–53. [Google Scholar] [CrossRef]
  30. Jansa, J.; Mozafar, A.; Kuhn, G.; Anken, T.; Ruh, R.; Sanders, I.R.; Frossard, E. Soil tillage affects the community structure of mycorrhizal fungi in maize roots. Ecol. Appl. 2003, 13, 1164–1176. [Google Scholar] [CrossRef] [Green Version]
  31. Huang, X.; Gao, M.; Wei, C.; Xie, D.; Pan, G. Tillage effect on organic carbon in a purple paddy soil. Pedosphere 2006, 16, 660–667. [Google Scholar] [CrossRef]
  32. Anders, M.M.; Brye, K.R.; Olk, D.C.; Schmid, B.T. Rice rotation and tillage effects on soil aggregation and aggregate carbon and nitrogen dynamics. Soil Sci. Soc. Am. J. 2012, 76, 994–1004. [Google Scholar] [CrossRef]
  33. Follett, R.; Jantalia, C.P.; Halvorson, A.D. Soil carbon dynamics for irrigated corn under two tillage systems. Soil Sci. Soc. Am. J. 2013, 77, 951–963. [Google Scholar] [CrossRef]
  34. Arvidsson, J.; Etana, A.; Rydberg, T. Crop yield in Swedish experiments with shallow tillage and no-tillage 1983–2012. Eur. J. Agron. 2014, 52, 307–315. [Google Scholar] [CrossRef]
  35. Mhazo, N.; Chivenge, P.; Chaplot, V. Tillage impact on soil erosion by water: Discrepancies due to climate and soil characteristics. Agric. Ecosyst. Environ. 2016, 230, 231–241. [Google Scholar] [CrossRef]
  36. De Almeida, W.S.; Panachuki, E.; De Oliveira, P.T.S.; Menezes, R.S.; Sobrinho, T.A.; De Carvalho, D.F. Effect of soil tillage and vegetal cover on soil water infiltration. Soil Tillage Res. 2018, 175, 130–138. [Google Scholar] [CrossRef]
  37. García-Ruiz, J.M.; Nadal-Romero, E.; Lana-Renault, N.; Beguería, S. Erosion in Mediterranean landscapes: Changes and future challenges. Geomorphology 2013, 198, 20–36. [Google Scholar] [CrossRef] [Green Version]
  38. Panagos, P.; Borrelli, P.; Meusburger, K. A New European slope length and steepness factor (LS-factor) for modeling soil erosion by water. Geosciences 2015, 5, 117–126. [Google Scholar] [CrossRef] [Green Version]
  39. Erpul, G.; Şahin, S.; İnce, K.; Küçümen, A.; Akdağ, M.A.; Demirtaş, İ.; Çetin, E. Turkiye Su Erozyonu Atlasi; General Directorate of Combating Desertification and Erosion: Ankara, Turkey, 2018.
  40. GDCDE. Türkiye’ de Yağışların Özelliklerive Yenilenmiş Evrensel Toprak Kayıpları Eşitliği (YETKE) R Faktörü; Turkish Republic Ministry of Agriculture and Forestry, General Directorate of Combating Desertification and Erosion: Ankara, Turkey, 2016.
  41. Baiamonte, G.; Minacapilli, M.; Novara, A.; Gristina, L. Time scale effects and interactions of rainfall erosivity and cover management factors on vineyard soil loss erosion in the semi-arid area of southern Sicily. Water 2019, 11, 978. [Google Scholar] [CrossRef] [Green Version]
  42. Rodrigo-Comino, J.; Terol, E.; Mora, G.; Giménez-Morera, A.; Cerdà, A. Vicia sativa Roth. can reduce soil and water losses in recently planted vineyards (Vitis vinifera L.). Earth Syst. Environ. 2020. [Google Scholar] [CrossRef]
  43. TSMS. Available online: https://mgm.gov.tr/eng/forecast-cities.aspx (accessed on 9 September 2019).
  44. Ozturk, M.Z.; Çetinkaya, G.; Aydin, S. Climate types of Turkey according to Köppen-Geiger climate classification. J. Geogr. 2017, 35, 17–27. Available online: http://dergipark.gov.tr/download/article-file/370152 (accessed on 11 January 2021).
  45. Soil Survey Staff. Key to Soil Taxonomy, 12th ed.; United States Department of Agriculture (USDA), NRSC, United States Printing Office: Washington DC, USA, 2014.
  46. Karakus, N. The Formation, Classification and Mapping of Mersin Tarsus Topcu Creek Basin Soils. Master’s Thesis, Institute of Natural and Applied Sciences, Kahramanmaras Sutcu Imam University, Kahramanmaras, Turkey, 12 April 2019. [Google Scholar]
  47. Yakupoglu, T.; Dindaroglu, T.; Akay, A.E.; Kusvuran, K.; Alma, V.; Gundogan, R. The effect of traditional and reduced tillage systems on the sediment yield of plots constructed in the Mediterranean climate zone caused by natural rainfall. Int. J. Glob. Warm. 2020, 24, 393–406. [Google Scholar] [CrossRef]
  48. Hudson, N. Soil Conservation; B.T. Batsford Limited: London, UK, 1995. [Google Scholar]
  49. Martin, C.; Pohl, M.; Alewell, C.; Körner, C.; Rixen, C. Interrill erosion at disturbed alpine sites: Effects of plant functional diversity and vegetation cover. Basic Appl. Ecol. 2010, 11, 619–626. [Google Scholar] [CrossRef]
  50. Nciizah, A.D.; Wakindiki, I.I.C. Rainfall pattern effects on crusting, infiltration and erodibility in some African soils with various texture and mineralogy. Water SA 2014, 40, 57–63. [Google Scholar] [CrossRef] [Green Version]
  51. Efe, E.; Bek, Y.; Sahin, M. SPSS’ de Cozumleriile Istatistiksel Yontemler II; No. 73; KSU: Kahramanmaras, Turkey, 2000. [Google Scholar]
  52. Nearing, M.A.; Pruski, F.F.; O’Neal, M.R. Expected climate change impacts on soil erosion rates: A review. J. Soil Water Conserv. 2004, 59, 43–50. [Google Scholar]
  53. Nearing, M.A. Potential changes in rainfall erosivity in the U.S. with climate change during the 21st century. J. Soil Water Conserv. 2001, 59, 43–50. Available online: http://www.jswconline.org/content/56/3/229.abstractT (accessed on 11 January 2021).
  54. Pfeifer, R.A.; Habeck, M. Farm level economic impacts of climate change. In Effects of Climate Change and Variability on Agricultural Production Systems; Doering, O.C., Randolph, J.C., Southworth, J., Pfeifer, R.A., Eds.; Kluwer Academic: Boston, MA, USA, 2002; pp. 159–178. [Google Scholar] [CrossRef]
  55. Garcia-Ruiz, J.M. The effects of land uses on soil erosion in Spain: A review. Catena 2010, 81, 1–11. [Google Scholar] [CrossRef]
  56. Ramos, M.C. Soil losses in rainfed Mediterranean vineyards under climate changes scenarios. The effects of drainage terraces. Agriculture 2016, 1, 124–143. [Google Scholar] [CrossRef]
  57. Filho, C.; Lourenço, A.; Guimaraes, M.d.F.; Fonsecac, I.C.B. Aggregate stability under different soil management systems in a red latosol in the state of Parana, Brazil. Soil Tillage Res. 2002, 65, 45–51. [Google Scholar] [CrossRef]
  58. Lipiec, J.; Kus, J.; Slowinska-Jurkiewicz, A.; Nosalewicz, A. Soil porosity and water infiltration as influenced by tillage methods. Soil Tillage Res. 2006, 89, 210–220. [Google Scholar] [CrossRef]
  59. D’Haene, K.; Vermang, J.; Cornelis, W.M.; Leroy, B.L.M.; Schiettecatte, W.; De Neve, S.; Gabriels, D.; Hofman, G. Reduced tillage effects on physical properties of silt loam soils growing root crops. Soil Tillage Res. 2008, 99, 279–290. [Google Scholar] [CrossRef]
  60. Kay, B.D.; Vandenbygaart, B. Conservation tillage and depth stratification of porosity and soil organic matter. Soil Tillage Res. 2002, 66, 107–118. [Google Scholar] [CrossRef]
  61. Chamen, T.; Alakukku, L.; Pires, S.; Sommer, C.; Spoor, G.; Tijink, F.; Weisskopf, P. Prevention strategies for field traffic-induced subsoil compaction: A review: Part 2. Equipment and field practices. Soil Tillage Res. 2003, 73, 161–174. [Google Scholar] [CrossRef]
  62. Galati, A.; Crescimanno, M.; Gristina, L.; Keesstra, S.; Novara, A. Actual provision as an alternative criterion to improve the efficiency of payments for ecosystem services for C sequestration in semiarid vineyards. Agric. Syst. 2016, 144, 58–64. [Google Scholar] [CrossRef]
  63. Munkholm, L.J.; Hansen, E.M.; Olesen, J.E. The effect of tillage intensity on soil structure and winter wheat root/shoot growth. Soil Use Manag. 2008, 24, 392–400. [Google Scholar] [CrossRef]
  64. Jin, K.; Cornelis, W.M.; Gabriels, D.; Schiettecatte, W.; De Neve, S.; Lu, J.; Buysse, T.; Wu, H.; Cai, D.; Jin, J.; et al. Soil management effects on runoff and soil loss from field rainfall simulation. Catena 2008, 75, 191–199. [Google Scholar] [CrossRef]
  65. Poulenard, J.; Podwojewski, P.; Janeau, J.L.; Collinet, J. Runoff and soil erosion under rainfall simulation of Andisols from the Ecuadorian Páramo: Effect of tillage and burning. Catena 2001, 45, 185–207. [Google Scholar] [CrossRef]
  66. O’Brien, S.L.; Jastrow, J.D. Physical and chemical protection in hierarchical soil aggregates regulates soil carbon and nitrogen recovery in restored perennial grasslands. Soil Biol. Biochem. 2013, 61, 1–13. [Google Scholar] [CrossRef]
  67. Cates, A.M.; Ruark, M.D.; Hedtcke, J.L.; Posner, J.L. Long-term tillage, rotation and perennialization effects on particulate and aggregate soil organic matter. Soil Tillage Res. 2016, 155, 371–380. [Google Scholar] [CrossRef]
  68. Entz, M.H.; Bullied, W.J.; Katepa-Mupondwa, F. Rotational benefits of forage crops in Canadian prairie cropping systems. J. Prod. Agric. Abstr. Res. 2013, 8, 521–529. [Google Scholar] [CrossRef]
  69. Tejada, M.; Gonzalez, J.L. Influence of organic amendments on soil structure and soil loss under simulated rain. Soil Tillage Res. 2007, 93, 197–205. [Google Scholar] [CrossRef]
  70. Barthes, B.; Albrecht, A.; Asseline, J.; De Noni, G.; Roose, E. Relationships between soil erodibility and topsoil aggregate stability on carbon content in a cultivated Mediterranean highland (Aveyron, France). Commun. Soil Sci. Plant Anal. 1999, 30, 1929–1938. [Google Scholar] [CrossRef]
  71. De Figueiredo, T.; Poesen, J. Effects of surface rock fragments characteristics on interrill runoff and erosion of a silty loam soil. Soil Till. Res. 1998, 46, 81–95. [Google Scholar] [CrossRef]
  72. Poesen, J.; De Luna, E.; Franca, A.; Nachtergaele, J.; Govers, G. Concentrated flow erosion rates as affected by rock fragment cover and initial soil moisture content. Catena 1999, 36, 315–329. [Google Scholar] [CrossRef]
  73. Lv, J.; Luo, H.; Xie, Y. Effects of rock fragment content, size and cover on soil erosion dynamics of spoil heaps through multiple rainfall events. Catena 2019, 172, 179–189. [Google Scholar] [CrossRef]
Figure 1. Location of studied sites, Google Earth images (Copyright© by Google) and some photos of parcels before and after sowing.
Sustainability 13 00789 g001
Figure 2. View of the rainfall simulator and its supporting parts, (a) front view of rainfall simulator, (b) two-sided view of rainfall simulator, (c) connection of frame and telescopic legs, (d) parts of the HARDI-1553 nozzle, (e) pump, (f) gasoline-powered generator, (g) rim, (h) calibration tray and metal cover, (i) collection container.
Sustainability 13 00789 g002
Figure 3. Changes in measured variables by the management practices in Tarsus location: (a) changes in ET, (b) changes in R, (c) changes in RC, (d) changes in SL, and (e) changes in SC. Bars represent the ± deviation of the repetitions from the mean.
Sustainability 13 00789 g003
Figure 4. Changes in measured variables by the management practices in Kahramanmaras location: (a) changes in ET, (b) changes in R, (c) changes in RC, (d) changes in SL, and (e) changes in SC. The bars represent the ± deviation of the repetitions from the mean.
Sustainability 13 00789 g004
Table 1. The monthly average temperature and rainfall of both locations for 1930–2019 [43].
LocationIIIIIIIVVVIVIIVIIIIXXXIXII
K.maras (°C)4.76.110.315.019.924.828.228.324.918.711.76.6
K.maras (mm)1221129573388.62.72.2114578130
Tarsus (°C)9.910.713.617.32124.727.427.82621.816.611.9
Tarsus (mm)128927050401896124883144
Table 2. Soil properties at the locations [47].
Soil PropertyLocation
TarsusKahramanmaras
C (g kg−1)170280
Si (g kg−1)180250
S (g kg−1)650470
Textural classSLSCL
pH7.526.65
Salt (g kg−1)0.71.0
SOM (g kg−1)25.028.3
CaCO3 (g kg−1)9275
FC (cm3cm−3)0.210.32
PWP (cm3cm−3)0.120.19
AWC (cm3cm−3)0.090.13
SAT (cm3cm−3)0.430.46
BD (Mg m−3)1.551.38
WAS (%)29.176.1
Ksat (cm h−1)2.615.70
Surface stoniness (%)215
C: clay content, Si: silt content (USDA), S: sand content, pH: soil reaction measured in saturation paste, Salt: total salt content measured in saturation paste, SOM: soil organic matter content, FC: field capacity (moisture content at −33 kPa suction), PWP: permanent wilting point (moisture content at −1500 kPa suction), AWC: available water content for the plant, SAT: water content in saturation paste, BD: bulk density, WAS: wet aggregate stability of macro-aggregates of 1–2 mm particle size, Ksat: saturated hydraulic conductivity.
Table 3. Descriptive statistics.
LocationsVariablesMin.Max.MeanStd. Dev.SkewnessKurtosis
Tarsus
(N = 24)
ET (s)426222342150.825−1.088
R (mm)10.938.025.59.17−0.334−1.554
SL (g m−2)381251535.83395.610.307−1.090
SC (g L−1)0.973.702.440.819−0.254−0.871
RC (%)186342.5415.220−0.322−1.559
Kahramanmaras
(N = 24)
ET (s)1666543231600.861−0.277
R (mm)2.014.36.854.040.589−0.968
SL (g m−2)2.037.318.2712.02−0.036−1.634
SC (g L−1)2.644.118.212.1390.4510.211
RC (%)3.024.011.416.7360.528−1.
ET: elapsed time to runoff generation, R: runoff, SL: soil loss, SC: sediment concentration, RC: runoff coefficient; N: number of plots.
Table 4. ANOVA results.
LocationManagement PracticesVariables
ETRSLSCRC
TarsusTillage (A)***************
Crop (B)***************
A × B******ns**
KahramanmarasTillage (A)*********ns***
Crop (B)***************
A × B**************
ET: elapsed time to runoff generation, R: runoff, SL: soil loss, SC: sediment concentration, RC: runoff coefficient, *** p < 0.001, ** p < 0.01, * p < 0.05, ns: not statistically significant.
Table 5. Duncan comparison test results.
LocationVariation SourcesMean Values of Measured Variables
ET (s)R (mm)SL (g m−2)SC (g L−1)RC (%)
TarsusFallow70.67c33.43a871.33a26.18a57.7a
Wheat232.33b21.95b307.02b13.20b36.5b
Sainfoin564.83a13.32c93.68c7.28c22.3c
KahramanmarasFallow188.17c10.18a29.21a3.00a17.0a
Wheat384.50b4.53b11.25b2.43b7.7b
Sainfoin533.33a2.53c3.45c1.33c4.0c
ET: elapsed time to runoff generation, R: runoff, SL: soil loss, SC: sediment concentration, RC: runoff coefficient. Comparisons were made separately for each location. Lowercase letters next to the subset value, such as a and b, indicate whether there is a difference between groups. There is no statistical difference between groups that receive the same letter and vice versa.
Table 6. Comparison of locations by independent samples t-test.
Variables
ET (s)R (mm)SL (g m−2)SC (ppm)RC (%)
ns************
ET: elapsed time to runoff generation, R: runoff, SL: soil loss, SC: sediment concentration, RC: runoff coefficient, *** p < 0.001, ns: not significant statistically.
Publisher’s Note: MDPI stays neutral with regard to jurisdictional claims in published maps and institutional affiliations.

