Abstract
The adoption of best available technologies (BATs) by the livestock sector has a fundamental role in developing a sustainable agricultural system. Italy is the EU member with the highest percentage of manure treated, but processing facilities are regionally scattered and the adoption of BATs is far from being scaled-up. The adoption is a matter of multicriteria decision-making and full knowledge on how to foster the transition is still lacking. The present research aims to deepen the available knowledge by analysing the perception of 40 pig farm managers about decision criteria behind the adopted manure management system across three different Italian regions. We assessed farms in Piemonte, Friuli Venezia Giulia, and Veneto. All farms have adequate storage facilities, but 82.5% adopt no processing technique. The two most important decision criteria are economic, i.e., the minimization of treatment and spreading costs. The emerging picture allows us to conclude that BAT adoption is still adopted as a mere consequence of legal obligation. Economic constraints prevail as there is a lack of information and uncertainty. Clear perspectives and recognition of virtuous behavior prevent farmers from making decisions based on environmental or social criteria. Therefore, effective policies oriented to fill these gaps are needed to accelerate the transition towards sustainability.
1. Introduction
Livestock manure treatment technologies play an important role in shaping the development of sustainable agricultural systems [1]. This is mainly due to the massive contribution of the intensive livestock sector to global greenhouse gas (GHG) emissions [2]. Nevertheless, the implementation of manure treatment technologies is still limited and regionally scattered in the EU [3]. The FAO (Food and Agriculture Organization of the United Nations) has reported that only 48% of total manure is treated or applied to soils worldwide [4]. A widely accepted classification of livestock manure treatment technologies regroups the existing processes into four classes [5]. These are differentiated according to the presence/absence of other organic matter, presence/absence of solid/liquid separation processes, and final solid/liquid nature of manures/slurries. The investment and operating costs of the different processing techniques, along with their main aims, are reported in Appendix A—Table A1.
Italy is the EU member state with the highest percentage of livestock manure treated (36.8% of production) [6]. In terms of volumes of treated farm manure, the technologies relating to separation and anaerobic treatment are the most frequently used in Italy [6]. In Northern Italy, where animal breeding is highly intensive, the treatment techniques in which the highest number of breeders have gained experience are anaerobic digestion (Ad) and separation, followed, albeit at a safe distance, by Biological Nitrogen Removal (BNR) and composting [7]. Separation and Ad are also considered the treatment techniques that have the greatest potential for common adoption in practice [7]. This snapshot about the diffusion of manure treatment systems in Italy and Northern Italy is confirmed at a regional level in Piemonte (P), Veneto (V), and Friuli Venezia Giulia (FVG).
V is the eighth largest and fifth most populated region in Italy, with 266.2 inhabitants per square kilometer (4.9 million inhabitants over 18,407.4 km2 [8]). The regional capital is Venice. V has strongly contributed to the “Italian economic miracle” characterizing the 1960s. Until the mid-fifties, V was a land of peasants, poverty, and migration, plagued by constant floods, while in 2018, the regional GDP was €163,303 million [9] and the GDP Purchasing Power Standards (PPS) per capita amounted to €33,800 (14% above the Italian average and 9% above the European one [8]).
Agriculture is a very competitive sector, thanks to important agricultural companies, almost all of which are mechanized and display a high level of specialization. In fact, V was the first Italian region to practice agricultural export, which began in 2018, with an increase of +37% since 2013. In 2019, the employment rate was higher (67.5%) than the national average (59%), although still below the European level (69.2%) [9].
The 2016–2019 Strategic Environmental Assessment (SEA) of the Third Action Program for the area vulnerable to nitrates of agricultural origin indicates that in Veneto, 5.6% of the farms presenting the “Communication for the agronomic use of zootechnical effluents” in 2015 declared carrying out one or more treatments [10]. Moreover, the SEA reports that 18% of the total amount of nitrogen of livestock origin produced is sent for treatment. In relation to the type of treatment, almost half of the treatments are represented by anaerobic digestion—over 2/3 of the treated livestock nitrogen goes through Ad and 38% through solid/liquid separation.
Friuli Venezia Giulia is one of the five autonomous regions with a special statute, covers an area of 7708 km2, and has about 1.2 million inhabitants [8]. The capital of the region is Trieste. FVG is the only Italian region classified as a strong innovator according to the Regional Innovator Scoreboard of 2019 (based on data mainly referring to 2016). This reflects on the existence of several supply chains with a high capacity for growth and innovation, such as the agri-food chain, in FVG [9]. In 2018, the regional GDP amounted to €38,018.57 million (2.2% of the national GDP [8]). In 2018, the GDP PPS per capita was €31,800 (7% above the Italian and 3% above the European average [9]). In 2019, the employment rate was higher (66.6%) than the national value (59%), although still below the European average (69.2%) [8].
FVG is an important contributor in the Italian livestock industry, with one livestock unit per hectare [11]. The province most affected by pig breeding appears to be that of Pordenone. According to the ISAAC (Increasing Social Awarness and ACceptance of biogas and biomethane) project [12], 71 biogas digesters exist in FVG, but only two of them specifically focus on livestock manure treatment and are part of the Italian Composting Association, which is the major aggregation of composters and biogas producers in Italy. Nevertheless, according to Dell’Antonia et al. [13], the calculated regional biogas potential is about 38.4 million m3 when using only animal waste, where 51% of the total energy potential is of cattle origin, 32% of pig origin, and 17% of poultry origin.
Piemonte has 171 inhabitants per square kilometer (4,356,406 inhabitants in an area of 25,401 km2 [8]). The capital of the region is Turin. The regional innovation system is well-developed thanks to the presence of large public and private enterprises and research centers [9]. P is characterized by a significant industrial tradition and the agro-industry significantly contributes to the regional Gross Domestic Product (GDP), which in 2018, amounted to €137,244 million (7.8% of the national GDP [8]). In 2018, the per capita GDP PPS was equal to €31,900 [8], slightly above the Italian (€29,700) and European average (€31,000). Overall, the real GDP annual growth rate was +1.37% during the period 2009–2018 [8]. In 2019, the employment rate (66%) was above the national average (59%), but below the European one (69.2%), with a growth rate equal to 2.3% in the period between 2015 and 2019 [8]. For P, the environmental report of the 2015 SEA procedure of the Action Program for the protection and remediation of water from pollution caused by nitrates of agricultural origin describes a scenario in which the low zootechnical loads still justify a week diffusion of Best Available Techniques (BATs) for both spreading and treatments such as solid/liquid separation [14]. Consequently, the value chains related to delocalization of the solid fractions towards non-intensive livestock areas, where the supply of soil organic matter is scarce and where some interest exists in using the local distribution sites, merely exist. Conversely, the same SEA report states that “In recent years there has been some diffusion of the transfer of livestock manure to extra-company plants for energy enhancement through the production of biogas”.
The three regions therefore differ in terms of the distribution and adoption level of processing techniques. The level of innovation adoption in a given community or sector has been studied through several theories. The Technology Acceptance Model (TAM), along with other innovation-based adoption decision theories, such as the Diffusion of Innovation, Theory of Reasoned Action, and Theory of Planned Behavior, is one of the main theories used to conceive studies on agricultural innovation take-up [15]. In fact, the decision about the adoption of upgrades to the present technology level depends on many factors, and the extent to which manure treatment technology advances in a country can be influenced by governmental policies and the perceptions of key stakeholders [7,16].
Examples of interesting research on the topic include studies focusing on composting [17], slurry separation [18], and anaerobic digestion [19,20] in several EU countries. For instance, Gebrezgabher et al. [18] have reported that in the Netherlands, farmers’ attitudes towards the various properties of manure separation technology were important determinants of adoption. They demonstrated that attitudes towards the possibility of maximizing the agronomical value of manure through separation were positive, but that economic benefits were generally not appreciated. Viaene et al. [17] have reported that the main barriers to on-farm composting in Belgium were the strict regulation, the considerable financial investment, and the lack of experience and knowledge. Additional work [19,20] has focused the analysis of stakeholder perceptions in the biogas production chain in several EU countries. These studies also indicate that biogas producers and digestate suppliers face barriers mainly related to the high financial cost compared with low incentives, legal constraints for the operation, and existing market barriers to digestate application.
All these studies suggest that the choice and adoption of different manure processing techniques are driven by a multicriteria decision. Understanding this choice is made more difficult by the fact that it is affected by a wide range of multi-scale socio-political, environmental, and agronomic factors that also follow temporal dynamics as these factors evolve over time.
The decision-making margins of breeders must deal with various factors, both site-specific and related to large-scale contexts, which include agronomic, structural and infrastructural, legislative, and socio-economic aspects [21]. These factors are capable of influencing, even indirectly, the managerial choices and technical-practical solutions of the companies. Under certain circumstances, mostly related to the economic dimension, they can be so stringent that they prevent management improvements. In Italy, other authors have found that economic factors were the largest barriers to technology adoption for manure treatment in practice, namely, the lack of capital for investment and a too-long benefit feedback [7]. A key point in manure management is the type of treatment applied. The treatment of manure can make it possible to obtain management, economic, environmental, and social advantages [22]. All these dimensions can be further detailed and are always interrelated. In fact, if manure processing is mainly applied with the objective of improving the manageability and utilization of livestock manure, the same procedure generates additional advantages. For instance, the separation and biological processing also allow maximization of the agronomical value of manure, minimization of social and environmental impacts, a reduction of odors, the control of pathogens, the removal of xenobiotic compounds (emerging pollutants) or the minimization of GHG, acidifying emissions, and a reduction of the risks related to nitrogen leaching.
Other objectives of manure processing may be linked to the valorization of by-products, such as the production of energy through anaerobic digestion.
However, if conditions allow (e.g., a large enough spreading area, local nutrient demand, compliance with local regulations), the spreading of untreated slurry in order to fertilize is often preferred in light of its simplicity and low cost of implementation.
Our literature review indicates that, even if several studies have been conducted to investigate farm managers and other stakeholder perceptions of factors influencing the adoption of manure treatment systems, there is a need to develop a better understanding of stakeholder perceptions of factors that currently influence manure treatment choice and also their perspectives regarding the successful adoption of these technologies in the future.
The present study aims to provide updated empirical insights into (1) the main choice drivers for the adopted slurry treatment system, and (2) how these drivers change across different socio-economic settings, represented by different regions. To fulfill this, aim the answers of 40 swine farm managers in three Italian regions, namely Piemonte (P), Veneto (V), and Friuli Venezia Giulia (FVG), are described and the emerging knowledge is disclosed to enrich the understanding of the dynamics behind eventual BAT adoption.
2. Materials and Methods
2.1. The Case Study
The case study is offered by the existing Migliorare la gestione degli effluenti in pratica (GEZOO) project. GEZOO aims to provide farmers with optimal economic and environmental solutions for the management of livestock effluents using the software SEESpig [23].
The SEESpig software has been developed with the aim of gathering existing knowledge on the different techniques of manure management and integrating them in a Decision Support System to provide indications to farmers and technicians. The present research only used the SEESpig database to collect the initial sample, and it did not rely on SEESpig elaborations.
2.2. Sampling
We obtained an initial list of potential participants in P, FVG, and V regions, through collaboration with the national Ordine dei Dottori Agronomi e Forestali, the local Agricultural Unions, and Extension Service providers. Then, we implemented a voluntary sampling strategy based on the willingness of farm owners to experiment with the SEESpig software and participate in the GEZOO survey. We implemented the screening of available farms by telephone interviews in the three target regions. A kick-off meeting was held in order to formalize and set up the collaboration with local sector stakeholders.
In P, the initial workshop was held in Salmour (CN) on 4 May 2018, at the pig farm of the Sant’Andrea Company. In P, participant farms were selected thanks to the support of the Piedmontese partners OATA Liberi Professionisti srl, the Order of Agronomists and Foresters, and Confagricoltura.
In V, the kick-off meeting was held on the 10th of July 2019 at the headquarters of the Italian Farmers Confederation (CIA) of Padua. CIA represents more than 60 pig farms distributed in V and therefore provided an initial pool of 37 farms interested in and available for participation.
In FVG, the kick-off meeting took place in Codroipo (UD) on 23 May 2019, at the siege of the regional Breeders Association (AAFVG), whose collaboration was fundamental in the identification of farms to be included in the sample.
The initial sample, composed of 45 farms in the three regions, produced 40 valid observations due to drop-offs that occurred during implementation of the survey and exclusions during the preparation of data before statistical analysis. Appendix A—Table A2 presents the final composition of the sample.
2.3. The Survey
The GEZOO survey took place between October 2018 and July 2019, thanks to the work of three surveyors who respectively focused on the three regions of interest: Piemonte (P), Friuli Venezia Giulia (FVG), and Veneto (V). During the design phase, we took inspiration from existing theories about farmers’ adoption of new technologies, especially TAM theory. Specific questions were introduced in order to assess the degree to which the farm manager believes that using a particular system would enhance his or her job performance and the degree to which the manager believes that using a particular system would be free from excessive efforts. To fulfill this aim, the survey form included 69 questions divided into 14 sections, as reported in Table 1.

Table 1.
Structure of the survey form.
Survey forms were filled out during live interviews with farm owners and through the analysis of official and legally mandatory documents, such as the communication for the agronomic use of livestock effluents and assimilated materials (Nitrates Communication), which includes the most recent Agronomic Use Plan (PUA) of the farms.
For instance, the Nitrates Communication and PUA contain all of the information about land surfaces, production structures and zoo-technical consistency, volumes of effluents and nitrogen produced in the company, the type and available volume of storage structures, manure application techniques, areas involved in the application, and complementary fertilizations.
Conversely, the live interviews with farm owners were fundamental for collecting information about the perception of different issues related to manure management and needs for/barriers to the introduction of management innovation.
2.4. Data Analysis
The dataset was checked and rectified where needed, in collaboration with the experts that supervised the collection of data in the three regions. Then, we carried out a descriptive analysis of the dataset, aggregating the data on regional units where relevant, and comparing the different variables in order to produce new insights about the criteria behind the choice of processing techniques on sampled farms.
3. Results
3.1. Descriptive Statistics
The sample regroups 40 farms. As shown in Figure 1, the mean number of heads in the sample is 3195 (σ = 2205), ranging from a minimum of 750 to a maximum of 9500 animals.
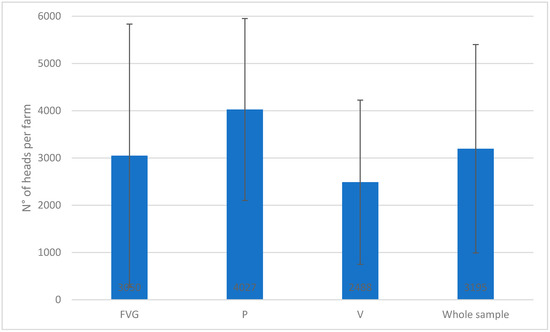
Figure 1.
Average number of heads (and standard deviation) per farm in the sample, in the three regions and for the whole sample.
In general terms, the farms in the sample are quite well-distributed among the different pig farming styles, showing a small majority (40%) of “feeder-to-finish”, followed by “farrow-to-finish” (25%) and “farrow-to-feeder” (20%). In total, 15% of farms in the sample display a not-specified type of breeding. Concerning the housing system, most farms use “boxes with totally slatted floor” (52.5%), especially in V and FVG. “Boxes with partially slatted floor” are also diffused, especially in P.
Appendix A—Table A3 presents the average manure production in the sample. The whole sample average is equal to 13,169 m3 (σ = 8173), ranging from a minimum of 3149 m3 to a maximum of 35,574 m3 (also see Appendix A—Table A3). The farms in the sample produce an average of 36,911 kg N (σ = 20450; min.–max.: 9498–81,169 kg) per year.
Figure 2 and Appendix A—Table A4 present the information about available land for sampled farms. The farms in the sample have an average of 189 ha of land (σ = 105; min.–max.: 16.3–462.2 ha), titled differently according to the specific region. In total, 51.9% of available land is vulnerable to nitrate leaching. Nitrate Vulnerable Zones (NVZ) are mainly located in Piemonte and Veneto. Additionally, 61.8% of land used by the farms in P and 60.5% of the land used by the farms in V is vulnerable to nitrate leaching (Figure 2).
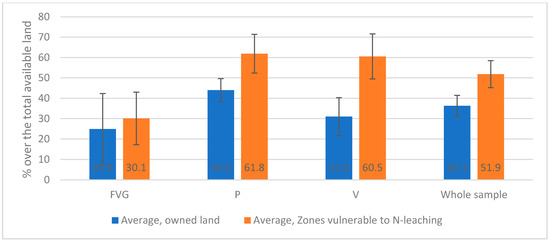
Figure 2.
Average farm-owned land and average Nitrate Vulnerable Zones (NVZ) by region in the sample (standard error bars are shown). Percentages are expressed over the total available land, which is the sum of land for rent, in usufruct and of legal possession.
In terms of manure landspreading systems, 21 out of 40 farms only use one technique, while 19 farms use two techniques. Figure 3 shows the frequency of the first spreading method across the sample.
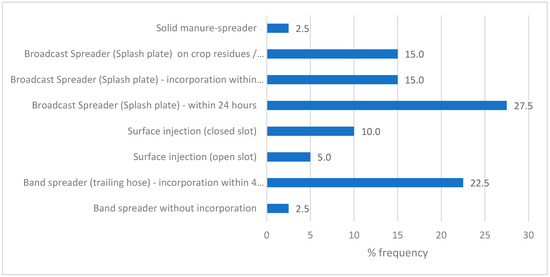
Figure 3.
Frequency of the different (first) spreading methods across the sample.
Concerning the first spreading method, most of the farms use “Broadcast Spreader (Splash plate)—incorporation within 24 h” (27.5%), “Band spreader (trailing hose)—incorporation within 4 h” (22.5%), “Broadcast Spreader (Splash plate)—incorporation within 4 h” (15%), “Broadcast Spreader (Splash plate) on crop residues/bare ground (no incorporation)” (15%), and “Surface injection (closed slots)” (10%). A few use other techniques, such as “Surface injection (open slot)” (5%)”, “Band spreader without incorporation” (2.5%), and “Solid manure spreader” (2.5%). The first-for-importance spreading method (splash plate with incorporation within 24 h) is applied averagely on most of the available land (84.7% of the surface).
In general (data not shown), the spreading methods adopted in the three regions are quite different. In our sample, the broadcasting of manure (splash plate with or without incorporation) is not represented in P, the use of injectors (open or closed slots) seems absent in V, and the use of band spreaders (with or without incorporation) is not found in FVG. From another perspective, V seems to be the only region where the practice of the incorporation of manures after spreading is not diffused, while FVG and P seem to exhibit the widespread use of incorporation practices to a higher degree.
Figure 4 shows the most represented crops cultivated in 2019/2020 on the land receiving manure from the farms in the sample (also see Appendix A—Table A5). Cereals are the most represented crop, especially in P (87.2%, equal to 166 ha on average). Leguminous grain-crops are the second most represented crop, especially in FVG (18.5%, equal to 27 ha on average). Grass-crops are the third most represented crop, especially in V, where an average of 18.1% of available land is dedicated to animal feed production. Grape is only represented in V, being cultivated on an average of 6% or 37 ha of available land, but it becomes relevant when aggregated with other tree-crops (fruit and wood). In fact, the latter occupy an average of 7.1% in V and 6.5% in FVG (only 1.2% in P).
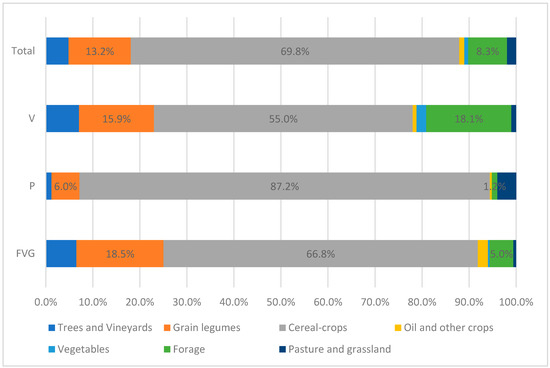
Figure 4.
Land use by crop type and region (year 2019).
3.2. Manure Management Systems and Motivation
Concerning treatment systems in the sample, Appendix A—Table A6 and Table A7 present the main findings by region, coupled with the main motivation reported by farm managers. All 40 surveyed livestock farms have adequate “tanks or stall storage” facilities. The storage capacity is, on average, greater than 90 days. Among them, 82.5% (33 farms) adopt no processing technique, 5% (2 farms) adopt one processing technique, and 10% (5 farms) adopt more than one type of processing technique. The results of farms adopting only a storage system and no processing show a diffuse disuse of coverings and ad hoc wastewater management systems. In fact, even if the data provided by the farms’ official documents about produced and stored volumes correlate (R2 = 0.991), the stored volume, which includes cleaning water and rainwater, is, on average, higher than the volume produced (this increase is true of 26 out of 40 farms and ranges from 4% to 9%, as reported in Appendix A—Table A3).
In general (Appendix A—Table A7), the three regions differ in terms of the adopted processing techniques: in FVG, the surveyed farms adopt no processing at all, while in P and V, even if the absence of processing prevails, four and three farms adopt some processing techniques, respectively. In particular, in P, the Screw separation + the Anaerobic Digestion in Continuous-flow Stirred-Tank Reactor (AD-Cstr) and the Continuous-BNR are represented, and in V, the Screw separation, the Ad-Cstr (alone), the Biological Nitrogen Removal in Sequencing Batch Reactor (BNR-SBR), and the composite Screw press separation + Ad-Cstr + BNR-SBR are represented.
Among the farms adopting one processing solution, one farm, located in V, adopts AD-Cstr and the other farm, located in P, adopts BNR-SBR, for a varying fraction of the produced manure. Focusing on the farms adopting a composite processing system (10% of the whole sample), one specific farm processes only a part of the produced manure, while it stores the rest: It is located in P and outsources the screw-press separation and the Ad-Cstr processing in certain periods and for certain volumes, depending on the season and the year. In total, 7.5% of the sample (3 farms) adopt Centrifuge separation and Ad-Cstr, 2.5% (1 farm) adopt Centrifuge separation and BNR-SBR, and 2.5% (1 farm) adopt Centrifuge separation, Ad-Cstr, and BNR-SBR.
We queried the choice of processing technology by asking farm managers to score the seven proposed criteria by using a five-value scale for each proposed choice criterion. We then computed the overall ranking by averaging the singular managers’ rankings.
The overall ranking is as follows:
- The minimization of treatment costs;
- The minimization of spreading costs;
- Maximization of the agronomical value of the nutrients contained in the slurry;
- The minimization of GHG emissions;
- The valorization of by-products;
- The minimization of acidic gas emissions.
Figure 5 provides further regional details and shows how the perception of the advantages provided by manure treatment is different in the three regions.
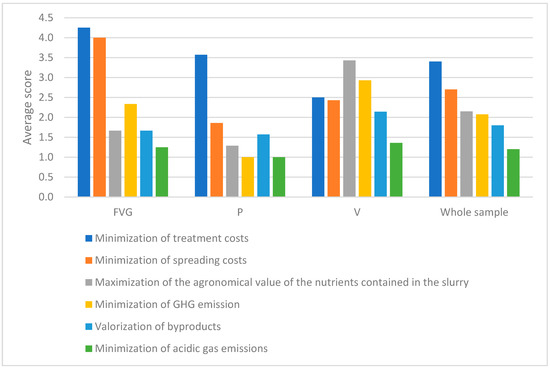
Figure 5.
Average scores (1–5) obtained by the different choice criteria by region.
In fact, if, in the three regions, farm managers mostly agree on the importance accorded to the minimization of treatment and spreading costs, in P, the farm managers seem less interested in the different issues related to pollution or in maximization of the manure agronomical value. Conversely, in V, farm managers give the highest scores to maximization of the agronomical value of spread manures. This may be due to the higher logistical cost of transportation between demerged parts of the farmland. Moreover, in FVG and V, the other pollution-related criteria also have higher scores than in P.
3.3. Perception of Critical Issues and Upgradeability
We surveyed the farm’s owners perception of the most impactful problems in their everyday activities in relation to slurry management and processing. Figure 6 presents the composite situation that emerged. In general terms, the sample reported a higher importance of the cost of investments, with 50% of the farms (20 farms) mentioning the problem, followed by management costs (35%, 14 farms), the excessive distance of available lands (37.5%, 15 farms), and the scarce availability of information and knowledge about possible improvements in slurry treatment (22.5%, 9 farms).
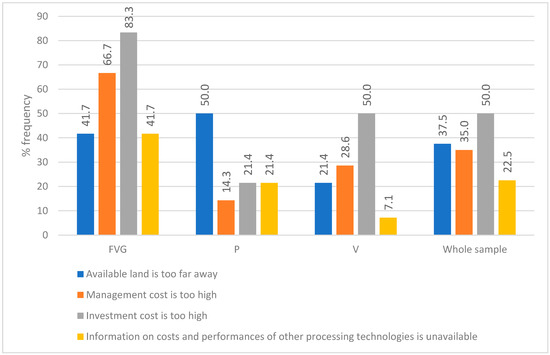
Figure 6.
Relative frequency of the main perceived problems, by region.
Concerning farm owners’ opinion of the upgradeability of their own processing system, the results show a different situation in the three areas of the survey, as reported in Figure 7. Farms in FVG report a clear opinion about the possibility of improvement of the currently adopted slurry treatment system (91.7%). In V, the situation is similar, but with a higher number (42.9%) of respondents denying the need for or possibility of upgradeability. Conversely, in P, the majority (78.6%) of the sample think that no improvement can/should be made to the adopted treatment system.
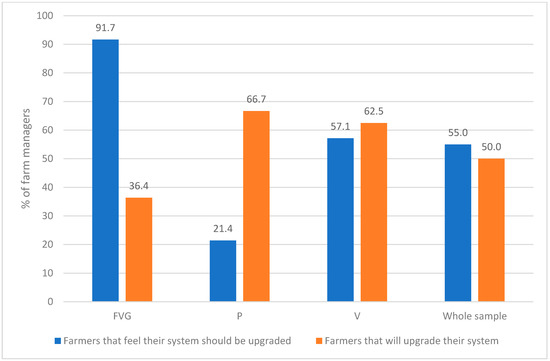
Figure 7.
Farm owners’ opinion about upgradeability and a real intention to upgrade, by region.
Nevertheless, among the farms wishing to introduce some improvement to their processing system, only 50% is really planning or implementing the improvement. These proactive farms are mainly located in P and V, while 63.6% of the farms surveyed in FVG will not really implement the improvement, even if interested in the future (Figure 7).
The adoption of innovation is affected by the degree of mastery in coping with actual problems and constrains. In these terms, the main perceived problems in everyday processing and applying activity are reported in Appendix A—Table A8. The cost of investment is seen as the main problem in FVG, where the second problem is the cost of treatment plant management. This is also true in the V region, where the lack of information is only mentioned in one case, meaning that extension services work adequately concerning these themes. Conversely, in P, the most relevant problem seems to be the excessive distance of the lands where treated (or untreated) slurry is spread. Here, the cost of investment ranks second, together with the lack of available technical information about possible processing innovations.
4. Discussion
4.1. Adoption Drivers of Different Processing Techniques
The surveyed farms show features that are very common in their respective areas. The picture describes a situation in which pig farms strive to keep pace with the existing guidelines in terms of the storing, treatment, and landspreading of manure.
In terms of manure storage, our survey shows the scarce implementation of best practices in the management of cleaning water and rainwater, such as the use of ad hoc wastewater management systems. In fact, the stored volume is, on average, 5.9% greater than the volume produced. This result contrasts with national statistics describing P, V, and FVG as three of the four most virtuous regions in Italy in terms of the coverage of manure management systems, with 40–42% of covered storage facilities [11].
Concerning the processing of manure, according to official regional statistics, 2.3% of farms in P, 3.5% in V, and 2.5% in FVG adopt some measure for the reduction of GHG emissions [11]. Our results confirm this picture and shed light on the drivers of the decision about adopting the simplest, legally permitted solution.
In terms of criteria underlying the adoption of specific manure processing techniques, as reported in Appendix A—Table A6 and shown in Figure 8, the farms adopting the simplest solution, that is, no-processing, and only storage, declare that the first choice criterion is the minimization of treatment costs, followed by the minimization of spreading costs. Obviously, in these cases, low importance is expected to be attributed to the minimization of environmental impacts (GHG and acidifying gas emissions) and to the possibility of generating income by selling by-products of the treatment. For some reason, these farms also attribute value to the minimization of acidic gas emissions and the valorization of by-products, even though it is widely accepted that stored manure emits NOx and SOx compounds [24]. Previous studies also demonstrate how different types of storage systems may cause different types of GHGs [25].
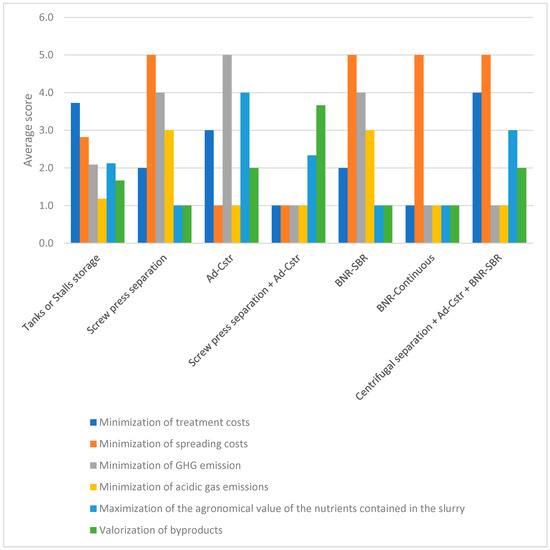
Figure 8.
Choice criteria mentioned by managers, by adopted processing technique.
In general, the criterion related to the valorization of processing products is mostly considered by the farms that adopt some kind of processing, and the medium-high value given to products’ valorization in the “no-processing cases” may be due to the farms being satisfied with the valorization of manure. Indeed, pig manure is widely used for its high fertilizer value [26], but several studies point out that the variability in nutrient content makes it difficult to valorize pig manure as it is [27,28]. Nevertheless, in these cases, the medium-high values accorded to environmental criteria may be due to some misunderstanding in the environmental effect of storage without processing, as previous studies have recorded that farmers that are aware of the environmental risk posed by pig manure tend to adopt some kind of processing technology [25,29]. Conversely, the best attitude towards environmentally-friendly treatment systems is expected and found on the farms adopting “Anaerobic Digestion in Continuous-flow Stirred-Tank Reactor (Ad-Cstr)”, “Biological Nitrogen Removal in Sequencing Batch Reactor (BNR-SBR)”, or “screw press separation”. The farm only adopting “Screw press separation” first valued the minimization of spreading costs and then the minimization of GHG emissions and the minimization of acidifying emissions. This manager’s perception unfortunately is not supported by previous studies in which screw press separation, as a stand-alone process compared with combined separation processes, resulted in an increase of carbon dioxide (CO2) and nitrous oxide (N2O) emissions due to high releases observed from the solid fraction [30,31]. The farm adopting “Ad-Cstr” is the one giving the highest value to the maximization of agronomical value of manure and to the valorization of products. The positive potential of Ad-Cstr and biogas production, both in terms of farm income and the sustainable fertilization of crops, has been demonstrated in previous studies [32]. This farm also values the minimization of treatment costs and the reduction in GHG emissions, but it seems to neglect the minimization of acidifying emissions. GHG and acidifying emissions from AD are a controversial topic in the literature. On the one hand, AD is recognized as an efficient way of reducing climate change-related impacts of manure management [5]; on the other hand, previous studies have explained how the whole biogas business is associated with the production of acidifying gases, such as nitrogen oxide, through the different phases of the biogas chain [33]. The farm adopting “Biological Nitrogen Removal in Sequencing Batch Reactor (BNR-SBR)” reports that the choice is mainly driven by the will to minimize spreading costs. In fact, the manager declared that, considering the specific sparse configuration of available land, BNR-SBR offers the possibility to facilitate the operationalization of manure applications by reducing the nitrogen content of manure, whose spreading become possible and cheaper on the nearest lands. This farm manager also values the minimization of environmental impacts (GHG and acidifying emissions), which is still debated in academia [34]. Conversely, the farms adopting screw press separation and Ad-Cstr neglect both environment-related criteria (i.e., the minimization of GHG and acidifying emissions). This might be explained by the specific attitude or knowledge level of the farm owners towards environmental impacts and by their purely economic interest in valorizing the agronomical value of manure and its processing by-products.
The farm adopting “Ad-Cstr, Centrifugal separation, Biological Nitrogen Removal in Sequencing Batch Reactor (SBR)” values the minimization of treatment and spreading costs and, to a lesser extent, the valorization of products and maximization of the agronomical value of manure. While it is generally accepted that separation allows farmers to rationalize and lower the cost of spreading by using the solid fraction on less accessible lands [35], it is more difficult to understand why the composite processing system would allow for treatment cost minimization. Previous studies on integrated processing systems suggest that the fine-tuning of the processing through the different techniques allows the environmental and economic sustainability of the whole process to be increased and lowers the pathogen content [36,37].
4.2. Adoption Dirvers from a Geographical Perspective
The drivers of the adoption of the specific processing technology can also be analysed from a geographical perspective and compared with the main operational problem underpinned by managers in the three regions. In fact, if, in the three regions, farm managers attribute medium-to-high importance to the minimization of treatment and spreading costs (Figure 5), the finest remarkable differences in the declared decision criteria may be seen from the perspective of the different farm-related contexts provided by the three regions.
FVG features the lowest percentage of NVZ over the total available land. FVG also hosts averagely smaller farms that widely use landing contracts for spreading (Table A4). In this context, managers declare that the greatest problems in manure management are the upgrading of processing and spreading systems due to too high management and investment costs (Figure 6). Consistently, they have adopted the given processing system on the basis of the will to minimize treatment and spreading costs. The fact that FVG shows low levels of NVZ could explain why managers seem not to be sensitive to environmental choice criteria.
P and V show comparable average farm land stocks and percentages of NVZ. P seems to host farms that own a higher percentage of land if compared to both V and FVG. This may explain why farm managers in P complain about the lowest availability of land for spreading, as in such a context, we can imagine that obtaining contracts for landspreading might be more difficult. This would also explain why Piedmont’s farmers declare the main adoption criteria to be the minimization of treatment/spreading costs and also why they attribute the lowest scores to the different issues related to pollution or maximization of the manure agronomical value. This is probably because they slip into logistic or excessive nutrient concentration constrains that overcome further reflection on environmental issues. Conversely, the most visible difference among the three regions in Figure 5 is the prevalence of the environmental and agronomical choice criteria in V. The highest available land stocks and the high percentage of NVZ, coupled with the averagely richest socio-economic context of the region, may explain the higher perception of farm managers regarding environmental risks posed by inadequate manure management.
In terms of manure landspreading, differences exist among the three regions and farm managers tend to use better spreading techniques in the region where more NVZ exist. Nevertheless, even though NVZ are common in the sample, especially in P and V, the farms in the sample generally do not strictly follow the existing guidelines on BAT [5] or differentiate the spreading method from their NVZ to non-NVZ. Appendix A—Table A9 displays these findings.
For instance, among the farms displaying more than 50% of available land in NVZ, only 20% use injection equipment and, even though 65% use at least broadcasting with incorporation equipment, 15% still do not incorporate manure after spreading. Focusing on the three farms (15% of the sample) that are located in V, farm managers declare a second treatment system, which is implemented through broadcasting with incorporation, but they do not use this system for the whole percentage of land under NVZ, as they already respect the NVZ-related limit of nitrogen provision. This kind of observation seems to support the interpretation about (these) farmers being insensitive to environmental concerns.
Concerning the perception about upgradeability, 18 (out of 40) farms not interested in any improvement to their treatment system are actually using the simplest solution (stalls and tanks storage) or have already adopted Ad-Cstr + screw press separation or Biological Nitrogen Removal—continuous (see Appendix A—Table A10).
As Appendix A—Table A10 reports, if the farm managers were interested in some improvement, they were also asked to identify the most suitable improvement for their own specific situation. These farm managers were mostly interested in reducing the slurry volume by covering the storage (12 out of 22 farms) and/or in the solid–liquid separating of slurries (7 out of 22 farms). In a few cases, the farm owner also declared the following:
- One out of 22 was interested in adopting different spreading systems (umbilical system);
- Two out of 22 had no idea about what innovation could be useful and asked for technical support in order to define the most suitable improvement;
- One out of 22 was interested in reducing N in the separated liquid phase (this is the case of the farm already adopting Ad-Cstr + Centrifuge screw separation + Zeolite filter);
- One out of 22 was interested in thermos-valorizing the treatment and producing biogas;
- Two out of 22 were interested in implementing Ad-Cstr;
- One out of 22 was interested in adopting an oxygenation system for storage.
Nevertheless, as reported in Figure 8, our survey suggests that the proposed innovations will only really be implemented by the farms operating in P and V, where, due to the high presence of NVZ, the legal framework for manure management is stricter than in FVG.
5. Conclusions
The decision criteria underlying processing technology adoption in the three study regions slightly differ, but they also show similarities. In general, the minimization of treatment and the spreading cost dominates the perception of farm managers in the sample, even though the minimization of GHG and the maximization of the agronomical value of manure also appear to be taken into consideration to a lower degree. The minimization of acidic gas emissions seems to be widely neglected. V’s farm managers, residing in the richest region in the sample, seem to show a slightly better perception of environment-related decision criteria. However, the farmers in the three regions have different inclinations to take up technologies. In the case of richer regions, such as V and P among the three study areas, farm managers are well-informed about technologies and prepared to invest in BATs. Therefore, the reasons for the limited diffusion of BATs could be related to the uncertainty of regulations and market instability. Farmers in these areas just need a clear idea of the economic benefits and need to be protected by eventual changes in regulations, which could endanger investments. On the contrary, in regions such as FVG, where farmers adopt less advanced management, they require further efforts on sensitization, more support in terms of technical assistance, and more detailed information on the cost and benefits of the introduction of BATs.
Therefore, our results update and confirm literature findings and shed light on the peculiar situation in the three Italian regions. Our findings show that, even after decades of policies, incentives, and sensitization programs [38], the nature of the main drivers of manure processing choices and adoption in the three Italian regions is still economic [7,38], namely the investment or operational cost. In practice, this turns into the widely diffused choice of adopting the cheapest treatment system, coupled with the equally simple and cheap landspreading method, which is able to respect the existing legal framework, with no weighting given to more environmental or agronomical reflection. Our findings let us conclude that, even in rich regions with a higher percentage of NVZ and with the most virtuous attitude towards manure management, farm managers shyly adopt BATs because they are forced to by existing regulations, doing the minimum in order to stay within permitted limits. Farmers apparently still miss the “comfortable-enough” position that is needed to take into consideration the environmental and social advantages of BAT, and to inform their multicriteria decision about BAT adoption on a sustainable basis. Moreover, the diffused lack of environmental and agronomical sensitivity of farmers, supported by the complaint of FVG’s farmers about the unavailability of upgrade-related information, allows us to conclude that further sensitization and training could help in fostering the diffusion of BATs.
From this perspective, we acknowledge the importance of enhancing the joint activity of public and private organizations (governmental, research, manufacturing, and advisory service) on (at least) three axes. The first should focus farm managers’ knowledge and perception of environmental and social advantages of manure processing, in order to provide useful insight for policymakers about the best entry points for fostering the transition of the livestock sector towards sustainability [39]. The second should focus on the other factors still preventing the livestock sector, among others, from adopting BATs [40]. Among these, we point out the need to better understand the reasons for the still inadequate support provided by the existing agriculture- and livestock-related common policies (i.e., the CAP) in pushing the livestock sector towards real sustainability [38,41]. The third and maybe most challenging axe should advance the focus on the holistic impact evaluation of the intensive livestock sector in terms of climate change and assess the feasibility of a sufficient reduction of negative impacts by the sole means of BAT adoption [40].
Author Contributions
Conceptualization, P.D.M., G.P. and G.S.; methodology, P.D.M.; software, G.P.; validation, G.P.; formal analysis, P.D.M.; investigation, E.A., G.C. and C.D.M.; resources, G.P.; data curation, P.D.M., E.A., G.C. and C.D.M.; writing—original draft preparation, P.D.M. and O.F.; writing—review and editing, G.P., G.S. and P.D.M.; visualization, P.D.M.; supervision, G.P., M.B., E.D., P.C. and G.S. All authors have read and agreed to the published version of the manuscript.
Funding
This research received funding from the 2017 AGER call for projects “From research to business”, aimed at dissemination of the results of previous research funded by the AGER 2008–2015 call. AGER, grant n. 2017–2209.
Institutional Review Board Statement
Not applicable.
Informed Consent Statement
Not applicable.
Data Availability Statement
The data presented in this study are available on request from the corresponding author. The data are not publicly available due to privacy restrictions.
Acknowledgments
We acknowledge the role in the coordination of data collection by Nicola Dal Ferro (University of Padua–DAFNAE). We also acknowledge the role of the University of Milan in funding the Article Processing Charge (APC fund).
Conflicts of Interest
The authors declare no conflict of interest. The funders had no role in the design of the study; in the collection, analyses, or interpretation of data; in the writing of the manuscript; or in the decision to publish the results.
Appendix A
Table A1.
Main treatment technologies, aim, and cost. Modified from [5]. Investment and operating costs are taken from [42] if no other specific reference is provided.
Table A1.
Main treatment technologies, aim, and cost. Modified from [5]. Investment and operating costs are taken from [42] if no other specific reference is provided.
| Processing Technology | Aim | Investment Cost (€/m3) | Treatment Cost (€/m3) |
|---|---|---|---|
| Mechanical solid–liquid separation of slurry by a screw press, decanter centrifuge, coagulation–flocculation, sieve-drum filters, filter press, air flotation, natural settling | Separation and concentration of the solid and liquid fractions of slurry | Coagulation–flocculation: Investment cost, basic price, €: 50,000; investment cost, variable price, € per tonne: 0.65 | ~0.80 €/tonne input slurry [43]. |
| Screw press: Investment cost, basic price, €: 28,000; Investment cost, variable price, € per tonne: 0.36 | Treatment cost between 0.5 and 0.9 €/m3 of input [44]. | ||
| Decanter centrifuge: Investment cost, basic price, €: 110,000; investment cost, variable price, € per tonne: 1.42 | Treatment cost between 0.6 and 2.3 €/m3 of input manure [44]. | ||
| Air flotation (coupled with flocculation): no data. | No valid data available. However, a plant in Holland (Kumac Mineralen), which used flotation in addition to flocculation, drum belt separation, reverse osmosis, and demineralization, claimed the operational costs for all processes were at a level of 5 €/m3 slurry. | ||
| Drum-filters: Basic investment of approx. 25,000 euro at a capacity of 2–3 m3 slurry/hour. | Approx. 0.35 euro/m3 slurry | ||
| Natural settling: 17,000 € for a thickener volume of 350 m3 [44]. | Irrelevant | ||
| Sieves (static or vibrant): Investment cost, basic price, 3500–8000 € (sieve), 15,000 € (vibrant) according to [43]. Investment cost, variable price, € per tonne: 0.19 | According to [45], the operational costs comprise 1.31 kWh/tonne electricity consumption. | ||
| Filter press: Investment cost, basic price, €: 75,000; investment cost, variable price, € per tonne: 0.97 | Operational costs, € per tonne: 1.5. Operational costs, explanation: 1.5 €/tonne of input manure (band filter) [43]. | ||
| Aeration of liquid manure/biological treatment: Aerobic digestion, nitrification denitrification | Biological decomposition of organic matter. Removal of ammoniacal nitrogen as N2 gas | Nitro-Denitr. Investment cost: 240,000–300,000 € (plant treating 15,000 m3 pig slurry/year); 700,000–1,200,000 € (plant treating 50,000 m3 pig slurry/year) | Operational costs, explanation: Costs are dependent on the composition of the manure to be treated. 1.5–3.0 €/tonne considering exclusively N removal treatment. 2.5–5.2 €/tonne considering previous separation S/L, and the later treatment of the solid fraction by composting. |
| Composting of solid manure: Composting, co-composting of poultry manure with green residues, composting with a biological inoculum | Obtain a stable product with a low moisture content and retaining most of the initial nutrients, free of pathogens | Equipment:
| As guidance: 20 €/tonne |
| Anaerobic treatment | Production of biogas. Mineralization and stabilization of organic matter | Investment cost-basic price, €: 750,000 [43]; investment cost-variable price, € per tonne: 50 | Operational costs, € per tonne: 2.1. Operational costs, explanation: The operational costs indicated here include costs such as internal electricity consumption, labor, and insurance. In addition to this, it would be expected that maintenance costs of the plant represent 2–2.5% of the investment cost. Costs for transport of livestock manure and other in and out of the biogas plant is as indicated under investment costs estimated by [46], with a value of 7–4.7 €/m3. |
| Anaerobic lagoon system | Combined slurry stabilization, separation, and storage | Investment cost, variable price, € per cow: 580 [47] | Operating cost, € per milk tonne: 1.85 (author’s computation based on [47]) |
| Evaporation and drying of manure. Slurry and wet manure belt dryer | Increase nutrient and organic matter concentration. Reduced volume for easier and cheaper transport. | Investment cost-basic price, €: 250,000 [48]; nvestment cost, variable price, € per tonne: 2.1 (author’s computation based on [48]) | Operational costs, € per tonne: 2.5 (author’s computation based on [48]) |
| Slurry acidification | Reduction of ammonia emissions by lowering the pH of manure, with consequent ammonium (NH4-N) retention in the manure | There is a basic investment in the range of 25,000–100,000 € at a farm level (including storage tanks, pumps, and controllers), but dependent on the farm size and types of stables and other local parameters, such as the implementation of the sole spreading or storage plus spreading. | Operational costs, explanation: The total additional cost is app. € 20 per ha for use of acidification during spreading. This extra cost includes depreciation of the investment. The aggregate for slurry acidification in storage tanks is considerably cheaper than the required investments in acidification during spreading, but it has to be taken into consideration that slurry acidification in storage tanks due to foaming of the slurry during the process requires a freeboard in the tanks of 0.8–1 m, wherefore their capacity cannot be fully utilized. There are no noteworthy maintenance requirements of the acidification technology. |
| Ammonia stripping | Removal of ammonia through volatilization from a liquid phase, with subsequent recovery in an acidic solution as ammonium salt or by condensation. Often coupled with AD and biogas production [48]. | Investment cost: For an industrial plant projected in Catalonia for treating 10 m3/h of digested pig slurry (stripping including storage tanks and condensers), the investment cost was estimated to be 0.4–0.5 M€. For the Ihan plant located in Slovenia, treating 15 m3/h, the estimated investment cost of the stripping column was 0.25 M€. | Operational costs, explanation: Reagent cost: 0.66 €/m3 for NaOH/0.21 €/m3 for H2SO4 2.5–4.5 €/kg of stripped nitrogen (only for the stripping column) [49]. At least an equivalent range of values should be considered for the absorption step. |
| Manure additives | Facilitate handling and management of manure. Stabilization of manure and reduction of the pathogen contents |
Table A2.
Pig breeding type and localization of farms included in the sample.
Table A2.
Pig breeding type and localization of farms included in the sample.
| N ID | Region (NUTS 2) | Province (NUTS 3) | Municipality | Type of Pig Breeding |
|---|---|---|---|---|
| 1 | PIEMONTE | CN | VILLAFALLETTO | Farrow-to-finish |
| 2 | PIEMONTE | CN | PEVERAGNO | Feeder-to-finish |
| 3 | PIEMONTE | CN | SCARNAFIGI | Feeder-to-finish |
| 4 | PIEMONTE | TO | CARMAGNOLA | Feeder-to-finish |
| 5 | PIEMONTE | TO | RIVA PRESSO CHIERI | Farrow-to-finish |
| 6 | PIEMONTE | CN | RACCONIGI | Farrow-to-finish |
| 7 | PIEMONTE | TO | CARIGNANO | Feeder-to-finish |
| 8 | PIEMONTE | TO | RIVA PRESSO CHIERI | Farrow-to-finish |
| 9 | PIEMONTE | TO | RIVA PRESSO CHIERI | Farrow-to-feeder |
| 10 | PIEMONTE | TO | RIVA PRESSO CHIERI | Feeder-to-finish |
| 11 | PIEMONTE | NO | NOVARA-FR.OLENGO | Feeder-to-finish |
| 12 | PIEMONTE | TO | CHIERI | Feeder-to-finish |
| 13 | PIEMONTE | TO | RIVA PRESSO CHIERI | Feeder-to-finish |
| 14 | PIEMONTE | TO | CAMBIANO | Feeder-to-finish |
| 15 | FRIULI VENEZIA GIULIA | PN | SAN MARTINO AL TAGLIAMENTO | Not specified |
| 16 | FRIULI VENEZIA GIULIA | PN | SPILIMBERGO | Not specified |
| 17 | FRIULI VENEZIA GIULIA | PN | SPILIMBERGO | Farrow-to-finish |
| 18 | FRIULI VENEZIA GIULIA | PN | VIVARO | Not specified |
| 19 | FRIULI VENEZIA GIULIA | PN | CAVASSO NUOVO | Not specified |
| 20 | FRIULI VENEZIA GIULIA | PN | MANIAGO | Feeder-to-finish |
| 21 | FRIULI VENEZIA GIULIA | PN | VALVASONE | Farrow-to-feeder |
| 22 | FRIULI VENEZIA GIULIA | UD | RONCHIS | Farrow-to-finish |
| 23 | FRIULI VENEZIA GIULIA | UD | RIVIGNANO TEOR | Not specified |
| 24 | FRIULI VENEZIA GIULIA | UD | FRAFOREANO DI RONCHIS | Farrow-to-finish |
| 25 | FRIULI VENEZIA GIULIA | PN | PORCIA | Farrow-to-feeder |
| 26 | FRIULI VENEZIA GIULIA | PN | SACILE | Not specified |
| 27 | VENETO | VN | SALIZZOLE (VN) | Feeder-to-finish |
| 28 | VENETO | PD | PONSO (PD) | Farrow-to-feeder |
| 29 | VENETO | PD | STANGHELLA (PD) | Feeder-to-finish |
| 30 | VENETO | TV | ZERO BRANCO (TV) | Farrow-to-feeder |
| 31 | VENETO | TV | SAN BIAGIO DI CALLALTA TV | Farrow-to-feeder |
| 32 | VENETO | VR | NOGAROLE ROCCA (VR) | Feeder-to-finish |
| 33 | VENETO | PD | SANT’URBANO (PD) | Farrow-to-feeder |
| 34 | VENETO | TV | SAN BIAGIO DI CALLALTA, TV | Farrow-to-feeder |
| 35 | VENETO | VI | ROSÀ (VI) | Farrow-to-finish |
| 36 | VENETO | VE | CAMPAGNA LUPIA | Farrow-to-finish |
| 37 | VENETO | PD | MASSANZAGO | Feeder-to-finish |
| 38 | VENETO | PD | MASSANZAGO | Feeder-to-finish |
| 39 | VENETO | PD | CAMPOSANPIERO | Farrow-to-finish |
| 40 | VENETO | PD | TOMBOLO | Feeder-to-finish |
Table A3.
Average manure volumes, produced and stored (with variation %) by region, in the sample.
Table A3.
Average manure volumes, produced and stored (with variation %) by region, in the sample.
| Average Manure Volume (Produced, Cubic Meters) | St. Dev. | Average Manure Volume (Stored, Cubic Meters) | St. Dev. | Variation % (between Volume Produced and Stored) | |
|---|---|---|---|---|---|
| FVG | 11,258.3 | 10,061.7 | 12,351.6 | 11,563.0 | 8.9% |
| P | 14,366.6 | 7373.2 | 15,029.3 | 7850.5 | 4.4% |
| V | 13,609.0 | 7434.6 | 14,363.9 | 8125.5 | 5.3% |
| Whole sample | 13,169.0 | 8173.6 | 13,993.1 | 9029.2 | 5.9% |
Table A4.
Average available land, average owned land, and average land in Nitrate Vulnerable Zones (NVZ) by region in the sample.
Table A4.
Average available land, average owned land, and average land in Nitrate Vulnerable Zones (NVZ) by region in the sample.
| Average, Available Land (ha) | St. Dev of Available Land (ha) | Average, Owned Land (% of the Total Available Land) | St. Dev of Owned Land (% of the Total Available Land) | Average, Zones Vulnerable to N-leaching (% of the Total Available Land) | St. Dev of Zones Vulnerable to N-Leaching (% of the Total Available Land) | |
|---|---|---|---|---|---|---|
| FVG | 170.91 | 122.11 | 0.25 | 0.30 | 0.30 | 0.45 |
| P | 189.98 | 85.12 | 0.44 | 0.21 | 0.62 | 0.36 |
| V | 203.37 | 113.10 | 0.31 | 0.35 | 0.61 | 0.41 |
| Whole sample | 188.95 | 105.16 | 0.36 | 0.29 | 0.52 | 0.42 |
Table A5.
Average % of land by crop type and region (% of total land used for manure application).
Table A5.
Average % of land by crop type and region (% of total land used for manure application).
| Trees and Vineyards | Grain Legumes | Cereal-Crops | Oil and other Crops | Vegetables | Forage | Pasture and Grassland | |
|---|---|---|---|---|---|---|---|
| FVG | 6.5% | 18.5% | 66.8% | 2.2% | 0.3% | 5.0% | 0.6% |
| P | 1.2% | 6.0% | 87.2% | 0.4% | 0.0% | 1.2% | 4.0% |
| V | 7.1% | 15.9% | 55.0% | 0.8% | 2.0% | 18.1% | 1.0% |
| Total | 4.9% | 13.2% | 69.8% | 1.1% | 0.8% | 8.3% | 1.9% |
Table A6.
Scores of the main choice criteria by adopted processing technique.
Table A6.
Scores of the main choice criteria by adopted processing technique.
| Adopted Technique | Minimization of Treatment Costs | Minimization of Spreading Costs | Minimization of GHG Emissions | Minimization of Acidic Gas Emissions | Maximization of the Agronomical Value of the Nutrients Contained in the Slurry | Valorization of by-Products |
|---|---|---|---|---|---|---|
| Tanks or Stalls storage | 3.7 | 2.8 | 2.1 | 1.2 | 2.1 | 1.7 |
| Centrifuge separation | 2.0 | 5.0 | 4.0 | 3.0 | 1.0 | 1.0 |
| Ad-Cstr | 3.0 | 1.0 | 5.0 | 1.0 | 4.0 | 2.0 |
| Centrifuge separation + Ad-Cstr | 1.0 | 1.0 | 1.0 | 1.0 | 2.3 | 3.7 |
| BNR-SBR | 2.0 | 5.0 | 4.0 | 3.0 | 1.0 | 1.0 |
| BNR-Continuous | 1.0 | 1.0 | 1.0 | 1.0 | 1.0 | 1.0 |
| Centrifugal separation + Ad-Cstr + BNR-SBR | 4.0 | 5.0 | 1.0 | 1.0 | 3.0 | 2.0 |
Table A7.
Distribution of adopted techniques by region (* in V, one farm adopts more than one processing technique, and for this reason, the total percentage exceeds 100%).
Table A7.
Distribution of adopted techniques by region (* in V, one farm adopts more than one processing technique, and for this reason, the total percentage exceeds 100%).
| Adopted Technique | FVG | P | V * | Whole Sample |
|---|---|---|---|---|
| Tanks or Stalls storage | 100.0% | 71.4% | 78.6% | 82.5% |
| Screw press separation | 0.0% | 0.0% | 7.1% | 2.5% |
| Ad-Cstr | 0.0% | 0.0% | 7.1% | 2.5% |
| Screw press separation + Ad-Cstr | 0.0% | 21.4% | 0.0% | 7.5% |
| NBR-SBR | 0.0% | 0.0% | 7.1% | 2.5% |
| NBR-Continuous | 0.0% | 7.1% | 0.0% | 2.5% |
| Centrifugal separation + Ad-Cstr + NBR-SBR | 0.0% | 0.0% | 7.1% | 2.5% |
Table A8.
Frequency (absolute and percentage) of main problems, as perceived by the farm’s owners, by region.
Table A8.
Frequency (absolute and percentage) of main problems, as perceived by the farm’s owners, by region.
| High Distance of Available Lands | High Management Costs | High Investment Cost | Low Availability of Information on Upgrades | Total N° of Farms | High Distance of Available Lands | High Management Costs | High Investment Cost | Low Availability of Information on Upgrades | |
|---|---|---|---|---|---|---|---|---|---|
| FVG | 5.0 | 8.0 | 10.0 | 5.0 | 12.0 | 41.7% | 66.7% | 83.3% | 41.7% |
| P | 7.0 | 2.0 | 3.0 | 3.0 | 14.0 | 50.0% | 14.3% | 21.4% | 21.4% |
| V | 3.0 | 4.0 | 7.0 | 1.0 | 14.0 | 21.4% | 28.6% | 50.0% | 7.1% |
| Whole sample | 15.0 | 14.0 | 20.0 | 9.0 | 40.0 | 37.5% | 35.0% | 50.0% | 22.5% |
Table A9.
Different manure application techniques by class of farmland extension.
Table A9.
Different manure application techniques by class of farmland extension.
| % of ZVN on Total Available Land | Injection | Broadcasting with Incorporation | Broadcasting, No Incorporation | Total % | Total |
|---|---|---|---|---|---|
| Less than 9% | 7.7% | 69.2% | 23.1% | 100.0% | 13 |
| 10–49% | 14.3% | 57.1% | 28.6% | 100.0% | 7 |
| More than 50% | 20.0% | 65.0% | 15.0% | 100.0% | 20 |
| Whole sample | 0.15 | 0.65 | 0.2 | 1 | 40 |
Table A10.
Perception of upgradeability among the sampled farms by adopted processing technique.
Table A10.
Perception of upgradeability among the sampled farms by adopted processing technique.
| What treatment is actually adopted by the farms saying “no/yes” to upgradeability? | Upgradeability | No Processing-Only Storage | Screw Press Separation | Ad-Cstr | Screw Press Separation + Ad-Cstr | BNR-SBR | BNR-Continuous | Centrifugal Separation + AD-Cstr+ NBR-SBR | Total |
| NO | 17 | 2 | 1 | 18 | |||||
| YES | 18 | 1 | 1 | 1 | 1 | 1 | 22 | ||
| Total | 35 | 1 | 1 | 3 | 1 | 1 | 1 | 40 |
References
- Sommer, S.G.; Christensen, M.L.; Schmidt, T.; Jensen, L.S. Animal Manure Recycling; Sommer, S.G., Christensen, M.L., Schmidt, T., Jensen, L.S., Eds.; John Wiley & Sons, Ltd.: Chichester, UK, 2013; ISBN 978-1-118-67667-7. [Google Scholar]
- Herrero, M.; Henderson, B.; Havlík, P.; Thornton, P.K.; Conant, R.T.; Smith, P.; Wirsenius, S.; Hristov, A.N.; Gerber, P.; Gill, M.; et al. Greenhouse Gas Mitigation Potentials in the Livestock Sector. Nat. Clim. Chang. 2016, 6, 452–461. [Google Scholar] [CrossRef]
- Eurostat. Key Messages on Manure Application in Europe; Eurostat: Luxembourg, 2020.
- Food and Agriculture Organization of the United Nations (FAO). Livestock Manure N and GHG. Available online: http://www.fao.org/economic/ess/environment/data/livestock-manure-n-and-ghg/en/ (accessed on 20 November 2020).
- Santonja, G.G.; Georgitzikis, K.; Scalet, B.M.; Montobbio, P.; Roudier, S.; Sancho, L.D. Best Available Techniques (BAT) Reference Document for the Intensive Rearing of Poultry or Pigs; EUR 28674; Joint Research Center of the European Commission: Ispra, Italy, 2015. [Google Scholar]
- Foged, H.; Flotats, X.; Bonmatí, A.; Schelde, K.; Palatsi, J.; Magrí, A.; Juznic-Zonta, Z. Assessment of Economic Feasibility and Environmental Performance of Manure Processing Technologies; Unpublished draft; European Commission, Directorate General Environment: Brussels, Belgium, 2012. [Google Scholar]
- Hou, Y.; Velthof, G.L.; Case, S.D.C.; Oelofse, M.; Grignani, C.; Balsari, P.; Zavattaro, L.; Gioelli, F.; Bernal, M.P.; Fangueiro, D.; et al. Stakeholder Perceptions of Manure Treatment Technologies in Denmark, Italy, the Netherlands and Spain. J. Clean. Prod. 2018, 172, 1620–1630. [Google Scholar] [CrossRef]
- Eurostat. European Union Statistic Database; Eurostat: Luxembourg, 2020.
- European Commission. Internal Market, Industry, Entrepreneurship and SMEs; European Commission: Brussels, Belgium, 2020.
- Regione del Veneto. Valutazione Ambientale Strategica Agricola 2016–2019; Lazzaro, B., De ROsa, F., Martini, I., Fantinato, L., Measso, S., Totaro, L., Eds.; Regione del Veneto: Venezia, Italy, 2016. [Google Scholar]
- Istituto nazionale di statistica (ISTAT). 6 Censimento Generale Dell’Agricoltura: Atlante Dell’agricoltura Italiana; Bellini, G., Lipizzi, F., Consentino, F., Giordano, P., Eds.; Istituto nazionale di statistica: Rome, Italy, 2013; ISBN 978-88-458-1781-6. [Google Scholar]
- Increasing Social Awarness and ACceptance of biogas and biomethane (ISAAC). Biogas in Italia. Available online: http://www.isaac-project.it/en/biogas-in-italia/ (accessed on 20 November 2020).
- Dell’Antonia, D.; Sirio, C.; Carlino, A.; Gubiani, R.; Pergher, G. Development Perspectives for Biogas Production from Agricultural Waste in Friuli Venezia Giulia (Nord-East of Italy). J. Agric. Eng. 2013, 44. [Google Scholar] [CrossRef]
- Regione Piemonte. Procedura VAS 2015. Modifiche al Programma d’azione Di Obbligatoria Applicazione per Le Zone Vulnerabili Da Nitrati Di Origine Agricola (Regolamento Regionale 10/R/2007); Regione Piemonte: Torino, Italy, 2015. [Google Scholar]
- Adnan, N.; Nordin, S.M.; Bahruddin, M.A.; Tareq, A.H. A State-of-the-Art Review on Facilitating Sustainable Agriculture through Green Fertilizer Technology Adoption: Assessing Farmers Behaviour. Trends Food Sci. Technol. 2019, 86, 439–452. [Google Scholar] [CrossRef]
- Niles, M.T.; Horner, C.; Chintala, R.; Tricarico, J. A Review of Determinants for Dairy Farmer Decision Making on Manure Management Strategies in High-Income Countries. Environ. Res. Lett. 2019, 14, 053004. [Google Scholar] [CrossRef]
- Viaene, J.; Van Lancker, J.; Vandecasteele, B.; Willekens, K.; Bijttebier, J.; Ruysschaert, G.; De Neve, S.; Reubens, B. Opportunities and Barriers to On-Farm Composting and Compost Application: A Case Study from Northwestern Europe. Waste Manag. 2016, 48, 181–192. [Google Scholar] [CrossRef]
- Gebrezgabher, S.A.; Meuwissen, M.P.M.; Kruseman, G.; Lakner, D.; Oude Lansink, A.G.J.M. Factors Influencing Adoption of Manure Separation Technology in the Netherlands. J. Environ. Manag. 2015, 150, 1–8. [Google Scholar] [CrossRef]
- Dahlin, J.; Herbes, C.; Nelles, M. Biogas Digestate Marketing: Qualitative Insights into the Supply Side. Resour. Conserv. Recycl. 2015, 104. [Google Scholar] [CrossRef]
- Hoppe, T.; Sanders, M. Agricultural Green Gas Demonstration Projects in The Netherlands. A Stakeholder Analysis. Environ. Eng. Manag. J. 2015, 13, 3083–3096. [Google Scholar] [CrossRef]
- Loyon, L.; Burton, C.; Pahl, O.; Lalor, S. Reconciling Livestock Management to the Environment. Applying Best Available Technique (BAT): From the Lab to the Farm; Institut National de Recherche en Agriculture, Alimentation et Environnement: Rennes, France, 2013. [Google Scholar]
- Malomo, G.A.; Madugu, A.S.; Bolu, S.A. Sustainable Animal Manure Management Strategies and Practices. In Agricultural Waste and Residues; InTech: London, UK, 2018. [Google Scholar]
- Bonfanti, P.; Provolo, G. Sostenibilità Ambientale ed Economica: La Gestione Degli Effluenti Negli Allevamenti di Suini; FORUM: Udine, Italy, 2014; ISBN 978-88-8420-864-4. [Google Scholar]
- Velthof, G.L.; Lesschen, J.P.; Webb, J.; Pietrzak, S.; Miatkowski, Z.; Kros, J.; Pinto, M.; Oenema, O. The Impact of the Nitrates Directive on Gaseous N Emissions; Alterra: Wageningen, The Netherlands, 2010. [Google Scholar]
- Dennehy, C.; Lawlor, P.G.; Jiang, Y.; Gardiner, G.E.; Xie, S.; Nghiem, L.D.; Zhan, X. Greenhouse Gas Emissions from Different Pig Manure Management Techniques: A Critical Analysis. Fac. Eng. Inf. Sci. Pap. 2017. [Google Scholar] [CrossRef]
- Antoneli, V.; Mosele, A.C.; Bednarz, J.A.; Pulido-Fernández, M.; Lozano-Parra, J.; Keesstra, S.D.; Rodrigo-Comino, J. Effects of Applying Liquid Swine Manure on Soil Quality and Yield Production in Tropical Soybean Crops (Paraná, Brazil). Sustainability 2019, 11, 3898. [Google Scholar] [CrossRef]
- Halder, J.N.; Kang, T.W.; Yabe, M.; Lee, M.G. Development of a Quality Certification and Maturity Classification Method for Liquid Fertilizer by Measuring the Electrical Conductivity (EC) of Swine Manure. J. Fac. Agric. Kyushu Univ. 2017, 62, 205–212. [Google Scholar]
- Choudhary, M.; Bailey, L.D.; Grant, C.A. Review of the Use of Swine Manure in Crop Production: Effects On Yield and Composition and On Soil and Water Quality. Waste Manag.Res. 1996, 14, 581–595. [Google Scholar] [CrossRef]
- Cai, J.; Zhang, L.; Tang, J.; Pan, D. Adoption of Multiple Sustainable Manure Treatment Technologies by Pig Farmers in Rural China: A Case Study of Poyang Lake Region. Sustainability 2019, 11, 6458. [Google Scholar] [CrossRef]
- Fangueiro, D.; Coutinho, J.; Chadwick, D.; Moreira, N.; Trindade, H. Effect of Cattle Slurry Separation on Greenhouse Gas and Ammonia Emissions during Storage. J. Environ. Qual. 2008, 37, 2322–2331. [Google Scholar] [CrossRef] [PubMed]
- Perazzolo, F.; Mattachini, G.; Tambone, F.; Misselbrook, T.; Provolo, G. Effect of Mechanical Separation on Emissions during Storage of Two Anaerobically Codigested Animal Slurries. Agric. Ecosyst. Environ. 2015, 207, 1–9. [Google Scholar] [CrossRef]
- Lyng, K.A.; Bjerkestrand, M.; Stensgård, A.E.; Callewaert, P.; Hanssen, O.J. Optimising Anaerobic Digestion of Manure Resources at a Regional Level. Sustainability 2018, 10, 286. [Google Scholar] [CrossRef]
- Paolini, V.; Petracchini, F.; Segreto, M.; Tomassetti, L.; Naja, N.; Cecinato, A. Environmental Impact of Biogas: A Short Review of Current Knowledge. J. Environ. Sci. Health Part A 2018, 53, 899–906. [Google Scholar] [CrossRef]
- De Haas, D.; Hartley, K.J. Greenhouse Gas Emissions from BNR Plant—Do We Have the Right Focus? In Proceedings of the EPA Workshop: Sewage Management: Risk Assessment and Triple Bottom Line, Carins, Australia, 5–7 April 2004. [Google Scholar]
- Pellervo, K.; Heikki, L.; Heidi, R.; Huibert, O.; Sindhöj, E. Economics of Manure Logistics, Separation and Land Application; Baltic Manure: Goslar, Germany, 2013. [Google Scholar]
- Bortone, G. Integrated Anaerobic/Aerobic Biological Treatment for Intensive Swine Production. Bioresour. Technol. 2009, 100, 5424–5430. [Google Scholar] [CrossRef]
- Finzi, A.; Mattachini, G.; Lovarelli, D.; Riva, E.; Provolo, G. Technical, Economic, and Environmental Assessment of a Collective Integrated Treatment System for Energy Recovery and Nutrient Removal from Livestock Manure. Sustainability 2020, 12, 2756. [Google Scholar] [CrossRef]
- Loyon, L.; Burton, C.H.; Misselbrook, T.; Webb, J.; Philippe, F.X.; Aguilar, M.; Doreau, M.; Hassouna, M.; Veldkamp, T.; Dourmad, J.Y.; et al. Best Available Technology for European Livestock Farms: Availability, Effectiveness and Uptake. J. Environ. Manag. 2016, 166, 1–11. [Google Scholar] [CrossRef] [PubMed]
- Breuer, B.; Martin, L.; Wierig, M.; Saggau, E. Drivers of Change and Development in the EU Livestock Sector. Meta Analysis as Basis for Future Scenario Building; Collaborative Working Group on Sustainable Animal Production: Bonn, Germany, 2019. [Google Scholar]
- Frison, E.A. From Uniformity to Diversity: A Paradigm Shift from Industrial Agriculture to Diversified Agroecological Systems; International Panel of Experts on Sustainable Food Systems: Brussels, Belgium, 2016. [Google Scholar]
- Weishaupt, A.; Ekardt, F.; Garske, B.; Stubenrauch, J.; Wieding, J. Land Use, Livestock, Quantity Governance, and Economic Instruments-Sustainability beyond Big Livestock Herds and Fossil Fuels. Sustainability 2020, 12, 2053. [Google Scholar] [CrossRef]
- Organe Institute. AgroTEchnology ATLAS. Available online: https://www.organe.dk/ (accessed on 20 November 2020).
- Foged, H.L. Best Available Technologies for Manure Treatment—For Intensive Rearing of Pigs in Baltic Sea Region EU Member States; Baltic Sea: Stockholm, Rweden, 2010. [Google Scholar]
- Levasseur, P. Composition des Effluents Porcins et de Leurs Co-Produits de Traitement Quantités Produites; ITP: Paris, France, 2005; ISBN 978-2-85969-173-8. [Google Scholar]
- Frandsen, T.Q.; Bomholt, G. Separering af Svinegylle Med SepKon; FarmTest; AgroTech.; Videncentret for Landbrug: Århus, Denmark, 2010. [Google Scholar]
- Hjorth-Gregersen, K. Status for Økonomien i Biogasfællesanlæg, Abstract from Report 136; University of Copenhagen: Copenhagen, UK, 2002. [Google Scholar]
- Giesy, R.; Wilkie, A.C.; De Vries, A.; Nordstedt, R. A Economic Feasibility of Anaerobic Digestion To Produce Electricity on Florida Dairy Farms. EDIS 2005, 159, 1–8. [Google Scholar]
- Wright, P. Potential for Biodrying Manure; Watershed Agriculture Council: New York, NY, USA, 2002. [Google Scholar]
- Collivignarelli, C.; Bertanza, G.; Baldi, M.; Avezzù, F. Ammonia Stripping from MSW Landfill Leachate in Bubble Reactors: Process Modeling and Optimization. Waste Manag. Res 1998, 16, 455–466. [Google Scholar] [CrossRef]


Publisher’s Note: MDPI stays neutral with regard to jurisdictional claims in published maps and institutional affiliations. |
© 2021 by the authors. Licensee MDPI, Basel, Switzerland. This article is an open access article distributed under the terms and conditions of the Creative Commons Attribution (CC BY) license (http://creativecommons.org/licenses/by/4.0/).