Article

The Integration of Conventional Equity Indices with Environmental, Social, and Governance Indices: Evidence from Emerging Economies

by
Ramiz ur Rehman
1,2,
Muhammad Zain ul Abidin
2,
Rizwan Ali
2,*,
Safwan Mohd Nor
3,4,*,
Muhammad Akram Naseem
2,
Mudassar Hasan
2 and
Muhammad Ishfaq Ahmad
2
1
School of Management, Xi’an Polytechnic University, Xi’an 710048, China
2
Lahore Business School, The University of Lahore, Lahore 54100, Pakistan
3
Faculty of Business, Economics and Social Development, University of Malaysia Terengganu, Kuala Nerus 21030, Terengganu, Malaysia
4
Victoria Institute of Strategic Economic Studies, Victoria University, Melbourne, VIC 3000, Australia
*
Authors to whom correspondence should be addressed.
Sustainability 2021, 13(2), 676; https://doi.org/10.3390/su13020676
Submission received: 3 December 2020 / Revised: 4 January 2021 / Accepted: 5 January 2021 / Published: 12 January 2021
(This article belongs to the Section Economic and Business Aspects of Sustainability)

Abstract

:
This study investigates the integration of environmental, social, and governance (ESG) equity indices with conventional indices in Brazil, Russia, India, China, and South Africa (BRICS) individually and across all BRICS countries to better understand regional economic cooperation. Accordingly, we look at daily returns from 13 July 2013 to 28 February 2018 for the Morgan Stanley Capital International (MSCI) ESG indices and MSCI composite indices of the respective countries. To analyze the integration between the ESG equity indices of the sampled countries with their regional and across regional conventional counterparts, the Johansen Co-integration test is employed in this study. Further, the vector error correction model (VECM) is applied to test the causality between the sampled time-series. The impulse response function analysis further explains the impulse responses of each country’s MSCI ESG returns to one standard deviation of innovations to MSCI composite returns of the same country and across countries. Finally, the extent of the MSCI composite returns’ impact on the MSCI ESG returns in the same country indices, and cross-regional indices is examined with variance decomposition analysis. The results suggest that all ESG equity indices are integrated with conventional indices in all BRICS countries. Furthermore, there is a short-or long-run causality between MSCI ESG and MSCI composite equity indices of China and South Africa. Moreover, the study finds only short-run causality between conventional and non-conventional equity indices of Brazil and Russia, whereas we find only long-run causality between India’s non-conventional and conventional equity indices. Finally, the study finds that the all-individual country MSCI ESG equity indices shows a long-run causality with MSCI composite equity indices of all other BRICS countries. The findings also confirm the economic and financial cooperation between the BRICS countries.

1. Introduction

The principle of responsible investment (PRI) paves the way for organizations to incorporate environmental, social, and governance (ESG) criteria into their investment strategies [1,2,3]. As a result of investor interest, ESG activity has increased in the last decade with global assets incorporating ESG strategies reaching USD 60 trillion in 2016 [4,5]. The concept of a socially responsible investing (SRI) considers investments in terms of ethical impact, as well as financial gains [2,6,7]. The burgeoning acceptability of ESG investing has generated the need for ESG indices and rating agencies. Such indices provide benchmark measures for investors to track the performance of their investments [4]. These indices help boost ESG investing, as well as the implementation of responsible investment policies [3,4,8]. The 100 plus ESG rating and index providing agencies [3] are signs of growing investor and portfolio manager interest in ESG index funds. Currently, there are about 121 ESG indices. Morgan Stanley Capital International (MSCI), a renowned index and ratings agency provider, runs more than 700 ESG indices [4]. Some other important socially responsible investment indices are the Dow Jones Sustainability indices (DJSI), the FTSE4Good indices, the FTSE Russell index, the Thomson Reuters indices, and the S&P Dow Jones and RobeccoSAM indices [4,8]. These track the stock prices of companies that fulfill ESG requirements. As such, these indices play a major role in the global development of responsible practices [9] and the inclusion of sustainable practices within organizations [10]. In addition, the indices are used as a source of investment and performance tracking by individual investors, as well as portfolio/fund managers whose core objective is financial return [11].
Thus, these ESG indices help investors monitor a firm’s sustainability performance, as only companies that outperform their peers in an in-depth analysis of economic, environmental, and social criteria are included on these sustainability indices. Hence, these are different from conventional indices. The firms included on these indices are generally known as sustainability leaders [12]. Many studies have examined the risk and return linkage between conventional equity indices and sustainability indices [2,6,13,14,15,16,17,18], as investors face greater diversification risk in SRI compared with conventional investing. The indices are compared by evaluating the firms on the basis of financial ratios and overall business performance [19,20,21,22]. These studies have generally been conducted in developed markets, with few examining emerging markets [2,23,24].
Further, although various studies focus on ESG and SRI indices, no study has explored the strength of ESG index integration with conventional composite equity indices. As globalization increases, the integration of financial markets represents an advancement in the securities markets. This has caught the attention of international investors, as well as academic scholars, in terms of returns and the exploration of the relationships within world stock markets [25]. There is a general belief that SRI indices are not as globally integrated as general equity indices. Less integrated indices carry the risk of mispricing from market to market [2]. A more integrated environment increases the efficient allocation of resources, which generates productive investment opportunities, and barriers to this environment impact efficiency [26]. However, integration also negatively impacts diversification opportunities, and a well-integrated market allows the free flow of capital, which can limit such advantages [27]. Thus, it is vital to understand the strength of the integration of ESG indices compared to conventional indices in the emerging economy context to improve our understanding from a regional perspective.
Our study aims to examine the integration of ESG equity indices and conventional indices in emerging markets, specifically among Brazil, Russia, India, China, and South Africa (BRICS). Our research question is: are ESG equity indices integrated with their conventional counterparts (the general belief being no)? To answer this, we choose the BRICS countries motivated by their unique dynamics compared with other emerging markets since this economic bloc comprises one country from South America (Brazil), one country from Africa (South Africa), and three from top emerging economies (Russia, China, and India). The unique BRICS composition of distant and neighboring countries could help us test the co-movement of financial markets, as scholars suggest [28] that co-movement is greater in neighboring countries or those located in the same geographical area than in those farther away. Exploring the integration strength between conventional equity and ESG indices also helps us assess the significance of the BRICS bloc and its financial and economic harmony.
To that end, we measure the integration of ESG equity indices with conventional equity indices in each individual BRICS country, as well as cross-country integration to understand regional economic and financial cooperation [29]. We use data from the MSCI ESG indices and MSCI composite indices launched in 2010. We collect daily return data from 13 July 2013 to 28 February 2018 of the selected indices, as the timing of the movements shows a significant relationship in the period of one day. We also explore the short- and long-run dynamics of this relation, as this is key to understanding the potential of emerging markets for portfolio diversification. This will help us find evidence regarding the general belief that SRI indices are not globally integrated compared with general equity indices [2]. Thus, our study contributes to the literature by providing empirical evidence on the integration in emerging markets previously believed to have unintegrated composite indices [30,31]. Our study also contributes by exploring the regional and cross-continental impact of the integration of ESG indices and their conventional index counterparts.
The rest of the paper is organized as follows. The next section briefly discusses the literature review. Section 3 explains the methodology. Section 4 presents the empirical findings of the paper. Section 5 discusses the results, while the final section concludes.

2. Literature Review

As stated above, investors and researchers have shown recent interest in sustainable or ESG equity indices. Several studies explore the return and volatility linkages and comparisons among conventional and sustainability indices [13,15,17,18,32,33,34,35,36,37,38]. Some believe that sustainable or responsible investment has the potential to be part of the solution to social and ecological issues by transforming equity markets to increase accountability among firms; hence, more research in this field is required to develop it as an applied field of investment [39].
Scholars have employed different methods to compare the risk and return in sustainable and conventional indices in their analyses. These include basic and simple methods, such as calculating correlations and exponential smoothening to more complex and advanced econometric techniques, such as auto-regressive conditional heteroskedasticity (ARCH) and the vector auto-regressive (VAR) model [35,40,41,42,43,44,45,46]. Sadorsky [44] uses a multivariate generalized ARCH (GARCH) model to examine the volatilities and conditional correlation among a stock price index comprising socially responsible companies, oil prices, and gold prices and finds similar results to investing in the S&P 500. However, Tse [46] finds a significant bi-directional flow of information between the Dow Jones Industrial Average (DJIA) index and the index future using a bivariate exponential GARCH (EGARCH) model.
Some recent literature compares the performance of firms included on sustainable indices with those on conventional indices. Of these studies, 78% find that firms listed on sustainable indices reflect better financial performance than those listed on conventional indices [17,20,47,48,49,50]. Tularam et al. [18] study the relationship between the Australian SRI market and 14 other markets in Europe and the U.S. They estimate SRI’s growth globally at around USD 6.5 trillion, with USD 55 billion invested in Australia, using a dynamic conditional correlation (DCC)-GARCH model. Charlo et al. [13] find that socially responsible firms listed on the Spanish sustainability index, the FTSE4Good IBEX (a sustainable market index partnership between the Financial Times Stock Exchange (FTSE) group and the Spanish stock exchange), reveal higher profits for the same level of systemic risk and are highly sensitive to market information. Additionally, Fowler and Hope [34] indicate that after the inclusion of sustainably responsible indices in financial markets, the fund managers use funds under the management of sustainable indices. Batista and Francisco [51] find environment, human resource, and organization management as the baseline for implementing sustainable practices among firms listed on the Corporate Sustainable Index concerning the Brazilian stock market. Ortas et al. [42] argue that, in a post-crisis scenario (2008), social and responsible investment strategies are less risky than a conventional investment when markets are unstable. Other studies analyzing periods of market crisis include [15,21,35,36,38,52,53]. Table 1 presents a summary of the systematic literature review.
Many studies have been conducted on U.S. sustainability indices [35,38,52,55], Europe’s sustainability indices [12,13,20,33,42,56] and on Australian markets [18,54]. However, few studies have looked at the economies of developing countries [2,39]. Indeed, Alshehhi et al. [47] comment that emerging and developing countries lag behind developed countries in comparisons to sustainable and conventional indices. Our study attempts to fill this gap.
Although several studies evaluate different sustainable indices around the world, such as the Dow Jones Sustainability Index [12,22,52,55,57,58], the FTSE4Good-IBEX [13,33,59], the IPC Sustainability (IPCS) index [38], and Corporate Environmental Sustainability Reporting (CESR) index [42], no study compares between the Thomson Reuters Sustainable Indices and their conventional alternatives, namely the MSCI stock market indices worldwide. Moreover, the extant literature does not examine the integration between the sustainable indices and conventional market indices [44].
Thus, there is a need to understand better the integration of ESG equity indices and conventional indices in emerging markets. Hence, our study is unique in that it examines this largely ignored area in the literature in terms of sustainability investment and investigates the cointegration of ESG equity indices with conventional equity indices within each BRICS country and across these countries.

3. Methodology

3.1. Data Description

Our focus is on the integration of ESG and conventional equity indices in the emerging BRICS economies. The quoted currency of these indices is the USD. This helps avoid local inflationary pressure and currency fluctuations on the respective indices and enables conformity [30,60]. As stated above, we look at integration at the regional and cross-regional level, analyzing the daily price of the selected indices from 13 July 2013 to 28 February 2018. We collect our data from the MSCI equity indices and from Thomson Reuters Datastream. The data are post-crisis period and range up to the latest period; therefore, they reflect a realistic view of integration among BRICS financial markets.

3.2. Initial Data

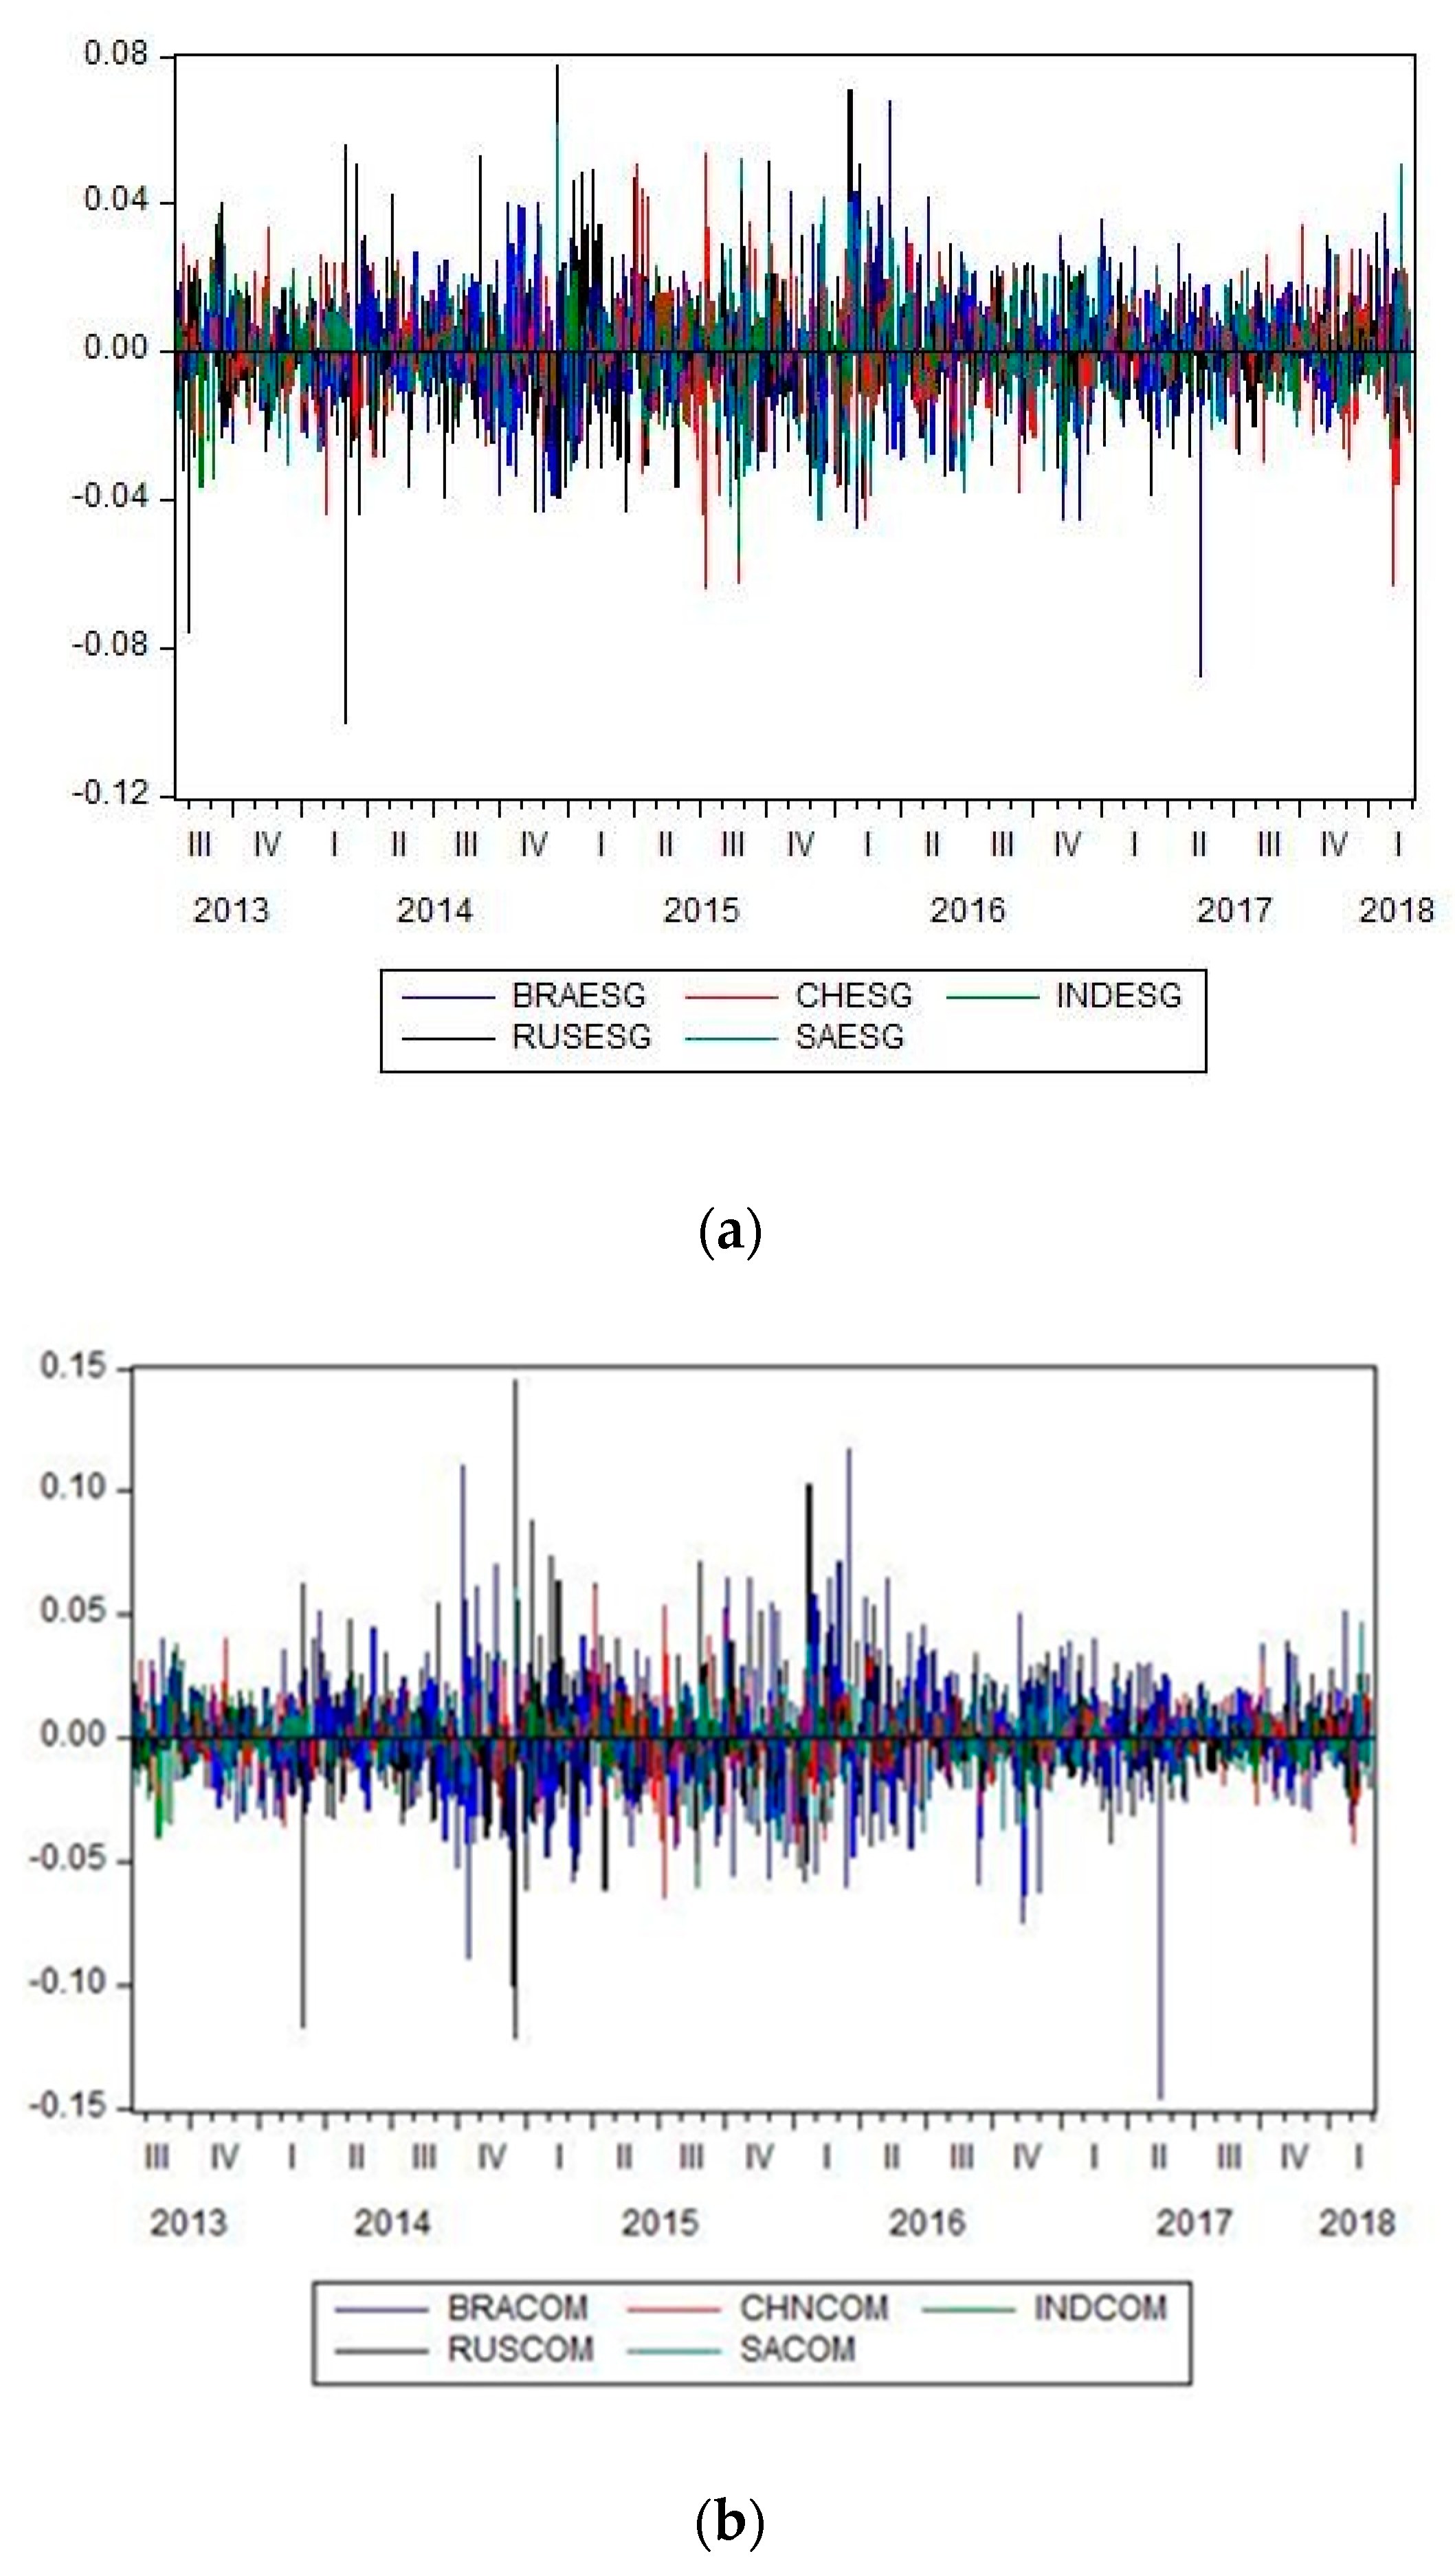
The daily returns of the MSCI composite and ESG indices in five BRICS countries are reported in Table 2, while the charts are provided in Figure 1. The results show that the average (mean) returns of all the conventional and ESG indices are positive except the Brazil MSCI composite equity indices. The mean daily returns of the MSCI ESG indices are higher than the MSCI composite equity indices in Brazil, China, India, and South Africa. The variation in daily returns of the MSCI ESG equity indices in China and South Africa is higher than its counterpart in the equity indices. The highest returns are reported in the China and South Africa ESG indices, while their volatility is also high. This supports the basic theory of finance of "the higher the risk, the higher the return"; thus, ESG markets in these two countries are riskier. The mean in the India indices is the third-highest, but its volatility is lowest. This shows the stability of the India market in comparison with other BRICS countries. The Brazil and Russia ESG index means are higher than their conventional indices, but their volatility level is also lower. This shows investor trust in an ESG based portfolio as they generate a higher return with a lower risk. These results align with other studies that indicate that the ESG risk–return relationship is better than that of conventional indices.

3.3. Model Framework

We focus on the cointegration between daily returns on conventional composite indices (e.g., MSCI Brazil) and ESG indices (e.g., MSCI Brazil ESG leader Index). The nature and extent of the cointegration between the daily returns of the two indices reflect their level of integration. This also provides us with evidence of whether the “Law of One Price” holds. For this, we use the Johansen cointegration and vector error correction model (VECM) to investigate the long-term equilibrium and short-term dynamic relationship between conventional and ESG equity indices in BRICS countries. Since most time-series are non-stationary, direct regression will lead to “spurious regression” results.
Engle and Granger [61] show that a long-term, stable relationship exists between different economic time-series. Johansen’s [62] cointegration approach analyzes the long-term integration between two or more time-series. Johansen’s approach consists of assessing the rank of the matrix. Within this context, if r = 0, there is no cointegration between variables. If 1 ≤ r ≤ k − 1, there are long-run relationships. If r = k, there is no cointegration because all variables are integrated of order 0, I(0). Two likelihood ratio tests (trace and maximum eigenvalue tests) are employed to determine the number of cointegrating vectors r. If the time-series is cointegrated at a rank more than one, then the restricted VECM is recommended. The VECM is widely applicable to examine long-term and short-term relations among cointegrated variables [63,64,65,66]. If the conventional and ESG equity indices in BRICS countries are cointegrated, then the VECM equation is as follows.
M S C I E S G t =   φ 1 +   i = 1 n β 1 M S C I E S G t i +   j = 1 n γ 1 M S C I C O M t j +   ε 1 E C T t 1 + μ 1 t ,
where φ ,   β , γ are the coefficients of the polynomials, n is the optimal lag, and ECT is the error correction term. The equation expresses the causality of the MSCI composite (conventional) equity indices to the MSCI ESG equity indices in the respective BRICS countries within and across the region. If the null hypothesis of all the coefficients of the polynomials (i.e., φ = β = γ = 0 ) is rejected, then there is short-term Granger causality from the MSCI composite equity indices to the MSCI ESG equity indices. The coefficient of ECT shows the speed of adjustment toward equilibrium. If H o :   ε 1 = 0 is rejected, then the long-term Granger causality is established from right to left.
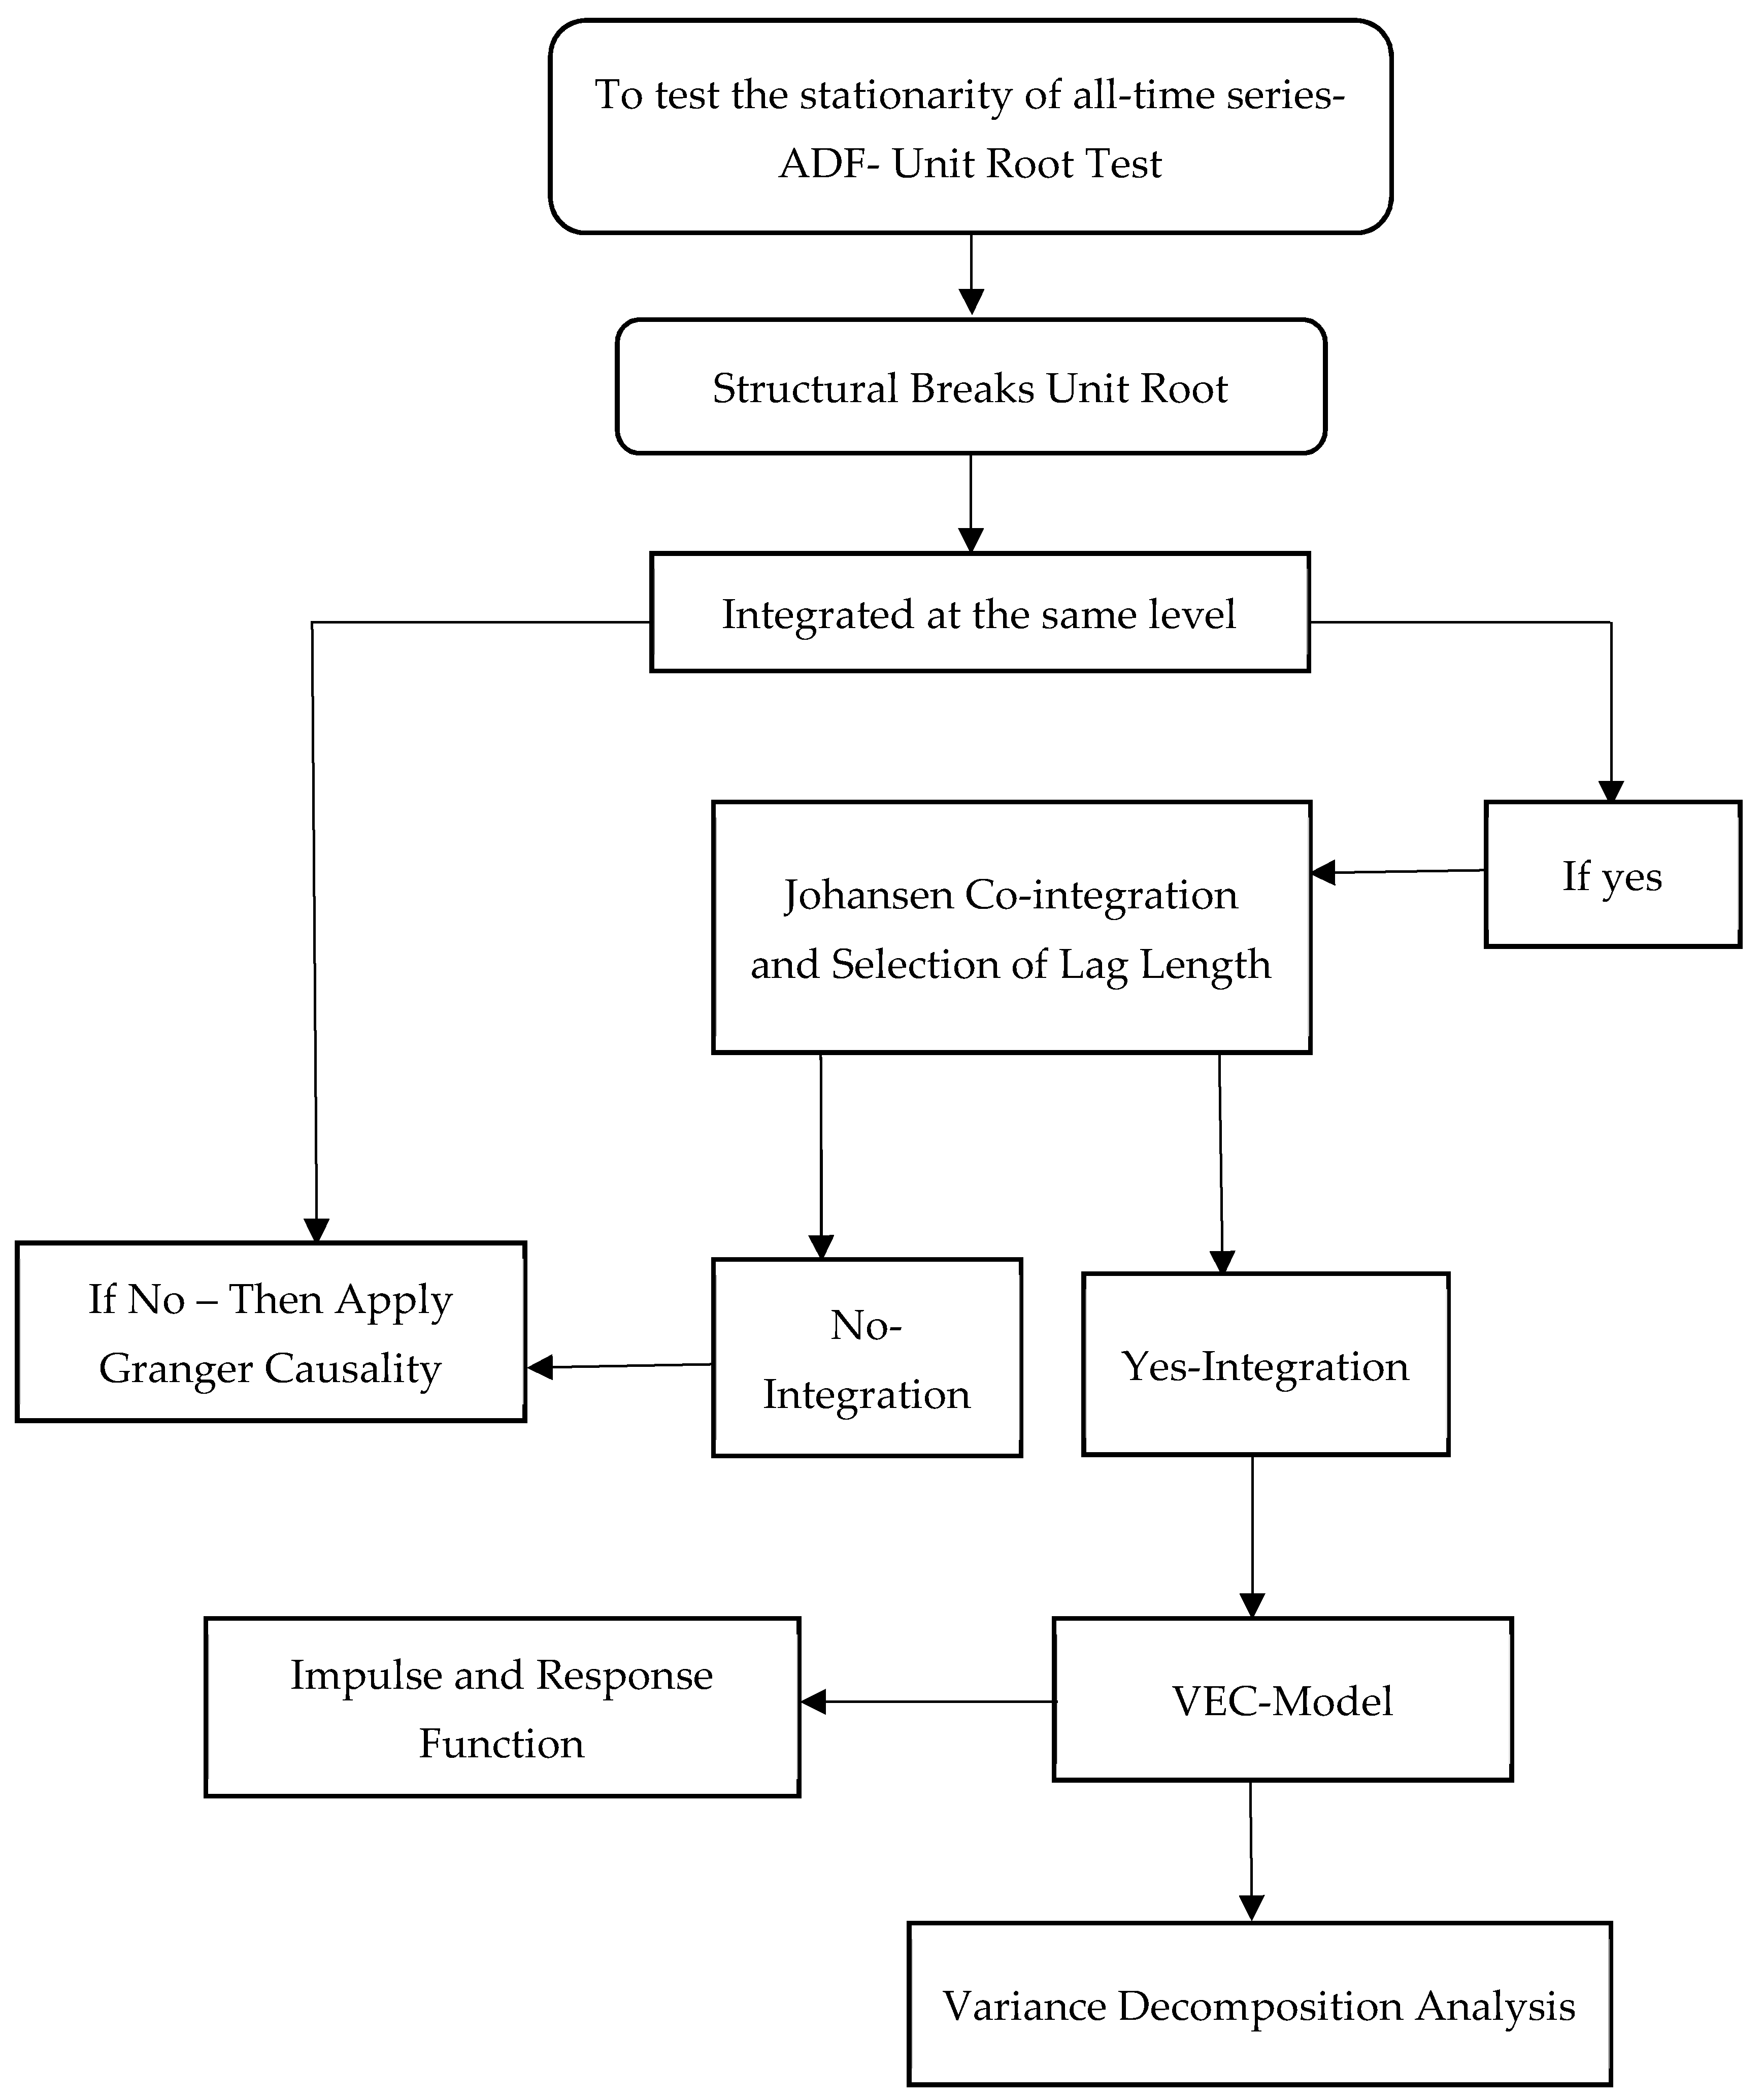
We also introduce the impulse response and variance decomposition function to estimate the impact of one-time and one standard deviation shock to innovations in the equity indices current and future values. The shock to one of the indices directly impacts that same variable and spreads to other counterpart indices in the same country and across countries due to the dynamic nature of the VECM. As the error term or innovations are usually correlated and, thus, share some common factors, generally, transformation is applied to make them uncorrelated. We apply the Cholesky ordering here as the ordering of impulse and response variables has an important implication for our analysis. Further, for estimating the variation of the indices for each random innovation, variance decomposition is also applied. The analysis of this paper is conducted as per the following flow chart (Figure 2).

4. Empirical Results

4.1. Unit Root and Cointegration Tests

The series in this study are all time-series, therefore, to avoid spurious regression, we conduct the unit root test for each series. We use the augmented Dickey-Fuller (ADF) and Phillips-Perron (PP) tests. Our results are presented in Table 3 andTable 4. Table 3 shows the test statistics for ADF and PP for the unit root test in the BRICS countries’ MSCI ESG equity indices. All MSCI ESG series are stationary at level and up to lag 3, as the ADF and PP test statistics are significant at 1%, rejecting the null hypothesis of the unit root. Similarly, the MSCI composite series of the BRICS countries are also stationary at level and up to lag 3, as shown in Table 4.
The conventional ADF and PP tests do not allow structural breaks in the series to cause misleading results. We also account for the structural or regime shifts in the level and trends using the Zivot-Andrews [67] unit root test. The results are in the same direction as observed in the ordinary series. All time-series of the MSCI ESG equity indices or the MSCI composite indices are stationary at level after allowing one structural shift in the data. However, these structural shifts appear at different dates for each series (see Table 5). The MSCI ESG and MSCI composite stock prices in BRICS countries are stationary at level; therefore, we can conduct a cointegration test between different markets.
Johansen’s cointegration test results are shown in Table 6 in two panels. In Panel A, the cointegration results of two country-wise equity indices (i.e., conventional and non-conventional) are presented. In Panel B, the cointegration of the MSCI ESG equity indices of one country with the MSCI composite equity indices of the other BRICS countries are included. Further, the lag selection criteria for all integrated series in both panels are calculated by applying a simple VAR model. The results suggest that the MSCI ESG equity index for Brazil exhibits a long-run cointegrated relationship with the MSCI composite equity index. Similarly, all individual countries’ conventional and non-conventional indices show long-run cointegrated relationships. For the lag selection criteria, based on Akaike’s Information Criterion (AIC) and the Final Prediction Error (FPE), seven (7) lags are suggested for both Brazilian equity indices, which are higher than the other countries in BRICS. For India and South Africa, the lag length suggested is four (4). In Panel B, the cointegration of the non-conventional equity index of one BRICS country is tested against all conventional equity indices of the other BRICS countries. The results suggest that the China MSCI ESG equity index has a long-run cointegrated relationship with Brazil, India, Russia, and South Africa MSCI composite indices based on eigenvalues and trace statistics.
Our objective is to determine how BRICS countries’ conventional equity indices influence a single country’s ESG equity index. The same results are obtained for other cross-regional combinations of conventional and non-conventional equity indices. We provide evidence that the MSCI ESG is integrated with its MSCI composite index in the same country and/or it has regional, as well as cross-regional, saturation. We also show that the returns of these indices become similar in the long run. Additionally, the existence of the “Law of One Price” in the long run is confirmed, as is the integration level. Our results negate a common perception about ESG indices that these are not as fully integrated as conventional indices. The maximum lag for each analysis in Panel B is 2.

4.2. Causality Analysis using the Vector Error Correction Model

4.2.1. Regional Analysis

Since we find that the time-series of both the conventional and unconventional equity indices of the BRICS countries are cointegrated, we apply a Granger causality test under the framework of the VECM to determine short- and long-run causality. Granger [68] recommends that when series are cointegrated, the VECM is best suited to test causality among series. We use the VECM Granger causality test by Engle and Granger [61] to examine the direction of causality between the conventional and non-conventional equity indices in the individual BRICS countries. The results are shown in Table 7. The first two columns show the results for conventional and non-conventional equity indices in Brazil. In Brazil, the MSCI ESG equity index returns are influenced by conventional equity indices at lag seven. This shows short-run causality between the conventional and non-conventional equity indices of Brazil. Further, the error correction term at lag one (i.e., ECTt-1) is positive and significant in the Brazil MSCI ESG equity index equation with its counterpart conventional index, indicating there is no long-run causality between these two equity indices in Brazil. In Russia, the MSCI ESG equity returns are affected by the same indices and the counterpart indices at lags one and two, exhibiting short-run causality. However, no long-run causality is observed between the conventional and non-conventional equity indices in Russia, as the ECTt-1 are positive and significant, respectively. The India MSCI ESG returns show long-run causality between the conventional index returns, as ECTt-1 is negative and significant at the 1% level. Moreover, there is also short-run causality between the India MSCI ESG returns and the MSCI composite returns at four lags, as coefficients of all four lags of the MSCI composite returns are negative and significant at 1%. Similarly, for China and South Africa, there is evidence of short-run and long-run causality between the MSCI ESG returns and MSCI composite returns.

4.2.2. Cross-Regional

We extend the analysis to a cross-regional examination of causality between conventional and non-conventional equity indices for the BRICS countries. Table 8 presents the results of cross-regional causality. In the first column, we present the causality of MSCI ESG equity returns in China with four conventional equity indices in other BRICS countries. The ECTt-1 is negative and significant, which shows that there is long-run causality between the returns of the China MSCI ESG index and other BRICS countries’ conventional equity returns. However, we find only short-run causality between China MSCI ESG and South Africa MSCI composite indices. We find similar results for the India MSCI ESG returns. Moreover, the Russia MSCI ESG returns are influenced by lag one and two returns of China and India MSCI composite returns, showing short-run causality among them. The ECTt-1 coefficient is also negative and significant in the Russia MSCI ESG return equation with other countries’ conventional indices, offering long-run causality. We find similar results for the South Africa MSCI ESG returns. However, the Brazil MSCI ESG returns show long-run causality between all other BRICS countries’ counterpart equity returns, as the coefficient of ECTt-1 is significant and negative. Moreover, there is also evidence of short-run causality between the Brazil MSCI ESG returns and all other BRICS countries’ conventional indices, as the coefficient of lag one and two of all the MSCI composite returns of the BRICS countries is negative and significant.

4.3. Impulse Response Function Analysis

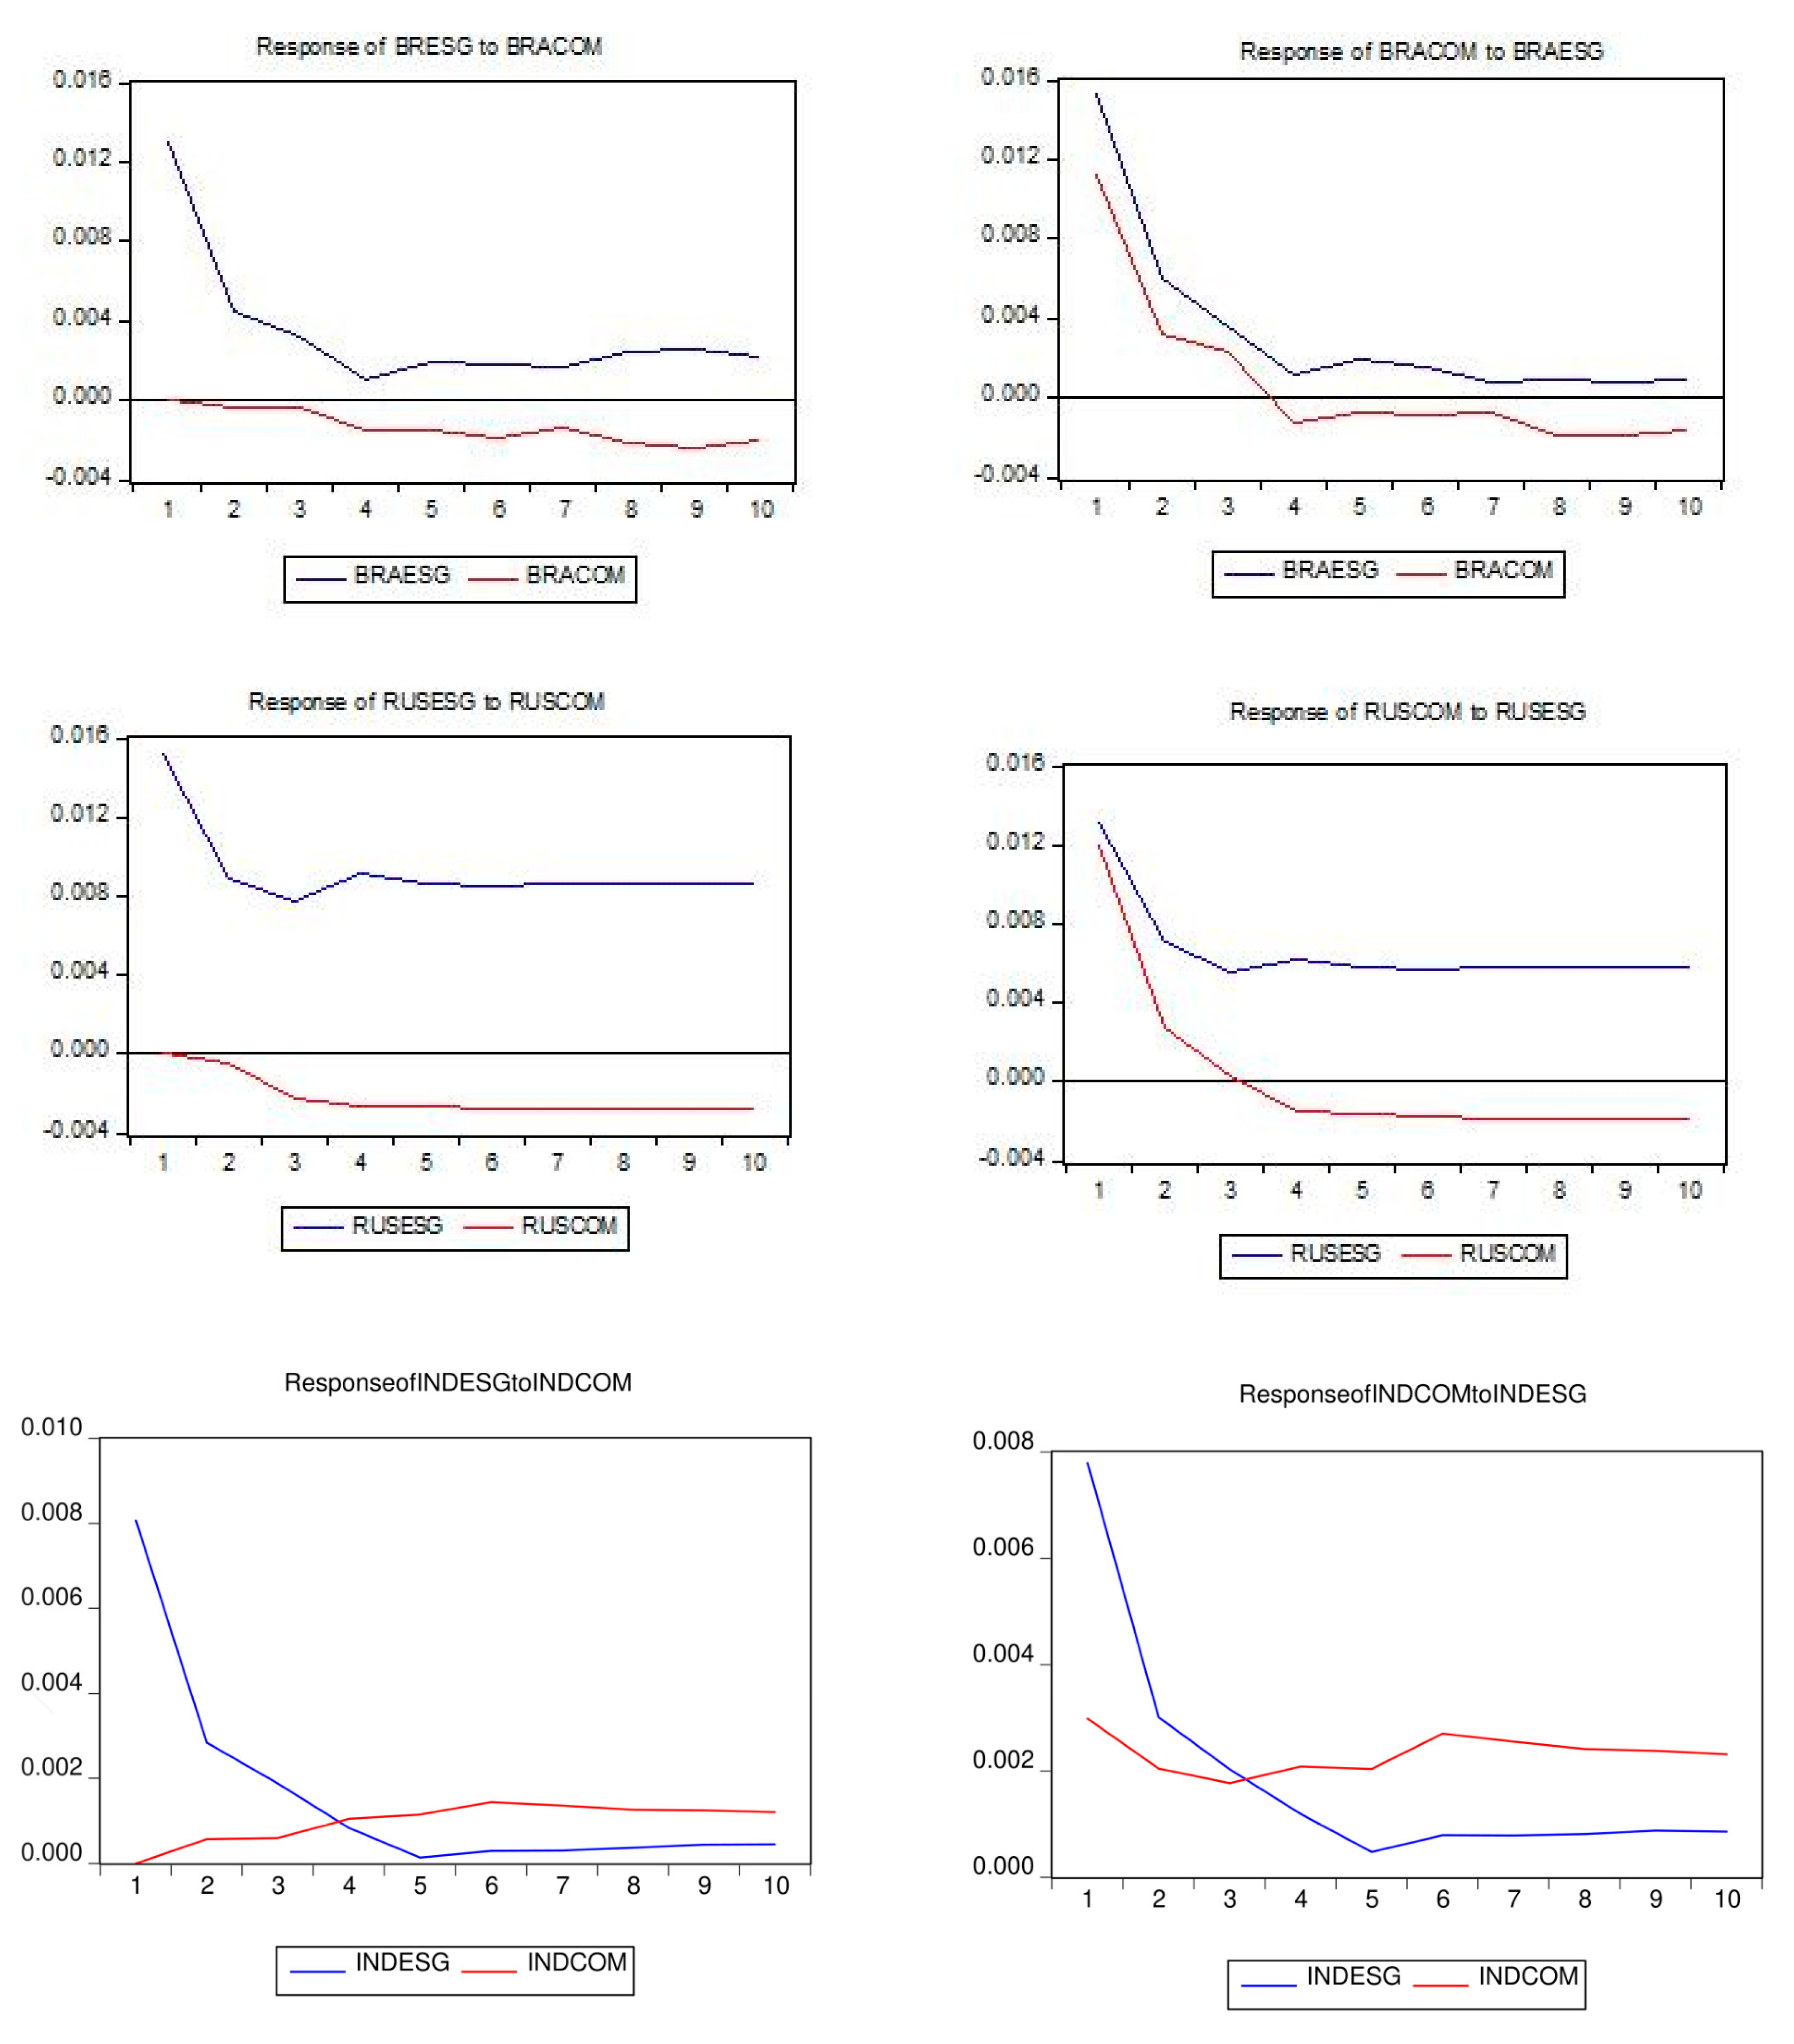
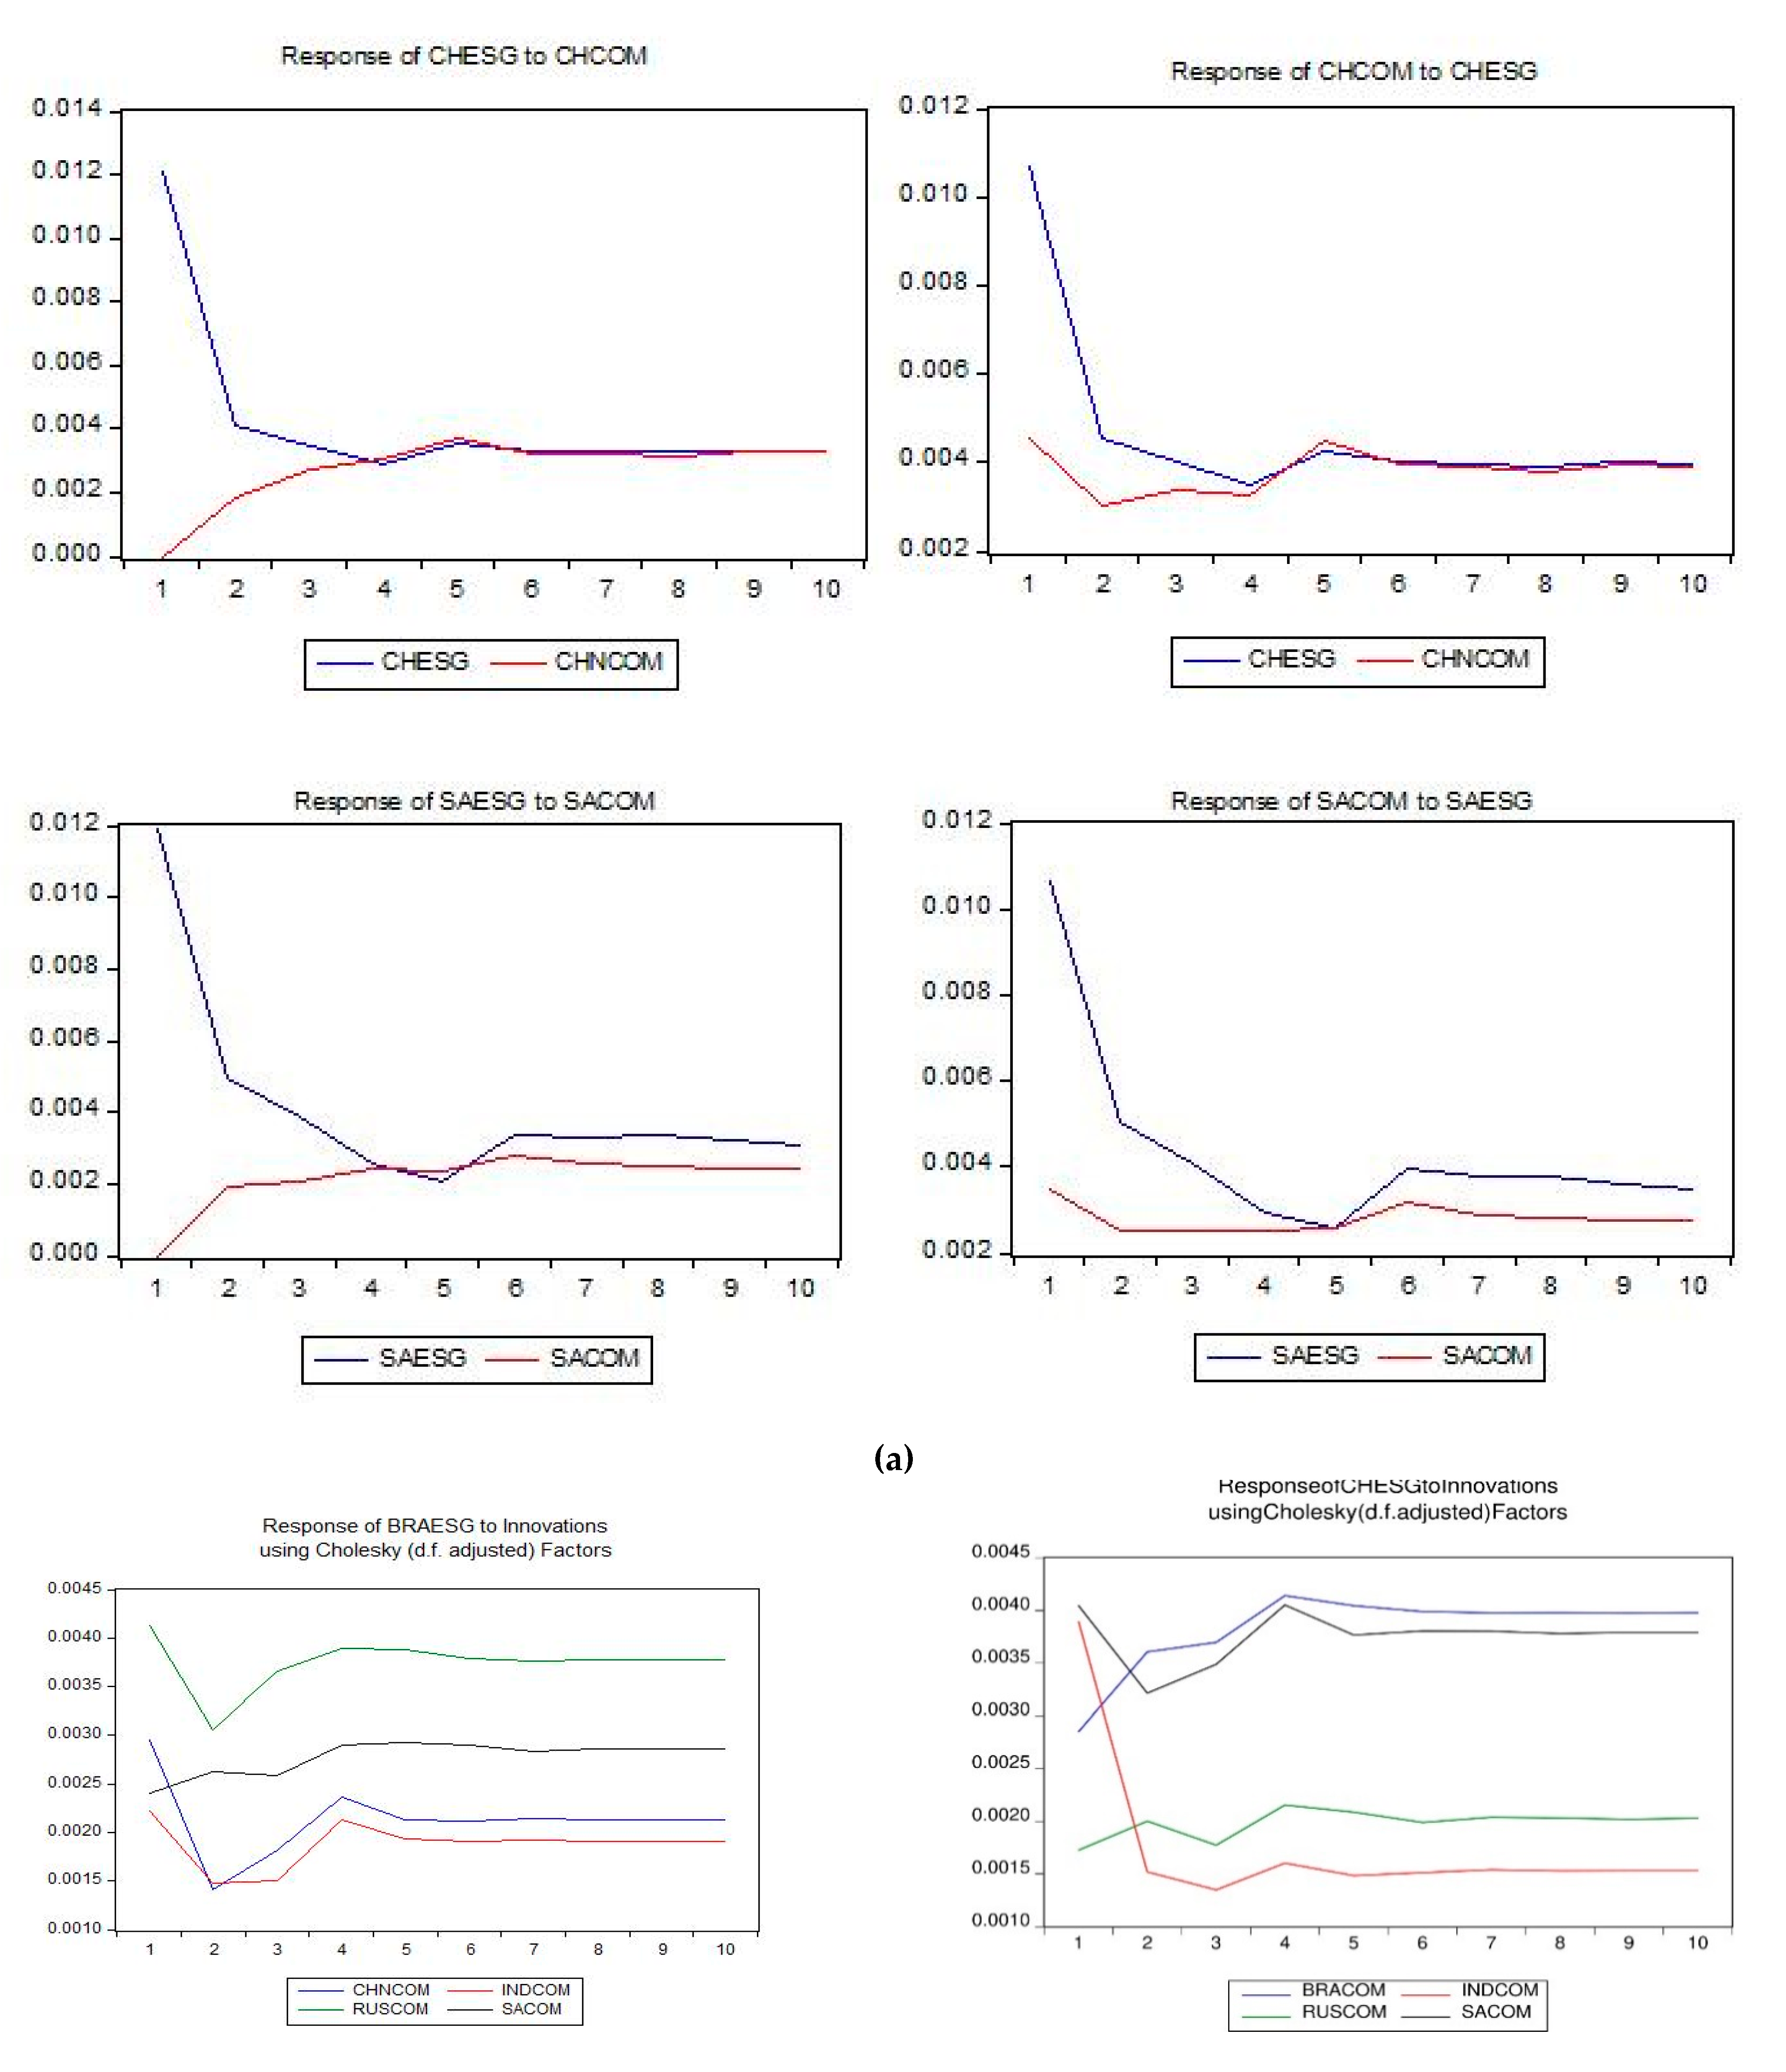
In addition, we conduct an impulse response analysis to examine the effect of innovations on all variables of the MSCI ESG equity returns in the BRICS countries. We look at the impulse responses of the MSCI ESG returns of each country to one standard deviation of innovations to MSCI composite returns of the same country and across countries. In Figure 3a, we illustrate the results of the impulse function response for the MSCI ESG of the individual BRICS countries. The horizontal axis represents the number of impulse response periods, the vertical axis represents the response intensity, and the solid line is the impulse response curve. The first graph in the figure shows the negative response of Brazil MSCI ESG returns from standard shocks stemming from the Brazil MSCI composite returns. When one standard error shock in the conventional index returns affects the non-conventional equity returns in Brazil, the effect is negative, and increasingly so. The maximum response is in period nine when response intensity is −0.0023 and then stabilizes. In Russia, the conventional index returns have a negative effect on the non-conventional returns for 3 periods, and then stabilize in period 10. For the Indian MSCI ESG equity returns, there is an increasing positive response to the standard shocks stemming from conventional returns up to period six; then, there is a decreasing trend until period 10. The China MSCI ESG equity returns show a positive response to the shock of conventional indices in an increasing trend up to five periods, and then stabilizes. Similar results are seen for South Africa MSCI ESG equity returns, which respond positively to standard shocks in conventional equity indices.
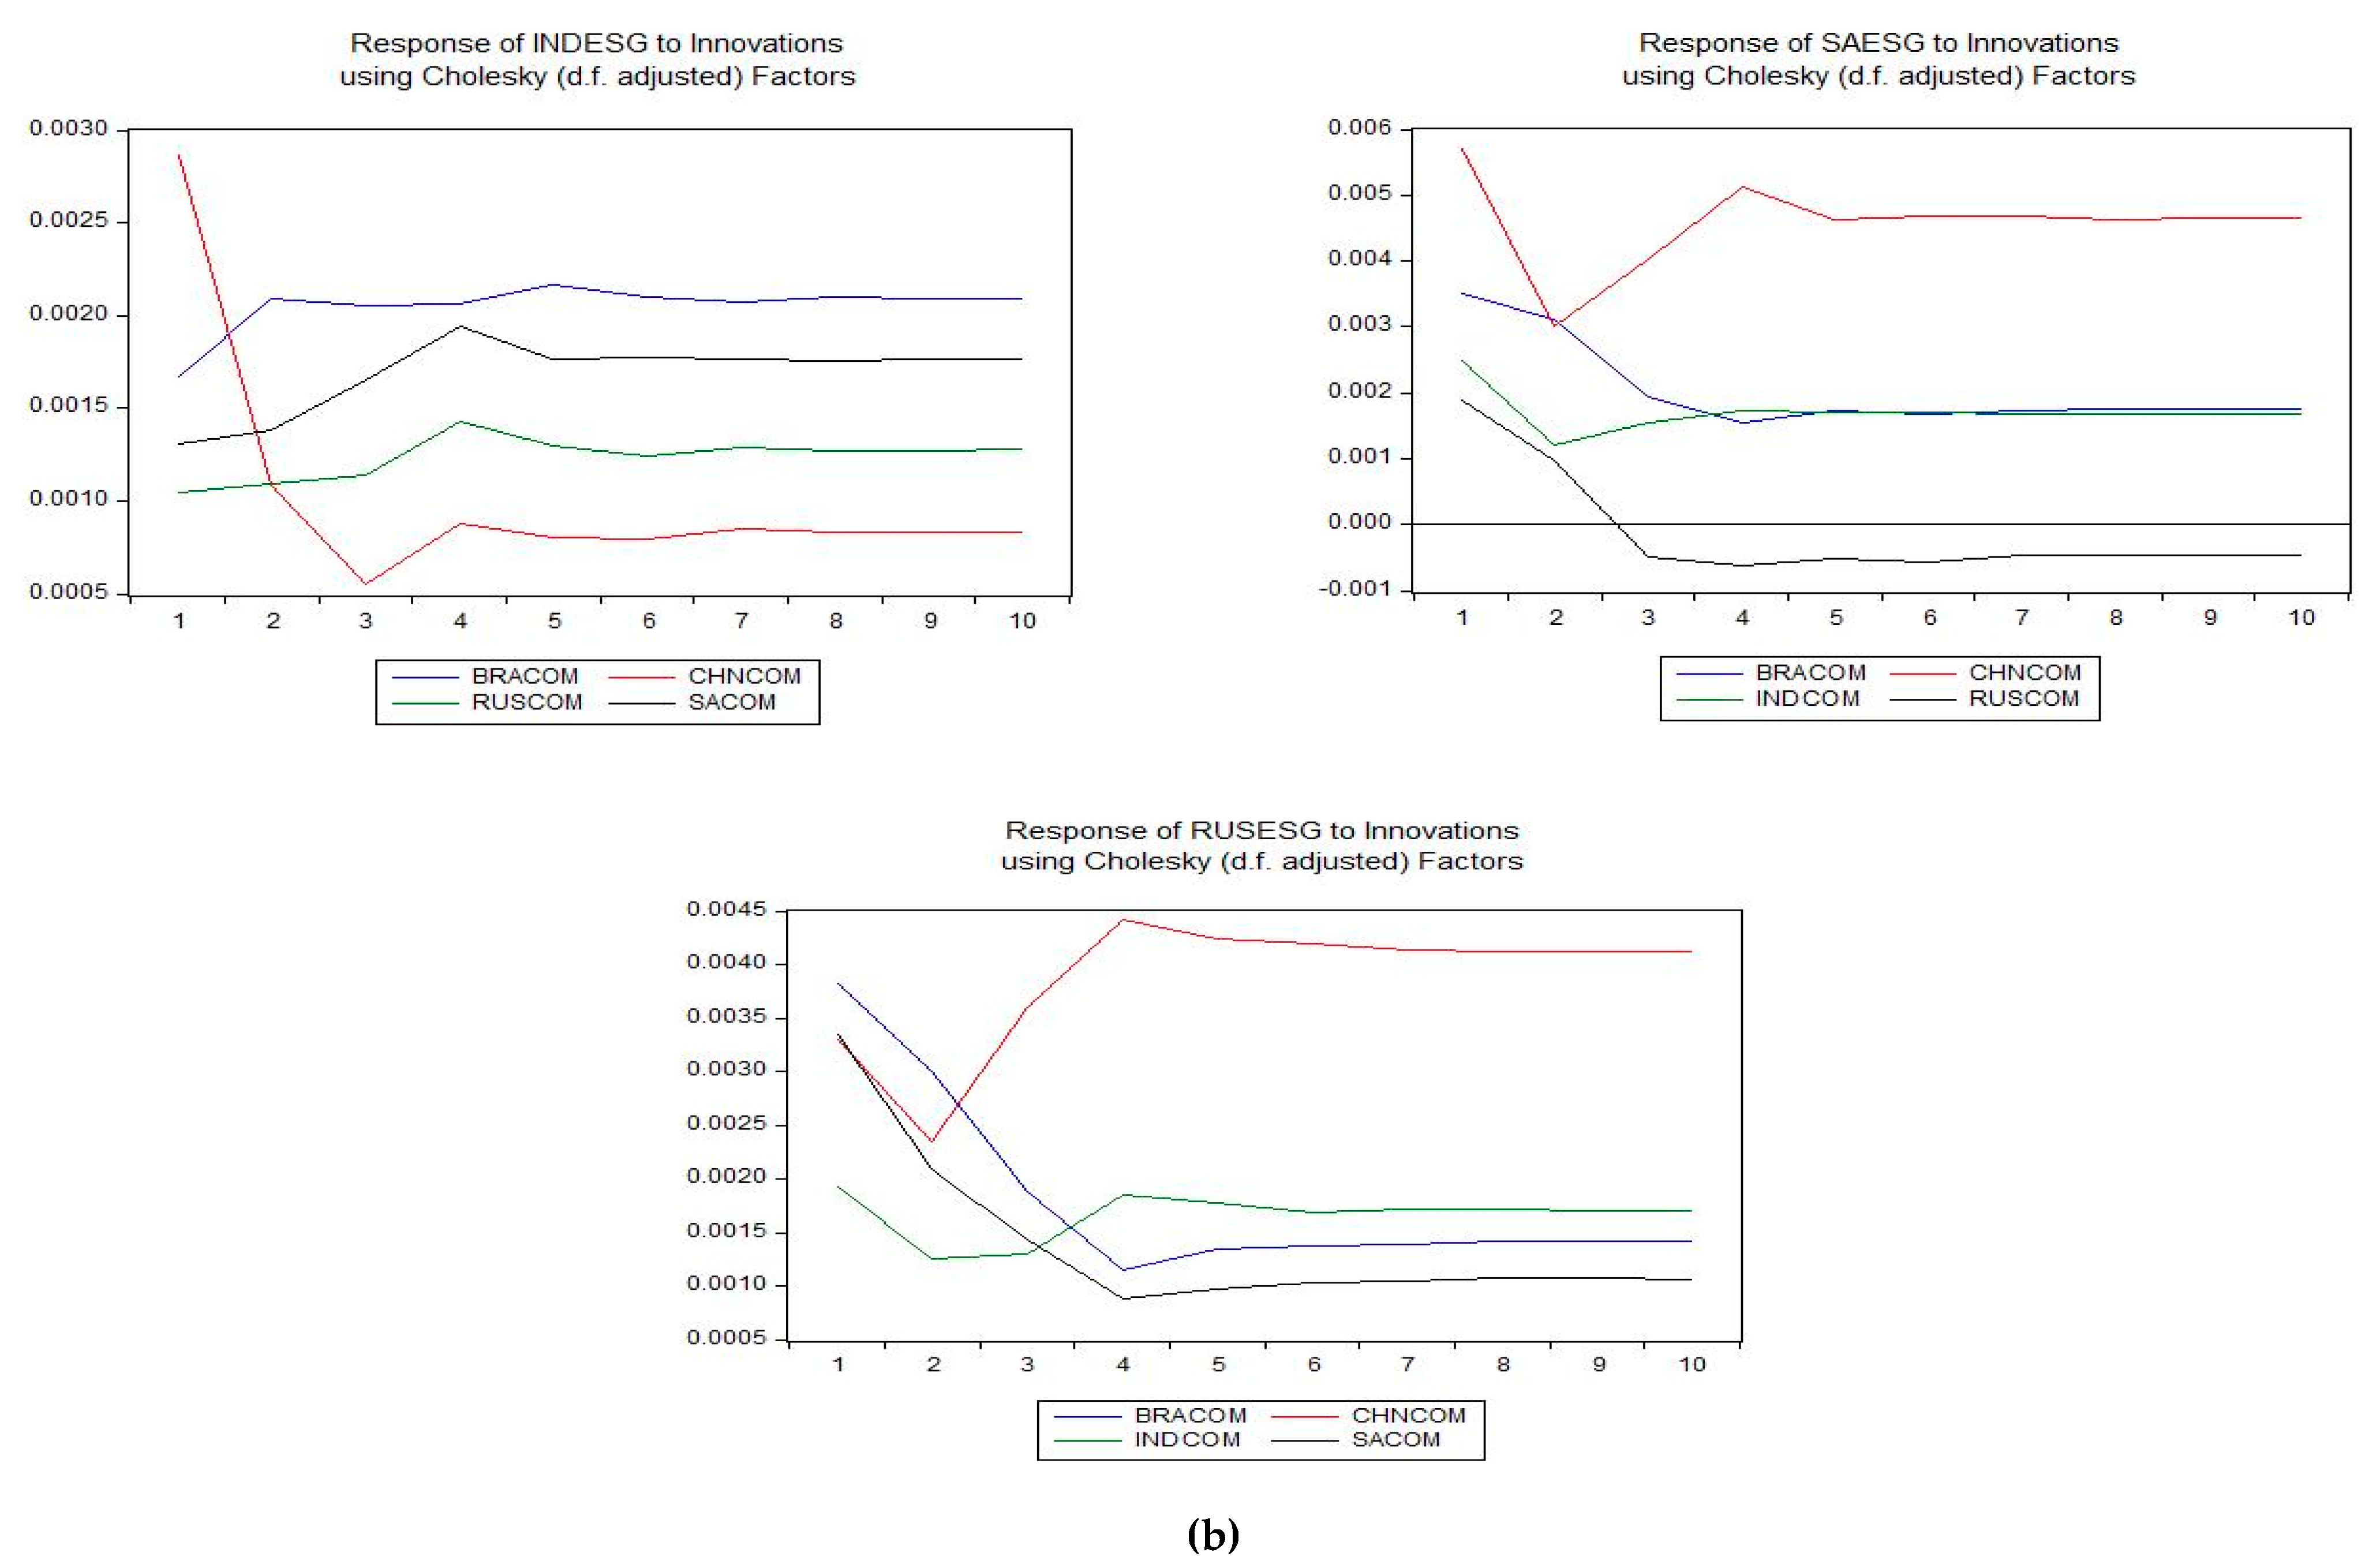
Figure 3b shows our impulse response analysis of MSCI ESG returns of each BRICS country with the MSCI composite returns of all the other countries. For Brazil, there is a positive response in the MSCI ESG returns to the standard shocks in all BRICS conventional indices in period four with an increasing trend. Thereafter, the response of non-conventional equity returns remains positive and stabilizes to external shocks. We find similar results for the China and India MSCI ESG return response to the shocks from the other BRICS conventional market returns. For Russia, the response of the MSCI ESG returns to the standard shock in the conventional index returns of Brazil and South Africa is positive with an increasing trend for two periods; however, the China and India conventional index returns affect the Russia MSCI ESG returns positively with an increasing trend up to four periods. There is a positive response of the South Africa MSCI ESG returns to the standard shocks of China and India conventional returns in period four with an increasing trend. However, the response is negative to the shocks from the Russia conventional market with an increasing trend up to period 4 and then decreasing to period 10 (see Appendix A for more details).

4.4. Variance Decomposition Analysis

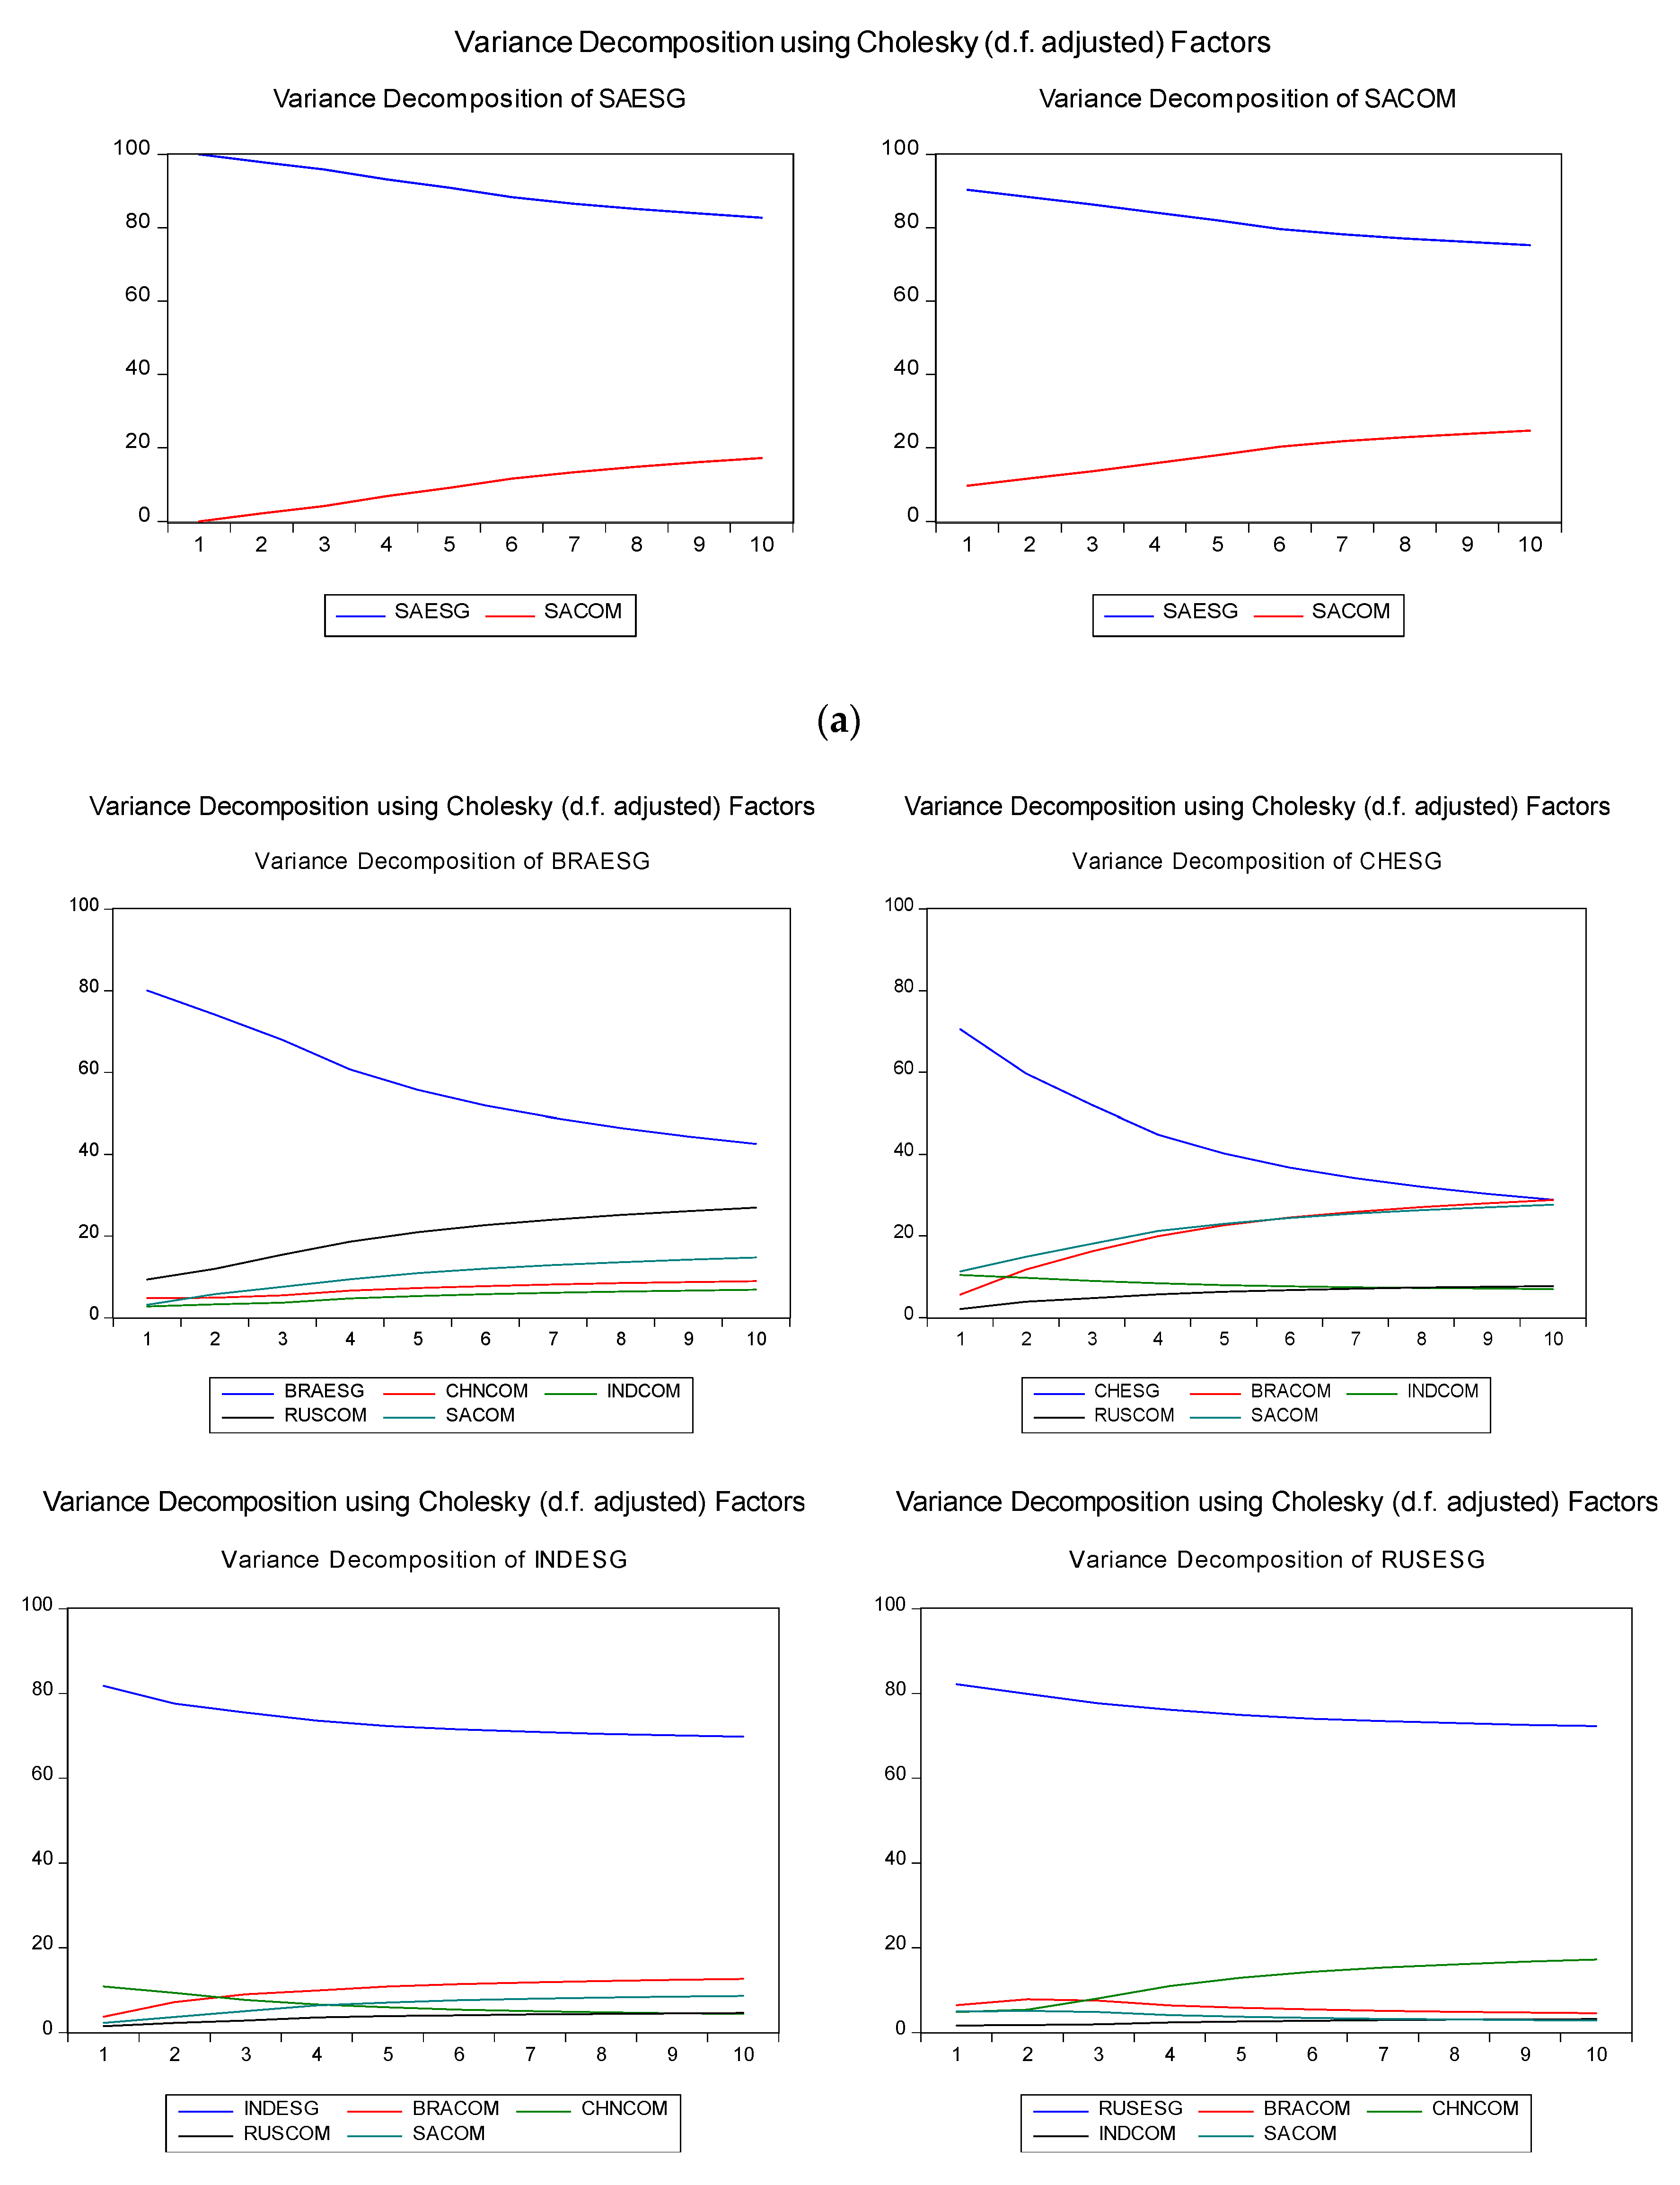
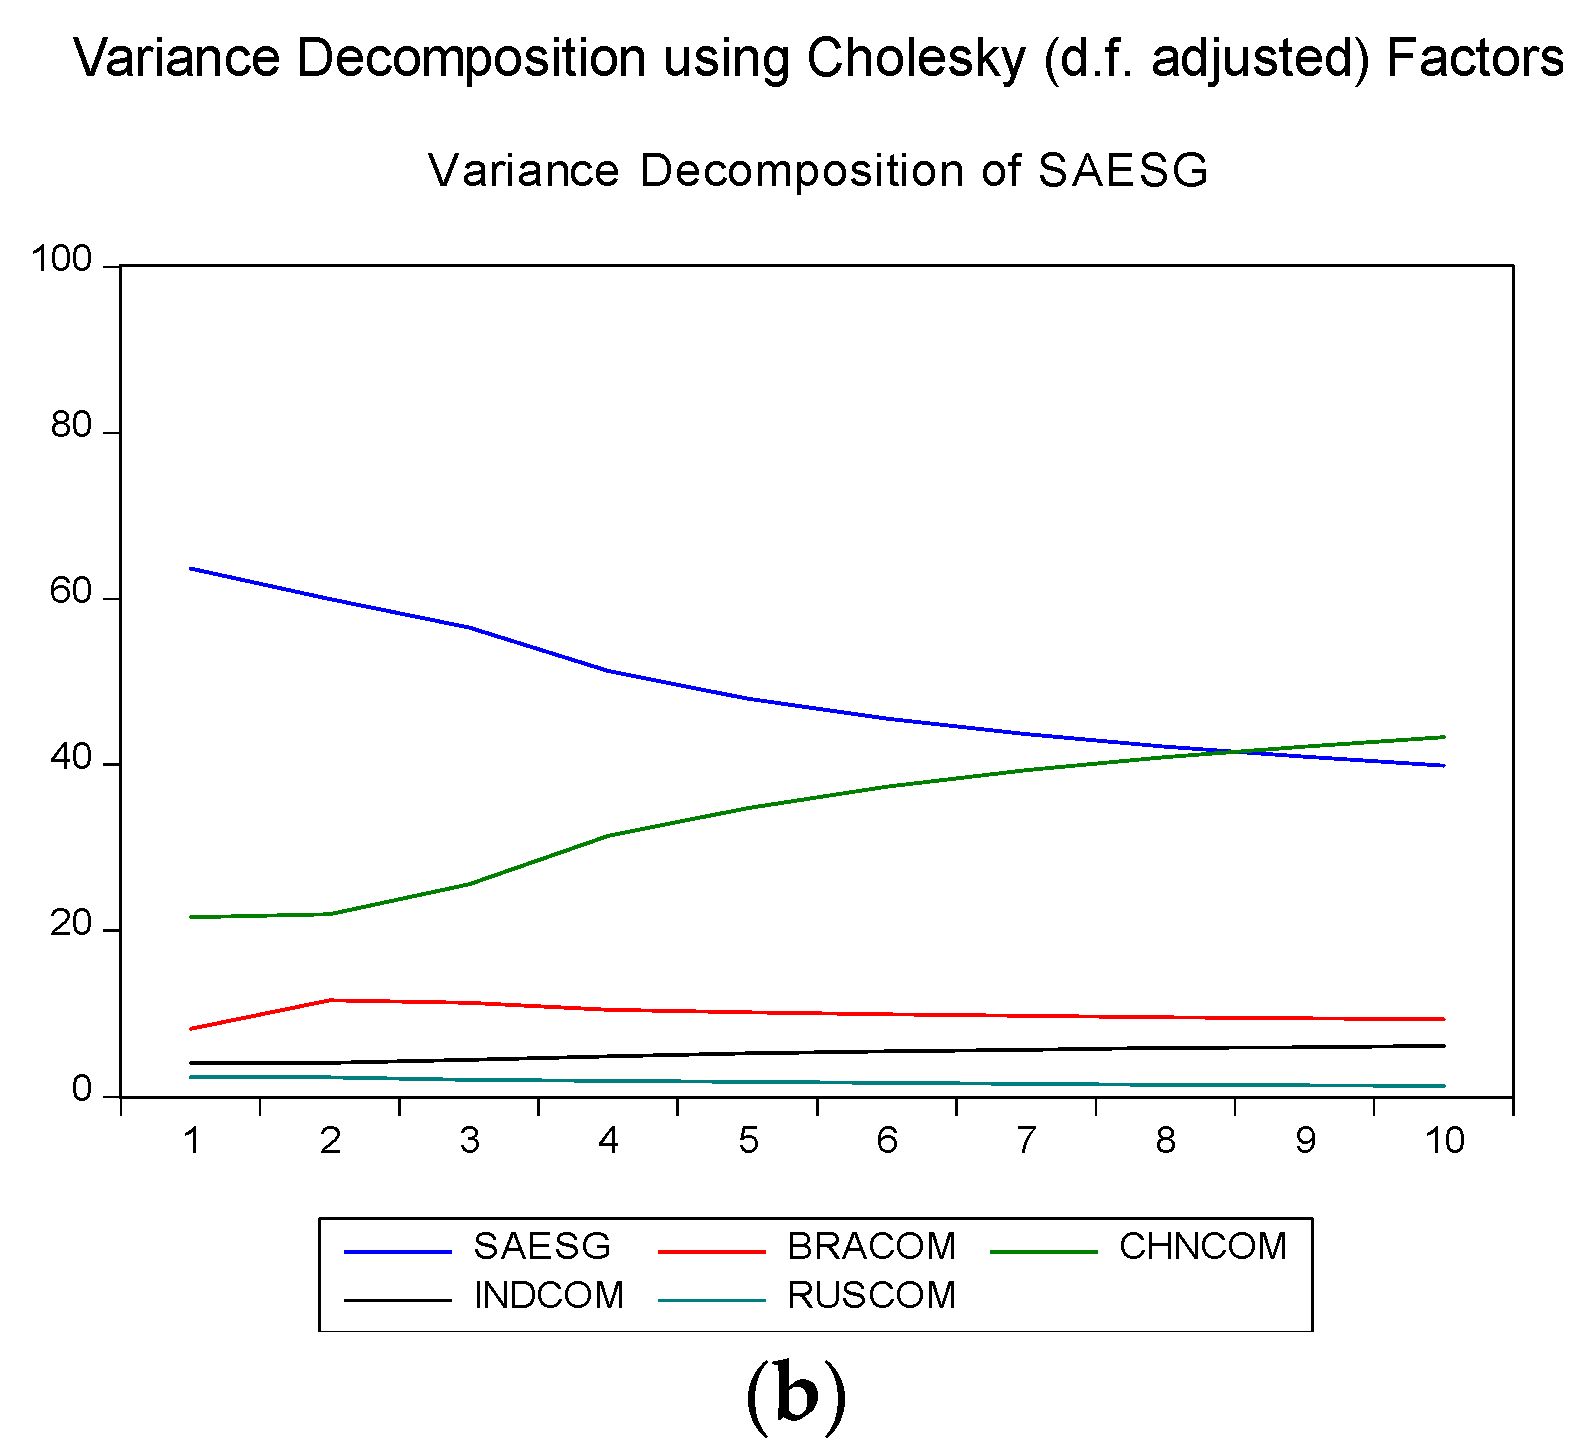
We use variance decomposition analysis to examine the extent of impact of the MSCI composite returns on the MSCI ESG returns in the same country indices and cross-regional indices. First, the effects of the MSCI composite returns on the change in the MSCI ESG returns in the same country are shown in Figure 4a. The trend shows that as time goes by, the impact of the MSCI composite returns on changes in MSCI ESG returns declines in all individual BRICS countries. However, the impact of MSCI composite returns on changes in MSCI ESG returns for all countries has an upward trend. In the case of specific countries, in Brazil, the MSCI composite returns impact on changes in its MSCI ESG returns, as shown in Figure 4b, reveal an upward trend. For India, the Brazil, Russia, and South Africa MSCI composite returns impact on the India MSCI ESG returns shows an upward trend, as well; however, the impact of the China MSCI composite returns shows a downward trend. This is similar in China, where the impact of the India MSCI composite returns shows a downward trend, while all other countries MSCI composite returns show an upward trend. Further, the impact of the Brazil and South Africa MSCI composite returns show a downward trend, while the China and India composite returns show an upward trend on changes in the Russia ESG returns. In South Africa, the impact of the China and India composite returns have an upward trend on changes in its MSCI ESG returns, while the Russia composite returns show a downward trend and the Brazil MSCI composite shows a mixed result. Our findings here suggest that the regional conventional markets play an important role in the development of non-conventional markets in the individual BRICS countries (see Appendix B).

5. Discussion

The environmental, social, and governance equity indices are increasingly popular among investors concerned with sustainable and responsible investment [2]. Firms included on environmental social and governance (ESG) equity indices have to reflect superior sustainability performance and outperform their peers in an in-depth analysis of economics, environment, and social criteria. Based on this, these firms are considered sustainability leaders [12]. Here, we study the newly developed MSCI ESG equity indices in the BRICS countries and examine their integration with their counterpart MSCI composite equity indices in the same countries and across these countries. The unit root diagnostic tests of ADF and PP suggest that all the times-series are stationary at level and at three lags. Further, the Johansen cointegration test confirms long-run integration between the two equity indices in the same country, as well across countries. Moreover, our findings suggest that there is a bi-directional spillover between the MSCI ESG equity indices and the MSCI composite equity indices in the same country, namely the returns of the MSCI ESG indices influence their counterpart composite indices, and vice versa. However, our findings reveal there is no long-run causality between conventional and non-conventional equity indices in the BRICS countries Brazil and Russia, although there is evidence of this in the remaining BRICS countries. Further, there is evidence of short-run causality between MSCI ESG and MSCI composite indices in all BRICS countries. This shows that the non-conventional markets in the BRICS countries are drawing investors, as well as their conventional markets. The short-run and long-run integration of these two indices may also suggest that investors are using the information of one index to predict the behavior of the other.
It is important to investigate the cross-border financial market integration in the case of the BRICS countries, in particular, due to their economic and financial cooperation. Our study finds that there is long-run causality between MSCI ESG equity indices in one country and the MSCI composite indices of all other BRICS countries. This implies that one country’s conventional market flows to the other countries’ non-conventional markets. The impulse response analysis also shows that the Brazil and Russia MSCI ESG equity returns respond negatively to one standard deviation shock in their counterpart composite returns for a prolonged period and then stabilize. However, the China, India, and South Africa MSCI ESG returns respond positively to the shock from the variations in their counterpart composite returns. Moreover, all the individual country’s MSCI ESG returns respond positively to one standard deviation shock from innovations in other countries’ composite returns for the first three to four periods and then stabilize. The variance decomposition analysis assesses the role of each of the BRICS conventional and non-conventional markets on the other’s movement. The results show that all ESG equity markets in the BRICS countries are affected by the ESG markets, as well as their counterpart composite markets. Moreover, these non-conventional markets are also influenced with other country’s conventional markets.
Our findings suggest that the Brazil and Russia conventional and non-conventional markets are comparatively independent with in the same country in long-run; however, across regions there is a long-run causality between their non-conventional and other regions conventional markets. This then provides an opportunity for Brazil and Russia’s local investors to diversify their investments by investing in different markets. Further, there is evidence of integration among all BRICS conventional and non-conventional markets. Our findings align with those of Naidu et al. [69] and Nashier [70], who conclude that the BRICS countries’ stock markets are integrated. However, our study is unique in that is differs from the perspective of conventional and non-conventional markets. Moreover, our study uniquely uses most cointegration models, the Johansen cointegration test, the vector error correction model, the impulse response function, and the variance decomposition analysis to test integration level. Using such multiple measures increased the reliability of our study.
Our findings imply that the importance of socially responsible practices has been increasing in emerging economies, along with investor interest, namely socially responsible equities are as attractive to investors as other equities today. At the same time, our results suggest that investors using ESG indices for diversification will no longer enjoy such benefits based on the stronger integration of the two indices. The BRICS ESG indices show the same stochastic trend as of the composite indices. The integration of Asian ESG indices with regional and cross-continental composite indices implies close economic cooperation and a regional flow of investment without barriers. This also validates the formation of BRICS to further enhance economic cooperation, from a globalization perspective, and the use of ESG criteria in investment and the construction of portfolios. Further, the findings suggest a flow of information between the two different equity indices within and across countries due to market integration.
For investors, it will be easy to adjust their investment strategies by predicting the behavior of one equity index by using information from the other. Financial managers and professionals can obtain more insights regarding their investment decisions and make adjustments in their investment portfolios by considering both types of equity indices from diversification of risk and hedging [40,44]. Additionally, for policymakers, our findings are relevant in responding to increasing financial interactions across borders. Governments can use this information while drafting public policies related to non-conventional financial markets. Further, our findings are valuable in the context of economic and political changes occurring in China and India and how these will affect conventional and non-conventional markets within or across borders both.

6. Conclusions

Our study examines the integration between ESG and composite indices in the BRICS countries. The BRICS composition is unique in that it comprises the three largest emerging economies, as well as one in South America and one in Africa. Further, we widen our scope so that each BRICS country’s ESG indices is examined against counterpart composite indices in that country and against all other BRICS countries. Our results confirm that the ESG indices in the BRICS countries are cointegrated with their composite counterparts and this integration is not limited to country-level composite indices but is also integrated with the other BRICS countries’ composite indices. This implication is that the socially responsible indices of the emerging economies are well integrated with each other’s composite indices. This integration is most substantial in India, China, and South Africa.
The results also depict that the Brazil and Russian conventional and non-conventional markets have no long-run causality between them. However, there is evidence of short-run causality between conventional and non-conventional markets in these countries. Further, the economic and financial cooperation between BRICS countries makes a stronger case to investigate the cross-border financial market integration. The findings show a long-run causality between MSCI ESG equity indices of one country with MSCI composite equity indices of all other BRICS countries. These results suggest that there is a flow of information between conventional and non-conventional markets across countries. Moreover, mixed results are found in case of impulse response analysis, where Brazil and Russia MSCI ESG equity returns respond negatively, and China, India, and South Africa MSCI ESG equity return respond positively to one standard deviation shock in their counterpart composite returns for a prolonged period and then stabilize. However, the results of impulse response analysis across countries show consistent results. All individual country’s MSCI ESG returns respond positively to one standard deviation shock from all other countries’ counterpart indices.
Our results imply that non-conventional equity indices have not been fully developed to the extent that they show sustainable integration with conventional equity indices in the BRICS countries. Therefore, these sustainable or non-conventional equity indices need to be promoted further to become fully integrated in the financial systems in these countries However, as in all studies, ours has some limitations. First, our scope is limited to BRICS countries and the post-crisis period. Further studies should consider other countries and other time periods and the integration of ESG indices with composite indices, as well as the impact of structural breaks on integration. Second, individual behavioral preferences depend on the social and cultural context, so further studies should incorporate the impact of ESG considering the investment context. Future research can investigate investment portfolios based on the traditional index and its ESG counterpart using the 1/N rule, mean-variance framework, and Black-Litterman model, among others. Comparison can be made between these portfolios and a conventional index to gauge the value of ESG in terms of diversification. Measures, such as value-at-risk and the expected shortfall, can be employed to evaluate investment performance.
References

Author Contributions

Conceptualization, R.u.R.; methodology, R.u.R., M.Z.u.A., and M.A.N.; software, R.u.R.; validation, M.H. and M.I.A.; formal analysis, R.u.R. and M.Z.u.A.; investigation, R.u.R. and M.A.N.; resources, M.I.A.; data curation, M.H.; writing—original draft preparation, M.Z.u.A., R.u.R., and R.A.; writing—review and editing, R.u.R., R.A., and S.M.N.; project administration, R.A.; funding acquisition, S.M.N. All authors have read and agreed to the published version of the manuscript.

Funding

The APC was funded by RHB Islamic Endowed Scholar in Finance research grant (vote: 53276). The authors are grateful to RHB Islamic Bank Berhad for the financial support.

Institutional Review Board Statement

Not applicable.

Informed Consent Statement

Not applicable.

Data Availability Statement

Restrictions apply to the availability of these data. Data was obtained from MSCI and Thomson Reuters Datastream and are available at https://www.msci.com and https://eikon.thomsonreuters.com/, respectively, with their permission.

Acknowledgments

We thank the reviewers for their useful comments and suggestions.

Conflicts of Interest

The authors declare no conflict of interest. The funders had no role in the design of the study; in the collection, analyses, or interpretation of data; in the writing of the manuscript, or in the decision to publish the results.

Appendix A

Panel A. Impulse Response Function: Country-Wise.
Response of BRAESGResponse of RUSESGResponse of INDESGResponse of CHESGResponse of SAESG
PeriodBRAESGBRACOMRUSESGRUSCOMINDESGINDCOMCHESGCHNCOMSAESGSACOM
10.0130230.0000000.0151220.0000000.0080620.0000000.0120540.0000000.0118600.000000
20.004437−0.0003160.008866−0.0004380.0028420.0005680.0041280.0018680.0049490.001907
30.003160−0.0004080.007769−0.0022450.0018800.0005950.0034870.0027000.0038900.002057
40.001046−0.0014990.009130−0.0027170.0008380.0010510.0028710.0030370.0025970.002449
50.001943−0.0014700.008669−0.0026370.0001350.0011460.0035040.0036840.0020790.002319
60.001738−0.0018640.008534−0.0027460.0002900.0014410.0033030.0032530.0033960.002751
70.001654−0.0013370.008669−0.0027650.0003030.0013610.0033090.0032310.0033030.002530
80.002438−0.0021920.008638−0.0027480.0003680.0012620.0032730.0031710.0033420.002468
90.002519−0.0023490.008623−0.0027530.0004400.0012430.0033300.0033090.0031850.002418
100.002189−0.0020860.008635−0.0027540.0004490.0012080.0033110.0032630.0030610.002406
Panel B. Impulse Response Function- Cross- Regional
Response of BRAESGResponse of CHESG
PeriodBRAESGCHNCOMINDCOMRUSCOMSACOMCHESGBRACOMINDCOMRUSCOMSACOM
10.0120810.0029510.0022270.0041280.0023980.0101000.0028520.0038920.0017280.004045
20.0041530.0014150.0014770.0030560.0026260.0022300.0036060.0015200.0020030.003214
30.0033530.0018160.0015070.0036560.0025860.0021630.0036970.0013490.0017740.003487
40.0022110.0023710.0021240.0038910.0029000.0022760.0041400.0016030.0021560.004051
50.0025830.0021350.0019310.0038740.0029320.0021590.0040450.0014860.0020870.003766
60.0026110.0021180.0019100.0037870.0028950.0022430.0039890.0015130.0019900.003804
70.0027600.0021410.0019140.0037660.0028380.0023160.0039760.0015410.0020390.003803
80.0027500.0021240.0019110.0037780.0028580.0022990.0039790.0015300.0020320.003780
90.0027510.0021250.0019060.0037810.0028570.0022990.0039760.0015310.0020200.003791
100.0027380.0021290.0019100.0037770.0028550.0022980.0039780.0015320.0020300.003790
Cholesky Ordering: CHNCOM INDCOM RUSCOM SACOM BRAESGCholesky Ordering: BRACOM INDCOM RUSCOM SACOM CHESG
Response of INDESGResponse of RUSESG
PeriodINDESGBRACOMCHNCOMRUSCOMSACOMRUSESGBRACOMCHNCOMINDCOMSACOM
10.0078730.0016710.0028620.0010430.0013080.0136260.0038180.0032960.0019200.003336
20.0039570.0020860.0010870.0010890.0013830.0074540.0030040.0023380.0012470.002093
30.0041920.0020510.0005510.0011420.0016540.0063460.0018780.0036040.0012980.001436
40.0046030.0020640.0008800.0014290.0019370.0075440.0011500.0044150.0018560.000882
50.0043440.0021650.0008040.0012960.0017640.0070230.0013400.0042420.0017810.000975
60.0044170.0020960.0007930.0012450.0017750.0069760.0013680.0041890.0016860.001034
70.0044360.0020760.0008490.0012900.0017680.0071600.0013830.0041340.0017230.001048
80.0044190.0020960.0008340.0012710.0017540.0071180.0014210.0041210.0017120.001068
90.0044260.0020890.0008310.0012670.0017640.0071070.0014210.0041210.0017000.001070
100.0044240.0020890.0008340.0012770.0017630.0071200.0014120.0041240.0017090.001064
Cholesky Ordering: BRACOM CHNCOM RUSCOM SACOM INDESGCholesky Ordering: BRACOM CHNCOM INDCOM SACOM RUSESG
Response of SAESG
PeriodSAESGBRACOMCHNCOMINDCOMRUSCOM
10.0097660.0035030.0056950.0024850.001881
20.0042230.0031080.0030060.0012130.000973
30.0038040.0019290.0040330.001559-0.000488
40.0030770.0015360.0051270.001732-0.000629
50.0029410.0017360.0046390.001695-0.000519
60.0031440.0016900.0046780.001693-0.000564
70.0032100.0017310.0046760.001678-0.000463
80.0032090.0017590.0046280.001681-0.000456
90.0032220.0017480.0046440.001680-0.000475
100.0032100.0017460.0046470.001679-0.000469
Cholesky Ordering: BRACOM CHNCOM INDCOM RUSCOM SAESG

Appendix B. Variance Decomposition Analysis- Cross Regional

Variance Decomposition of BRAESGVariance Decomposition of CHESG
PeriodSEBRAESGCHNCOMINDCOMRUSCOMSACOMSECHESGBRACOMINDCOM
10.01350680.013594.7752352.7186919.3398673.1526130.01202770.528765.62465810.47077
20.01483574.154534.8680913.24482711.985065.7474950.01338959.6797711.792739.737128
30.01603067.889885.4529663.66267415.468057.5264230.01465452.0016616.209228.976628
40.01719160.682996.6431444.71183618.571399.3906370.01614644.8240519.927238.379601
50.01827855.674737.2411825.28409020.9194910.880510.01739240.1751322.585917.952103
60.01928151.866667.7135245.72993522.6574112.032470.01855136.7731424.475017.654536
70.02024548.903118.1153596.09134024.0113012.878890.01965434.1479825.896227.433475
80.02116746.425408.4311656.38766625.1512013.604560.02069232.0430627.060807.253396
90.02205044.337138.6976276.63348226.1166214.215140.02168130.3119928.011817.105997
100.02289842.545628.9298956.84735026.9398214.737310.02262728.8607028.807916.982127
Variance Decomposition of INDESGVariance Decomposition of RUSESG
PeriodSEINDESGBRACOMCHNCOMRUSCOMSACOMSERUSESGBRACOMCHNCOM
10.00870481.811163.68715210.808891.4354562.2573430.01503182.182856.4512644.807598
20.01000277.597427.1425129.3668232.2718673.6213820.01737679.901507.8166545.408499
30.01123375.458438.9969437.6683042.8355515.0407700.01903977.667677.4845618.088667
40.01257773.579199.8701406.6054033.5518486.3934180.02108176.151996.40168810.98351
50.01368272.2629010.844695.9274243.8986217.0663660.02275274.906515.84298212.90584
60.01471171.5167811.409925.4171024.0878797.5683220.02428374.013255.44682114.30613
70.01568270.9396311.793635.0604074.2746867.9316420.02576873.447575.12525115.27880
80.01659070.4797812.134554.7741114.4068458.2047220.02716272.974364.88673816.05309
90.01745270.1168112.397584.5405504.5091258.4359350.02848372.584384.69261716.69151
100.01827469.8110712.614134.3493134.6008268.6246580.02975072.263594.52683717.22277
Variance Decomposition of SAESG
PeriodSESAESGBRACOMCHNCOMINDCOM
10.01223963.667458.19033221.655974.123890
20.01373859.9775611.6187221.974824.052337
30.01502956.5242611.3559625.565684.462602
40.01635251.2910410.4757231.426994.891519
50.01742748.0042710.2147634.754385.252063
60.01848045.583039.91977337.315705.510168
70.01948643.711829.71088439.320015.697732
80.02043442.216119.57144840.886465.857901
90.02134540.969009.44251042.205335.988187
100.02221739.903129.33319943.332986.098450

References

  1. Van Duuren, E.; Plantinga, A.; Scholtens, B. ESG integration and the investment management process: Fundamental investing reinvented. J. Bus. Ethics 2016, 138, 525–533. [Google Scholar] [CrossRef] [Green Version]
  2. Ur Rehman, R.; Zhang, J.; Uppal, J.; Cullinan, C.; Akram, N.M. Are environmental social governance equity indices a better choice for investors? An asian perspective. Bus. Ethics A Eur. Rev. 2016, 25, 440–459. [Google Scholar] [CrossRef]
  3. Efimova, O.V. Integrating sustainability issues into investment decision evaluation. J. Rev. Glob. Econ. 2018, 7, 668–681. [Google Scholar] [CrossRef]
  4. Pagano, M.S.; Sinclair, G.; Yang, T. Understanding ESG ratings and ESG indexes. Res. Handb. Financ. Sustain. 2018, 339. [Google Scholar] [CrossRef]
  5. Amel-Zadeh, A.; Serafeim, G. Why and how investors use ESG information: Evidence from a global survey. Financ. Anal. J. 2018, 74, 87–103. [Google Scholar] [CrossRef] [Green Version]
  6. Jain, M.; Sharma, G.D.; Srivastava, M. Can sustainable investment yield better financial returns: A comparative study of ESG indices and MSCI indices. Risks 2019, 7, 15. [Google Scholar] [CrossRef] [Green Version]
  7. Moskowitz, M. Choosing socially responsible stocks. Bus. Soc. Rev. 1972, 1, 71–75. [Google Scholar]
  8. Escrig-Olmedo, E.; Muñoz-Torres, M.J.; Fernandez-Izquierdo, M.A. Socially responsible investing: Sustainability indices, ESG rating and information provider agencies. Int. J. Sustain. Econ. 2010, 2, 442–461. [Google Scholar] [CrossRef]
  9. Sun, M.; Nagata, K.; Onoda, H. The investigation of the current status of socially responsible investment indices. J. Econ. Int. Financ. 2011, 3, 676–684. [Google Scholar]
  10. Ho, M. Key challenges facing the SRI indices development in China. Soc. Bus. Rev. 2013, 8, 6–17. [Google Scholar] [CrossRef]
  11. Revelli, C.; Viviani, J.L. Financial performance of socially responsible investing (SRI): What have we learned? A meta-analysis. Bus. Ethics A Eur. Rev. 2015, 24, 158–185. [Google Scholar] [CrossRef]
  12. Miralles-Quiros, M.D.M.; Miralles-Quiros, J.L.; Arraiano, I.G. Sustainable development, sustainability leadership and firm valuation: Differences across Europe. Bus. Strategy Environ. 2017, 26, 1014–1028. [Google Scholar] [CrossRef]
  13. Charlo, M.J.; Moya, I.; Muñoz, A.M. Sustainable development and corporate financial performance: A study based on the FTSE4Good IBEX index. Bus. Strategy Environ. 2015, 24, 277–288. [Google Scholar] [CrossRef]
  14. López, M.V.; Garcia, A.; Rodriguez, L. Sustainable development and corporate performance: A study based on the Dow Jones Sustainability Index. J. Bus. Ethics 2007, 75, 285–300. [Google Scholar] [CrossRef]
  15. De Souza Cunha, F.A.F.; Samanez, C.P. Performance analysis of sustainable investments in the Brazilian stock market: A study about the corporate sustainability index (ISE). J. Bus. Ethics 2013, 117, 19–36. [Google Scholar] [CrossRef]
  16. Liern, V.; Méndez-rodríguez, P.; Pérez-gladish, B. A soft computing approach for ranking firms based on experts’ valuation of corporate social responsibility. Appl. Math. Inf. Sci. 2015, 9, 1113. [Google Scholar]
  17. Santis, P.; Albuquerque, A.; Lizarelli, F. Do sustainable companies have a better financial performance? A study on Brazilian public companies. J. Clean. Prod. 2016, 133, 735–745. [Google Scholar] [CrossRef]
  18. Tularam, G.A.; Roca, E.; Wong, V.S. Investigation of socially responsible investment markets (SRI) using dynamic conditional correlation (DCC) method: Implications for diversification. J. Math. Stat. 2010, 6, 385–394. [Google Scholar]
  19. Martínez-Ferrero, J.; Frias-Aceituno, J.V. Relationship between sustainable development and financial performance: International empirical research. Bus. Strategy Environ. 2015, 24, 20–39. [Google Scholar] [CrossRef]
  20. Marti, C.P.; Rovira-val, M.R.; Drescher, L.G. Are firms that contribute to sustainable development better financially? Corp. Soc. Responsib. Environ. Manag. 2015, 22, 305–319. [Google Scholar] [CrossRef] [Green Version]
  21. Ransariya, S.N.; Bhayani, S.J. Relationship between corporate social responsibility and financial performance of RIL. Pac. Bus. Rev. Int. 2015, 7, 66–75. [Google Scholar]
  22. Škare, M.; Golja, T. Corporate social responsibility and corporate financial performance–is there a link? Econ. Res. Ekon. Istraživanja 2012, 1, 215–242. [Google Scholar]
  23. Pollard, J.L.; Sherwood, M.W.; Klobus, R.G. Establishing ESG as risk premia. J. Invest. Manag. 2018, 16, 32–43. [Google Scholar]
  24. Odell, J.; Ali, U. ESG investing in emerging and frontier markets. J. Appl. Corp. Financ. 2016, 28, 96–101. [Google Scholar]
  25. Chan, K.C.; Gup, B.E.; Pan, M.S. International stock market efficiency and integration: A study of eighteen nations. J. Bus. Financ. Account. 1997, 24, 803–813. [Google Scholar] [CrossRef]
  26. Ndikumana, L. Financial Markets and Economic Development in Africa, PERI Working Paper No. 17. 2001.
  27. Büttner, D.; Hayo, B. Determinants of European stock market integration. Econ. Syst. 2011, 35, 574–585. [Google Scholar] [CrossRef] [Green Version]
  28. Bracker, K.; Docking, D.S.; Koch, P.D. Economic determinants of evolution in international stock market integration. J. Empir. Financ. 1999, 6, 1–27. [Google Scholar] [CrossRef]
  29. Ouattara, B.S. Re-examining stock market integration among BRICS countries. Eurasian J. Econ. Financ. 2017, 5, 109–132. [Google Scholar] [CrossRef]
  30. Bekaert, G.; Harvey, C.R. Time-varying world market integration. J. Financ. 1995, 50, 403–444. [Google Scholar] [CrossRef]
  31. Bekaert, G.; Harvey, C.R.; Lumsdaine, R.L. Dating the integration of world equity markets. J. Financ. Econ. 2002, 65, 203–247. [Google Scholar] [CrossRef] [Green Version]
  32. Daugaard, D. Emerging new themes in environmental, social and governance investing: A systematic literature review. Account. Financ. 2019, 60, 1501–1530. [Google Scholar] [CrossRef]
  33. Charlo, M.J.; Moya, I.; Muñoz, A.M. Sustainable development in spanish listed companies: A strategic approach. Corp. Soc. Responsib. Environ. Manag. 2017, 24, 222–234. [Google Scholar] [CrossRef]
  34. Fowler, S.J.; Hope, C. A critical review of sustainable business indices and their impact. J. Bus. Ethics 2007, 76, 243–252. [Google Scholar] [CrossRef]
  35. Mensi, W.; Hammoudeh, S.; Al-Jarrah, I.M.W.; Sensoy, A.; Kang, S.H. Dynamic risk spillovers between gold, oil prices and conventional, sustainability and Islamic equity aggregates and sectors with portfolio implications. Energy Econ. 2017, 67, 454–475. [Google Scholar] [CrossRef]
  36. Schmid, J.; Olaru, M.; Verjel, A.M. The effect of sustainable investments to the economic objectives of the company in relation to the total quality management. Amfiteatru Econ. 2017, 19, 939–950. [Google Scholar]
  37. Managi, S.; Okimoto, T.; Matsuda, A. Do socially responsible investment indexes outperform conventional indexes? Appl. Financ. Econ. 2012, 22, 1511–1527. [Google Scholar] [CrossRef] [Green Version]
  38. De la Torre, O.; Galeana, E.; Aguilasocho, D. The use of the sustainable investment against the broad market one. A first test in the Mexican stock market. Eur. Res. Manag. Bus. Econ. 2016, 22, 117–123. [Google Scholar] [CrossRef] [Green Version]
  39. Talan, G.; Sharma, G.D. Doing well by doing good: A systematic review and research agenda for sustainable investment. Sustainability 2019, 11, 353. [Google Scholar] [CrossRef] [Green Version]
  40. Balcilar, M.; Demirer, R.; Gupta, R. Do sustainable stocks offer diversification benefits for conventional portfolios? An empirical analysis of risk spillovers and dynamic correlations. Sustainability 2017, 9, 1799. [Google Scholar] [CrossRef] [Green Version]
  41. Bianconi, M.; Yoshino, J.A.; De Sousa, M.O.M. BRIC and the us financial crisis: An empirical investigation of stock and bond markets. Emerg. Mark. Rev. 2013, 14, 76–109. [Google Scholar] [CrossRef]
  42. Ortas, E.; Moneva, J.M.; Burritt, R.; Tingey-holyoak, J. Does sustainability investment provide adaptive resilience to ethical investors? Evidence from Spain. J. Bus. Ethics 2014, 124, 297–309. [Google Scholar] [CrossRef]
  43. Park, S.Y.; Jei, S.Y. Estimation and hedging effectiveness of time-varying hedge ratio: Flexible bivariate GARCH approaches. J. Futures Mark. Futures Options Other Deriv. Prod. 2010, 30, 71–99. [Google Scholar] [CrossRef]
  44. Sadorsky, P. Modeling volatility and conditional correlations between socially responsible investments, gold and oil. Econ. Model. 2014, 38, 609–618. [Google Scholar] [CrossRef]
  45. Seo, J.H.; Park, S.Y.; Yu, L. The analysis of the relationships of korean outbound tourism demand: Jeju island and three international destinations. Tour. Manag. 2009, 30, 530–543. [Google Scholar] [CrossRef]
  46. Tse, Y. Price discovery and volatility spillovers in the DJIA index and futures markets. J. Futures Mark. 1999, 19, 911–930. [Google Scholar] [CrossRef]
  47. Alshehhi, A.; Nobanee, H.; Khare, N. The impact of sustainability practices on corporate financial performance: Literature trends and future research potential. Sustainability 2018, 10, 494. [Google Scholar] [CrossRef] [Green Version]
  48. Gallego-Álvarez, I.; García-Sánchez, I.M.; Da Silva Vieira, C. Climate change and financial performance in times of crisis. Bus. Strategy Environ. 2014, 23, 361–374. [Google Scholar] [CrossRef]
  49. Pätäri, S.; Jantunen, A.; Kyläheiko, k.; Sandström, J. Does sustainable development foster value creation? Empirical evidence from the global energy industry. Corp. Soc. Responsib. Environ. Manag. 2012, 19, 317–326. [Google Scholar] [CrossRef]
  50. Giese, G.; Lee, L.-E.; Melas, D.; Nagy, Z.; Nishikawa, L. Foundations of ESG investing: How ESG affects equity valuation, risk, and performance. J. Portf. Manag. 2019, 45, 69–83. [Google Scholar] [CrossRef]
  51. Batista, A.A.D.S.; Francisco, A.C.D. Organizational sustainability practices: A study of the firms listed by the corporate sustainability index. Sustainability 2018, 10, 226. [Google Scholar] [CrossRef] [Green Version]
  52. Antonakakis, N.; Babalos, V.; Kyei, C. Predictability of sustainable investments and the role of uncertainty: Evidence from a non-parametric causality-in-quantiles test. Appl. Econ. 2016, 48, 4655–4665. [Google Scholar] [CrossRef] [Green Version]
  53. Brzeszczyński, J.; Mcintosh, G. Performance of portfolios composed of British SRI stocks. J. Bus. Ethics 2014, 120, 335–362. [Google Scholar] [CrossRef] [Green Version]
  54. Lokuwaduge, C.S.D.S.; Heenetigala, K. Integrating environmental, social and governance (ESG) disclosure for a sustainable development: An Australian study. Bus. Strategy Environ. 2017, 26, 438–450. [Google Scholar] [CrossRef]
  55. Giannarakis, G.; Litinas, N.; Sariannidis, N. Evaluation of corporate social responsibility performance standards. Afr. J. Bus. Manag. 2011, 5, 7367–7374. [Google Scholar]
  56. Stolowy, H.; Paugam, L. The expansion of non-financial reporting: An exploratory study. Account. Bus. Res. 2018, 48, 525–548. [Google Scholar] [CrossRef] [Green Version]
  57. Statman, M. Socially responsible indexes. J. Portf. Manag. 2006, 32, 100–109. [Google Scholar] [CrossRef]
  58. Hsu, C.C.; Tseng, C.P.; Wang, Y.H. Dynamic hedging with futures: A copula-based GARCH model. J. Futures Mark. Futures Options Other Deriv. Prod. 2008, 28, 1095–1116. [Google Scholar] [CrossRef]
  59. Lassala, C.; Apetrei, A.; Sapena, J. Sustainability matter and financial performance of companies. Sustainability 2017, 9, 1498. [Google Scholar] [CrossRef] [Green Version]
  60. Dimitriou, D.; Kenourgios, D.; Simos, T. Global financial crisis and emerging stock market contagion: A multivariate FIAPARCH–DCC approach. Int. Rev. Financ. Anal. 2013, 30, 46–56. [Google Scholar] [CrossRef]
  61. Engle, R.F.; Granger, C.W. Co-integration and error correction: Representation, estimation, and testing. Econom. J. Econom. Soc. 1987, 55, 251–276. [Google Scholar] [CrossRef]
  62. Johansen, S. Statistical analysis of cointegration vectors. J. Econ. Dyn. Control 1988, 12, 231–254. [Google Scholar] [CrossRef]
  63. Abdullah, A.M.; Saiti, B.; Masih, M. The impact of crude oil price on Islamic stocks indices of South East Asian countries: Evidence from MGARCH-DC and wavelet approaches. Borsa Istanb. Rev. 2016, 16, 219–232. [Google Scholar] [CrossRef] [Green Version]
  64. Bellalah, M.; Bellalah, M.; Boussada, H. Modeling transmissions of volatility shocks: Application to CDS spreads during the Euro area sovereign crisis. Int. J. Bus. 2016, 21, 1–25. [Google Scholar]
  65. Huo, R.; Ahmed, A.D. Relationships between chinese stock market and its index futures market: Evaluating the impact of QFII scheme. Res. Int. Bus. Financ. 2018, 44, 135–152. [Google Scholar] [CrossRef]
  66. Sehgal, S.; Ahmad, W.; Deisting, F. An investigation of price discovery and volatility spillovers in India’s foreign exchange market. J. Econ. Stud. 2015, 42, 261–284. [Google Scholar] [CrossRef]
  67. Zivot, E.; Andrews, D.W.K. Further evidence on the great crash, the oil price shock and the unit root hypothesis. J. Bus. Econ. Stat. 1992, 10, 251–270. [Google Scholar]
  68. Granger, C.W. Some recent development in a concept of causality. J. Econom. 1988, 39, 199–211. [Google Scholar] [CrossRef]
  69. Naidu, S.P.N.; Subbarayudu, Y. Co-integration in capital markets of BRICS nations. Asia Pac. J. Res. 2014, 1, 43–54. [Google Scholar]
  70. Nashier, T. Financial integration between brics and developed stock markets. Int. J. Bus. Manag. Invent. 2015, 4, 65–71. [Google Scholar]
Figure 1. Morgan Stanley Capital International (MSCI) returns for Brazil, Russia, India, China, and South Africa (BRICS); (a) MSCI ESG equity returns; (b) MSCI composite returns.
Sustainability 13 00676 g001
Figure 2. Analysis flow chart.
Sustainability 13 00676 g002
Figure 3. Impulse and response function; (a) individual countries; (b) cross-regional.
Sustainability 13 00676 g003aSustainability 13 00676 g003bSustainability 13 00676 g003c
Figure 4. Variance decomposition analysis; (a) individual countries; (b) cross-regional.
Sustainability 13 00676 g004aSustainability 13 00676 g004bSustainability 13 00676 g004c
Table 1. Integration of conventional equity indices with environmental, social, and governance (ESG) indices.
Author [Ref]SamplingModel UsedMajor Findings
Daugaard [32]463 Articles and Books from 1972 to 2017Systematic Literature Review, Citation Links produced in HistCiteThe heterogeneous nature of ESG investing, its costs and motivations, and its management literature origins. Five emerging themes are identified: the human element, climate change, fund flows, fixed income and the rise of non-Western players.
Giese et al. [50]MSCI ESG Ratings data and financial variablesThree transmission channels within a standard discounted cash flow modelChanges in a company’s ESG characteristics may be a useful financial indicator. ESG ratings may also be suitable for integration into policy benchmarks and financial analyses.
Talan and Sharma [39]Journals indexed at the Web of Science during 1989 and 2018. Out of 225 Articles 213 selectedSystematic Literature Review by Coding and CategorizationSustainable investment is a potential solution to social and ecological issues by transforming the financial markets to have more accountability for their impacts.
Alshehhi et al. [47]132 papers from top-tier journals (Scopus and ABDC) 1984 to 2017Content AnalysisLiterature is slowly replacing total sustainability with narrower corporate social responsibility (CSR), which is dominated by the social dimension of sustainability, while encompassing little to nothing of environmental and economic dimensions.
Balcilar et al. [40]DJSI- 1 January 2004–2 September 2015DCC-GARCH and MS-DCC-GARCHSustainable investments can indeed provide diversification gains for conventional stock portfolios globally. A unidirectional volatility transmissions from conventional to sustainable equities. Dynamic correlations are observed between sustainable and conventional stocks, particularly in Europe.
Charlo et al. [33]FTSE4Good IBEX from 2008 till 2013.ANOVA, Mixed ANOVA, Box’s test of equality of variance, Mauchly’s sphericity test, Greenhouse–Geisser’s correctionThe differences between responsible and non-responsible companies in terms of returns are not significant. These results support the thesis that the market does not penalize socially responsible investors.
Lokuwaduge et al. [54]30 Companies of Australian metal and mining sector having highest market capitalizationJanis–Fadner coefficient to check Disclosure Index Association, Pearson chi-square, Fisher’s exact test, Likelihood ratioGiven the diversity in reporting of ESG, comparability of ESG strategic performance is problematic. There is a need of ESG disclosure Index.
Miralles-Quiros et al. [12]DJSI Europe Index, 2001 to 2013,OLS panel data method, Hausman test, fixed or random effect regressionsSustainable development significantly varies across European markets.
Antonakakis et al. [52]DJSI-2002–2014Non-parametric causality-in-quantile approachAggregate economic policy uncertainty (EPU) indicator and some components have predictive ability for real returns of the U.S. sustainable investments index.
De la Torre et al. [38]IPC 2008 to August 2013Standard deviation and Sharpe ratio levels, variance ratio and a one-factor CAPM spanning testsSI strategy in Mexico is as mean-variance efficient as the broad market one, being a good substitute of the latter in the long term. Results also refuted the assumption of a loss of mean–variance efficiency in the sustainable subset due to a lower diversification.
Ur Rehman et al. [2]DJSI, MSCI ESG Asian countries from 2002 to 2014Mean variance analysis, single- and multi-factor models, Sharpe ratios and Jensen’s alphasNo significant differences in the returns or risk-adjusted returns between the ESG indices and the composite indices within countries. Market volatility of the ESG indices is higher than the market volatility of the conventional indices. Market betas of DJSI and ESG equity indices are significantly lower than betas of the composite equity indices. The overall results indicate that the performance of ESG equity indices of many Asian countries is similar to the performance of conventional indices.
Charlo et al. [13]FTSE4Good IBEX from 2008 to 2015Mean Group Analysis, Wilks’ lambda, a chi-squareSocially responsible corporations obtain higher profits for the same level of systematic risk and show greater sensitivity to market changes, leverage levels and company size.
Source: Synthesized by the authors.
Table 2. Descriptive statistics.
MeanSDMinMaxSkewnessKurtosisJarque-BeraProb
BRICS-MSCI ESG INDICES
BRAZIL0.00030.013−0.0880.067−0.0215.155327.300.000
RUSSIA0.000010.0147−0.1000.07750.14816.506871.970.000
INDIA0.00060.0085−0.0560.037−0.4175.300421.800.000
CHINA0.000730.012−0.06400.0537−0.2355.288384.260.000
SOUTH AFRICA0.0005340.0184−0.04500.0617−0.05894.692202.700.000
BRICS-MSCI COMPOSITE INDICES
BRAZIL−0.000320.0204−0.1460.11670.0166.478851.500.000
RUSSIA0.0003430.018−0.120.1450.3579.9723458.950.000
INDIA0.0005270.0087−0.0600.038−0.5335.931684.680.000
CHINA0.0005180.011−0.06400.0600.0066.138693.670.000
SOUTH AFRICA0.000140.011−0.04500.059−0.0924.699205.610.000
Table 3. Unit root: MSCI ESG.
VariablesBRICS-MSCI ESG INDICES
ADF TestPP TestRemarks
Lag(0)Lag(1)Lag(2)Lag(3)Lag(0)Lag(1)Lag(2)Lag(3)
BRAZIL−30.43 ***−22.89 ***−21.52 ***−18.13 ***−30.61 ***−30.35 ***30.56 ***−30.52 ***Stationary
RUSSIA−27.62 ***−22.60 ***−20.25 ***−18.33 ***−27.57 ***−27.60 ***−27.66 ***−27.66 ***Stationary
INDIA−28.26 ***−21.64 ***−20.13 ***−19.15 ***−28.29 ***−28.13 ***−28.37 ***−28.47 ***Stationary
CHINA−31.42 ***−23.19 ***−20.82 ***−18.91 ***−31.57 ***−31.35 ***−31.53 ***−31.60 ***Stationary
SOUTH AFRICA−29.53 ***−22.89 ***−21.43 ***−20.03 ***−29.33 ***−29.46 ***−29.64 ***−29.65 ***Stationary
Note: *, ** and *** significant at 10%, 5%, and 1% level of significance. Augmented Dickey-Fuller (ADF) and Phillips-Perron (PP) significant at the level of ***.
Table 4. Unit root: MSCI Composite.
VariablesBRICS-MSCI COMPOSITE INDICES
ADF TestPP TestRemarks
Lag(0)Lag(1)Lag(2)Lag(3)Lag(0)Lag(1)Lag(2)Lag(3)
BRAZIL−28.09 ***−21.67 ***−20.92 ***−17.56 ***−28.21 ***−27.97 ***−28.24 ***−28.17 ***Stationary
RUSSIA−28.74 ***−23.00 ***−20.50 ***−18.07 ***−28.76 ***−28.70 ***−28.78 ***−28.77 ***Stationary
INDIA−27.59 ***−21.49 ***−19.53 ***−18.73 ***−27.69 ***−27.46 ***−27.65 ***−27.79 ***Stationary
CHINA−29.78 ***−22.08 ***−20.31 ***−18.45 ***−30.05 ***−29.65 ***−29.90 ***−29.98 ***Stationary
SOUTH AFRICA−28.35 ***−22.36 ***−21.05 ***−19.57 ***−28.17 ***−28.28 ***−28.46 ***−28.46 ***Stationary
Note: *, ** and *** significant at 10%, 5%, and 1% level of significance. ADF and PP significant at the level of ***.
Table 5. Unit root: structural breaks.
BRICS-MSCI ESG INDICESBRICS-MSCI COMPOSITE INDICES
Zivot-Andrews TestBreaking PointRemarksZivot-Andrews TestBreaking PointRemarks
T-StatisticsDate T-StatisticsDate
BRAZIL−21.84 ***21 Jan 2016Stationary−21.33 ***21 Jan 2016Stationary
RUSSIA−27.72 ***21 Jan 2016Stationary−29.11 ***17 Dec 2014Stationary
INDIA−21.71 ***20 Feb 2015Stationary−27.74 ***10 Jun 2014Stationary
CHINA−23.31 ***27 May 2015Stationary−22.22 ***27 May 2015Stationary
SOUTH AFRICA−29.70 ***21 Jan 2016Stationary−28.53 ***21 Jan 2016Stationary
Note: One-time break is allowed in both trend and intercept, and lag selection criteria is based on BIC. *, ** and *** significant at 10%, 5%, and 1% level of significance.
Table 6. Cointegration test and lag selection.
Panel A: Country-WiseEigen ValueTrace StatisticsProbFPEAICLag Length
BRAZIL (BRA)0.207391.450.0001.99 × 10−08 *−12.05750 *7
RUSSIA (RUS)0.162298.690.0002.67 × 10−08 *−11.76113 *2
INDIA (IND)0.129233.360.0005.10 × 10−10 *−15.72069 *4
CHINA (CH)0.134243.410.0002.56 × 10−09 *−14.10651 *3
SOUTH AFRICA (SA)0.148269.210.0001.47 × 10−09 *−14.66368 *4
Panel B: Cross-RegionalEigen ValueTrace StatisticsProbFPEAICLag Length
CH/BRA/IND/RUS/SA0.128232.700.0003.83 × 10−20 *−30.52073 *2
IND/BRA/CH/RUS/SA0.130235.600.0003.24 × 10−20 *−30.68544 *2
RUS/BRA/CH/IND/SA0.128232.300.0002.37 × 10−20 *−30.99781 *2
BRA/CH/IND/RUS/SA0.134243.090.0001.60 × 10−20 *−31.39124 *2
SA/BRA/CH/IND/RUS0.127230.060.0003.87 × 10−20 *−30.50833 *2
Note: *, ** and *** significant at 10%, 5%, and 1% level of significance.
Table 7. Regional vector error correction model (VECM).
VariablesBRAESGBRACOMRUSESGRUSCOMINDESGINDCOM
ECTt-10.24 ***(9.25)0.53 ***(14.19)0.17 ***(6.25)0.57 ***(17.85)−1.19 ***(−16.32)−0.99 ***(−13.08)
BRAESG L1−0.86 ***(−18.64)−0.40 ***(−5.89)
L2−0.71 ***(−13.70)−0.46 ***(−6.00)
L3−0.64 ***(−11.73)−0.28 ***(−3.53)
L4−0.47 ***(−8.63)−0.17 **(−2.12)
L5−0.36 ***(−6.82)−0.17 **(−2.35)
L6−0.32 ***(−6.62)−0.18 **(−2.40)
L7−0.12 ***(−2.96)−0.02(−0.36)
BRACOM L10.380 ***(8.40)0.20 ***(3.01)
L20.36 ***(8.20)0.33 ***(5.02)
L30.26 ***(6.00)0.12 *(1.94)
L40.21 ***(5.29)0.13 **(2.29)
L50.15 ***(4.18)0.15 **(2.85)
L60.15 ***(4.35)0.12 **(2.49)
L70.06**(2.05)0.02(0.47)
RUSESG L1 −0.55 ***(−14.09)−0.30 ***(6.59)
L2 −0.24 ***(−6.99)−0.18 ***(4.42)
RUSCOM L1 0.21 ***(5.76)0.08 *(1.94)
L2 0.06 **(2.04)0.06 *(1.91)
INDESG L1 0.36 ***(4.25)0.70 ***(8.03)
L2 0.43 ***(5.19)0.62 ***(7.36)
L3 0.24 ***(3.12)0.39 ***(4.86)
L4 0.12 *(1.73)0.25 ***(3.61)
INDCOM L1 −0.43 ***(−6.11)−0.83 ***(−11.43)
L2 −0.39 ***(−5.36)−0.65 ***(−8.60)
L3 −0.22 ***(−3.11)−0.40 ***(−5.48)
L4 −0.15 **(−2.28)−0.31 ***(−4.68)
R-sq0.330.330.170.300.320.28
Adj-sq0.320.320.160.290.310.27
F-stat55.1355.3667.86142.5587.1471.37
VariablesCHESGCHCOMSAESGSACOM
ECTt-1−1.50 ***(−14.08)−0.75 ***(−7.32)−1.63 ***(−11.24)−0.85 ***(−6.19)
CHESG L10.48 ***(5.12)0.54 ***(5.98)
L20.33 ***(4.14)0.35 ***(4.52)
L30.17 ***(2.86)0.26 ***(4.30)
CHCOM L1−0.84 ***(−9.64)−0.97 ***(−11.52)
L2−0.51 ***(−6.47)−0.57 ***(−7.53)
L3−0.29 ***(−4.60)−0.41 ***(−6.66)
SASESG L1 0.55 ***(4.19)0.63 ***(5.04)
L2 0.47 ***(3.98)0.47 ***(4.23)
L3 0.25**(2.46)0.30 ***(3.11)
L4 0.10(1.34)0.15**(2.02)
SACOM L1 −0.88 ***(−7.08)−1.03 ***(−8.72)
L2 −0.64 ***(−5.62)−0.70 ***(−6.49)
L3 −0.41 ***(−4.07)−0.51 ***(−5.34)
L4 −0.25 ***(−3.15)−0.32 ***(−4.21)
R-sq0.320.240.290.23
Adj-sq0.320.240.280.22
F-stat113.5877.4674.9655.13
Note: *, ** and *** significant at 10%, 5% and 1% level of significance.
Table 8. Cross-regional VECM.
VariablesCHAESGINDESGRUSESGBRAESGSAESG
Cointeq1−0.54 ***(−14.74)−0.06 ***(−7.60)−0.09 ***(−7.04)−0.57 ***(−14.41)−0.34 ***(−10.48)
CHESG L1−0.24 ***(−6.87)
L2−0.08 ***(−3.01)
INDESG L1 −0.435 ***(−16.47)
L2 −0.16 ***(−6.05)
RUSESG L1 −0.36 ***(−13.27)
L2 −0.19 ***(−7.43)
BRAESG L1 −0.08 **(−2.14)
L2 0.03(1.12)
SAESG L1 −0.22 ***(−6.39)
L2 −0.03(−0.99)
CHCOM L1 0.12 ***(4.49)−0.24 ***(−5.57)−0.06 *(−1.88)−0.29 ***(−8.31)
L2 0.02(1.15)−0.08 **(−2.34)−0.03(−1.05)−0.16 ***(−5.19)
INDCOM L10.03(0.83) −0.12 **(−2.51)−0.13 ***(−3.24)−0.14 ***(−3.65)
L20.01(0.36) −0.07 *(−1.71)−0.10**(−2.38)−0.05(−1.36)
RUSCOM L1−0.01(−0.42)−0.02(−1.60) −0.10 ***(−5.10)0.10 ***(5.55)
L2−0.02(−0.93)−0.02(−1.41) −0.05 **(−2.40)0.02(1.12)
BRACOM L1−0.02(−1.37)0.02 *(1.84)0.14 ***(6.77) 0.09 ***(5.93)
L2−0.01(−0.44)0.02 *(1.77)0.07 ***(3.81) 0.05 ***(2.96)
SACOM L1−0.16 ***(−4.49)−0.08 ***(−3.14)0.16 ***(4.12)−0.08 **(−2.34)
L2−0.07 **(−2.22)−0.04 *(−1.73)0.11 ***(2.98)−0.04(−1.31)
R-sq0.320.210.180.280.24
Adj-sq0.320.200.170.270.23
F-stat73.5839.5833.6258.8548.54
Note: *, ** and *** significant at 10%, 5% and 1% level of significance.
Publisher’s Note: MDPI stays neutral with regard to jurisdictional claims in published maps and institutional affiliations.