Abstract
Monitoring of fish passage at hydropower plants largely relies on stow-fyke-net captures installed downstream of turbine outlets, yet little is known about which fish behavior contributes to reduced catch efficiency. We studied fish-net interactions as well as biological and physical factors potentially influencing behavior in three experiments: (i) fall-through experiment, to measure the general physical ability of a fish to fit through a certain mesh size; (ii) net-perception experiment, where fish were filmed while being exposed to different mesh sizes, flow and lure conditions in a controlled arena setup; and (iii) stow-fyke-net experiment, where fish behavior was recorded using 20 cameras simultaneously inside a stow net during regular hydropower fish monitoring. In total, we analyzed 382 h of video recordings. The material revealed that fish interacted with the net on a high rate, independent of flow conditions, and tried to swim through the mesh regardless of whether their body fits through. Under field conditions, the fish showed three specific behavioral patterns, “sneaking,” “dwelling” and “commuting,” which led to a reduced recapture rate in the catch unit of the stow-fyke net. This study highlights the importance of considering fish behavior in future fish monitoring programs to improve the accuracy of turbine-effect assessments on fish.
1. Introduction
In light of the controversy about the pros and cons of hydropower, a variety of monitoring programs have been initiated to examine the effects of conventional and innovative hydropower technologies on fish passage. Examinations of seasonal and diurnal patterns of fish passage [1], assessments of the acceptance of different corridors for downstream passage [2,3], as well as analyses of external and internal injury patterns after passage [4,5,6], all depend on stow-net catches of fish at hydropower facilities. Stow-net-based monitoring at hydropower turbine outlets in small- to medium-sized rivers is considered a gold standard to investigate turbine-related fish injury and bypass efficiency compared to camera- or sonar-based technologies [7,8,9,10].
A well-established approach for fish monitoring at hydropower plants includes the use of a full stow net, which forms the guiding unit, in combination with a fyke net, which is the catch unit. Emptying intervals vary widely, but recent studies point at the necessity of retrieving fish from these nets after rather short (i.e., hourly) intervals to avoid increased mortality and additional injuries [11].
Information on catch efficiency in stow-fyke nets used for hydropower monitoring are scarce [7,11]. Besides the extreme hydraulic conditions at turbine outlets, which challenge the technical installation of stow-fyke nets, the catch efficiency of those can be highly dependent on unique onsite conditions, which determine the technical constraints for installation of the net. Additionally, fish behavior may play a major role in catch efficiency. Both fish behavior as well as net performance are most likely influenced by size, shape and material of the catch device, the amount and composition of floating debris, fish biomass, fish species and size, as well as exposure time [11,12]. Pander et al. [11] studied catch efficiency and fish damage in stow nets combined with different catch units. This study revealed that some stow-fyke nets had a catch efficiency of only 73%. More specifically, catch efficiency of the species Salmo trutta was 55.2% after 1 h and 26.2% after 12 h exposure time. Understanding the reasons of lower than expected catch rates in relation to fish behavior is an important prerequisite in interpreting data from such monitoring, yet remains largely unconsidered.
Most scientific studies on catch efficiency focus on commercial fish catching methods and include analyses of mesh size selectivity of cod ends in trawl gear, and in gillnets. These studies usually use size selection models (mostly logit models) to predict at which body size and shape a fish will be retained by the gear [12,13,14,15,16]. Thus, morphological features of diverse fish species (dead condition) and the change in mesh shape and size during fishing have been investigated to understand under which conditions a fish would fit through the mesh [17,18]. Studies focusing on cod end selectivity are more common in marine science [13,15], while most studies from freshwater focus on gillnets and are conducted in lentic waters [16,18].
It is important to differentiate between the selectivity of the guiding unit and the actual catch unit in a stow-fyke net. Although small mesh sizes provide a higher catch efficiency, they increase the risk of net damage during high loads of debris or under unfavorable hydraulic conditions. Hence, the net is separated into different sections with different mesh sizes. The largest mesh sizes are located at the entrance, i.e., the front of the stow net and then gradually become smaller towards the tail, with the fyke net having the smallest mesh size. Hence, one would assume that fish would more likely escape or enter the net in the guiding unit, which is characterized by visible fiber and larger mesh sizes compared to the catch unit and thus easier to access by the fish. However, the risk of fish swimming through the meshes is typically ignored in studies on fish passage monitoring. The fish are thought to be disorientated after turbine passage and get quickly carried away by the current to net zones with smaller mesh sizes where they no longer fit through [19].
While selection models only allow conclusions on the probability of fish swimming through the net mesh, different kinds of fish behavior have been observed during several stow-net experiments (e.g., [20,21]). These provide evidence that fish display a diverse set of behaviors that lead to them not being caught. For example, individual fish were observed escaping but also entering through the larger meshes of the net (“sneaker fish”) or dwelling at a certain spot of the net that is not the catch unit (“dwellers”). This behavior remained unconsidered in fish-monitoring practices at hydropower plants to date. Yet, if such behavior frequently occurs, it is possible that it results in a bias towards underrepresentation of fish in the catch that passed the turbine with no or little injuries that are in turn more likely to escape from the net. The opposite, an underestimation of turbine effects in the total catch, can occur in the case of healthy fish entering the net from outside. These examples illustrate the importance of understanding fish behavior in stow nets and its role in catch efficiency and turbine related fish injury estimations.
In this study, the fish behavior and catch efficiency of stow-fyke nets were examined in relation to a fish’s natural morphology (“fall-through experiment”), its willingness to approach and swim through fish nets (“net-perception experiment”) and its overall movement profile in stow nets during standardized sampling conditions at a hydropower facility (“stow-fyke-net experiment”). Brown trout of different sizes were used as model species. It was hypothesized that: (i) brown trout interact with the net on a voluntarily basis by trying to swim through; (ii) larger brown trout differ in their behavior from smaller brown trout corresponding to their greater ability for sustained and burst swimming; and (iii) catch efficiency is reduced when individuals show specific behavioral patterns, which prevent the fish from getting trapped in the fyke net (e.g., sneaking).
2. Materials and Methods
All experimental setups and fish handling in this study followed national standards [22] and laws as well as European guidelines [23] for the use of aquatic animals for experimental purposes and were carried out under the official animal care permit number 55.2-1-54-2532-24-2015 (permit agency: Bavarian government/Regierung von Oberbayern).
The study involved a stepwise approach comprising three separate experiments. In the first experiment, we tested how physical features determine the ability of a fish to swim through a certain mesh size (“fall-through experiment” adopted from Herrmann et al. [17]). In the second experiment, we tested the net perception of fish and the influence of abiotic (flow velocity) and biotic factors (lure effect through conspecifics) on the frequency of brown trout swimming through the net (“net-perception experiment”). Finally, the third experiment investigated brown trout behavior in stow nets under realistic field conditions during fish monitoring at hydropower plants (“stow-net and fyke-net experiment”).
2.1. Study Sites and Model Fish Tested
The experiments were conducted between April and August 2019 at the Aquatic Systems Biology Unit of the Technical University Munich (48°23′39.7″ N 11°43′25.4″ E) and at the hydropower facility Höllthal Mühle, river Alz (47°58′40.9″ N 12°30′09.9″ E) in Germany.
Brown trout was selected as test species due to its wide distribution range, its ecological relevance as a target species for restoration in European streams and foremost for its role as model species in regular fish monitoring at hydropower plants [11,24,25]. Therein the species represents rheophilic fish with streamlined fusiform body shapes [11]. We used hatchery-reared brown trout (Salmo trutta fario L.; Fisheries Association Hatchery Mauka, Neufahrn, Germany) of three age classes 0+ (TL: 3–10 cm, mean 4.7 cm), 1+ (TL: 11–20 cm, mean 15.8 cm) and 2+ (TL: 21–30 cm, mean 25.6 cm) originating from the same batch. Each individual participated only once in an experiment to avoid bias by possible learning behavior. The brown trout were held in ponds and not fed three days prior to and during experiments to reduce stress levels and to standardize the motivational state of the fish [25].
2.2. Experimental Setups
2.2.1. Fall-Through Experiment
The fall-through experiment uses gravity to test whether or not a fish is physically able to fit through a mesh template in air [17,26]. This way, a selection curve can be generated to assess the physical probability of fish fitting through a net of specific mesh size. Prior to the test, all fish were anaesthetized by dissolved tricaine mesylate (MS-222) following the official directive on the protection of animals used for scientific purposes [23]. We tested 600 hatchery-reared brown trout of three age classes (50 fish per template) on four different templates of 10 mm, 15 mm, 20 mm and 30 mm mesh size. The number of fish used were calculated following the international recommendations NC3R [23] to reduce the number of fish deemed necessary, still obtaining scientifically valid results. The templates were made of stretched net (green knotless nylon, diamond shaped, Engel-Netze GmbH & Co. KG, Bremerhaven, Germany) on a frame (40 × 30 cm) with a setting factor of 50% mesh opening (Table 1).

Table 1.
Net properties used in the fall-through experiment. All nets were of green knotless nylon, diamond shaped, and set to 50% mesh opening.
The properties (net type, cord diameter and mesh size) of the nets used were the same as those during the net-perception experiment and the stow-fyke-net experiment to allow direct comparability. The net template was positioned horizontally over a bucket filled with water. The fish were dropped head down from a distance of ca. 3 cm onto the net templates in air. The outcome of each tested fish was documented as either “successful” (the fish fell through the net into the bucket) or “unsuccessful” (the fish did not fall through the net).
2.2.2. Net-Perception Experiment
The arena for studying net perception and the number of fish voluntarily swimming through the net under controlled conditions was set up in a concrete channel (1100 cm × 160 cm × 40 cm) at the Aquatic Systems Biology Unit (Figure 1A). An overflow basin supplied the channel with fresh water from the nearby river Moosach. The water level in the channel was held constant at 38 cm and an even flow pattern was maintained by using perforated bricks. Flow velocity was adjusted by providing additional water into the overflow basin using Easy-Mix pumps (Heide Pumpen GmbH, Easy-mix U20W/F32T8). A camera (GoPro Hero 7 Black, GoPro Inc., San Mateo, CA, USA; settings: 1080 resolution, 30 frames per second, wide angle and active stabilizer) was placed on a wooden construction two meters above the arena. A pavilion (3 × 3 m, white folding pavilion with side parts) was placed above the setup to minimize external disturbances during the experiment. The arena and the acclimatization area were bounded by nets with 4 mm mesh size to maintain flow while making it physically impossible for fish to escape. The size of the arena was adjusted according to the three age classes of fish to avoid crowding and stress [27]. The detailed calculations and dimension of the arena are provided in the Appendix A in Figure A1. All nets (green knotless nylon, diamond shaped, Engel-Netze GmbH & Co. KG, Bremerhaven, Germany) used in this setup were attached to wooden frames (boundary nets = 160 × 30 cm; test nets = 200 × 30 cm) with a setting factor of 50% mesh opening. The respective net to test fish perception and fish-net interaction was placed diagonally in the middle of the arena, according to the angle the fish would encounter a stow-net wall in the field during fish monitoring (Figure 1A). We used the results of the fall-through experiment to only test mesh sizes on fish that can physically fit through the net to effectively reduce the amount of test fish needed. Hence, size 0+ brown trout were tested with three mesh sizes (15, 20 and 30 mm), 1+ brown trout encountered two mesh sizes (20 and 30 mm) and 2+ were exposed to the net with 30 mm mesh size. Further, we used three treatments to test if different environmental conditions had an influence on net perception and net interaction of fish. For treatment one, 15 fish were exposed to a given mesh size under stagnant water conditions (reference, flow velocity <1 cm·s−1). In the second treatment, 15 fish were exposed to a given mesh size at a flow velocity of 9 cm·s−1. During the third treatment, 10 fish were exposed to a given mesh size at a flow velocity of 9 cm·s−1 and a lure factor. For the lure, we used five conspecifics, which were placed on the other side of the test net. Each combination of fish size, mesh size and treatment was replicated three times. Table 2 gives an overview of the combination of age class, mesh size and how many fish were used per treatment.
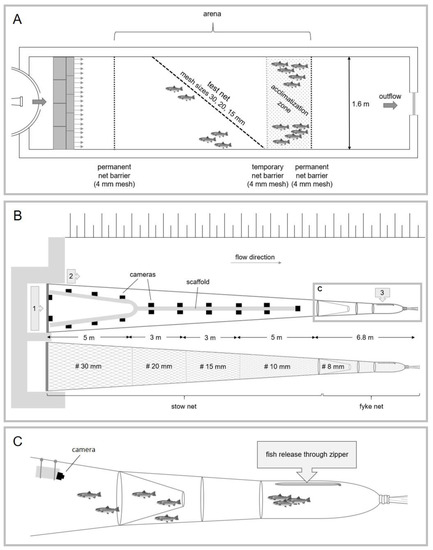
Figure 1.
Schematic of the three experimental setups. Setup (A) shows the concrete channel with the arena to test the willingness of fish to swim through the test net. Setup (B) represents the Y-shaped scaffold with mounted cameras on position while recording fish movements inside the stow net; 1 and 2 represent positions of fish release. Setup (C) shows the position of the camera and the point of fish release (3 in setup B) for the fyke-net experiment.
Table 2.
Details on the net-perception experiment including an overview of material and fish used. Information on the size per age class include the size range, the arithmetic mean and standard deviation (AM ± SD).
Before each round, brown trout of one age class (for treatment 1/treatment 2 = 15 individuals, treatment 3 = 10 individuals) were placed in the acclimatization area (Figure 1A) and left for 10 min. Afterwards, the camera recording was started and the net separating the fish from the arena was carefully removed. For treatment 3, five brown trout were additionally placed in the upper part of the arena to act as lure for their conspecifics. After 1 h, which is recommended for emptying intervals of nets in hydropower monitoring [11], exposure was terminated. At the end of each run, the remaining fish in the tailwater were given a stimulus to encourage swimming through the net. For this, a landing net was swiped gently from the right to the left corner at the lower border of the arena for 30 sec. Afterwards, the recording was stopped and all fish were retrieved and measured to the nearest mm. Recordings were saved on hard drives in MP4 format. The experiment was repeated three times per mesh size and age class always using new fish with no net-exposure experience. Abiotic factors (oxygen, pH, temperature, conductivity and flow velocity) were measured before each run at nine reference points within the arena. Measures were taken in the water column 10 cm above the channel bottom (Appendix A, Figure A2).
2.2.3. Stow-Fyke-Net Experiment
To investigate brown trout behavior in stow nets under realistic field conditions, we filmed the inside of a stow-fyke net during fish monitoring at the hydropower plant Höllthal Mühle (river Alz, 47°58′40.9″ N 12°30′09.9″ E) in Germany. For this, two identical stow-fyke nets (green knotless nylon, diamond shaped, Engel-Netze GmbH & Co. KG, Bremerhaven, Germany; for gear specification see [11]) were attached to metal frames and installed in front of the turbine outlet covering 100% of the turbine outflow. The stow nets had a rectangular opening of 403 × 351 cm becoming narrower over a length of 16 m. The net ended at a metal ring of 65 cm diameter, to which the fyke net was subsequently attached. The mesh size distribution is illustrated in Figure 1B. The attached fyke net was 6.8 m long and had a mesh size of 8 mm. It had a funnel-shaped throat at the entrance and, could be closed with a rope at its end (cod end). In addition, the cod end had an integrated zipper, which can be used to remove floating debris. The experiment was conducted during regular plant operation. Electrofishing and pre-test catches with the stow-fyke net prior to the experiment revealed that only few brown trout were present in the sampled river section. Furthermore, these could be distinguished from the hatchery-reared test fish based on differences in body and fin shape as well as coloration. Influence of naturally occurring brown trout on the experiment was thus considered negligible.
For the first part of the experiment, 19 cameras (GoPro Hero 7 Black, GoPro Inc., San Mateo, CA, USA; 1080 resolution, 30 frames per second, wide angle and active stabilizer) were submerged in 20 cm water depth and evenly distributed in the orthographic left stow-fyke net. The cameras were placed two meters apart (to avoid image overlap) on a Y-shaped scaffold of commercially available drainage pipes (Ø 75 mm) filled with floating foam (Figure 1B). The device could be placed and retrieved from the net by hand. Each camera was assigned to a specific position indicated by a unique number. The view direction of 16 cameras was set towards the lateral net wall. The distance between camera and net ranged from 50 to 150 cm. Two additional cameras were placed at the front opening of the stow net at the metal frame. Both cameras were set to film straight into the net. Another camera was placed at the end of the scaffold to film the entrance to the fyke-net throat. Prior to the experiment, all cameras were synchronized.
Fish were released in front of the stow net (position 1, Figure 1B) and on the left outer side of the stow net (position 2, Figure 1B). For the latter, fish were marked with a fin clip at their upper lobe of the tail fin to be able to distinguish the fish released at the different positions later in the catch and possibly on the video recordings. The fish released at position 2 were used to test if fish also enter the net from the outside. The number of fish corresponds to the standards of fish tests at hydropower plants [11]. For each of the three age classes, 50 specimens were released at each of the two positions (Figure 1B, pos. 1 and 2). The experiment was carried out 10 times, four times in the evening and three times in the morning and at noon, respectively. In total, 3000 fish (1500 per position) were tested. Prior to their release, fish were randomly selected and held in separate oxygenated tanks for ten minutes to acclimate.
After starting all cameras and placing the gear (camera scaffold) in the net, fifty unmarked fish of each age class were released at position A into the net and fifty marked fish were released at position B, outside the net. Time of camera start, the time the gear being on position in the net, time of fish release as well as river and weather conditions were recorded during each run. After one hour of exposure time, fish were retrieved from the cod end and we measured their total length to the nearest mm. The gear was retrieved and recorded material saved on hard drives in MP4 format. For each run, new fish with no net-exposure experience were used.
In the second part of the experiment, the behavior of fish in the fyke net was observed to evaluate if the fish are able to escape the catch mechanism of the fyke-net throat. For this purpose, one action camera (GoPro Hero 7 Black, GoPro Inc., San Mateo, CA, USA; settings: 1080 resolution, 30 frames per second, wide angle and active stabilizer) was installed 30 cm in front of the connection ring between the stow- and fyke net, where the funnel-shaped throat starts. The camera was attached to a plastic pipe with view direction towards the fyke net as shown in Figure 1C. Ring diameter of the fyke net decreases from 65 cm to 60 and 55 cm over a length of 608 cm. The funnel-shaped throat of the fyke net was 105 cm long and starts at the first ring (diameter: 65 cm). It had a diameter of 40 cm at its entrance to the cod end. The visual range of the camera reached 150 cm and covered the full range of the throat. After the camera recording was started, 50 brown trout of age class 2+ were directly released into the cod end of the fyke net through the zipper opening (position C). After an exposure time of one hour fish were retrieved from the cod end and total length of each specimen was measured to the nearest mm. The generated videos were saved on hard drives in MP4 format. The experiment was repeated 10 times always using new fish with no previous net-exposure experience. To prevent occurrence of escaped fish from one run in the subsequent one, the cod end remained open for at least 30 min between the experiments to allow any remaining fish to escape. We additionally checked the net for remaining fish before each run.
2.3. Data Analysis
2.3.1. Fall-Through Experiment
The results of the fall-through experiment were used to model a logistic size selectivity curve including the parameters (the length of fish at which 50% swam through the mesh size) and (the selection range, SR) [15,28]. The logistic regression model was computed using the generalized linear model (GLM) function in R. The selection curves provide the basis for determining the catch efficiency in the following experiments.
To predict if a fish of a certain size will fit through a mesh size, the following formula was used
where is the probability that a fish of length does fit ( > 0.5) or does not fit through ( < 0.5) a mesh size. The (intercept) and β (slope) are estimated coefficients after a logit transformation. The tipping point (the length of fish at which the probability to fit through the mesh is 50%) and the selection range (the length of fish at which the probability to fit through the mesh is 75% and 25%, respectively) are described by the following formulas [15]:
The logistic regression curve and model validation (deviance residuals, classification matrix, ROC curve, pseudo R2) were computed using the statistical and graphical open-source software R (version 4.0.3 [29]) including the following packages: extrafont [30], ggplot2 [31], viridis [32], DescTools [33], boot [34,35], caret [36] and plotROC [37]).
2.3.2. Net-Perception Experiment
Video recordings were examined using a standard video player (VLC media player x64 version 3.0.11). The video recordings were evaluated by one person. The time of occurrence and frequency with which the fish performed the following behaviors were noted: (i) fish swims through the net, (ii) fish unsuccessfully attempts to swim through the net i.e., the fish puts its snout/head through the net; and (iii) fish swims through the net after scare effect. We tested for behavioral differences depending on different abiotic and biotic factors using descriptive statistics. To test more generally if the age class or the treatment had a significant influence on the amount of net-interaction behavior, we used non-parametric Kruskal-Wallis test as data was not normally distributed (Shapiro-Wilk test p < 0.05) and had heterogeneous variances (Levene’s test p < 0.05). To identify which groups differed from each other, we used the Dunn’s post-hoc test with Bonferroni correction.
All analyses were computed using the statistical and graphical open-source software R (version 4.0.3, [29]) including the following packages: extrafont [30], ggplot2 [31], viridis [32], dunn.test [38], car [39], dplyr [40] and plyr [41].
2.3.3. Stow-Fyke-Net Experiment
The recordings of the stow-fyke-net experiment were watched by multiple persons. All persons were previously trained by an expert in this field to recognize the fish in the video and to reduce potential observer effects. For the present study, the observer effect equaled 13% (average difference between the reported sightings of the expert and the trained observer after watching the same videos).
For video evaluation, the standard video player (VLC media player x64 version 3.0.11) was used. Each fish sighting was documented using a time stamp for the duration of occurrence within the visual range of the camera and by noting the position of a sighting (number of camera). Fish that were filmed in the process of just being released were not counted. On the video recordings, individual fish were observed escaping or entering through the meshes of the net (“sneaker fish”), dwelling at a certain spot of the stow net for >5 min (“dwellers”) or commuting (drift with the flow or/and swim against it) in the stow net or between the fyke net and the stow net (“commuter”).
For the recordings of the fyke-net experiment, additional notes were taken on fyke-net escaping attempts (fish left the fyke net and swam actively upstream into the stow net leaving the visual range of the camera) and “revenants” (fish drifting from the stow net back into the fyke net) and the duration of the observed behavior.
3. Results
3.1. Fall-Through Experiment
The predicted selectivity curves computed from the results of the fall-through experiment are presented in Figure 2. GLMs correctly predicted whether the fish passed through the net at least 97% of the time (Table 3). For mesh size 30 mm, fish up to a total length of 23 cm were predicted to swim through the net; for mesh size 20 mm, fish up to a total length of 18 cm should fit through. Fish smaller than 8.6 cm were predicted to fit through meshes of 15 mm and fish smaller than 7 cm to fit through 10 mm meshes. The selection ranges and model validation values are summarized in Table 3.
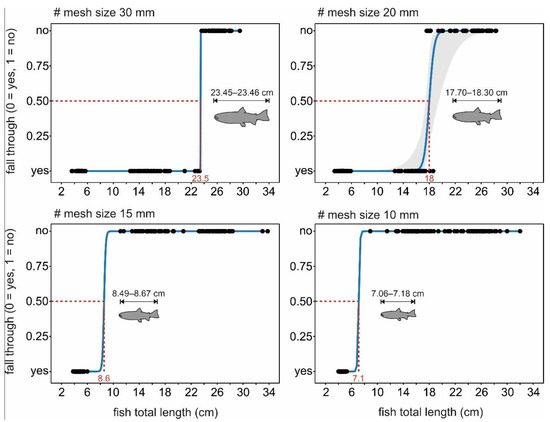
Figure 2.
Logistic regression prediction plots showing which fish sizes (total length) fit through each of the four tested mesh sizes of 30 mm, 20 mm, 15 mm and 10 mm. Red dashed lines and numbers indicate the values; the selection range is listed above the fish symbols. Grey area indicates the likelihood-based 95% confidence interval. Note that values are based on model estimates. Due to the restricted availability of specimens in the size range of 6.0–11.1 cm for mesh size 15 mm (bottom left panel) and 5.3–8.9 cm for mesh size 10 mm (bottom right panel), the actual thresholds between fish fitting through and not fitting through the meshes are between 6.0–11.1 cm and 5.3–8.9 cm, respectively.
Table 3.
Fall-through model validation summary and fit through thresholds.
3.2. Net-Perception Experiment
Brown trout interacted with the net and it was possible to film several individuals of all age classes voluntarily swimming through the net from both sites (Supplementary Material Video S1–S3). Besides the voluntary passage, we observed fish, mainly of age class 2+, which were actually too large to swim through the present mesh size, yet trying by pressing their snout repeatedly against the net.
Based on 54 h of video recordings, an effect of mesh size and fish size, but not of treatments (flow velocity, lure effect) was detected. A summary of observed fish-net interactions in relation to the above mentioned factors is displayed in Figure 3. The scare effect mainly resulted in the smaller sized fish of age class 0+ and 1+ to escape through the meshes and had only little or no effect on 2+ brown trout (Dunn-Bonferroni p > 0.05). Neither the number of fish swimming through the net nor that of attempts to swim through the net differed among the three treatments (Kruskal-Wallis test, p > 0.05).
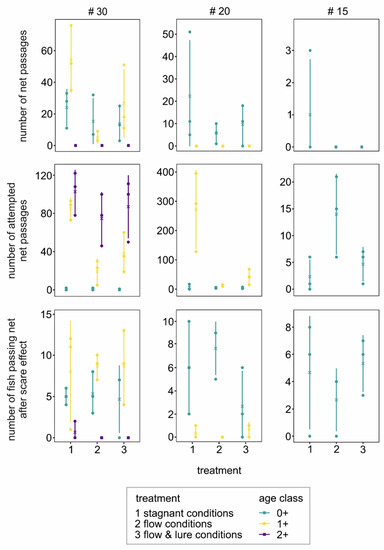
Figure 3.
Fish-net interaction and swim-through events in relation to mesh size (#) 30 mm, 20 mm, 15 mm, treatment and fish age class. Displayed are the data points (n = 3 per treatment) with their corresponding mean and standard deviation. The size range of fish in each age class equaled: 0+ = 3–10 cm, 1+ = 11–20 cm, and 2+ = 21–30 cm.
Water chemistry remained constant throughout the experiments (Table A1).
Additionally, we compared the size distribution of fish that voluntarily swam through the experimental nets of mesh size 30 mm, 20 mm and 15 mm and the fish that did not swim through the net with the value derived from the fall-through experiment (Figure 4). Surprisingly also larger fish than expected from the swam through the net. The prediction accuracy of which fish would fit through the net varied depending on the mesh size. For mesh size 30 mm, 6% of 267 fish that swam through the net should not have fit through according to . For mesh size 20 mm, all fish that swam through the mesh were predicted to fit through. For mesh size 15 mm, however, 84% of the fish that swam through the net were above the threshold and therefore should not have fit through the net. Probably, some of the 0+ and 1+ fish used their body flexibility to fit through the net. As expected, the majority of the fish (77%) that did not swim through the net were also classified to not fit through according to the value. In turn, 33% of the fish that did not swim through the net may have fit through but simply refused to try.
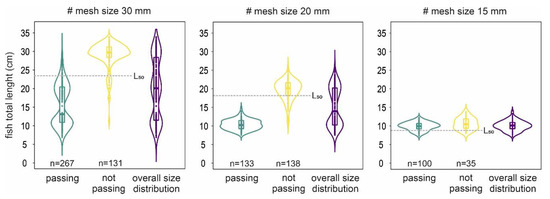
Figure 4.
Size distribution of fish that voluntarily swam through the test nets (mesh size 30 mm, 20 mm, 15 mm), compared to the value displayed as dashed line (the length of fish at which 50% fit through the mesh size) of the fall-through experiment.
3.3. Stow-Fyke-Net Experiment
3.3.1. Fish Behavior in the Stow Net
We observed 940 fish (875 inside and 65 outside the stow net) on the video recordings. We categorized 93% as commuters, which would either drift with the flow or swim against the current and were in 99.5% of cases just visible for a few seconds. Dwellers were recorded on camera in low numbers (n = 6). However, they stayed in one place for an average of 17 min, with one fish exceeding the 60-min recording time. One sneaker fish was recorded when it actively entered the net from the outside (Supplementary Material Video S4). In the cod end of the fyke net, 31 sneaker (marked) fish were caught (Figure 5). Sneaker fish were on average 4.9 ± 0.7 cm (0+ age class) and 14.3 ± 2.2 cm (1+ age class) in size. One fish was caught with a length of 25.7 cm (2+ age class). The total catch efficiency of the fish released directly into the stow net (position A, no fin clip) was 63 ± 14%, suggesting that 37% of them either sneaked out of the net or dwelled into the main net while the fyke net was retrieved (Figure 6).
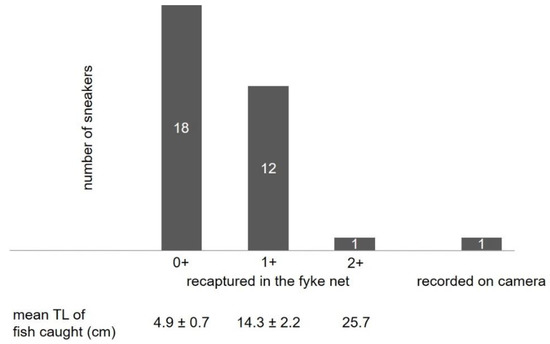
Figure 5.
Sum of sneaking fish recaptured in the fyke net and visible on camera during the stow-net experiment. For recaptured fish, the average size per age class is provided.
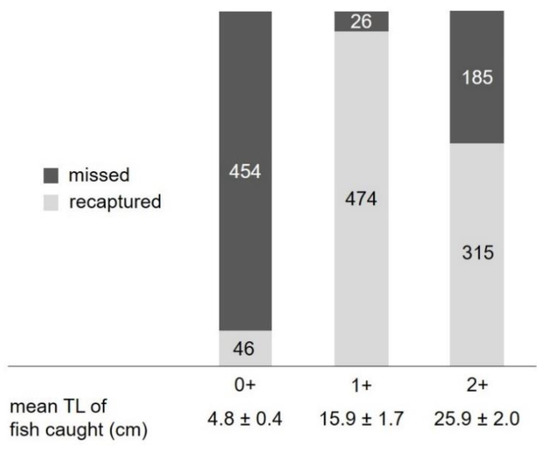
Figure 6.
Stacked bar plot representing the number and size of recaptured brown trout in the fyke net and number of brown trout missed during the stow-net experiment. Originally, 500 fish were released per age class in front of the stow net (see Figure 1B, position 1).
Abiotic parameters did not change significantly over the experimental period (Appendix A, Table A2). Catch efficiency increased over the day from a relative average catch proportion of 50 ± 4% (mean ± SD) in the morning to, 62 ± 4% at noon and 79 ± 14% in the evening.
3.3.2. Fish Behavior in the Fyke Net
The catch data of the fyke-net experiment revealed that, in 8 of 10 cases, less fish were caught than previously released (Table 4). On average, 6% of fish were missed in the catch. In 7 of the 10 experiments, the entire throat of the fyke net was visible in the video frames and could thus be used for behavioral evaluation. Of the fish released, 16% were sighted escaping through the throat of the net. Successful escapes into the main net area were observed in 12% of the fish.
Table 4.
Recapture rates and count of fish sighted escaping the fyke-net throat during the fyke-net experiment. Per run, 50 fish have been released. FC = number of fish recaptured after 1 h, FM (%) = percentage of fish missed compared to number of fish released, Esc. = number of fish trying to escape the fyke net, Succ. Esc. = number of successful escapers, Revenants = number of fish returning to the fyke net after the escape, Esc. 1 h = number of escaped fish after one hour (Succ. Esc.–Revenants). Runs, for which video data could not be collected, are indicated by ‘-’.
The rate of fish escaping the fyke-net throat increased gradually as the experiment progressed in time and was highest after 50 min. Revenants (i.e., fish drifting back into the fyke net) showed a more dispersed pattern with no clear trend (Figure 7).
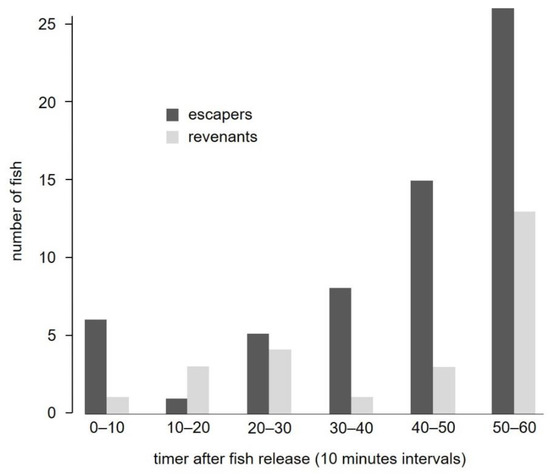
Figure 7.
Timeline presenting the number of fish escaping the fyke-net throat (escapers) and drifting back into the fyke net (revenants) summed over 10-min intervals.
4. Discussion
Findings of this study confirm that fish of a size between 3 and 23 cm swim through the meshes of standardized stow nets to either enter or leave the net during regular fish monitoring of hydropower plants. As expected, the frequency and amount of fish swimming through the net thereby most strongly depend on the fish size as well as the mesh size. In addition, we were able to record other behavioral patterns, namely dwelling and commuting, which can lead to fish not reaching or escaping the catch unit of the fyke net.
The observed behavior of fish escaping or entering the fishing gear as well as the occurrence of dwellers and commuters can bias the catch outcome and its interpretation. This includes interpretations concerning number and species of fish moving downstream as well as the assessment of fish mortality and injuries resulting from turbines. For example, if the catch includes fish that have entered the net from outside (sneaker), this may lead to an overrepresentation of unaffected fish, resulting in an underestimation of turbine effects. In turn, the presence of dwellers and commuters may lead to an overestimation of turbine effects, as the more agile and potentially less impacted fish are not caught in the catch unit.
Sneakers, fish that fit and swim through the net mesh of the stow net, occurred in the size range of 3–23 cm. While the stow-net mesh width gradually decreases, the net selectivity will naturally increase. Hence, fish < 7 cm (5.3–8.9 cm) fit through all meshes of the stow net. Fish < 18 cm fit through the 30 and 20 mm meshes, which account for ca. 50% of the total net area. Brown trout in the size range of 3–23 cm represent a large proportion or sometimes even 100% of the size distribution of natural brown trout populations [24,42], making these findings highly relevant for fish populations in the wild. This holds also true for many other common stream fish not investigated here, e.g., European grayling (Thymallus thymallus), European nase (Chondrostoma nasus), European minnow (Phoxinus phoxinus), common roach (Rutilus rutilus), common dace (Squalius cephalus) and gudgeon (Gobio gobio) [43]. Knott et al. [1] found that the average total length of downstream-moving fish was 10 ± 6 cm (mean ± SD) based on 39 fish species recorded in central European catchments. The chance that fish of those size ranges are physically able to escape the mesh during regular hydropower fish monitoring is consequently very high.
Sneaking behavior is not necessarily linked to an escape reflex. In our study, the fish started to actively explore their environment after 10 min of acclimatization time. Some would swim through the meshes of the net or try to (often aggressively and repeatedly) by putting their snout through the mesh or by biting the net. The latter mainly occurred in fish > 11 cm, which were too large to actually fit through the distinctive mesh sizes. Some fish were observed to force themselves through the net by turning their body to the side (Supplementary Material Video S4). This behavior also explains why the logistic-regression model of the fall-through experiment, excluding fish behavior, underestimated the predicted size of fish fitting through the different mesh sizes in the net-perception experiment. In contrast to the fish that were dropped onto the net, free ranging fish can use their body flexibility and take advantage of the net flexibility to some extent. Length is a good indicator for net selectivity, but to obtain a more realistic prediction, it is recommended to use a specific measuring technique where both the largest circumference and the strongest bone structures are considered [17]. However, this procedure is time-consuming and requires special equipment.
Adjusting the mesh sizes to smaller meshes seems to be a logic consequence to minimize sneaking behavior. Unfortunately, the extreme hydraulic conditions at turbine outlets determine the technical constraints for installation and design of stow-fyke nets. Hence, the size, shape and material of the catch device are manufactured to withstand a particular flow rate, pressure and amount of attached and floating debris [11]. Thus, the possibility for net adjustments such as further decreasing mesh sizes are very limited.
In addition, other behavior such as dwelling or commuting, which also contribute to a reduced recapture rate, must be considered. The results of the fyke-net experiment demonstrated that commuting behavior can cause 6% of fish to be missed in the catch after 1 h. The exact effect of dwelling on the catch needs further investigation. Brown trout are strong swimmers that sustain swimming at flow velocities of 0.7 m·s−1 for at least 200 min [44]. Hence, brown trout could spend several hours in the stow net where flow velocities were on average 0.4 m·s−1 (Table A2) without getting exhausted and drifting into the fyke net. Similar to the net perception experiment, fish needed some time to acclimate before they became active. Hence, the longer the fish are exposed to a novel situation, the higher the chance that they start to explore their environment and to show sneaking, dwelling or commuting behavior. Our experiment also suggests an influence of daytime with an increase in the catch efficiency from morning hours to noon and evening, which may be explained by the diurnal activity patterns of fish that are well-known from other studies on fish passage [1] (and references therein).
There are indications that personality of fish plays a role in explorative and reactive behavior [45,46,47,48,49,50]. We observed that, on average, 16% of the fish actively explored and tried to swim through the mesh (bold individuals), while others would stay motionless at one spot (described as “freezing” in [45]) or explore cautiously, not attempting to swim through the mesh. This held true for trying to swim though the net (net-perception experiment) as well as for escaping the fyke-net throat (fyke-net experiment). For example, a typical escape in the fyke net was characterized by the fish slowly entering the fyke-net throat, until it had passed the half-way point, to then burst swim upstream into the stow net. Besides these individuals with explorative nature, some fish (mainly in age class 1+ and 2+) in the net-perception experiment became active and tried to swim or swam through the net when a conspecific came to close or attacked them (with snout or flank).
Besides personality, other factors such as adaptation to specific flow conditions and health status can influence fish behavior as well [25]. As rheophilic fish, brown trout belong to the strong swimmers and are adapted to high flow rates. However, critical swimming speeds and the ability to burst swim are species-specific and can further be influenced by health status of the fish [51,52]. For example, fish infested by parasites show a significant reduction in their critical swimming speed [53,54], probably also affecting their behavior inside of a net. Consequently, the variation in fish behavior under natural settings is likely to even be greater than the one observed within our standardized experiments with one single species and specimens of the same origin and uniform good health condition.
It is assumed that during fish monitoring at hydropower plants, dead or injured fish will passively drift with the current and are then caught in the fyke net. However, depending on the flow current it is possible that dead fish do not reach the catch unit and are missed. Thus, further investigations on how fish condition influences the catch efficiency are highly recommended.
Certainly, there is a variety of factors that challenge the implementation of strategies to deal with the monitoring of bias caused by fish behavior. However, great progress has been made in recent years in minimizing influential effects. One example is the standardization of fish monitoring, where, besides the monitoring of the natural occurring fish fauna, standardized fish releases help to set turbine effects into relation to number of fish passing the hydropower plant. Hereby, selected species representing different body and size classes are released in known numbers [2,11,55]. Further improvements were made by considering the health status of these fish following a standardized protocol including condition, parasite load and injuries [6].
As supported by our findings, innovative technologies like camera- or sonar-based systems could be used to further improve fish monitoring at hydropower plants and set observed behavioral effects and catch efficiency into relation [7]. However, some specific limitations need to be considered when selecting one of these methods and when interpreting the results. Possible limitations include turbidity conditions, imprecise recording of fish length and underrepresenting fish of size < 100–150 mm (both systems), light conditions (camera-based) or false detection inferences and signal masking (sonar-based) [7,56]. Sonar-based systems can be operated day and night and can cover areas of 5–15 m (e.g., ARIS Explorer [57]). However, in highly turbulent waters such as at turbine outlets, the acoustic signal is scattered by the gas bubbles forming in the water column and targets get readily masked behind the acoustic bubble cloud [56,58,59]. Although video cameras are limited to a visual range of 1.5–2 m in clear freshwater, the quality of the recorded objects is very high and species identification is possible. Automated video analysis systems are currently under development [60] and could reduce the workload significantly, making it a cheap and fast method for additional monitoring.
5. Conclusions
The three behavioral patterns—sneaking, dwelling and commuting—play a central role in fish not being caught in the fyke net and potentially bias fish monitoring results at hydropower plants. Fish can escape through the meshes (sneaking), dwell at a certain spot outside of the catch unit, or commute between the fyke net and the stow net. Whether these behavioral patterns occur is independent of the flow velocity or a lure effect in the case of sneaking behavior. We assume that the occurrence of this behavior is individual-specific and thus, relates to the personality of the fish (bold or shy individual). The exact motivation behind the observed behavioral patterns needs further investigation. However, to estimate the effects on the catch result and to improve the accuracy of turbine-effect assessments on fish, automated optical systems are needed in addition to the existing standardized fish monitoring programs to assess potential bias of the catch.
Supplementary Materials
The following videos are available online at https://www.mdpi.com/2071-1050/13/2/669/s1, Video S1: brown trout of age class 0+ swimming through the net during the net-perception experiment (mesh size 20 mm, treatment 3), Video S2: brown trout of age class 1+ swimming through the net during the net-perception experiment (mesh size 30 mm, treatment 1), Video S3: brown trout of age class 2+ trying to swim through the net during the net-perception experiment (mesh size 30 mm, treatment 2), Video S4: brown trout (sneaker) entering the stow net from the outside by swimming through the mesh during the stow-net experiment.
Author Contributions
Conceptualization, N.S., J.P. and J.G.; methodology, N.S., J.P. and J.G.; investigation, N.S. and A.H.; validation, J.P. and J.G.; formal analysis, N.S. and A.H.; data curation, N.S. and A.H.; writing—original draft preparation, N.S.; writing—review and editing, J.P., J.G. and A.H.; visualization, N.S. and A.H.; supervision, J.G. and J.P.; funding acquisition, J.G. All authors have read and agreed to the published version of the manuscript.
Funding
This project has received funding from the European Union’s Horizon 2020 research and innovation program under grant agreement No 727830, “Fish-friendly innovative technologies for hydropower (FIThydro).” Field investigations at the river Alz were carried out within a monitoring project funded by the Bavarian State Ministry of Environmental and Consumer Protection: OelB-0270-45821/2014.
Institutional Review Board Statement
The study was conducted according to the guidelines of the Declaration of Helsinki, and approved by the Bavarian government/Regierung von Oberbayern (55.2-1-54-2532-24-2015, 13.04.2017).
Informed Consent Statement
Not applicable.
Data Availability Statement
The data presented in this study are available on request from the corresponding author. The data are not publicly available due to privacy restrictions.
Acknowledgments
We are grateful to all students and helpers for their support during field experiments and in reviewing the video material.
Conflicts of Interest
The authors declare no conflict of interest.
Appendix A

Figure A1.
Detailed dimensions of the arena build for the net-perception experiment in a concrete channel. Nets were placed in rails and were therefore flexible in use. Net 1 was permanent and determined the upper boundary of the arena. The lower boundary was set corresponding to which age class of fish was tested. For age class 0+, net 3 defined the lower boundary of the arena, the position of net 4 was used when testing 1 + fish and net 5 was used for 2+ fish. The boundary nets were made of 4 mm mesh size. Net 6 represents the position of the test net, which was changed according to the treatment. The test nets had a mesh size of 30 mm, 20 mm or 15 mm, respectively. Prior to the experiment, the fish were acclimatized for 10 min in a defined area of the arena. Fish of age class 0+ were acclimatized in the area between net 2 and net 3, 1+ fish in the area between net 3 and net 4 and 2+ fish in the area between net 3 and net 5. After the acclimatization time, net 2 or net 3 were removed and fish were able to start exploring the arena.


Figure A2.
Measurement positions for abiotic factors in the concrete channel during the net-perception experiment. The cross symbols indicate the nine measurement positions for oxygen, pH, temperature, electric conductivity and flow velocity. All factors were measured 10 cm above the channel bottom. Water depth was measures at the position of the circle.

Table A1.
Arithmetic mean and standard deviation for abiotic parameters measured during the net-perception experiment (n = 486 per parameter).
Table A1.
Arithmetic mean and standard deviation for abiotic parameters measured during the net-perception experiment (n = 486 per parameter).
| Parameter | Mean ± SD |
|---|---|
| temperature (°C) | 15.6 ± 1.0 |
| dissolved oxygen (mg·L−1) | 9.3 ± 0.7 |
| electric conductivity (μS·cm−1) | 780.2 ± 12.3 |
| pH value | 8 ± 0 |
| flow velocity (cm·s−1) treatment 1 | 1.7 ± 2.1 |
| flow velocity (cm·s−1) treatment 2 | 8.9 ± 3.7 |
| flow velocity (cm·s−1) treatment 3 | 9.0 ± 1.5 |
Table A2.
Abiotic data measured during the stow-fyke-net experiment.
Table A2.
Abiotic data measured during the stow-fyke-net experiment.
| Turbidity (NTU) | Oxygen (mg L−1) | Temp (°C) | pH | Conductivity (µS cm−1) | |
|---|---|---|---|---|---|
| Day 1 | 4.89 | 12.23 | 7.20 | 8.41 | 365 |
| Day 2 | 6.08 | 12.15 | 8.10 | 8.51 | 362 |
| Day 3 | 5.83 | 11.90 | 8.00 | 8.50 | 362 |
| Day 4 | 8.35 | 12.13 | 8.00 | 8.54 | 361 |
| Discharge (m3 s−1) | Flow Velocity Stow Net (m3 s−1) | Flow Velocity Fyke Net (m3 s−1) | |||
| Day 1 | 91.40 | 0.46 | 0.34 | ||
| Day 2 | 92.50 | 0.46 | 0.07 | ||
| Day 3 | 92.50 | 0.34 | 0.43 | ||
| Day 4 | 92.50 | 0.20 | 0.46 | ||
References
- Knott, J.; Mueller, M.; Pander, J.; Geist, J. Seasonal and diurnal variation of downstream fish movement at four small-scale hydropower plants. Ecol. Freshw. Fish 2020, 29, 74–88. [Google Scholar] [CrossRef]
- Knott, J.; Mueller, M.; Pander, J.; Geist, J. Fish Passage and Injury Risk at a Surface Bypass of a Small-Scale Hydropower Plant. Sustainability 2019, 11, 6037. [Google Scholar] [CrossRef]
- Pander, J.; Mueller, M.; Geist, J. Ecological functions of fish bypass channels in streams: Migration corridor and habitat for rheophilic species. River Res. Appl. 2013, 29, 441–450. [Google Scholar] [CrossRef]
- Mueller, M.; Sternecker, K.; Milz, S.; Geist, J. Assessing turbine passage effects on internal fish injury and delayed mortality using X-ray imaging. PeerJ 2020, 8, e9977. [Google Scholar] [CrossRef] [PubMed]
- Bierschenk, B.M.; Pander, J.; Mueller, M.; Geist, J. Fish injury and mortality at pumping stations: A comparison of conventional and fish-friendly pumps. Mar. Freshw. Res. 2019, 70, 449–458. [Google Scholar] [CrossRef]
- Mueller, M.; Pander, J.; Geist, J. Evaluation of external fish injury caused by hydropower plants based on a novel field-based protocol. Fish. Manag. Ecol. 2017, 24, 240–255. [Google Scholar] [CrossRef]
- Egg, L.; Pander, J.; Mueller, M.; Geist, J. Comparison of sonar-, camera- and net-based methods in detecting riverine fish-movement patterns. Mar. Freshw. Res. 2018, 69, 1905–1912. [Google Scholar] [CrossRef]
- Dedual, M. Survival of Juvenile Rainbow Trout Passing through a Francis Turbine. N. Am. J. Fish. Manag. 2007, 27, 181–186. [Google Scholar] [CrossRef]
- Dubois, R.B.; Gloss, S.P. Mortality of Juvenile American Shad and Striped Bass Passed through Ossberger Crossflow Turbines at a Small-Scale Hydroelectric Site. N. Am. J. Fish. Manag. 1993, 13, 178–185. [Google Scholar] [CrossRef]
- Cramer, F.K.; Donaldson, I.J. Evolution of Recovery Nets Used in Tests on Fish Passage through Hydraulic Turbines. Progress Fish-Cult. 1964, 26, 36–41. [Google Scholar] [CrossRef]
- Pander, J.; Mueller, M.; Knott, J.; Geist, J. Catch-related fish injury and catch efficiency of stow-net-based fish recovery installations for fish-monitoring at hydropower plants. Fish. Manag. Ecol. 2018, 25, 31–43. [Google Scholar] [CrossRef]
- Holst, R.; Madsen, N.; Moth-Poulsen, T.; Fonseca, P.; Campos, A. Manual for Gillnet Selectivity; European Commission: Brussels, Belgium, 1998; p. 43. [Google Scholar]
- Stepputtis, D.; Santos, J.; Herrmann, B.; Mieske, B. Broadening the horizon of size selectivity in trawl gears. Fish. Res. 2016, 184, 18–25. [Google Scholar] [CrossRef]
- Madsen, N. Selectivity of fishing gears used in the Baltic Sea cod fishery. Rev. Fish Biol. Fish. 2007, 17, 517–544. [Google Scholar] [CrossRef]
- Wileman, D.A.; Ferro, R.S.T.; Fonteyne, R.; Millar, R.B. Manual of Methods of Measuring the Selectivity of Towed Fishing Gears; ICES Cooperative Research Report, 215; ICES: Copenhagen, Denmark, 1996; p. 132. [Google Scholar]
- Jensen, J.W. A direct estimate of gillnet selectivity for brown trout. J. Fish Biol. 1995, 46, 857–861. [Google Scholar] [CrossRef]
- Herrmann, B.; Krag, L.A.; Frandsen, R.P.; Madsen, N.; Lundgren, B.; Stæhr, K.J. Prediction of selectivity from morphological conditions: Methodology and a case study on cod (Gadus morhua). Fish. Res. 2009, 97, 59–71. [Google Scholar] [CrossRef]
- Carol, J.; García-Berthou, E. Gillnet selectivity and its relationship with body shape for eight freshwater fish species. J. Appl. Ichthyol. 2007, 23, 654–660. [Google Scholar] [CrossRef]
- Ebel, G. Fischschutz und Fischabstieg an Wasserkraftanlagen—Handbuch Rechen—und By-Passsysteme. Ingenieurbiologische Grundlagen, Modellierung und Prognose, Bemessung und Gestaltung; Büro für Gewässerökologie und Fischereibiologie Dr. Ebel: Halle (Saale), Germany, 2013; p. 483. [Google Scholar]
- Mueller, M.; Knott, J.; Egg, L.; Bierschenk, B.; Pander, J.; Geist, J. Fischökologisches Monitoring an Innovativen Wasserkraftanlagen: Band 1 Hintergrund und Methoden; Technical Report for Bayerisches Landesamt für Umwelt; Technical University Munich: Freising, Germany, July 2020. [Google Scholar]
- Mueller, M.; Knott, J.; Pander, J.; Geist, J. Fischökologisches Monitoring an Innovativen Wasserkraftanlagen: Band 7 Eixendorf an der Schwarzach; Technical Report for Bayerisches Landesamt für Umwelt; Technical University Munich: Freising, Germany, 2020. [Google Scholar]
- Adam, B.; Schürmann, M.; Schwevers, U. Zum Umgang mit Aquatischen Organismen—Versuchstierkundliche Grundlagen; Springer Spektrum: Wiesbaden, Germany, 2013; p. 188. [Google Scholar]
- European Parliament. Directive 2010/63/EU of the European Parliament and of the Council of 22 September 2010 on the protection of animals used for scientific purposes. Off. J. Eur. Union 2010, 276, 33–77. [Google Scholar]
- Birnie-Gauvin, K.; Candee, M.M.; Baktoft, H.; Larsen, M.H.; Koed, A.; Aarestrup, K. River connectivity reestablished: Effects and implications of six weir removals on brown trout smolt migration. River Res. Appl. 2018, 34, 548–554. [Google Scholar] [CrossRef]
- Johnsson, J.I.; Näslund, J. Studying behavioural variation in salmonids from an ecological perspective: Observations questions methodological considerations. Rev. Fish. Biol. Fish. 2018, 28, 795–823. [Google Scholar] [CrossRef]
- ICES. Report of the Study Group on Turned 90° Codend Selectivity, Focusing on Baltic Cod Selectivity (SGTCOD), 4–6 May 2011; IMR: Reykjavik, Iceland, 2011; p. 40. [Google Scholar]
- Johnsson, J.I.; Brockmark, S.; Näslund, J. Environmental effects on behavioural development consequences for fitness of captive-reared fishes in the wild. J. Fish Biol. 2014, 85, 1946–1971. [Google Scholar] [CrossRef]
- Millar, R.B.; Fryer, R.J. Estimating the size-selection curves of towed gears, traps, nets and hooks. Rev. Fish Biol. Fish. 1999, 9, 89–116. [Google Scholar] [CrossRef]
- R Core Team. R: A Language and Environment for Statistical Computing; R Foundation for Statistical Computing: Vienna, Austria, 2020; Available online: https://www.R-project.org/ (accessed on 1 October 2020).
- Chang, W. Extrafont: Tools for Using Fonts. R Package Version 0.17. 2014. Available online: https://CRAN.R-project.org/package=extrafont (accessed on 1 October 2020).
- Wickham, H. ggplot2: Elegant Graphics for Data Analysis; Springer: New York, NY, USA, 2016. [Google Scholar]
- Garnier, S. Viridis: Default Color Maps from ‘matplotlib’. R Package Version 0.5.1. 2018. Available online: https://CRAN.R-project.org/package=viridis (accessed on 1 October 2020).
- Signorell, A.; Aho, K.; Alfons, A.; Anderegg, N.; Aragon, T.; Arachchige, C.; Arppe, A.; Baddeley, A.; Barton, K.; Bolker, B.; et al. DescTools: Tools for Descriptive Statistics. R Package Version 0.99.38. 2018. Available online: https://CRAN.R-project.org/package=DescTools (accessed on 1 October 2020).
- Canty, A.; Ripley, B. Boot: Bootstrap R (S-Plus) Functions; R Package Version 1.3-25. 2020. Available online: https://CRAN.R-project.org/package=boot (accessed on 1 October 2020).
- Davison, A.C.; Hinkley, D.V. Bootstrap Methods and Their Applications; Cambridge University Press: Cambridge, UK, 1997; ISBN 0-521-57391-2. [Google Scholar]
- Kuhn, M. Caret: Classification and Regression Training. R Package Version 6.0-86. 2020. Available online: https://CRAN.R-project.org/package=caret (accessed on 1 October 2020).
- Sachs, M.C. plotROC: A Tool for Plotting ROC Curves. J. Stat. Softw. Code Snippets 2017, 79, 1–19. [Google Scholar] [CrossRef]
- Dinno, A. dunn.test: Dunn’s Test of Multiple Comparisons Using Rank Sums. R Package Version 1.3.5. 2017. Available online: https://CRAN.R-project.org/package=dunn.test (accessed on 1 October 2020).
- Fox, J.; Weisberg, S. An {R} Companion to Applied Regression, 3rd ed.; Sage: Thousand Oaks, CA, USA, 2019; Available online: https://socialsciences.mcmaster.ca/jfox/Books/Companion/ (accessed on 1 October 2020).
- Wickham, H.; François, R.; Henry, L.; Müller, K. Dplyr: A Grammar of Data Manipulation. R Package Version 1.0.2. 2020. Available online: https://CRAN.R-project.org/package=dplyr (accessed on 1 October 2020).
- Wickham, H. The Split-Apply-Combine Strategy for Data Analysis. J. Stat. Softw. 2011, 40, 1–29. [Google Scholar] [CrossRef]
- Geist, J.; Porkka, M.; Kuehn, R. The status of host fish populations and fish species richness in European freshwater pearl mussel (Margaritifera margaritifera) streams. Aquat. Conserv. Mar. Freshw. Ecosyst. 2006, 16, 251–266. [Google Scholar] [CrossRef]
- Kottelat, M.; Freyhof, J. Handbook of European Freshwater Fishes, 1st ed.; Publications Kottelat: Cornol, Switzerland, 2007; p. 646. [Google Scholar]
- Peake, S.; McKinley, R.S.; Scruton, D.A. Swimming performance of various freshwater Newfoundland salmonids relative to habitat selection and fishway design. J. Fish Biol. 1997, 51, 710–723. [Google Scholar] [CrossRef]
- Houslay, T.M.; Vierbuchen, M.; Grimmer, A.J.; Young, A.J.; Wilson, A.J. Testing the stability of behavioural coping style across stress contexts in the Trinidadian guppy. Funct. Ecol. 2017, 1–15. [Google Scholar] [CrossRef]
- Näslund, J.; Bererhi, B.; Johnsson, J.I. Design of emergence test arenas can affect the results of boldness assays. Ethology 2015, 121, 556–565. [Google Scholar] [CrossRef]
- Shamchuk, A.L.; Tierney, K.B. Phenotyping stimulus evoked responses in larval zebrafish. Behaviour 2012, 149, 1177–1203. [Google Scholar] [CrossRef]
- Toms, C.N.; Echevarria, D.J.; Jouandot, D.J. A methodological review of personality-related studies in fish: Focus on the shy-bold axis of behavior. Int. J. Comp. Psychol. 2010, 23, 1–25. [Google Scholar]
- Sneddon, L.U. The bold and the shy: Individual differences in rainbow trout. J. Fish Biol. 2003, 62, 971–975. [Google Scholar] [CrossRef]
- Fraser, D.F.; Gilliam, J.F.; Daley, M.J.; Le, A.N.; Skalski, G.T. Explaining leptokurtic movement distributions: Intrapopulation variation in boldness and exploration. Am. Nat. 2001, 158, 124–135. [Google Scholar] [CrossRef] [PubMed]
- Barber, I.; Mora, A.B.; Payne, E.M.; Weinersmith, K.L.; Sih, A. Parasitism, personality and cognition in fish. Behav. Process. 2017, 141, 205–219. [Google Scholar] [CrossRef] [PubMed]
- Tudorache, C.; Viaene, P.; Blust, R.; Vereecken, H.; De Boeck, G. A comparison of swimming capacity and energy use in seven European freshwater fish species. Ecol. Freshw. Fish 2007, 17, 284–291. [Google Scholar] [CrossRef]
- Bui, S.; Dempster, T.; Remen, M.; Oppedal, F. Effect of ectoparasite infestation density and life-history stages on the swimming performance of Atlantic salmon Salmo Salar. Aquac. Environ. Interact. 2016, 8, 387–395. [Google Scholar] [CrossRef]
- Taeubert, J.E.; Geist, J. Critical swimming speed of brown trout (Salmo trutta) infested with freshwater pearl mussel (Margaritifera margaritifera) glochidia and implications for artificial breeding of an endangered mussel species. Parasitol. Res. 2013, 112, 1607–1613. [Google Scholar] [CrossRef]
- Holzner, M. Untersuchungen über die Schädigung von Fischen bei der Passage des Mainkraftwerks Dettelbach. Ph.D. Thesis, Technical University Munich, Munich, Germany, September 2000. [Google Scholar]
- Heinrich, A.J. How Do Fish Interact with the Net?—First Approaches to Assess Fish-Net-Interactions in the Context of Hydropower Fish Monitoring. Master’s Thesis, Technical University Munich, Munich, Germany, December 2019. [Google Scholar]
- Schmidt, M.B.; Schletterer, M. Hydroakustik zur Analyse von Fischbeständen und Fischverhalten—Fallstudien aus Österreich. Österr. Wasser Abfallw. 2020, 72, 213–222. [Google Scholar] [CrossRef]
- Sebastian, S.M.; Caruthers, J.W. Effects of Naturally Occurring Bubbles on Multibeam Sonar Operations. In Proceedings of the Conference MTS/IEEE Oceans: An Ocean Odyssey, Honolulu, HI, USA, 5–8 November 2001; pp. 1241–1247. [Google Scholar] [CrossRef]
- Shen, C.; Lemmin, U. Ultrasonic scattering in highly turbulent clear water flow. Ultrasonics 1997, 35, 57–64. [Google Scholar] [CrossRef]
- Simon, J.; Kopp, D.; Larnaud, P.; Vacherot, J.P.; Morandeau, F.; Lavialle, G.; Morfin, M. Using automated video analysis to study fish escapement through escape panels in active fishing gears: Application to the effect of net colour. Mar. Policy 2020, 116, 103785. [Google Scholar] [CrossRef]


Publisher’s Note: MDPI stays neutral with regard to jurisdictional claims in published maps and institutional affiliations. |
© 2021 by the authors. Licensee MDPI, Basel, Switzerland. This article is an open access article distributed under the terms and conditions of the Creative Commons Attribution (CC BY) license (http://creativecommons.org/licenses/by/4.0/).