
DEXiAqua, a Model to Assess the Sustainability of Aquaculture Systems: Methodological Development and Application to a French Salmon Farm

 , , ,
, , ,  , and
, and
Abstract
1. Introduction
2. Materials and Methods
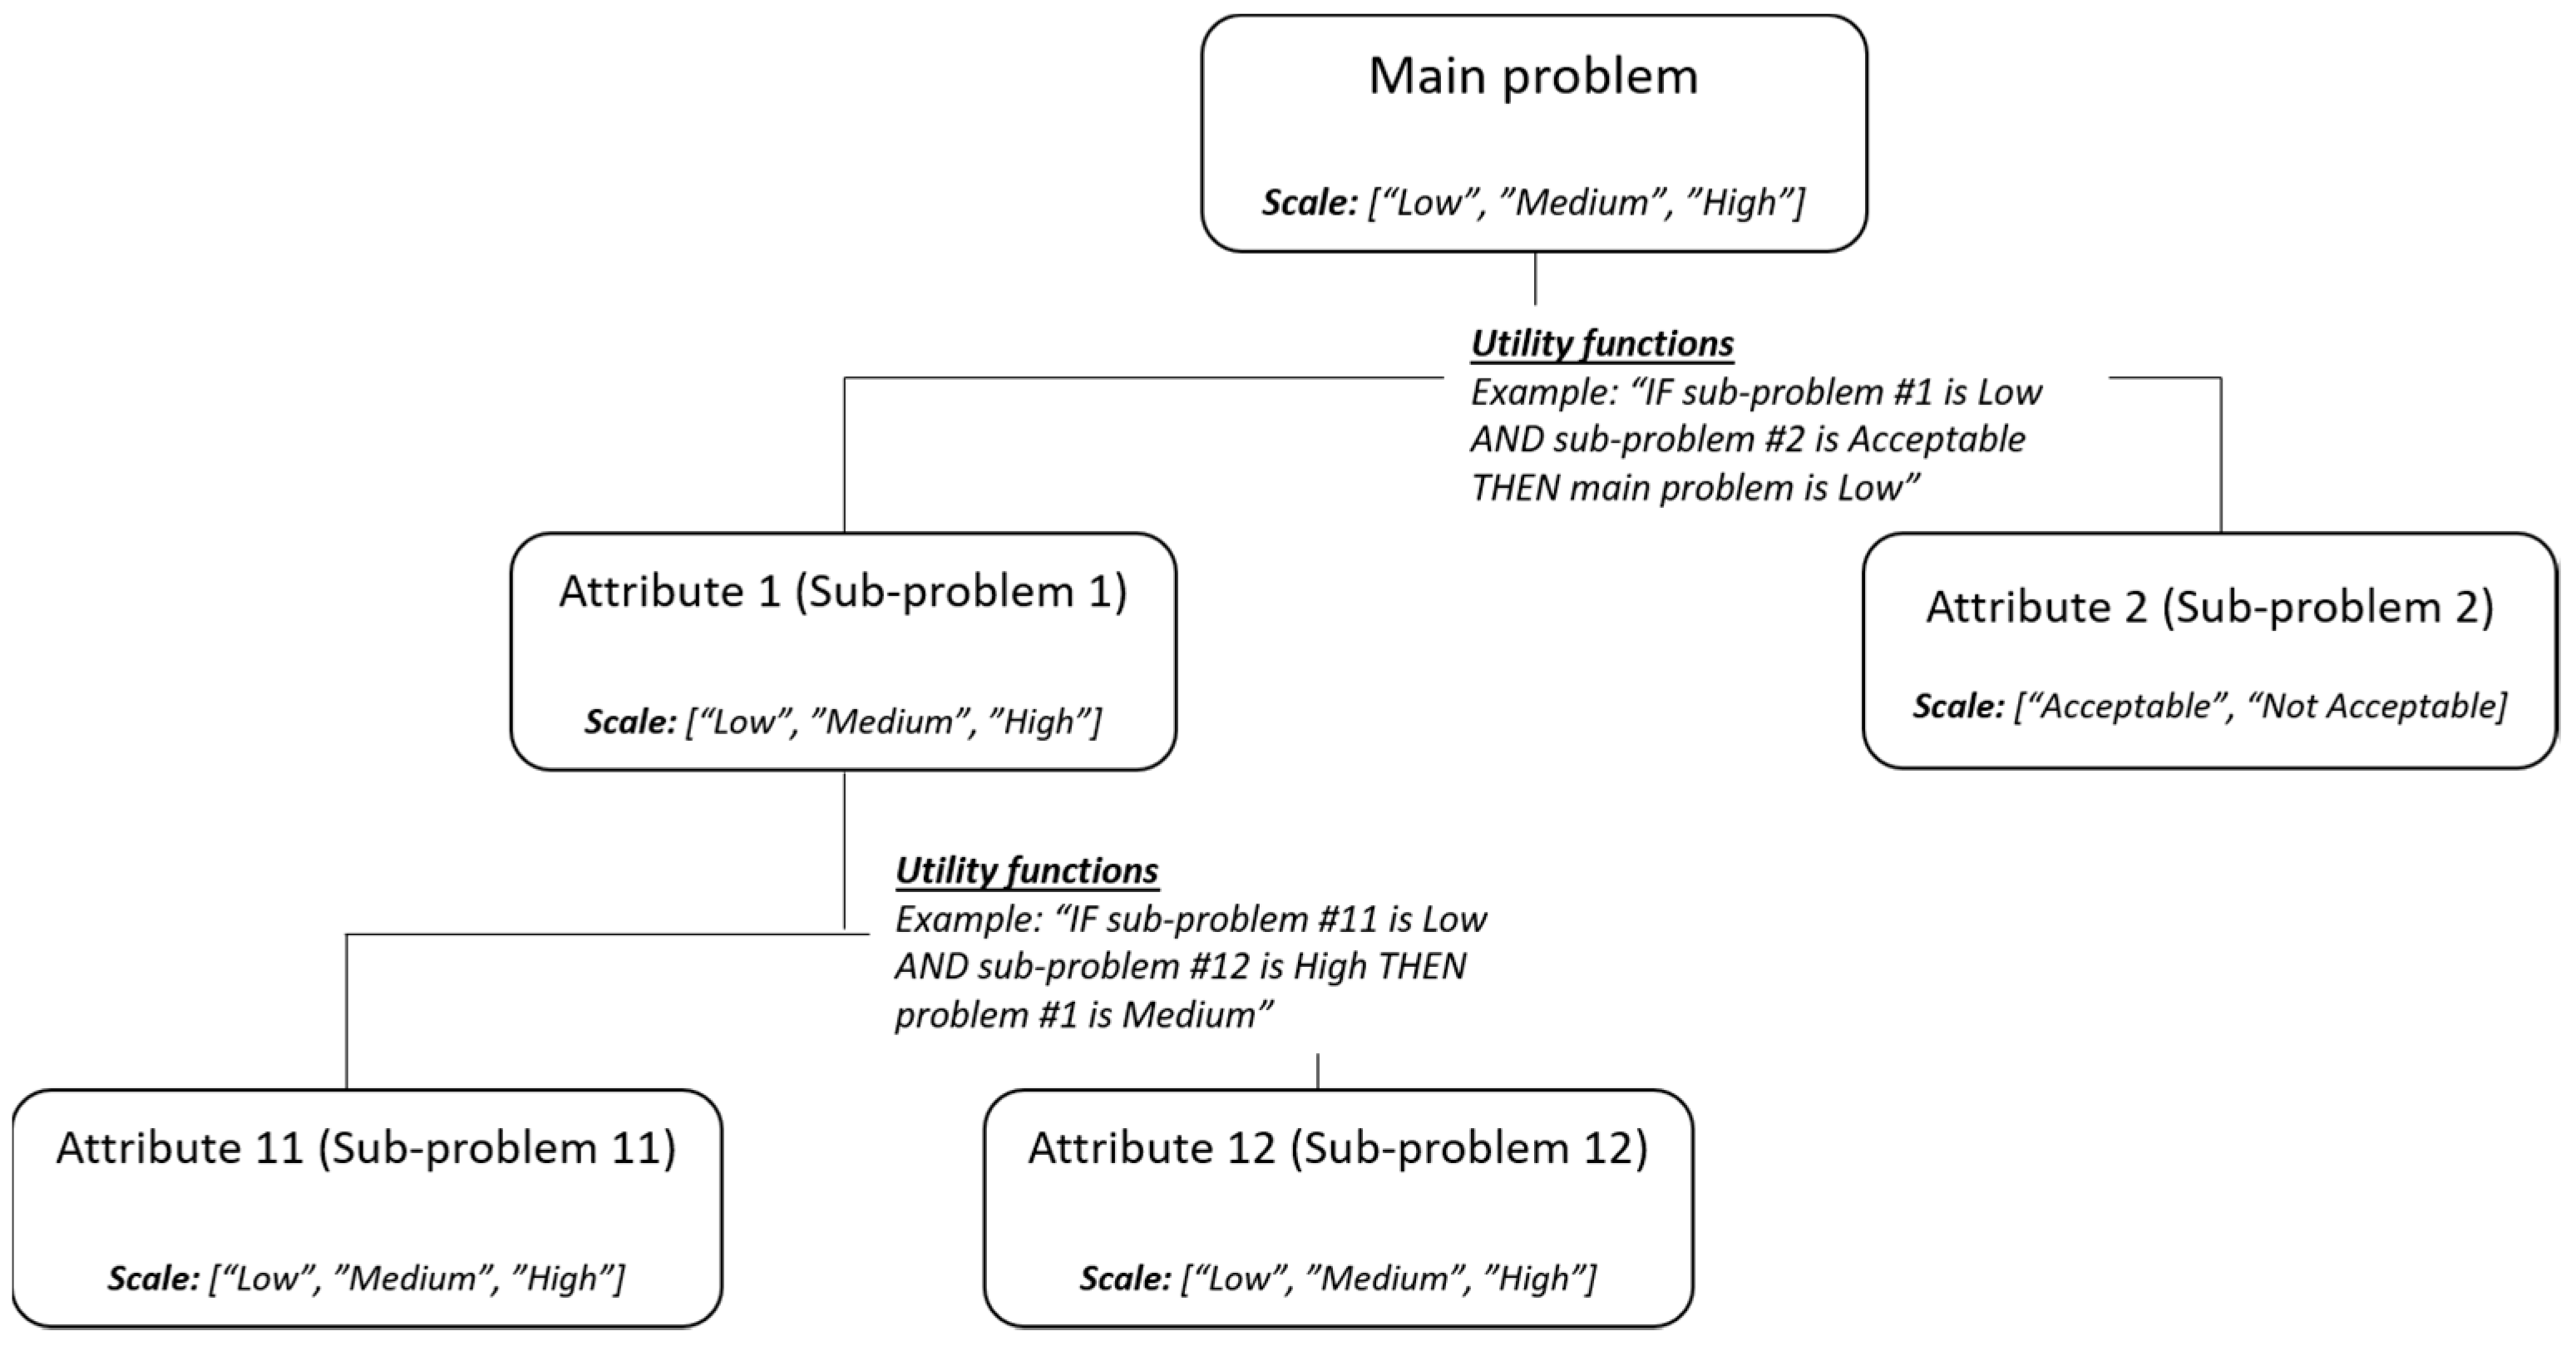
2.1. DEXi Methodology
- Define attributes, each of which is a qualitative variable that represents a sub-problem. An attribute, sometimes called a criterion [25], corresponds to each node of the tree;
- Define scales, each of which contains a set of options defined for each attribute (e.g., [Low; Medium; High], [Acceptable; Not acceptable]);
- Define the attribute tree, which breaks the main problem down into sub-problems (branches);
- Define utility functions, which aggregate branches of the attribute tree from the bottom (i.e., sub-problems) to the top (the main problem) (e.g., IF sub-problem #11 is Low AND sub-problem #12 is High THEN problem #1 is Medium).
2.2. Development of DEXiAqua
2.2.1. Composition of the Working Groups
- Economic: Théo Dubois (aquaculture, sustainability assessment using DEXi modeling), Nouraya Akkal-Corfini (vegetable production system design and multicriteria performance assessment of cropping systems using DEXi modeling), Alberto Barbaresi, Daniele Torreggiani and Enrica Santolini (design of smart agri-food structures and systems, energy modeling and renewable energy in agri-food and livestock systems, precision livestock farming, GIS spatial analysis and land suitability analysis, rural planning), Juan Francisco Fierro (aquaponics, aquaculture), Lorenzo Rossi (animal production, aquaculture, aquaponics), Romain Vandame (company director of Agriloops, which produces prawns and vegetables in aquaponics systems), Rainer Linke (legal counsel and head of government advisors);
- Social: Joël Aubin (environmental assessment (LCA) and agriculture system design), Jacopo Bacenetti (applying LCA to agricultural processes), Michele Costantini (applying the LCA to agricultural processes), Kyle Spiteri (diversification and scientific trials of agricultural production), Samuel Le Féon (environmental assessment using LCA), Chingoileima Maibam (marine biology and ecology, reproduction and nutrition of polychaetes);
- Environmental: Christophe Jaeger (environmental assessment and design of aquacultural systems), Aurélie Wilfart (environmental assessment of livestock systems using LCA and emergy accounting, nutrition and environmental optimization of livestock systems), Alberto Pardossi (irrigation and fertigation management of horticultural crops), Carlo Bibbiani (innovative rural building design, modeling energy and gas exchanges in greenhouse systems, aquaculture facilities), Baldassare Fronte (aquaculture, aquaponics, reproduction, and nutrition of marine fish species), Mehmet Ali Koçer (environmental monitoring and management related to eutrophication and microalgae, environmental impacts and management of aquaculture), Hüseyin Sevgili (fish nutrition and aquaculture).
2.2.2. Toward a Library of Attributes: Literature Review and Relevant Assessment Methods
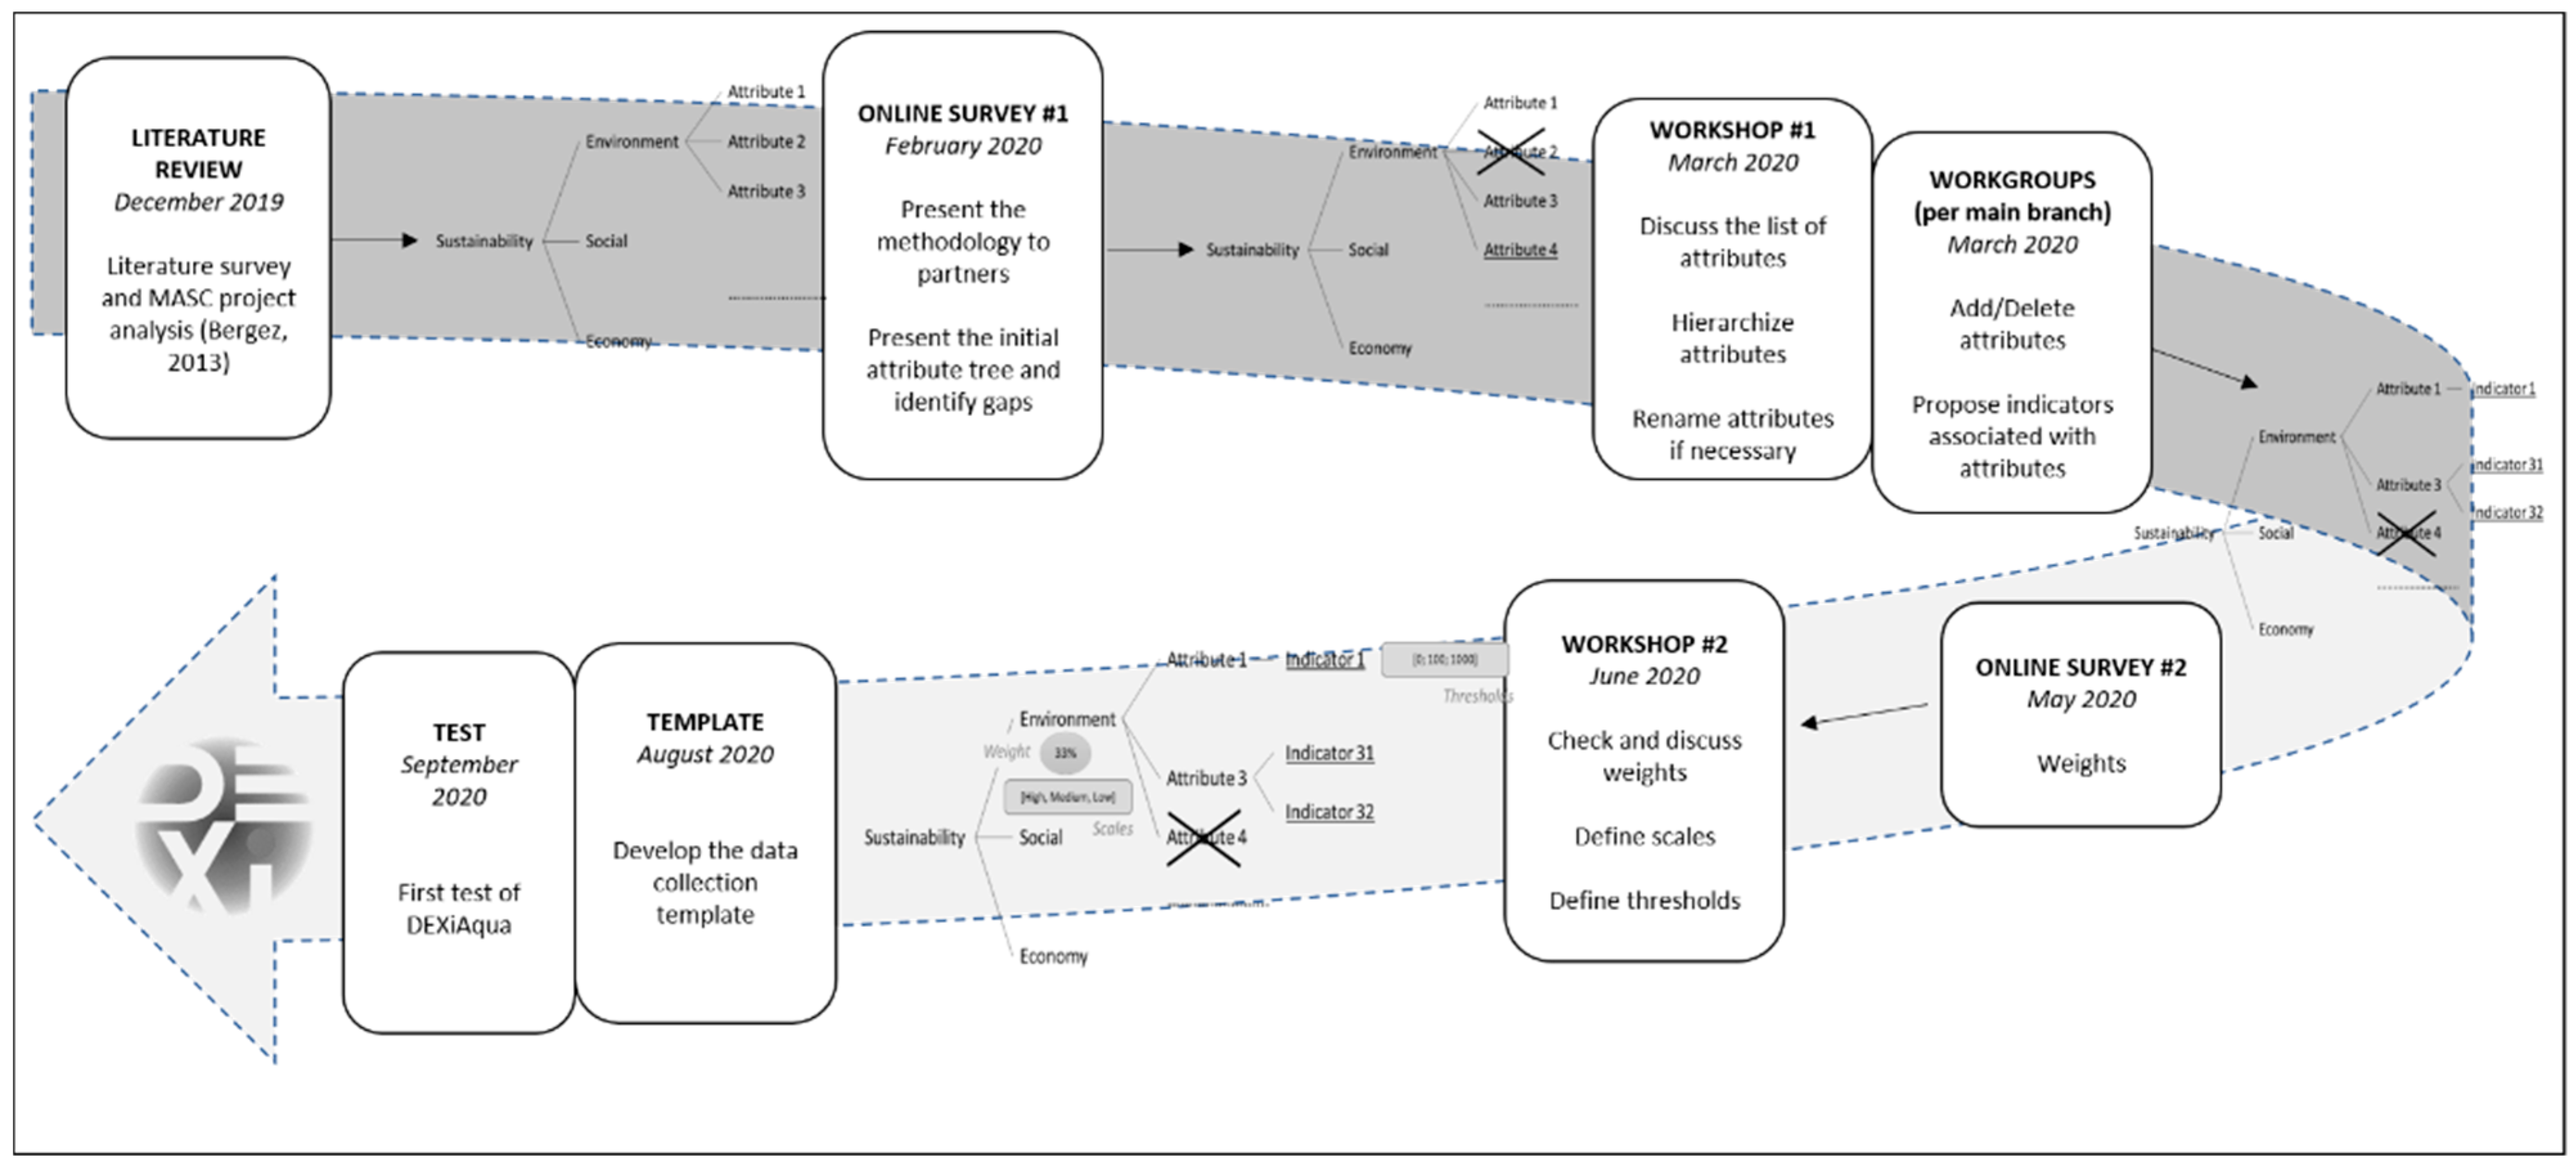
2.2.3. Consultation Process and Building of the DEXi Tree
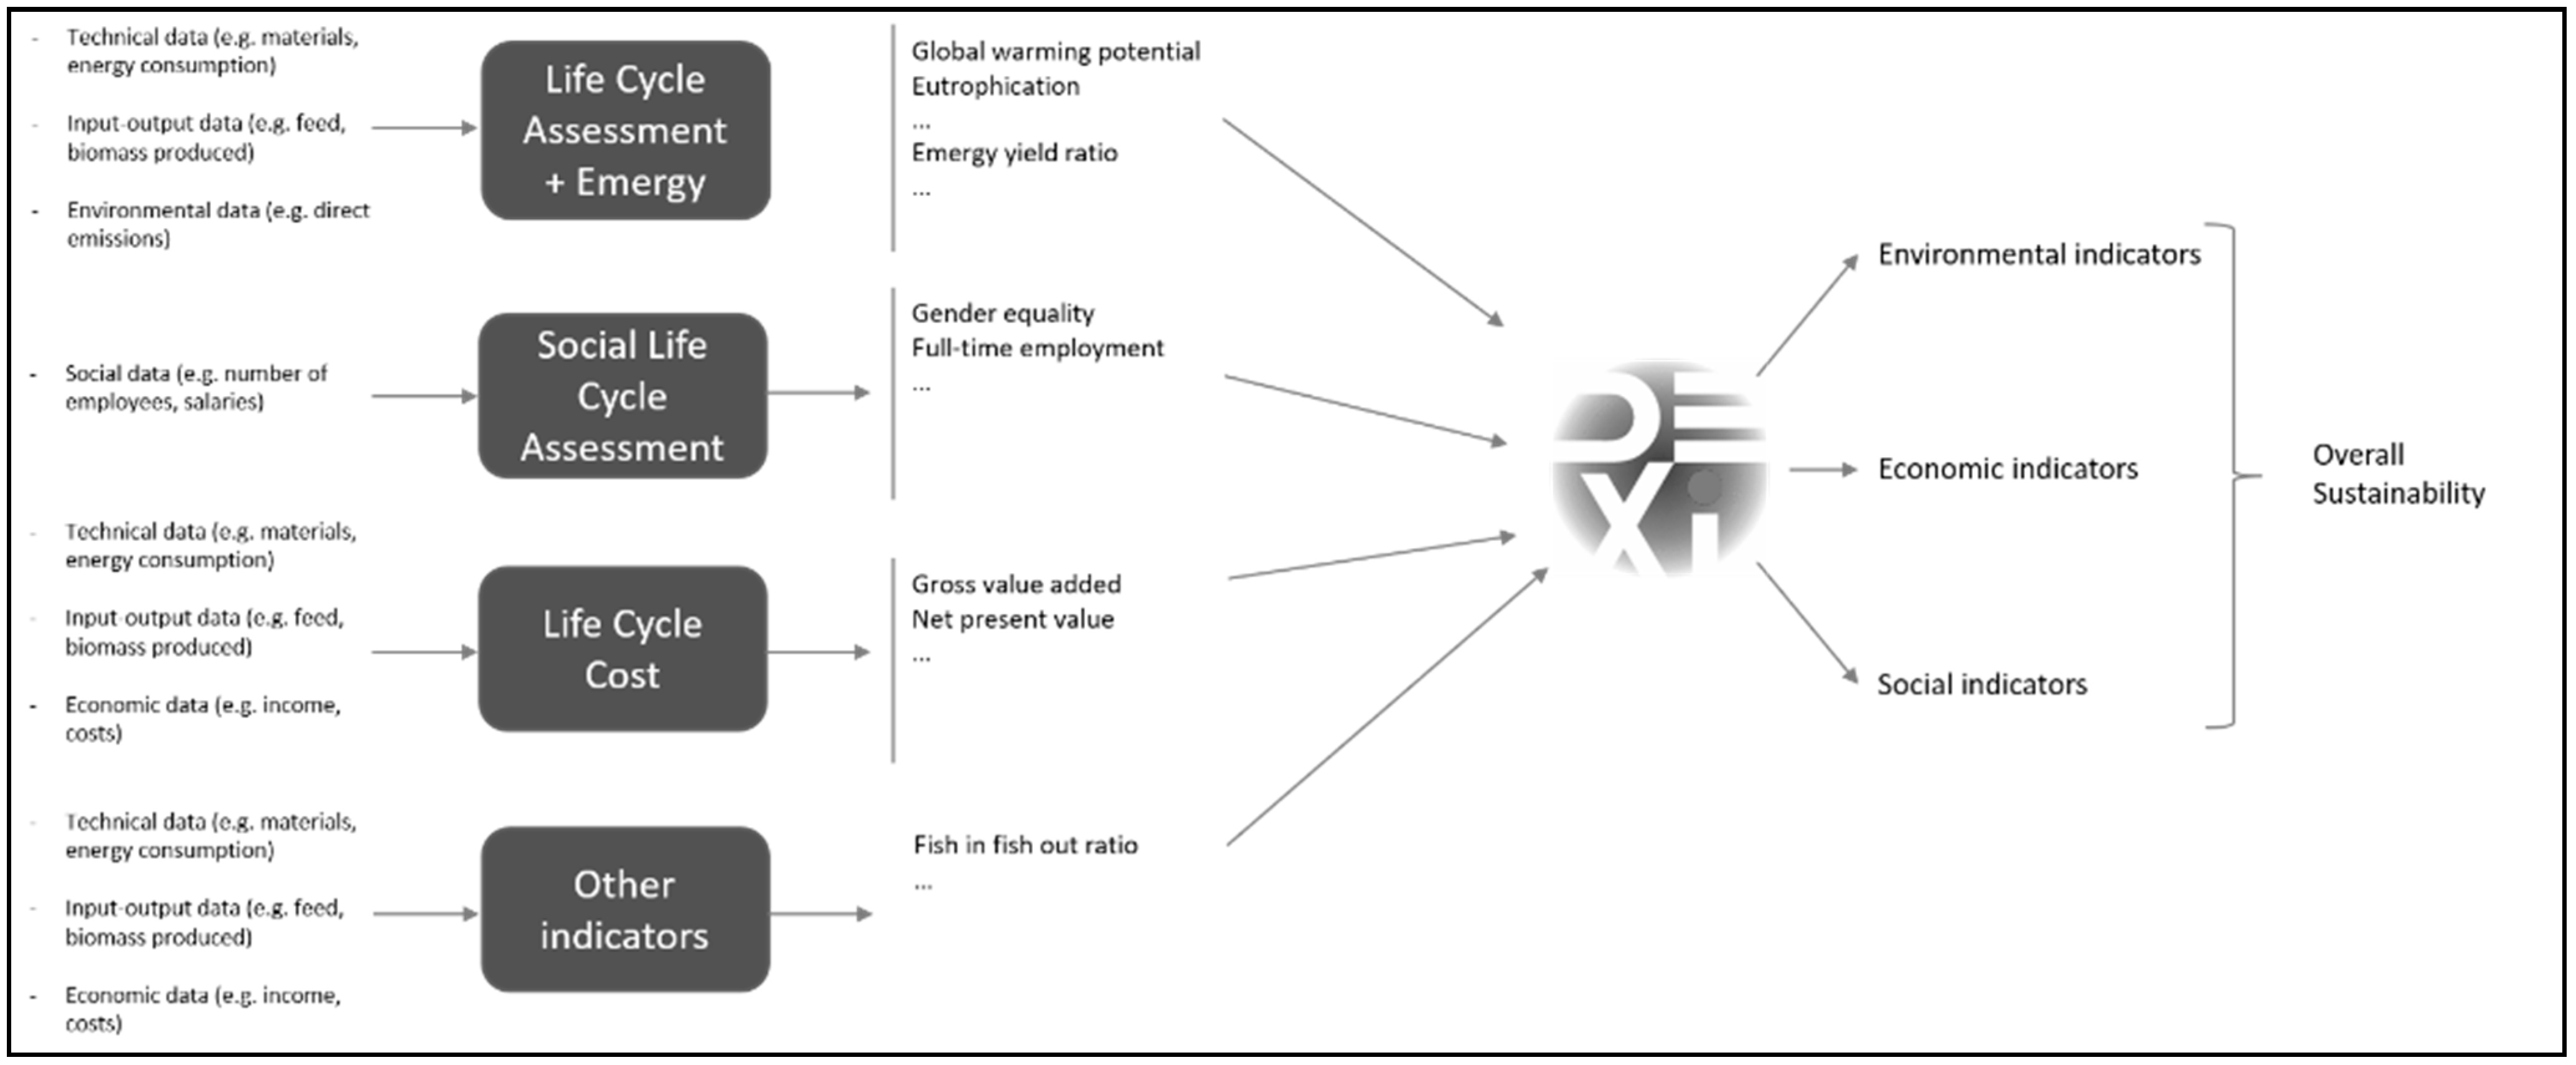
2.2.4. Data Collection and Attribute Calculation Template
- Collect data for the DEXiAqua tree, including those needed for LCA, emergy analysis, LCC, and SLCA (Figure 3);
- Perform additional calculations to transform input data into DEXi attributes;
- Determine a scale for each DEXi attribute by combining the data set with defined thresholds;
- Generate the list of scales formatted for import into DEXi software and that correspond to the model developed.
- -
- Sheets to fill out:
- ○
- General system description;
- ○
- Input data;
- ○
- Calculation sheets: to help calculate input data;
- ○
- LCA sheets: to collect data used to calculate LCA impact categories.
- -
- Sheets to view and verify:
- ○
- Instructions;
- ○
- Secondary data calculation: calculate certain DEXi attributes from input data;
- ○
- Indicators: compile DEXi attributes and determine scales;
- ○
- DEXi export: format the scales into a list for import into the DEXi model for assessment.
2.3. Description of the Reference Case Study as a Synthetic Scenario
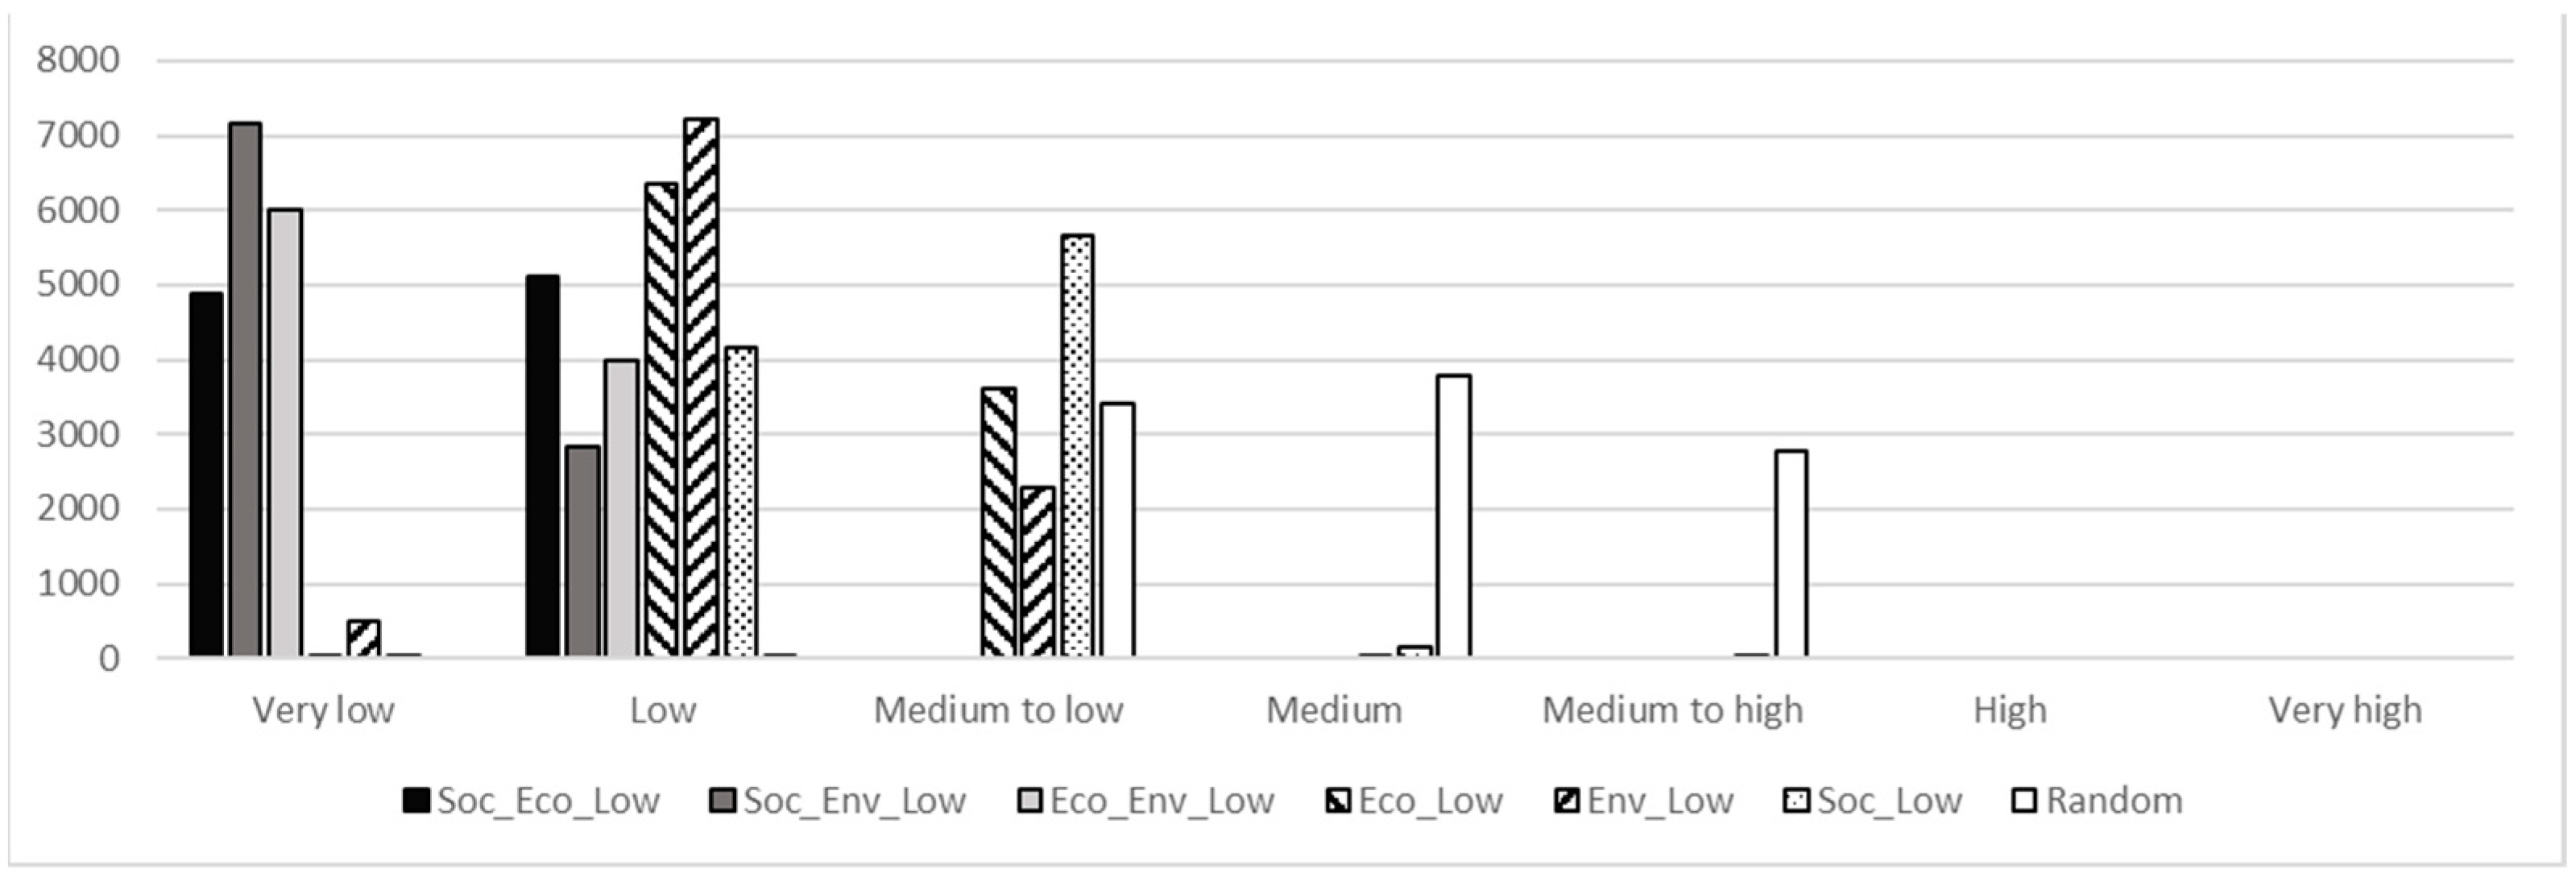
2.4. Initial Tests of the Sensitivity of DEXiAqua
- -
- “Random”: a completely randomized simulation in which the value of the scale of each attribute was randomly generated;
- -
- “Eco_Low”, “Env_Low”, and “Soc_Low”, in which all attributes of the given dimension received the worst score, while the values of the remaining attributes were randomly generated;
- -
- “Soc_Eco_Low”, “Soc_Env_Low”, and “Eco_Env_Low”, in which all attributes of the two given dimensions received the worst score, while the values of the remaining attributes were randomly generated.
3. Results
3.1. Attribute Tree, Scales, and Thresholds
3.2. Attribute Values and Scales of the Reference Case Study
3.3. DEXi Assessment Results for the Reference Case Study
4. Discussion
4.1. Developing a General Method to Assess the Sustainability of Aquaculture Systems
4.2. Questions about Increasing the Complexity and Diversity of the Systems and Assessing IMTA Systems from Prototype Data
4.3. Initial Results and Discussion of the Sensitivity of the Model
5. Conclusions
5.1. Theoretical Implications
5.2. Practical Implications
5.3. Limitations and Future Research
Supplementary Materials
Author Contributions
Funding
Institutional Review Board Statement
Informed Consent Statement
Acknowledgments
Conflicts of Interest
References
- Godfray, H.C.J.; Beddington, J.R.; Crute, I.R.; Haddad, L.; Lawrence, D.; Muir, J.F.; Pretty, J.; Robinson, S.; Thomas, S.M.; Toulmin, C. Food Security: The Challenge of Feeding 9 Billion People. Science 2010, 327, 812–818. [Google Scholar] [CrossRef] [PubMed]
- FAO. The State of World Fisheries and Aquaculture 2020; FAO: Rome, Italy, 2020. [Google Scholar] [CrossRef]
- Valenti, W.C.; Kimpara, J.M.; Preto, B.D.L.; Moraes-Valenti, P. Indicators of sustainability to assess aquaculture systems. Ecol. Indic. 2018, 88, 402–413. [Google Scholar] [CrossRef]
- Pelletier, N.; Tyedmers, P. Feeding farmed salmon: Is organic better? Aquaculture 2007, 272, 399–416. [Google Scholar] [CrossRef]
- Pelletier, N.; Tyedmers, P. Life Cycle Considerations for Improving Sustainability Assessments in Seafood Awareness Campaigns. Environ. Manag. 2008, 42, 918–931. [Google Scholar] [CrossRef] [PubMed]
- Pelletier, N.; Tyedmers, P.; Sonesson, U.; Scholz, A.; Ziegler, F.; Flysjo, A.; Kruse, S.; Cancino, B.; Silverman, H. Not All Salmon Are Created Equal: Life Cycle Assessment (LCA) of Global Salmon Farming Systems. Environ. Sci. Technol. 2009, 43, 8730–8736. [Google Scholar] [CrossRef] [PubMed]
- Ford, J.S.; Pelletier, N.L.; Ziegler, F.; Scholz, A.J.; Tyedmers, P.; Sonesson, U.; Kruse, S.A.; Silverman, H. Proposed Local Ecological Impact Categories and Indicators for Life Cycle Assessment of Aquaculture. J. Ind. Ecol. 2012, 16, 254–265. [Google Scholar] [CrossRef]
- Zamprogna, A.; Fratoni, S.; Buis, J.; John, S.; Ong, X.; Khajouei, E.; Kathirampatti, R. Insects and Derived Products as Ingredient for Fish Feed; Wageningen University: Wageningen, The Netherlands, 2017. [Google Scholar] [CrossRef]
- Thévenot, A.; Rivera, J.L.; Wilfart, A.; Maillard, F.; Hassouna, M.; Kiesse, T.S.; Feon, S.; Aubin, J. Mealworm meal for animal feed: Environmental assessment and sensitivity analysis to guide future prospects. J. Clean. Prod. 2018, 170, 1260–1267. [Google Scholar] [CrossRef]
- Philis, G.; Gracey, E.O.; Gansel, L.C.; Fet, A.M.; Rebours, C. Comparing the primary energy and phosphorus consumption of soybean and seaweed-based aquafeed proteins—A material and substance flow analysis. J. Clean. Prod. 2018, 200, 1142–1153. [Google Scholar] [CrossRef]
- Feon, S.L.; Thévenot, A.; Maillard, F.; Macombe, C.; Forteau, L.; Aubin, J. Life Cycle Assessment of fish fed with insect meal: Case study of mealworm inclusion in trout feed, in France. Aquaculture 2019, 500, 82–91. [Google Scholar] [CrossRef]
- Malcorps, W.; Kok, B.; Land, M.V.; Fritz, M.; Van Doren, D.; Servin, K.; Van Der Heijden, P.; Palmer, R.; Auchterlonie, N.; Rietkerk, M.; et al. The Sustainability Conundrum of Fishmeal Substitution by Plant Ingredients in Shrimp Feeds. Sustainability 2019, 11, 1212. [Google Scholar] [CrossRef]
- Maiolo, S.; Parisi, G.; Biondi, N.; Lunelli, F.; Tibaldi, E.; Pastres, R. Fishmeal partial substitution within aquafeed formulations: Life cycle assessment of four alternative protein sources. Int. J. Life Cycle Assess. 2020, 25, 1455–1471. [Google Scholar] [CrossRef]
- European Commission. Communication from the Commission to the European Parliament, the Council, the European Economic and Social Committee and the Committee of the Regions. Strategic Guidelines for the Sustainable Development of EU Aquaculture; European Commission: Brussels, Belgium, 2013; Volume 229. [Google Scholar]
- Neori, A.; Chopin, T.; Troell, M.; Buschmann, A.; Kraemer, G.P.; Halling, C.; Shpigel, M.; Yarish, C. Integrated aquaculture: Rationale, evolution and state of the art emphasizing seaweed biofiltration in modern mariculture. Aquaculture 2004, 231, 361–391. [Google Scholar] [CrossRef]
- Granada, L.; Sousa, N.; Lopes, S.; Lemos, M.F.L. Is integrated multitrophic aquaculture the solution to the sectors’ major challenges?—A review. Rev. Aquac. 2015, 8, 283–300. [Google Scholar] [CrossRef]
- Cunha, M.; Quental-Ferreira, H.; Parejo, A.; Gamito, S.; Ribeiro, L.; Moreira, M.; Monteiro, I.; Soares, F.; Pousão-Ferreira, P. Understanding the individual role of fish, oyster, phytoplankton and macroalgae in the ecology of integrated production in earthen ponds. Aquaculture 2019, 512, 734297. [Google Scholar] [CrossRef]
- Waller, U.; Buhmann, A.K.; Ernst, A.; Hanke, V.; Kulakowski, A.; Wecker, B.; Orellana, J.; Papenbrock, J. Integrated multi-trophic aquaculture in a zero-exchange recirculation aquaculture system for marine fish and hydroponic halophyte production. Aquac. Int. 2015, 23, 1473–1489. [Google Scholar] [CrossRef]
- Marques, B.; Lillebø, A.; Nunes, C.; Coimbra, M.; Calado, R.; Ricardo, F. Adding value to ragworms (Hediste diversicolor) through the bioremediation of a super-intensive marine fish farm. Aquac. Environ. Interact. 2018, 10, 79–88. [Google Scholar] [CrossRef]
- Frankic, A.; Hershner, C. Sustainable aquaculture: Developing the promise of aquaculture. Aquac. Int. 2003, 11, 517–530. [Google Scholar] [CrossRef]
- Van Woensel, L.; Archer, G.; Panades-Estruch, L.; Vrscaj, D. Ten Technologies Which Could Change our Lives: Potential Impacts and Policy Implications: In-Depth Analysis; STOA: Brussels, Belgium, 2015. [Google Scholar]
- Kleitou, P.; Kletou, D.; David, J. Is Europe ready for integrated multi-trophic aquaculture? A survey on the perspectives of European farmers and scientists with IMTA experience. Aquaculture 2018, 490, 136–148. [Google Scholar] [CrossRef]
- Pope, J.; Annandale, D.; Morrison-Saunders, A. Conceptualising sustainability assessment. Environ. Impact Assess. Rev. 2004, 24, 595–616. [Google Scholar] [CrossRef]
- Lairez, J.; Feschet, P.; Aubin, J.; Bockstaller, C.; Bouvarel, I. Agriculture et Développement Durable: Guide pour L’évaluation Multicritère; Éditions Quae: Versailles, France, 2015. [Google Scholar]
- Lazard, J.; Rey-Valette, H.; Clément, O.; Aubin, J.; Mathé, S.; Chia, E.; Legendre, M.; Caruso, D.; Mikolasek, O.; Blancheton, J.-P.; et al. (Eds.) Guide de Co-Construction D’indicateurs de Développement Durable en Aquaculture. EVAD. 2008. Available online: https://agritrop.cirad.fr/548449/ (accessed on 27 January 2021).
- Lazard, J.; Rey-Valette, H.; Aubin, J.; Mathé, S.; Chia, E.; Caruso, D.; Mikolasek, O.; Blancheton, J.P.; Legendre, M.; René, F.; et al. Assessing aquaculture sustainability: A comparative methodology. Int. J. Sustain. Dev. World Ecol. 2014, 21, 503–511. [Google Scholar] [CrossRef][Green Version]
- Belton, V.; Stewart, T.J.; Belton, V.; Stewart, T.J. Multiple Criteria Decision Analysis: An Integrated Approach. 2002. Available online: https://pureportal.strath.ac.uk/en/publications/multiple-criteria-decision-analysis-an-integrated-approach (accessed on 27 January 2021).
- Bohanec, M. DEXi: Program for Multi-Attribute Decision Making, User’s Manual, Version 3.03; IJS Report DP-10707; Jozef Stefan Institute: Ljubljana, Slovenia, 2011; Available online: http://www-ai.ijs.si/MarkoBohanec/pub/DEXiManual303.pdf (accessed on 14 January 2020).
- Sadok, W.; Angevin, F.; Bergez, J.-É.; Bockstaller, C.; Colomb, B.; Guichard, L.; Reau, R.; Doré, T. Ex ante assessment of the sustainability of alternative cropping systems: Implications for using multi-criteria decision-aid methods. A review. Agron. Sustain. Dev. 2008, 28, 163–174. [Google Scholar] [CrossRef]
- Sadok, W.; Angevin, F.; Bergez, J.-E.; Bockstaller, C.; Colomb, B.; Guichard, L.; Reau, R.; Messéan, A.; Doré, T. MASC, a qualitative multi-attribute decision model for ex ante assessment of the sustainability of cropping systems. Agron. Sustain. Dev. 2009, 29, 447–461. [Google Scholar] [CrossRef]
- Bergez, J.-E. Using a genetic algorithm to define worst-best and best-worst options of a DEXi-type model: Application to the MASC model of cropping-system sustainability. Comput. Electron. Agric. 2013, 90, 93–98. [Google Scholar] [CrossRef]
- Pelzer, E.; Fortino, G.; Bockstaller, C.; Angevin, F.; Lamine, C.; Moonen, C.; Vasileiadis, V.; Guérin, D.; Guichard, L.; Reau, R.; et al. Assessing innovative cropping systems with DEXiPM, a qualitative multi-criteria assessment tool derived from DEXi. Ecol. Indic. 2012, 18, 171–182. [Google Scholar] [CrossRef]
- Vasileiadis, V.; Moonen, A.C.; Sattin, M.; Otto, S.; Pons, X.; Kudsk, P.; Veres, A.; Dorner, Z.; van der Weide, R.; Marraccini, E.; et al. Sustainability of European maize-based cropping systems: Economic, environmental and social assessment of current and proposed innovative IPM-based systems. Eur. J. Agron. 2013, 48, 1–11. [Google Scholar] [CrossRef]
- Estorgues, V.; Lecuyer, G.; Allainguillaume, J.; Faloya, V. DEXiPM—Field Vegetables: Un modèle d’analyse ex ante de la durabilité des systèmes légumiers. Innov. Agron. 2017. [Google Scholar] [CrossRef]
- Colomb, B.; Carof, M.; Aveline, A.; Bergez, J.-E. Stockless organic farming: Strengths and weaknesses evidenced by a multicriteria sustainability assessment model. Agron. Sustain. Dev. 2012, 33, 593–608. [Google Scholar] [CrossRef]
- Alaphilippe, A.; Angevin, F.; Guérin, A.; Guillermin, P.; Vélu, A.; Zavagli, F. DEXiFruits, un outil d’évaluation multicritère des systèmes de production de fruits: D’un outil recherche à un outil terrain. Un outil co-construit. Innov. Agron. 2017. [Google Scholar] [CrossRef]
- Rezaei, M.E.; Barmaki, M.; Veisi, H. Sustainability assessment of potato fields using the DEXi decision support system in Hamadan Province, Iran. J. Integr. Agric. 2018, 17, 2583–2595. [Google Scholar] [CrossRef]
- Bockstaller, C.; Beauchet, S.; Manneville, V.; Amiaud, B.; Botreau, R. A tool to design fuzzy decision trees for sustainability assessment. Environ. Model. Softw. 2017, 97, 130–144. [Google Scholar] [CrossRef]
- Bohanec, M.; Cortet, J.; Griffiths, B.; Žnidaršič, M.; Debeljak, M.; Caul, S.; Thompson, J.; Krogh, P.H. A qualitative multi-attribute model for assessing the impact of cropping systems on soil quality. Pedobiologia 2007, 51, 239–250. [Google Scholar] [CrossRef]
- Bohanec, M.; Messéan, A.; Scatasta, S.; Angevin, F.; Griffiths, B.; Krogh, P.H.; Žnidaršič, M.; Džeroski, S. A qualitative multi-attribute model for economic and ecological assessment of genetically modified crops. Ecol. Model. 2008, 215, 247–261. [Google Scholar] [CrossRef]
- Rossi, L.; Bibbiani, C.; Fierro-Sañudo, J.F.; Maibam, C.; Incrocci, L.; Pardossi, A.; Fronte, B. Selection of marine fish for integrated multi-trophic aquaponic production in the Mediterranean area using DEXi multi-criteria analysis. Aquaculture 2021, 535, 736402. [Google Scholar] [CrossRef]
- Bohanec, M. DEXi: A Program for Multi-Attribute Decision Making. 2020. Available online: https://kt.ijs.si/MarkoBohanec/dexi.html (accessed on 12 January 2021).
- ISO. ISO 14044:2006 Environmental Management—Life Cycle Assessment—Requirements and Guidelines; International Organization for Standardization: London, UK, 2006. [Google Scholar]
- ISO. ISO-14040:2006 Environmental Management—Life Cycle Assessment—Principles and Framework; International Organization for Standardization: London, UK, 2006. [Google Scholar]
- Aubin, J.; Papatryphon, E.; van der Werf, H.; Chatzifotis, S. Assessment of the environmental impact of carnivorous finfish production systems using life cycle assessment. J. Clean. Prod. 2009, 17, 354–361. [Google Scholar] [CrossRef]
- Samuel-Fitwi, B.; Nagel, F.; Meyer, S.; Schroeder, J.; Schulz, C. Comparative life cycle assessment (LCA) of raising rainbow trout (Oncorhynchus mykiss) in different production systems. Aquac. Eng. 2013, 54, 85–92. [Google Scholar] [CrossRef]
- Chen, X.; Samson, E.; Tocqueville, A.; Aubin, J. Environmental assessment of trout farming in France by life cycle assessment: Using bootstrapped principal component analysis to better define system classification. J. Clean. Prod. 2015, 87, 87–95. [Google Scholar] [CrossRef]
- Czyrnek-Delêtre, M.M.; Rocca, S.; Agostini, A.; Giuntoli, J.; Murphy, J.D. Life cycle assessment of seaweed biomethane, generated from seaweed sourced from integrated multi-trophic aquaculture in temperate oceanic climates. Appl. Energy 2017, 196, 34–50. [Google Scholar] [CrossRef]
- Chary, K.; Aubin, J.; Sadoul, B.; Fiandrino, A.; Covès, D.; Callier, M.D. Integrated multi-trophic aquaculture of red drum (Sciaenops ocellatus) and sea cucumber (Holothuria scabra): Assessing bioremediation and life-cycle impacts. Aquaculture 2020, 516, 734621. [Google Scholar] [CrossRef]
- ILCD. Supporting Information to the Characterization Factors of Recommended EF Life Cycle Impact Assessment Methods: New Methods and Differences with ILCD; Publications Office of the EU: Luxembourg, 2018; Available online: https://data.europa.eu/doi/10.2760/671368 (accessed on 1 April 2021).
- Röhrlich, M.; Mistry, M.; Martens, P.N.; Buntenbach, S.; Ruhrberg, M.; Dienhart, M.; Briem, S.; Quinkertz, R.; Alkan, Z.; Kugeler, K. A method to calculate the cumulative energy demand (CED) of lignite extraction. Int. J. Life Cycle Assess. 2000, 5, 369–373. [Google Scholar] [CrossRef]
- Boulay, A.-M.; Bare, J.; De Camillis, C.; Döll, P.; Gassert, F.; Gerten, D.; Humbert, S.; Inaba, A.; Itsubo, N.; Lemoine, Y.; et al. Consensus building on the development of a stress-based indicator for LCA-based impact assessment of water consumption: Outcome of the expert workshops. Int. J. Life Cycle Assess. 2015, 20, 577–583. [Google Scholar] [CrossRef]
- Papatryphon, E.; Petit, J.; Kaushik, S.J.; Van Der Werf, H.M.G. Environmental Impact Assessment of Salmonid Feeds Using Life Cycle Assessment (LCA). Ambio 2004, 33, 316–323. [Google Scholar] [CrossRef] [PubMed]
- Odum, H.T. Environmental Accounting: EMERGY and Environmental Decision Making; Wiley: New York, NY, USA, 1996. [Google Scholar]
- Li, L.; Lu, H.; Ren, H.; Kang, W.; Chen, F. Emergy evaluations of three aquaculture systems on wetlands surrounding the Pearl River Estuary, China. Ecol. Indic. 2011, 11, 526–534. [Google Scholar] [CrossRef]
- Williamson, T.R.; Tilley, D.R.; Campbell, E. Emergy analysis to evaluate the sustainability of two oyster aquaculture systems in the Chesapeake Bay. Ecol. Eng. 2015, 85, 103–120. [Google Scholar] [CrossRef]
- Wilfart, A.; Prudhomme, J.; Blancheton, J.-P.; Aubin, J. LCA and emergy accounting of aquaculture systems: Towards ecological intensification. J. Environ. Manag. 2013, 121, 96–109. [Google Scholar] [CrossRef]
- Swarr, T.E.; Hunkeler, D.; Klöpffer, W.; Pesonen, H.-L.; Ciroth, A.; Brent, A.; Pagan, R. Environmental life-cycle costing: A code of practice. Int. J. Life Cycle Assess. 2011, 16, 389–391. [Google Scholar] [CrossRef]
- Costa, D.; Quinteiro, P.; Dias, A. A systematic review of life cycle sustainability assessment: Current state, methodological challenges, and implementation issues. Sci. Total. Environ. 2019, 686, 774–787. [Google Scholar] [CrossRef] [PubMed]
- Commission of the European Union Joint Research Centre. Social Life Cycle Assessment: State of the Art and Challenges for Product Policy Support; Publications Office of the EU: Luxembourg, 2015; Available online: https://data.europa.eu/doi/10.2788/53485 (accessed on 4 January 2021).
- Andrews, E.S.; Barthel, L.-P.; Beck, T. Guidelines for Social Life Cycle Assessment of Products; United Nations Environment Programme: Paris, France, 2013; Available online: https://www.deslibris.ca/ID/236529 (accessed on 12 April 2021).
- UNEP. Guidelines for Social Life Cycle Assessment of Products and Organizations 2020; Benoît-Norris, C., Traverso, M., Neugebauer, S., Ekener, E., Schaubroeck, T., Russo Garrido, S., Berger, M., Valdivia, S., Lehmann, A., Finkbeiner, M., et al., Eds.; United Nations Environment Programme (UNEP): Cambridge, UK, 2020. [Google Scholar]
- Garrido, S.R.; Parent, J.; Beaulieu, L.; Revéret, J.-P. A literature review of type I SLCA—Making the logic underlying methodological choices explicit. Int. J. Life Cycle Assess. 2016, 23, 432–444. [Google Scholar] [CrossRef]
- Pelletier, N. Social Sustainability Assessment of Canadian Egg Production Facilities: Methods, Analysis, and Recommendations. Sustainability 2018, 10, 1601. [Google Scholar] [CrossRef]
- Zira, S.; Röös, E.; Ivarsson, E.; Hoffmann, R.; Rydhmer, L. Social life cycle assessment of Swedish organic and conventional pork production. Int. J. Life Cycle Assess. 2020, 25, 1957–1975. [Google Scholar] [CrossRef]
- EU/JRC. Economic Report of the EU Aquaculture Sector (STECF-18-19); Publications Office of the EU: Luxembourg, 2018; Available online: https://data.europa.eu/doi/10.2760/45076 (accessed on 20 April 2021).
- Iversen, A.; Asche, F.; Hermansen, Ø.; Nystøyl, R. Production cost and competitiveness in major salmon farming countries 2003–2018. Aquaculture 2020, 522, 735089. [Google Scholar] [CrossRef]
- Craheix, D.; Bergez, J.-E.; Angevin, F.; Bockstaller, C.; Bohanec, M.; Colomb, B.; Doré, T.; Fortino, G.; Guichard, L.; Pelzer, E.; et al. Guidelines to design models assessing agricultural sustainability, based upon feedbacks from the DEXi decision support system. Agron. Sustain. Dev. 2015, 35, 1431–1447. [Google Scholar] [CrossRef]
- Carpani, M.; Bergez, J.-E.; Monod, H. Sensitivity analysis of a hierarchical qualitative model for sustainability assessment of cropping systems. Environ. Model. Softw. 2012, 27–28, 15–22. [Google Scholar] [CrossRef]


| Attribute—Sub-Attribute—Indicator | Weight | Scale | Thresholds 1 | Unit |
|---|---|---|---|---|
| Environmental sustainability | [Very Low; Low; Medium; High; Very High] | |||
| Reduce negative impacts on ecosystems | 30% | [Very Low; Low; Medium; High; Very High] | ||
| Negative local impacts on ecosystems | 60% | [Very High; High; Medium; Low; Very Low] | ||
| Chemical and contaminant emissions | 30% | [High; Medium; Low] | ||
| Health costs | [High; Medium; Low] | []∞; 0.06[; [0.06; 0.04[; [0.04; 0]] | €/kg | |
| Contribution to local eutrophication | 45% | [High; Medium; Low] | ||
| Total nitrogen emissions | 70% | [High; Medium; Low] | []∞; 94[; [94; 40[; [40; 0]] | kg/ton |
| Suspended solid emissions | 30% | [High; Medium; Low] | []∞; 405[; [405; 57[; [57; 0]] | kg/ton |
| Local land competition | 25% | [High; Medium; Low] | ||
| On-farm land area used | [High; Medium; Low] | []∞; 4[; [4; 0.2[; [0.2; 0]] | m²/ton | |
| Negative global impacts on ecosystems | 40% | [Very High; High; Medium; Low; Very Low] | ||
| Contribution to climate change | 40% | [Very High; High; Medium; Low; Very Low] | ||
| Global warming potential | [Very High; High; Medium; Low; Very Low] | []∞; 8[; [8; 6[; [6; 4.5[; [4.5; 2[; [2; 0]] | ton CO2 equivalent/ton | |
| Contribution to acidification | 25% | [High; Medium; Low] | ||
| Acidification potential | [High; Medium; Low] | []∞; 35[; [35; 15[; [15; 0]] | kg SO2 equivalent/ton | |
| Contribution to eutrophication | 35% | [High; Medium; Low] | ||
| Eutrophication potential | [High; Medium; Low] | []∞; 70[; [70; 35[; [35; 0]] | kg PO43− equivalent/ton | |
| Respect availability of natural resources | 30% | [Very Low; Low; Medium; High; Very High] | ||
| Use sustainable resources | 50% | [Very Low; Low; Medium; High; Very High] | ||
| Use sustainable feed | 45% | [Very Low; Low; Medium; High; Very High] | ||
| Fish In:Fish Out ratio | [Very High; High; Medium; Low; Very Low] | []∞; 6[; [6; 4.5[; [4.5; 3[; [3; 1.5[; [1.5; 0]] | # | |
| Sustainable supply of juveniles and seeds | 25% | [Low; Medium; High] | ||
| Percentage of wild juveniles and seeds used | [High; Medium; Low] | []∞; 50[; [50; 10[; [10; 0]] | % | |
| Level of renewability of the activity | 30% | [Low; Medium; High] | ||
| Percentage of renewability | [Low; Medium; High] | []∞; 40[; [40; 20[; [20; 0]] | % | |
| Limit the use of resources | 50% | [Very Low; Low; Medium; High; Very High] | ||
| Pressure on water | 30% | [High; Medium; Low] | ||
| Water demand | [High; Medium; Low; Very Low] | []∞; 125[; [125; 10[; [10; 1[; [1; 0]] | m3/kg | |
| Pressure on primary production | 20% | [High; Medium; Low] | ||
| Net primary production use | [High; Medium; Low] | []∞; 85[; [85; 15[; [15; 0]] | kg C equivalent/kg | |
| Pressure on land area | 20% | [Very High; High; Medium; Low; Very Low] | ||
| Global land competition | [Very High; High; Medium; Low; Very Low] | []∞; 5500[; [5500; 2500[; [2500; 1500[; [1500; 800[; [800; 0]] | m²/ton | |
| Energy requirements | 30% | [Very High; High; Medium; Low; Very Low] | ||
| Total cumulative energy demand | [Very High; High; Medium; Low; Very Low] | []∞; 110[; [110; 70[; [70; 45[; [45; 30[; [30; 0]] | GJ/ton | |
| Increase ecological efficiency | 30% | [Very Low; Low; Medium; High; Very High] | ||
| Limit waste production and increase recycling | 30% | [Very Low; Low; Medium; High; Very High] | ||
| Use co-products as inputs | 40% | [Low; Medium; High] | ||
| Percentage of nitrogen derived from co-products | [Low; Medium; High] | []∞; 50[; [50; 20[; [20; 0]] | % | |
| Waste recycling | 40% | [Low; Medium; High] | ||
| Percentage of phosphorus recovered | [Low; Medium; High] | []∞; 30[; [30; 10[; [10; 0]] | % | |
| Limit organic waste production | 20% | [Very Low; Low; Medium; High; Very High] | ||
| Production loss | [Very High; High; Medium; Low; Very Low] | []∞; 40[; [40; 30[; [30; 20[; [20; 10[; [10; 0]] | % | |
| Farm input efficiency | 50% | [Very Low; Low; Medium; High; Very High] | ||
| Productivity of energy used | 50% | [Very Low; Low; Medium; High; Very High] | ||
| On-farm energy efficiency | 50% | [Very Low; Low; Medium; High; Very High] | [[0; 0.5[; [0.5; 1[; [1; 1.5[; [1.5; 5[; [5; ∞]] | MWh/ton |
| Percentage of renewable energy used | 50% | [Low; Medium; High] | ||
| Feed efficiency | 50% | [Very Low; Low; Medium; High; Very High] | ||
| Total feed conversion rate | 70% | [Very High; High; Medium; Low; Very Low] | []∞; 2.2[; [2.2; 1.8[; [1.8; 1.6[; [1.6; 1.3[; [1.3; 0]] | kg/kg |
| Nitrogen-use efficiency | 30% | [Low; Medium; High] | []∞; 30[; [30; 15[; [15; 0]] | % |
| Use local resources | 20% | [Very Low; Low; Medium; High; Very High] | ||
| Feedstuff locally produced | 50% | [Low; Medium; High] | []∞; 60[; [60; 40[; [40; 0]] | % |
| Emergy yield ratio | 50% | [Low; Medium; High] | []∞; 2[; [2; 1.1[; [1.1; 0]] | # |
| Enhance biodiversity | 10% | [Very Low; Low; Medium; High; Very High] | ||
| Protection of local fauna and flora species | 35% | [Very Low; Low; Medium; High] | ||
| Predator control | 40% | [Not Acceptable; Acceptable] | [Option 1; Option 2] 2 | # |
| Disease management | 60% | [Low; Medium; High] | ||
| Biosecurity and good practices | [Low; Medium; High] | []∞; 4[; [4; 2[; [2; 0]] | # | |
| Foster polyculture and integrate natural cycles | 35% | [Very Low; Low; Medium; High] | ||
| Multitrophic integration | 50% | [Low; Medium; High] | []∞; 3[; [3; 2[; [2; 0]] | # |
| Production diversification | 50% | [Low; Medium; High] | []∞; 5[; [5; 2[; [2; 0]] | # |
| Maintenance of genetic diversity | 30% | [Low; Medium; High] | ||
| Escapee management | [High; Medium; Low] | []∞; 4[; [4; 0.5[; [0.5; 0]] | %Ù |
| Attribute—Sub-Attribute—Indicator | Weight | Scale | Thresholds 1 | Unit |
|---|---|---|---|---|
| Social sustainability | [Very Low; Low; Medium; High; Very High] | |||
| Relationship with other stakeholders | 15% | [Very Low; Low; Medium; High; Very High] | ||
| Quality of the relationship with professional institutions | 50% | [Low; Medium; High] | ||
| Interactions with professional institutions | 60% | [Low; Medium; High] | [Option 1; Option 2; Option 3] 2 | # |
| Professional involvement | 40% | [Low; Medium; High] | []∞; 5[; [5; 1[; [1; 0]] | # |
| Quality of the relationship with customers and suppliers 3 | 50% | [Low; Medium; High] | ||
| Independence from suppliers | 100% | [Low; Medium; High] | []∞; 50[; [50; 30[; [30; 0]] | % |
| Independence from customers | 0% | [Low; Medium; High] | []∞; 50[; [50; 25[; [25; 0]] | % |
| Employment and working conditions | 30% | [Very Low; Low; Medium; High; Very High] | ||
| Guarantee of staff protection and fulfillment | 50% | [Very Low; Low; Medium; High; Very High] | ||
| Workload | 25% | [High; Medium; Low] | []∞; 2200[; [2200; 1600[; [1600; 0]] | h/FTE/year |
| Health and safety | 30% | [Low; Medium; High] | []∞; 2[; [2; 1[; [1; 0]] | Number of days lost/1000 h |
| Assessment of job difficulty | 15% | [High; Medium; Low] | [Option 1; Option 2; Option 3] | # |
| Labor remuneration | 30% | [Low; Medium; High] | []∞; 1.5[; [1.5; 1[; [1; 0]] | # |
| Conditions of employment | 50% | [Very Low; Low; Medium; High; Very High] | ||
| Working status | 25% | [Low; Medium; High] | []∞; 80[; [80; 60[; [60; 0]] | % |
| Education level | 35% | [Low; Medium; High] | []∞; 30[; [30; 10[; [10; 0]] | % |
| Equal opportunities | 40% | [Very Low; Low; Medium; High; Very High] | ||
| Gender equality | 70% | [Low; Medium; High] | [Option 1; Option 2; Option 3] 2 | # |
| Employment of workers with disabilities | 30% | [No; Yes] | [No; Yes] | # |
| Meeting societal expectations | 25% | [Very Low; Low; Medium; High; Very High] | ||
| Respect of animal welfare | 30% | [Very Low; Low; Medium; High; Very High] | ||
| Production health management | 50% | [Very Low; Low; Medium; High; Very High] | ||
| Production loss | 70% | [Very High; High; Medium; Low; Very Low] | []∞; 40[; [40; 30[; [30; 20[; [20; 10[; [10; 0]] | % |
| Fish physical damage | 30% | [High; Medium; Low] | []∞; 20[; [20; 4[; [4; 0]] | % |
| Rearing environment | 50% | [Very Low; Low; Medium; High; Very High] | ||
| Stocking density | 60% | [High; Medium; Low] | []∞; 45[; [45; 22[; [22; 0]] | kg/m3 |
| Biosecurity and good practices | 40% | [Low; Medium; High] | []∞; 4[; [4; 2[; [2; 0]] | # |
| Contribution to food security | 35% | [Very Low; Low; Medium; High; Very High] | ||
| Assured supply of food products | 50% | [Very Low; Low; Medium; High; Very High] | []∞; 17.5[; [17.5; 12.5[; [12.5; 7.5[; [7.5; 2.5[; [2.5; 0]] | ton of dry matter/FTE |
| Accessibility of products | 50% | [Very Low; Low; Medium; High; Very High] | [[0; 4[; [4; 4.5[; [4.5; 5.5[; [5.5; 6.5[; [6.5; ∞]] | # |
| Production of quality-based products | 35% | [Very Low; Low; Medium; High; Very High] | ||
| Level of product quality | [Very Low; Low; Medium; High; Very High] | |||
| Nutritional quality | 40% | [Very Low; Low; Medium; High; Very High] | []∞; 25[; [25; 20[; [20; 15[; [15; 10[; [10; 0]] | g [EPA + DHA]/100 g |
| Fish physical damage | 60% | [High; Medium; Low] | []∞; 20[; [20; 4[; [4; 0]] | % |
| Contribution to local development | 30% | [Very Low; Low; Medium; High; Very High] | ||
| Contribution to employment | 45% | [Very Low; Low; Medium; High; Very High] | ||
| Local supply | 35% | [Low; Medium; High] | ||
| Feedstuff locally produced | [Low; Medium; High] | []∞; 60[; [60; 40[; [40; 0]] | % | |
| Multifunctionality | 20% | [Low; Medium; High] | ||
| Education contribution | [Low; Medium; High] | [Option 1; Option 2; Option 3] | # |
| Attribute—Sub-Attribute—Indicator | Weight | Scale | Thresholds 1 | Unit |
|---|---|---|---|---|
| Economic sustainability | [Very Low; Low; Medium; High; Very High] | |||
| Production efficiency | 40% | [Very Low; Low; Medium; High; Very High] | ||
| Productivity | 45% | [Very Low; Low; Medium; High; Very High] | ||
| Resource productivity | 60% | [Very Low; Low; Medium; High; Very High] | ||
| On-farm energy efficiency | 40% | [Very Low; Low; Medium; High; Very High] | [[0; 0.5[; [0.5; 1[; [1; 1.5[; [1.5; 5[; [5; ∞]] | MWh/ton |
| Labor productivity | 30% | [Very Low; Low; Medium; High; Very High] | []∞; 2[; [2; 1.5[; [1.5; 1.25[; [1.25; 1[; [1; 0]] | # |
| Total feed conversion rate | 30% | [Very High; High; Medium; Low; Very Low] | []∞; 2.2[; [2.2; 1.8[; [1.8; 1.6[; [1.6; 1.3[; [1.3; 0]] | kg/kg |
| Production management | 40% | [Very Low; Low; Medium; High; Very High] | ||
| Production loss | 40% | [Very Low; Low; Medium; High; Very High] | ||
| Level of product quality | 60% | [Very Low; Low; Medium; High; Very High] | ||
| Nutritional quality | 40% | [Very Low; Low; Medium; High; Very High] | []∞; 25[; [25; 20[; [20; 15[; [15; 10[; [10; 0]] | g [EPA + DHA]/100 g |
| Fish physical damage | 60% | [High; Medium; Low] | []∞; 20[; [20; 4[; [4; 0]] | % |
| Sales price sufficient given production costs | 55% | [Very Low; Low; Medium; High; Very High] | ||
| Production value | 50% | [Very Low; Low; Medium; High; Very High] | ||
| Average sales price | [Very Low; Low; Medium; High; Very High] | []∞; 6.5[; [6.5; 5.5[; [5.5; 4.5[; [4.5; 4[; [4; 0]] | €/kg | |
| Production cost | 50% | [Very High; High; Medium; Low; Very Low] | ||
| Paid labor costs | 30% | [Very High; High; Medium; Low; Very Low] | []∞; 1[; [1; 0.8[; [0.8; 0.6[; [0.6; 0.4[; [0.4; 0]] | €/kg |
| Feed costs | 50% | [Very High; High; Medium; Low; Very Low] | []∞; 2[; [2; 1.7[; [1.7; 1.5[; [1.5; 1.3[; [1.3; 0]] | €/kg |
| Juvenile and seedling costs | 20% | [Very High; High; Medium; Low; Very Low] | []∞; 1.1[; [1.1; 0.9[; [0.9; 0.7[; [0.7; 0.5[; [0.5; 0]] | €/kg |
| Viability | 60% | [Very Low; Low; Medium; High; Very High] | ||
| Profitability | 50% | [Low; Medium; High] | ||
| Net present value | 50% | [Low; Medium; High] | [>0; = 0; < 0] | € |
| Internal rate of return | 50% | [Low; Medium; High] | [>6%; = 6%; < 6%] | % |
| Level of autonomy | 20% | [Very Low; Low; Medium; High] | ||
| Subsidy dependence | 40% | [High; Medium; Low] | ||
| Subsidies weight | [High; Medium; Low] | []∞; 0.42[; [0.42; 0.22[; [0.22; 0]] | €/kg | |
| Resource dependence | 40% | [High; Medium; Low] | ||
| Emergy yield ratio | [Low; Medium; High] | |||
| Vulnerability | 30% | [Very High; High; Medium; Low; Very Low] | ||
| Level of sensitivity to pathological risks | 25% | [Very High; High; Medium; Low] | ||
| Production diversification | 40% | [Low; Medium; High] | []∞; 5[; [5; 2[; [2; 0]] | # |
| Biosecurity and good practices | 60% | [Low; Medium; High] | []∞; 4[; [4; 2[; [2; 0]] | # |
| Resistance to environmental constraints | 35% | [Very Low; Low; Medium; High; Very High] | [[0; 6[; [6; 12[; [12; 18[; [18; 24[; [24; ∞]] | # |
| Resistance to commercial risks | 40% | [Low; Medium; High; Very High] | ||
| Specialization rate | 33% | [High; Medium; Low] | []∞; 80[; [80; 50[; [50; 0]] | % |
| Independence from suppliers | 33% | [Low; Medium; High] | []∞; 50[; [50; 30[; [30; 0]] | % |
| Independence from customers2 | 0% | [Low; Medium; High] | []∞; 50[; [50; 25[; [25; 0]] | % |
| Dependence on fisheries | 33% | [Very High; High; Medium; Low; Very Low] | ||
| Fish In:Fish Out ratio | [Very High; High; Medium; Low; Very Low] | []∞; 6[; [6; 4.5[; [4.5; 3[; [3; 1.5[; [1.5; 0]] | # |
| Indicator | Unit | Description |
|---|---|---|
| On-farm energy efficiency | MWh/ton | Quantity of energy used per ton of biomass produced |
| Total feed conversion rate | kg/kg | Quantity of feed used per kg of biomass produced |
| Labor productivity | # | Gross value added divided by total labor costs |
| Production loss | % | Percentage of biomass produced that is lost |
| Nutritional quality | g [EPA + DHA]/100 g | Quantity of omega-3 fatty acids per 100 g of biomass |
| Average sales price | €/kg | Gross sales per kg of biomass produced |
| Paid labor costs | €/kg | Labor costs per kg of biomass produced |
| Feed costs | €/kg | Feed costs per kg of biomass produced |
| Juvenile and seedling costs | €/kg | Juvenile and seedling costs per kg of biomass produced |
| Net present value | € | Sum of expected future cash flows discounted at the appropriate discount rate |
| Internal rate of return | % | Discount rate at which discounted benefits equal discounted costs |
| Subsidies weight | €/kg | Subsidies received per kg of biomass produced |
| Emergy yield ratio | # | Ability of the system to use local resources according to emergy accounting |
| Production diversification | # | Number of planned species reared in the system |
| Biosecurity and good practices | # | Score from 0–5 based on existing disinfection measures |
| Resistance to environmental constraints | # | Score from 0–36 based on the probability and severity of four environmental constraints |
| Specialization rate | % | Percentage of total income from the main product |
| Independence from suppliers | % | Percentage of total inputs that are self-produced |
| Independence from customers | % | Percentage of total income derived from the largest customer |
| Fish in:fish out ratio | # | Dependence of the system on wild fish resources |
| Interactions with professional institutions | # | Choice among options that considers the number of interactions and representatives |
| Professional involvement | # | Number of seminars or professional meetings attended per year |
| Workload | h/FTE/year | Number of hours worked per year per full-time equivalent (FTE) |
| Health and safety | days lost/1000 h | Number of sick-leave days per 1000 h worked |
| Assessment of job difficulty | # | Choice among options that considers job complexity and stressfulness |
| Labor remuneration | # | Average salary divided by the minimum wage of the country |
| Working status | % | Percentage of permanent contracts |
| Education level | % | Percentage of professionally trained employees |
| Gender equality | # | Percentage of employees who are women, and consideration of their relative pay |
| Employment of workers with disabilities | # | “Yes” if at least one worker with a disability in the past 5 years |
| Fish physical damage | % | Percentage of fish with skin or fin damage |
| Stocking density | kg/m3 | Average mass of biomass reared per m3 |
| Assured supply of food products | ton DM/FTE | Dry matter biomass produced per full-time equivalent |
| Accessibility of products | # | Average sales price compared to the monthly minimum wage of the country |
| Contribution to employment | FTE/100 000 € | Number of full-time equivalents per 100 000 euros of income |
| Feedstuff locally produced | % | Percentage of feedstuff produced in the country |
| Education contribution | # | Choice among options that considers the number of trainees, educational tours and presentations to students |
| Health costs | €/kg | Costs of chemicals per kg of biomass produced |
| Total nitrogen emissions | kg/ton | Quantity of nitrogen released per ton of biomass produced |
| Suspended solid emissions | kg/ton | Quantity of suspended solids released per ton of biomass produced |
| On-farm land area used | m²/ton | Area necessary per ton of biomass produced |
| Global warming potential | ton CO2 equivalent/ton | Quantity of greenhouse gases emitted by the system |
| Acidification potential | kg SO2 equivalent/ton | Contribution of the system to acidification of the surrounding environment |
| Eutrophication potential | kg PO43− equivalent/ton | Contribution of the system to eutrophication |
| Percentage of renewability | % | Ability of the system to use sustainable resources according to emergy accounting |
| Percentage of wild juveniles and seeds used | % | Percentage of juveniles and of wild fish and seeds of wild plants used |
| Water demand | m3/kg | System pressure on water resources |
| Net primary production use | kg C equivalent/kg | System pressure on biotic resources |
| Global land competition | m²/ton | System pressure on land occupation |
| Total cumulative energy demand | GJ/ton | Quantity of direct and indirect energy used by the system |
| Percentage of nitrogen derived from co-products | % | Percentage of feed and fertilizer from co-products and by-products |
| Percentage of phosphorus recovered | % | Percentage of phosphorus recycled by other organisms inside the system |
| Percentage of renewable energy used | % | Percentage of energy from renewable sources |
| Nitrogen-use efficiency | % | Percentage of nitrogen input recovered in output biomass |
| Predator control | # | Use, or not, of lethal predator control (not acceptable/acceptable) |
| Multitrophic integration | # | Number of trophic levels of planned reared species |
| Escapee management | % | Percentage of escapees |
| Attribute | Unit | Value | Scale |
|---|---|---|---|
| On-farm energy efficiency | MWh/ton | 5.33 | Very Low |
| Total feed conversion rate | kg/kg | 1.02 | Very Low |
| Labor productivity | # | 3.3 | Very High |
| Production loss | % | 0.8% | Very Low |
| Nutritional quality | g [EPA + DHA]/100 g | 20 | High |
| Average sales price | €/kg | 10 | Very High |
| Paid labor costs | €/kg | 1.1 | Very High |
| Feed costs | €/kg | 1.8 | High |
| Juvenile and seedling costs | €/kg | 0.1 | Very Low |
| Net present value | € | 4,546,362 | High |
| Internal rate of return | % | 87% | High |
| Subsidies weight | €/kg | 0 | Low |
| Emergy yield ratio | # | 1.07 | Low |
| Production diversification | # | 1 | Low |
| Biosecurity and good practices | # | 4 | High |
| Resistance to environmental constraints | # | 11 | High |
| Specialization rate | % | 100% | High |
| Independence from suppliers | % | 0 | Low |
| Independence from customers | % | 17.86% | High |
| Fish in:fish out ratio | # | 5.7 | High |
| Interactions with professional institutions | # | Option 1 | Low |
| Professional involvement | # | 3 | Medium |
| Workload | h/FTE/year | 2000 | Medium |
| Health and safety | days lost/1000 h | 0.75 | Low |
| Assessment of job difficulty | # | Option 2 | Medium |
| Labor remuneration | # | 1.64 | High |
| Working status | % | 100% | High |
| Education level | % | 100% | High |
| Gender equality | # | Option 3 | Low |
| Employment of workers with disabilities | # | Yes | Yes |
| Fish physical damage | % | 10% | Medium |
| Stocking density | kg/m3 | 20 | Low |
| Assured supply of food products | ton DM/FTE | 7.8 | Medium |
| Accessibility of products | # | 6.57 | Very Low |
| Contribution to employment | FTE/100 000 € | 0.36 | Very Low |
| Feedstuff locally produced | % | 0% | Low |
| Education contribution | # | Option 2 | Medium |
| Health costs | €/kg | 0.18 | High |
| Total nitrogen emissions | kg/ton | 22.7 | Low |
| Suspended solid emissions | kg/ton | 57.7 | Medium |
| On-farm land area used | m²/ton | 272.3 | High |
| Global warming potential | ton CO2 equivalent/ton | 3.14 | Low |
| Acidification potential | kg SO2 equivalent/ton | 12.8 | Low |
| Eutrophication potential | kg PO43− equivalent/ton | 34.3 | Low |
| Percentage of renewability | % | 10.66% | Low |
| Percentage of wild juveniles and seeds used | % | 0% | Low |
| Water demand | m3/kg | 124 | Medium |
| Net primary production use | kg C equivalent/kg | 32 | Medium |
| Global land competition | m²/ton | 1000 | Low |
| Total cumulative energy demand | GJ/ton | 105.8 | High |
| Percentage of nitrogen derived from co-products | % | 0% | Low |
| Percentage of phosphorus recovered | % | 18% | Medium |
| Percentage of renewable energy used | % | 0% | Low |
| Nitrogen-use efficiency | % | 58.4% | High |
| Predator control | # | Option 1 | Not acceptable |
| Multitrophic integration | # | 1 | Low |
| Escapee management | % | 0% | Low |
| Overall Sustainability Graph | Branch | Score | Sub-Branch | Score |
|---|---|---|---|---|
 | Environment | Medium | Reduce negative impacts on ecosystems | High |
| Respect availability of natural resources | Medium | |||
| Increase the ecological efficiency of the activity | Medium | |||
| Enhance biodiversity | Medium | |||
| Economy | High | Production efficiency | Medium | |
| Viability | High | |||
| Social | Low | Relationship with other stakeholders | Very low | |
| Employment and working conditions | Medium | |||
| Meeting social expectations | Medium | |||
| Contribution to local development | Very low |
Publisher’s Note: MDPI stays neutral with regard to jurisdictional claims in published maps and institutional affiliations. |
© 2021 by the authors. Licensee MDPI, Basel, Switzerland. This article is an open access article distributed under the terms and conditions of the Creative Commons Attribution (CC BY) license (https://creativecommons.org/licenses/by/4.0/).
Share and Cite
Le Féon, S.; Dubois, T.; Jaeger, C.; Wilfart, A.; Akkal-Corfini, N.; Bacenetti, J.; Costantini, M.; Aubin, J. DEXiAqua, a Model to Assess the Sustainability of Aquaculture Systems: Methodological Development and Application to a French Salmon Farm. Sustainability 2021, 13, 7779. https://doi.org/10.3390/su13147779
Le Féon S, Dubois T, Jaeger C, Wilfart A, Akkal-Corfini N, Bacenetti J, Costantini M, Aubin J. DEXiAqua, a Model to Assess the Sustainability of Aquaculture Systems: Methodological Development and Application to a French Salmon Farm. Sustainability. 2021; 13(14):7779. https://doi.org/10.3390/su13147779
Chicago/Turabian StyleLe Féon, Samuel, Théo Dubois, Christophe Jaeger, Aurélie Wilfart, Nouraya Akkal-Corfini, Jacopo Bacenetti, Michele Costantini, and Joël Aubin. 2021. "DEXiAqua, a Model to Assess the Sustainability of Aquaculture Systems: Methodological Development and Application to a French Salmon Farm" Sustainability 13, no. 14: 7779. https://doi.org/10.3390/su13147779
APA StyleLe Féon, S., Dubois, T., Jaeger, C., Wilfart, A., Akkal-Corfini, N., Bacenetti, J., Costantini, M., & Aubin, J. (2021). DEXiAqua, a Model to Assess the Sustainability of Aquaculture Systems: Methodological Development and Application to a French Salmon Farm. Sustainability, 13(14), 7779. https://doi.org/10.3390/su13147779