Article

Happiness at Work and Motivation for a Sustainable Workforce: Evidence from Female Hotel Employees

1
Department of Business Administration, Faculty of Economic and Administrative Sciences, Cyprus International University, Nicosia 99258, Turkey
2
School of Tourism and Hotel Management, Cyprus International University, Nicosia 99258, Turkey
3
Faculty of Education, Cyprus International University, Nicosia 99258, Turkey
*
Author to whom correspondence should be addressed.
Sustainability 2021, 13(14), 7778; https://doi.org/10.3390/su13147778
Submission received: 21 May 2021 / Revised: 5 July 2021 / Accepted: 8 July 2021 / Published: 12 July 2021
(This article belongs to the Special Issue Sustainability in People Management)

Abstract

:
Employment practices that support happiness at work are critical tools for developing a sustainable workforce. In today’s challenging environment, both economically and environmentally, the contribution of a sustainable workforce, which is the most critical asset for hospitality businesses to survive and succeed, cannot be ignored. This study explores the effects of motivational dimensions on happiness at work. These relationships were evaluated using the SPSS for Windows 25.0 and AMOS 23.0 programs. For this purpose, data were collected from 271 female employees in various four- and five-star hotels in North Cyprus. As predicted, the results revealed that motivational dimensions affect the dimensions of happiness at work. This study confirmed that a better understanding of employees’ needs and demands would encourage motivation and result in happier employees. The findings offer important implications for hospitality industry organizations seeking to maximize employee happiness in the workplace and strive for the sustainability of their workforce.

1. Introduction

Today’s evolving and changing dynamics at an easily noticeable speed make it difficult for businesses to survive in the global competitive environment. In this challenging environment, both economically and environmentally, it has become necessary for hospitality organizations to focus on customer satisfaction by differentiating themselves from others to survive and succeed. In this context, the contributions of its employees, who are the most critical assets of the service sector and the backbone of its competitive advantage [1], cannot be ignored. The hospitality industry and other sectors have increasingly begun to offer their employees more uncertain, unpredictable, and risky working conditions [2]. This manifested itself as an increase in stress levels in employees and a general worsening of their physical and mental health [3]. A sustainable workforce can only be achieved by supporting employees’ happiness at work (HAW) and paying attention to the working environment [3]. Likewise, retaining highly motivated employees and a healthy working environment are a must for a sustainable workforce in the hospitality industry [4]. Poor working conditions, low wages, temporary employment, high employee turnover, and inequality of opportunities for women are some of the challenges that are faced by those working in the hospitality industry [5].
Given that women workers comprise 70% of the worldwide hotel industry workforce, their critical role should not be denied [6]. However, their numerical superiority does not reflect their leadership roles in the industry [7]. Although the hotel industry tends to hire women employees due to the nature of the services provided [6], women are still under-represented in senior roles [8]. Women are often employed as waitresses, receptionists, or cleaning staff in low-skilled and low-wage service jobs, which are seen as an extension of their roles at home [9,10].
Due to the difficulty of finding effective ways of achieving positive improvements in perceptions and attitudes [11] of these “emotional labours” [12], employees’ motivation has become vital issues highlighted by managers and colleagues [13,14,15]. Working conditions in the hospitality industry are characterized by low wages, long working hours, and high intention to leave—far from satisfying and motivating employees [16,17,18]. On the other hand, organizational managers create and encourage HAW when they increase motivation in their subordinates [19]. HAW provides an environment where employees can work while feeling good. Since hospitality employees consist of unhappy employees who try to host their guests and make them happy [20,21,22], increased levels of happiness will inevitably have a positive effect on customers.
Given that the average adult spends most of his life working, this time will be much longer in the hospitality industry characterized by long working hours. Therefore, the HAW of employees is in the interest of organizations and even society.
A research model using Herzberg’s motivation-hygiene theory was designed to address what is missing in the hospitality literature and reveal the relationship between the two variables: motivational dimensions and HAW. Motivational dimensions are (1) growth and achievement; (2) work itself, responsibility, and recognition; (3) interpersonal relationships; (4) working conditions; and (5) salary. While growth and achievement, and work itself, responsibility, and recognition are intrinsic motivating factors (motivators), interpersonal relationships, working conditions, and salary are extrinsic motivating (hygiene) factors. HAW consist of (1) engagement, (2) job satisfaction, and (3) affective organizational commitment dimensions. The analysis of the current study provided evidence for increasing the happiness levels of female hotel employees in Northern Cyprus. Therefore, this study can be used effectively to develop a sustainable workforce and customer satisfaction. As discussed above, we aim to contribute to motivation and HAW literature; at the same time, we aim to make inferences and contribute as a practical guide for managers who want to increase the HAW of employees by creating facilitating conditions for meeting the psychological needs of employees.
In the continuation of the study, previous studies on Herzberg’s motivation-hygiene theory and HAW were reviewed in the literature review section. In the methodology section, hypotheses are developed by reviewing the literature revealing the relationship between motivational dimensions and HAW, and the specific procedures and methods used in the study are explained. The statistical analysis results are shown in the analysis and findings section. The discussion and conclusion section, where the theoretical and practical values of the research are explained, is followed by the implications and limitations sections.

2. Literature Review and Research Hypotheses

2.1. Herzberg’s Motivation-Hygiene Theory

One of the most challenging tasks of managers and leaders can be said to be “getting people to do their jobs in the best way possible” [23]. As a word, motivation originates from the Latin word ‘mover’ or ‘to move.’ Motivation is described as how to provide a person with something to motivate him/her to do something [24]. It is essential because it leads to success and inspires people to act; it is “the ‘driving force’ behind the behavior.” [25].
In 1959, Herzberg and colleagues developed the motivation-hygiene theory, influenced by Maslow’s hierarchy of needs, and in the first publication [26], the research consisted of two hypotheses:
  • The factors causing positive job attitudes and those causing negative attitudes are different;
  • The factors and the performance or personal effects associated with sequences of job events extending over long periods differ from those associated with sequences of short-duration events.
After completing a comprehensive literature review of over 2000 job satisfaction studies, Herzberg [26] studied more than 200 employees working in nine different factories in the USA’s Pittsburgh region to determine the factors that affect employees’ working environment and cause satisfaction or dissatisfaction. According to the research data, the factors that cause job satisfaction and dissatisfaction are divided into two categories; the first category is the motivators associated with growth and self-actualization. In general, motivators are part of the job context and are often managed by employees. Motivators are complex and subjective, intrinsic to the job, and are often very difficult to measure. The presence of growth factors can lead to job satisfaction, but their absence causes no job satisfaction. According to Herzberg, responsibility and advancement are the only way to increase motivation through job satisfaction. Motivation factors included achievement, recognition, work itself, responsibility, advancement, and possibility for growth [27,28].
The other category was hygiene factors associated with avoiding unpleasantness. Hygiene factors are typically extrinsic and are under the control of the supervisor or someone other than the employee [27,28]. When using the term “hygiene,” Herzberg implied the medical meaning of the term. In other words, it is used to mean “eliminating the hazards from the environment [29]. According to Herzberg, a “hygienic” environment prevents dissatisfaction with a job, but it cannot take a person beyond that. Hygiene factors included company policies and administration, the relationship with supervisors, interpersonal relations, the working conditions, and the salary and are easier to measure than the motivators. Job dissatisfaction occurs when these hygiene factors fall below the level that the employee considers acceptable. According to Herzberg, hygiene factors cannot motivate. When used to motivate, it can have long-term adverse effects [27,28]. While many studies have criticized Herzberg’s theory [30,31], Bassett-Jones and Lloyd [32] stated that the theory is still applicable and valid as in the 1960s.

2.2. Happiness at Work (HAW)

Interest in employee well-being in organizations emerged with positive psychology rising in the 1990s [33]. Later, sociologists and management scientists began to show interest in the subject [34].
While happiness varies according to many approaches and disciplines, it is not surprising to find many different definitions even within the same disciplines. Namely, meaningfulness, well-being, joy, satisfaction, quality of life, and pleasure are used synonymously with happiness [35,36]. Two concepts of happiness can be mentioned: The first is hedonic happiness and manifests itself as pleasant feelings and favorable judgments about happiness. The second is eudaimonic happiness. It can be presented as the non-contradictory things needed to live a moral, meaningful, and virtuous life that is compatible with one’s actions and fulfilling [37,38]. After both hedonic and eudaimonic aspects of well-being were measured and found to be strongly related, the usefulness of making this distinction was questioned [39,40]. Seligman [41] uses the abbreviation “PERMA” for happiness, consisting of Pleasure, Engagement, Relationships, Meaning, and Achievements. Fisher [42] defines HAW as “Employees’ happy feelings towards the job itself, the job characteristics and the organization as a whole.” Furthermore, it concludes that happiness should be seen as an essential factor for the employee to continue to function [42]. HAW has also been defined as a combination of good relationships, career development, and feeling valued in the workplace [43].
Fisher’s [42] HAW consists of three dimensions. These three dimensions are engagement (ENG), job satisfaction (JS), and affective organizational commitment (AOC). Engagement is about a unique sense of energy and motivation associated with feeling excited and passionate at work. Job satisfaction is the attitudes towards working conditions such as salary, career opportunities, and peer relationships. Affective organizational commitment is the feelings of commitment and compassion to the organization.
Increasing competition in the hospitality industry creates a concern among hotels to satisfy their customers more than their competitors and thus to gain their loyalty. Hotel businesses that want to get ahead in the sector can realize their increasing customer demands by motivating their employees [44,45], who are always in direct contact with customers and are vital parts of service delivery [46]. The need for employees and the importance to be given in return for labor-intensive hotel businesses should be more than other businesses because the execution of the services and the satisfaction of the customers largely depend on the employees. In other words, increasing customer satisfaction and providing services quickly, ultimately, and regularly depend on highly motivated employees [47]. Whether customers are happy with the service provided or not is directly related to the happiness of the employees. Therefore, ensuring that employees are motivated and happy becomes the most critical issue in service delivery [48].

3. Methodology

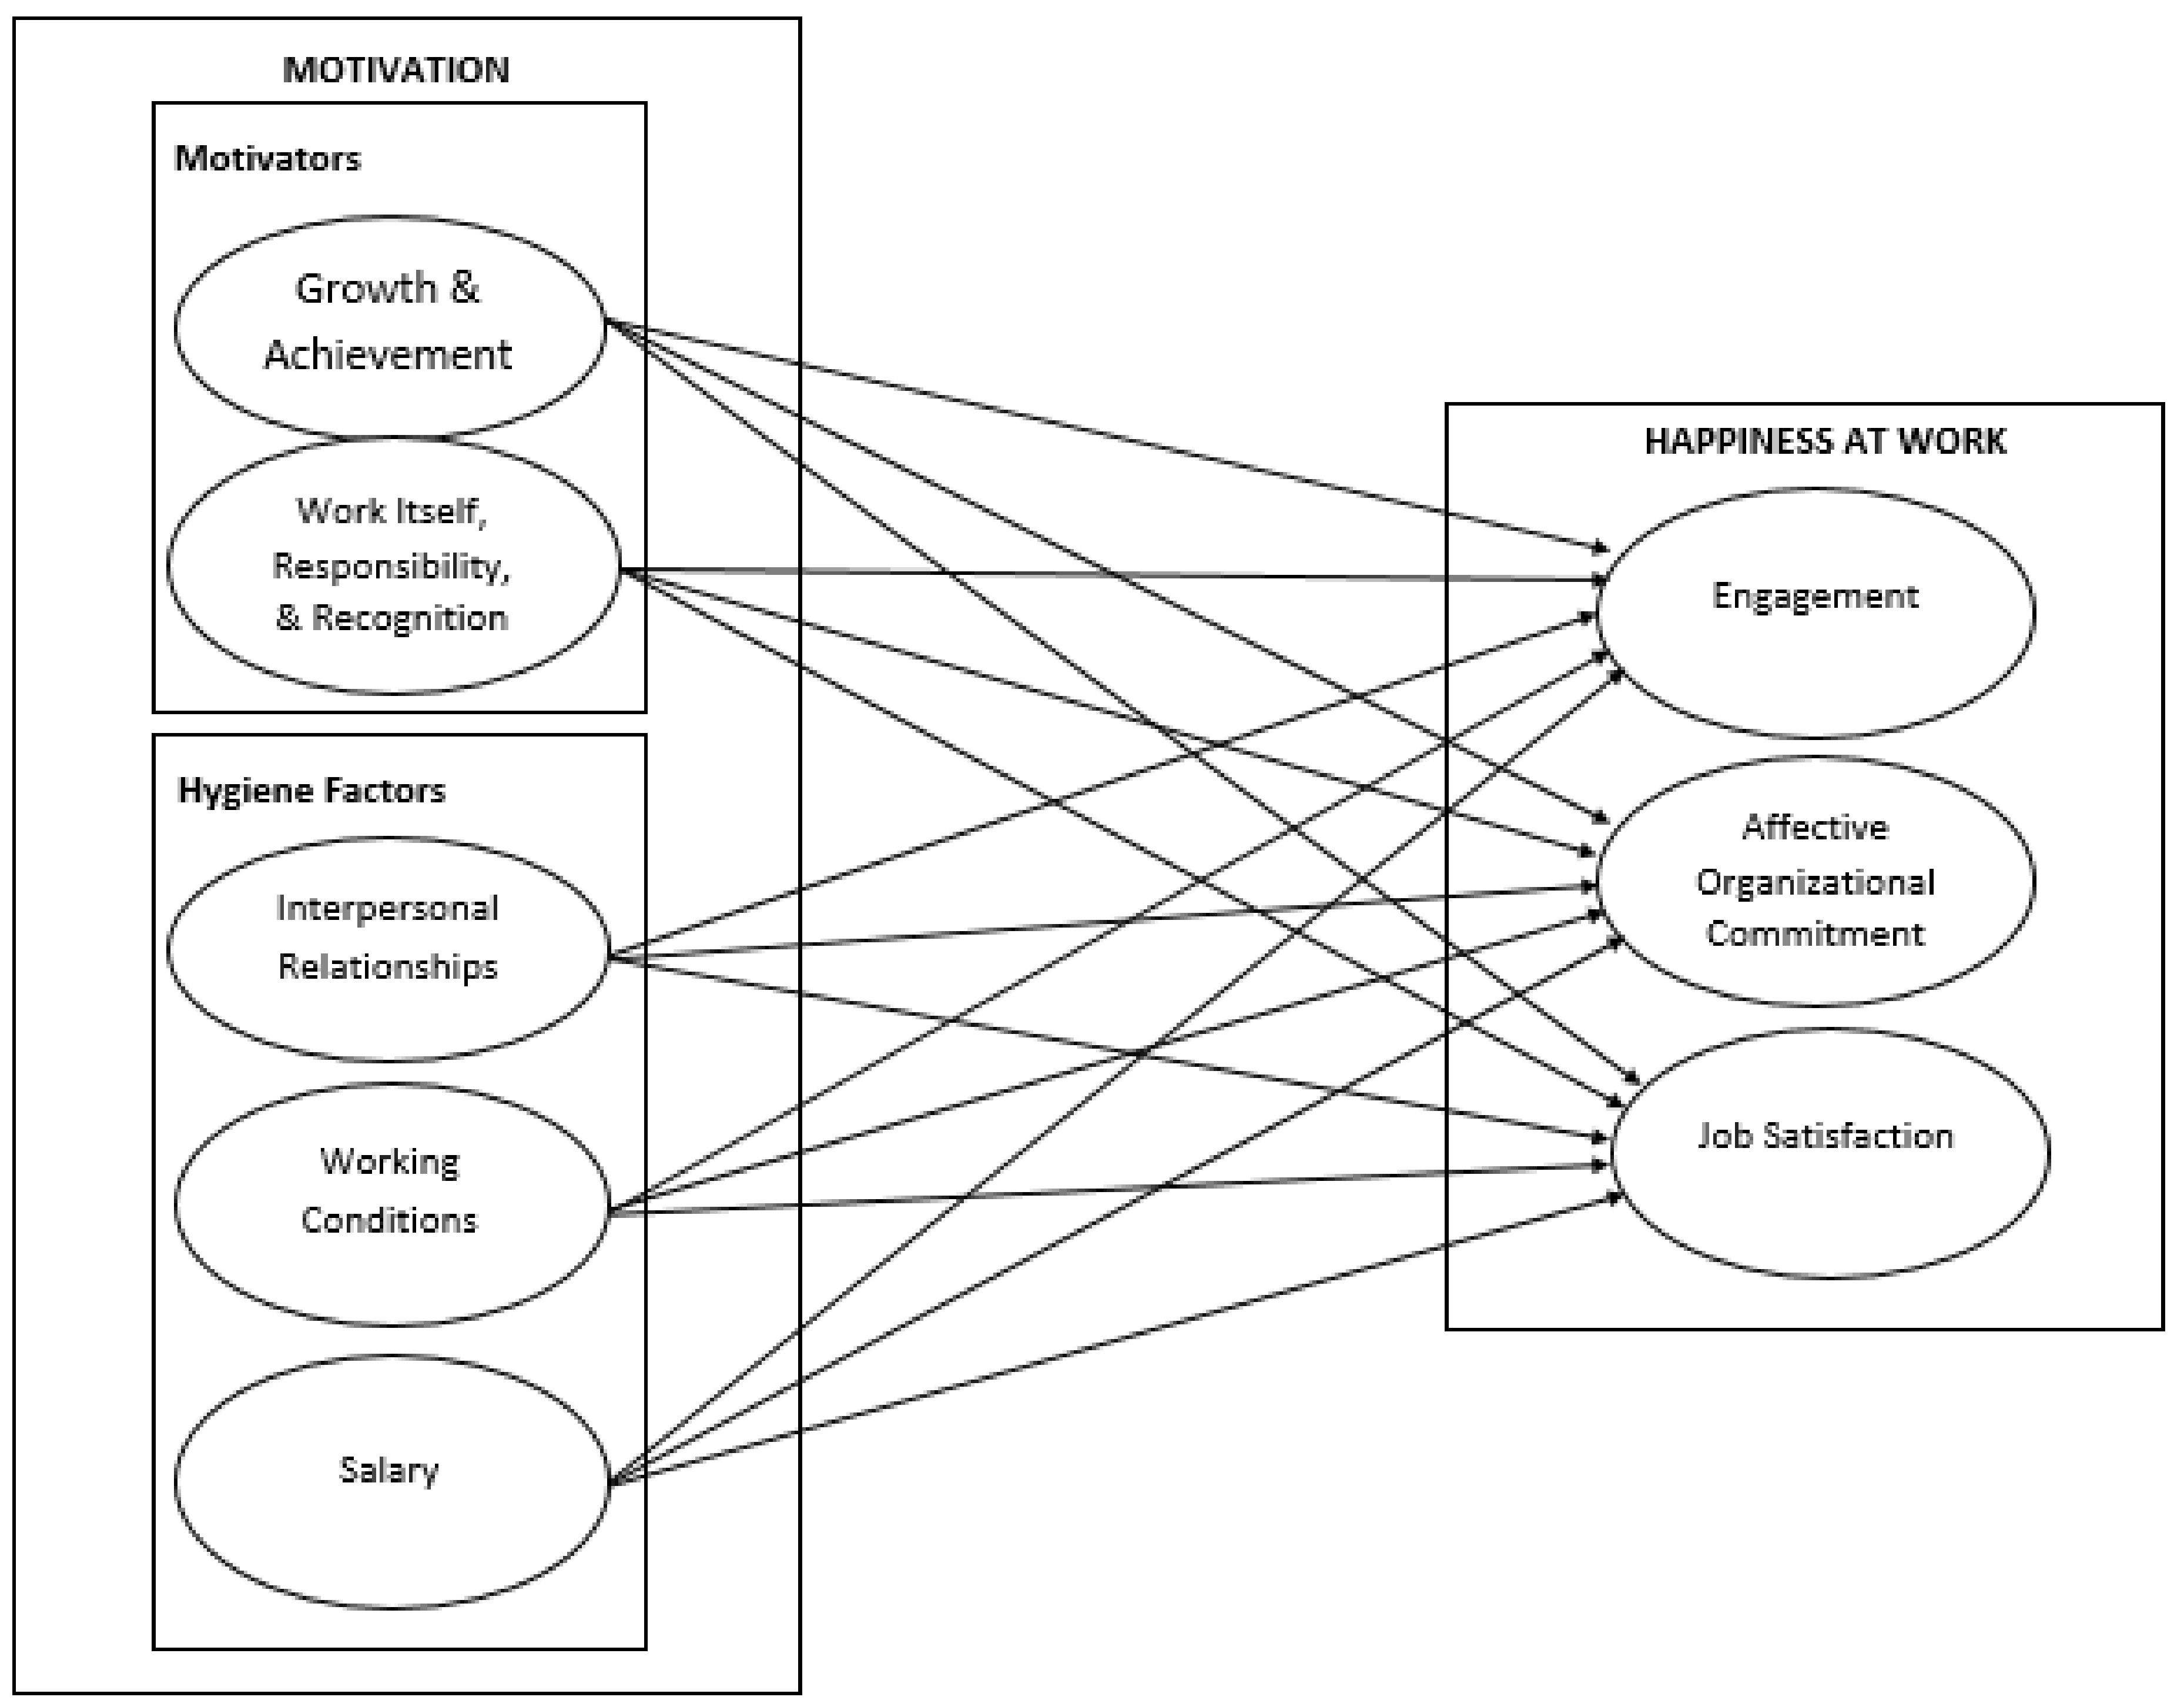
3.1. Model and Hypotheses

This research aims to analyze the effect of motivation dimensions on HAW of female employees. Motivation consists of “Growth and Achievement”, “Work Itself, Responsibility, and Recognition”, “Interpersonal Relationships”, “Working Conditions”, and “Salary” dimensions [28,49]. HAW consists of “Engagement”, “Job Satisfaction”, (JS), and “Affective Organizational Commitment” (AOC) dimensions [50]. Accordingly, the research design of the study was created and shown as in Figure 1.

The Relationship between Motivational Dimensions and HAW

In the literature, motivation and happiness-related concepts are explained with different approaches. While some studies [43,51] reveal that happy individuals have a higher motivation than unhappy individuals, other studies state that highly motivated individuals become individuals with higher levels of happiness [19,52,53]. With the correlation between 0.50 and 0.60, job satisfaction and life satisfaction directly and significantly affect each other [54,55]. Chiumento [43] found that 50% of the happiest people at work are more motivated than others and suggested that those happiest are 180% more energetic, 108% more engaged, and 79% more likely to enjoy their work. Hassanzadeh and Mahdinejad [51] reported a significant relationship between happiness and achievement and intrinsic motivation [53]. Therefore, the high level of HAW will reflect the employees’ motivation to succeed in the workplace.
In 1959, Herzberg [26] asked employees to describe when they felt particularly good or bad in their job. As a result, employees reported feeling the best when connected with events that included achievement, recognition, responsibility, and growth opportunities. Motivation and hygiene theory states that employees still do their jobs properly without motivating factors, but employees are more engaged and exceed the job’s minimum requirements if there are motivators.
According to Kahn [52], when employees’ basic needs are met, positive emotions emerge, and they become more cognitively and emotionally engaged. Chitiris [56] stated that employees supported by career development experiences could be productive and reliable even if their other needs are unmet. Faulkner and Biddle [57] mentioned the process of adaptation to positive emotions: Even if the conditions supporting the positive state are maintained, it will not continue due to adaptation to the situation. However, if the chosen type of activity is meaningful, such as learning new skills, the favorable situation may last longer. Spreitzer et al.’s [58] concept of thriving at work, including employee happiness and well-being, combines the sense of progress towards learning, growth, and self-actualization as a structure [59]. In addition, Karatepe and Uludag [46] found that internal factors such as sense of achievement and personal growth positively affect AOC and JS. Lundberg et al. [60] obtained similar results supporting previous studies with seasonal hospitality works in Sweden.
Based on the motivation-hygiene theory and studies mentioned above, we hypothesize that growth and achievement would positively influence happiness dimensions, and therefore we formed the following hypotheses:
Hypothesis 1 (H1).
Growth and Achievement will positively influence ENG.
Hypothesis 2 (H2).
Growth and Achievement will positively influence AOC.
Hypothesis 3 (H3).
Growth and Achievement will positively influence JS.
The effect of motivation on employee satisfaction, based on Herzberg’s theory, has been investigated in many previous studies in the hotel environment [46,56,60,61,62,63]. Ryan and Deci [64] state that intrinsic motivation factors arise from doing the job for one’s good and, as a result, provide a state of well-being. Furthermore, in the Gallup Workplace Audit [65], issues such as the availability of recognition and praise have been recognized as antecedents of engagement. De Silva and Yamao [66] revealed that higher manager and supervisor evaluations result in higher employee commitment. In addition, Fisher [42] defined HAW as “...happy feelings towards the job itself”. Based on the motivation-hygiene theory and the studies mentioned above, we suggested that intrinsic factors such as work itself, responsibility, and recognition would positively influence happiness dimensions, and we formed the following hypotheses:
Hypothesis 4 (H4).
Work itself, responsibility, and recognition will positively influence ENG.
Hypothesis 5 (H5).
Work itself, responsibility, and recognition will positively influence AOC.
Hypothesis 6 (H6).
Work itself, responsibility, and recognition will positively influence JS.
Hygiene factors, namely extrinsic motivation, do not come from within a person but arises from external factors [67]. Despite the large number of studies demonstrating that intrinsic motivation has a direct and positive effect on engagement [62,63], few studies examine the relationship between extrinsic motivation and engagement and suggest a positive relationship [68,69]. Chitiris’ [56] study revealed that hygiene factors have a substantial effect on JS, but the contribution of motivators is minimal. This study was supported by another study conducted in the US and Canada in 1995 [61]. Future studies have also obtained results that found a significant positive relationship indicating that as extrinsic motivation increases, JS increases [70,71]. Ogihara and Uchida [72] found that in the workplace, individualism, the “loosely linked individuals,” or the lack of interpersonal relationships is negatively associated with subjective well-being. Again, in a study investigating the role of friendship on happiness, interpersonal mattering is an important and influential predictor of happiness [73]. Based on these studies, we suggested that extrinsic factors such as interpersonal relationships would positively influence happiness dimensions, and we formed the following hypotheses:
Hypothesis 7 (H7).
Interpersonal relationships will positively influence ENG.
Hypothesis 8 (H8).
Interpersonal relationships will positively influence AOC.
Hypothesis 9 (H9).
Interpersonal relationships will positively influence JS.
Loscocco and Spitze [74], in their study on female and male factory workers, found that all kinds of working conditions significantly affect employee well-being, and this did not indicate a difference according to gender. Demerouti et al. [75] suggested that working conditions affect life satisfaction or happiness through changing the person’s characteristics or the environment. For example, working conditions may change the person’s mood, energy level, skill, or health and cause the person to be happy or unhappy. Based on these studies, we suggested that extrinsic factors such as working conditions would positively influence happiness dimensions, and we formed the following hypotheses:
Hypothesis 10 (H10).
Working conditions will positively influence ENG.
Hypothesis 11 (H11).
Working conditions will positively influence AOC.
Hypothesis 12 (H12).
Working conditions will positively influence JS.
A study of 6000 subjects in the USA revealed that happiness increases as income increases [76]. Studies comparing countries’ income levels have determined that the average national happiness is higher in countries with low-income differences [77]. According to Kahneman and Deaton [78], having more money is associated with experiencing greater daily happiness. Hwang [79] found that there are significant differences in happiness levels depending on salary. Nurses with a salary of more than 301 million KRW (South Korean Won) had a higher sense of happiness than nurses with a lower salary. Based on these studies, we suggested that extrinsic factors such as salary would positively influence happiness dimensions, and we formed the following hypotheses:
Hypothesis 13 (H13).
Salary will positively influence ENG.
Hypothesis 14 (H14).
Salary will positively influence AOC.
Hypothesis 15 (H15).
Salary will positively influence JS.

3.2. Data Collection and Analysis

Kyrenia and the Iskele/Famagusta region, which host the most tourists in Northern Cyprus, are the most popular tourist destinations with their many attractions. For this reason, these regions have been chosen as the target research areas. The population was selected from among female employees in four- and five-star hotels. The Ministry of Tourism and Environment Tourism Planning Office [80] shows 21 five- and four-star hotels in these regions. Twenty of these hotels are located in Kyrenia and one in the Famagusta region. Since there are no statistics on the number of female employees, the authors contacted human resources managers to determine whether they were willing to collaborate with this project and determine the number of women working in their hotels. It was found that 680 women worked at these hotels. Then, 500 questionnaires were distributed between September 2019 and February 2020 to the hotels’ human resources departments. Participants were guaranteed anonymity and confidentiality in the cover letter attached to the questionnaires. In total, 300 questionnaires were collected, and 29 of them were discarded due to incomplete information. Finally, 271 valid questionnaires were used for data analysis (54.2% applicable response rate). Guilford [81] suggested that the number of participants should be at least 200 cases to apply statistical analysis methods, and this study meets this criterion with a sample size of 271. The distribution of the participants in the study according to their sociodemographic characteristics is shown in Table 1. Considering the mid and senior-level managers, 60.9 percent of the participants work as managers and supervisors due to the traditional flat structure of the hotels. In this context, managers are evaluated with their managerial functions within the business, such as operations, quality control, sales, and front office tasks [82,83].
The data collection method in this study is questionnaires. Three sections were designed in the questionnaire to collect data. The first part of the questionnaire includes motivation, the second part, HAW. The last part includes questions about the demographic information (age, marital status, weekly working time, department, position levels, education, time worked in the current workplace, and the sector). While the motivational dimensions constituted the independent variable, HAW constituted the study’s dependent variable.
Diagnostic tests, reliability, and validity tests have been performed. For scale reliability, Kaiser–Meyer–Olkin (KMO) and Item Total Score Correlation analyses were conducted. An “Exploratory Factor Analysis (EFA)” via the SPSS program and a “Confirmatory Factor Analysis (CFA)” using the AMOS program were performed to confirm the validity. In line with the hypotheses formed, path analysis was applied to investigate the effect of the scales’ dimensions on each other.
Before applying EFA to the scales, the KMO test was applied for factor analysis. Results of the analysis are given under the EFA tables. As the value for both scales was over 0.8, it was concluded that the entire sample was sufficient for Factor Analysis (Table 2 and Table 3). In addition, when the Bartlett’s Sphericity test results were examined, it was seen that the obtained chi-square values were acceptable.

4. Analysis and Findings

4.1. Motivation Scale

The Motivation scale in this study was developed by Guzel [49] and is based on Herzberg’s motivation-hygiene theory. It was previously used by Gökkaya and Türker [84] in hospitality industry research. However, exploratory and confirmatory factor analyses have not been made before. The motivation scale consists of 21 items that address five dimensions (Table 4). The study participants were asked to rate their answers on a five-point Likert scale ranging from strongly disagree (1) to strongly agree (5).
To reveal the factor design of the motivation scale, a principal component analysis was chosen as the factorization method, and varimax, one of the orthogonal rotation methods, was chosen as rotation. In the EFA conducted to reveal the factor design of the motivation scale, it was determined that the scale has five sub-dimensions. These factors explain 70.849% of the total variance. The reliability of the motivation scale and its sub-dimensions were evaluated separately. It was found to be 0.908 for the overall scale, and it was found to have a good level of reliability (Table 2). When the correlations between variables are examined, it is seen that the factor loads of the items are above 0.40, and all correlation relations are significant (Table 4).
According to the CFA, it was determined that the structural equation modeling results of the scale were significant at the p = 0.000 level, and the 21 items and five sub-dimensions that make up the scale were related to the scale structure. Improvements are made in the model. While making improvements, variables that reduce compliance were determined, and a new covariance was created for those with high covariance among residual values. Then, in the renewed fit index calculations, it is shown in the table that the accepted values for the fit indices are provided (Table 5).

4.2. HAW Scale

The HAW scale is based on Fisher’s [42] conceptualization of HAW. It was first developed by Salas-Vallina, Alegre, and Fernández [88,89], and it was later shortened by Salas-Vallina and Alegre [50]. The shortened version (SHAW) was used in this study. Salas-Vallina and Alegre [50] claim that this new scale will widely capture positive attitudes in the workplace and be used more efficiently and effectively. The scale consists of nine items in total, three items for each dimension (ENG, AOC, and JS). The ENG sub-dimension is on a 7-point Likert scale ranging from Never (0) to Always (Every day) (6); AOC is on a 7-point Likert scale ranging from Strongly disagree (1) to Strongly agree (7); and JS sub-dimension in 5-point Likert scale ranging from Strongly disagree (1) to Strongly agree (5).
To reveal the factor pattern of the HAW scale, principal component analysis was chosen as the factorization method and varimax from the orthogonal rotation methods as rotation. The EFA conducted to reveal the factor design of the HAW scale determined that the scale has three sub-dimensions. These factors explain 85.012% of the total variance. In multi-factor designs, more than 40% of the explained variance is considered sufficient [90,91]. The reliability of the HAW scale and its sub-dimensions were evaluated separately. It was found to be 0.903 for the overall scale, and it was found to have a good level of reliability (Table 3).
When the correlations between variables are examined, it is seen that the factor loads of the items are above 0.40, and all correlation relations are significant (Table 6).
According to the CFA, it was determined that the structural equation modeling results of the scale were significant at the p = 0.000 level, and nine items and three sub-dimensions that make up the scale were related to the scale structure. Improvements are made in the model. While making improvements, variables that reduce compliance were determined, and a new covariance was created for those with high covariance among residual values. Then, in the renewed fit index calculations, it is shown in the table that the accepted values for the fit indices are provided (Table 7).

4.3. Path Coefficient and Level of Significance

The following part of this section will examine the relationship between the variables in detail. After the path analysis, in which the hypothesized variable relationships were investigated, 13 of the 15 hypotheses were supported, as presented in Table 8.
Evaluations revealed that growth and achievement did not have a statistically significant effect on engagement (Table 8). However, it turned out to be statistically significant on the AOC, where a one-unit increase in growth and achievement resulted in a 0.434-unit increase in AOC (Table 8). Thus, H2 was supported, but H1 was not. Other measurements are given below, respectively.
Path analysis results showed that growth and achievement had a positive and statistically significant effect on JS. A one-unit increase in growth and achievement led to an increase of 0.532 units in JS (Table 8). Thus, H3 was supported.
The relationship between work itself, responsibility, and recognition and the HAW dimensions revealed that the independent variable has a positive and statistically meaningful effect on three dependent variables. A one-unit increase in work itself, responsibility, and recognition lead to a 0.590-unit of increase in engagement, a 0.736-unit increase in AOC, and a 0.597-unit increase in JS (Table 8). Thus, H4, H5, and H6 were supported.
The results of the path analysis revealed that interpersonal relationships have a positive and statistically meaningful effect on three dimensions of HAW, where a one-unit increase in interpersonal relationships lead to a 0.156-unit increase in engagement, a 0.486-unit increase in AOC, and a 0.251-unit increase in JS (Table 8). Therefore H7, H8, and H9 were supported.
When the relationship between working conditions and HAW dimensions was tested, it was seen that working conditions have a positive and statistically meaningful effect on three HAW dimensions. A one-unit increase in working conditions lead to a 0.543-unit increase in engagement, a 0.626-unit increase in AOC, and a 0.533-unit increase in JS (Table 8). So, H10, H11, and H12 are supported.
The evaluations revealed that salary did not have a statistically meaningful effect on engagement but had a statistically meaningful effect on AOC and JS, where a one-unit increase in salary lead to a 0.238-unit increase in AOC, and an increase of 0.414 units in JS (Table 8). Thus, H14 and H15 were supported, but H13 was not.

5. Discussion and Conclusions

The path analyses supported most of the hypothesized relationships. As discussed earlier, hospitality industry employees are unhappy due to heavy workload, poor working conditions, and long working hours [20,21]. Despite recognizing the importance of motivation and HAW for organizations, little is known about the impact of motivational dimensions on HAW. With this recognition, this study, seeking the answer to whether or not motivational dimensions affect HAW, proposed and tested a research model that builds on and expands on the previous research.
For this, the relationships between motivational dimensions and HAW dimensions were tested. It has been observed that the work itself, responsibility, and recognition, interpersonal relations, and working conditions affect engagement positively. This finding reveals that the better the relations and working conditions among the employees in an organization, the higher the responsibility and recognition given to the employees, and the more engaged the employees are. However, growth, achievement, and salary do not have significant relationships with engagement. Considering that this study was conducted on women employees, this result may reflect the lack of growth and achievement opportunities. Despite studies pointing out the relationship between money and happiness [76,77,78,79] our research did not find a significant relationship between salary and engagement. However, it turned out to have a positive effect on AOC and JS dimensions.
Findings revealed that AOC was positively affected by all motivational dimensions. This result is consistent with studies showing that both intrinsic and extrinsic factors positively affect AOC [46,60,66,92,93].
As shown in Table 8, results revealed that both intrinsic and extrinsic factors significantly affected JS. Although this result is partially consistent with Herzberg’s theory, Herzberg only emphasized the influence of intrinsic factors on JS. The theory stated that extrinsic factors would not cause JS, but its absence will cause no JS. Different studies reveal the effect of intrinsic and extrinsic factors on JS [46,56,60,61,62,63,70] and our result is consistent with these studies.
We believe this research contributes to the relationship between employee motivation and happiness, a well-known but not well-defined relationship. Today, HAW is essential for organizations to achieve sustainable workforce employment. Our research proposes a model for promoting happiness in hospitality industry organizations. Motivation is an essential source and a reason for HAW development. In line with previous studies [19,27,52,53], our study reveals if organizations encourage motivation by providing employees good working conditions, giving growth opportunities; appreciating their achievements (monetary and nonmonetary); supporting interpersonal communication through positive attitudes, and thus HAW. This study confirmed that a better understanding of employees’ needs and demands would encourage motivation and result in happier employees.
Our second contribution demonstrates that the happiness scale can be applied in the hospitality industry. The motivation scale also overcame dimensionality, reliability, and validity and ensured maximum strength for them. Although the motivation scale has previously been measured as reliability and validity and used in the hospitality industry, EFA and CFA exceeded the dimensional features in this study.
Based on the results, we recommend that the managers in the hospitality industry and the managers of the human resources departments take measures to increase employee motivation. Thus, the employees’ happiness in the workplace will increase; however, an important step will be to create a more sustainable workforce by increasing their engagement, affective organizational commitment, and job satisfaction.

6. Implications

The primary purpose of this study is to increase motivation and happiness at work in hospitality organizations. Furthermore, our findings have important implications for organizations wanting to maximize the happiness at work of their employees. Employee turnover has been one of the critical managerial problems of the hospitality industry [94,95]. From this viewpoint, a sustainable workforce must put forth practices that increase employee motivation and significantly more workplace happiness. Accepting employee happiness as a corporate value will be a critical decision for management to sustaining the workforce. Encouraging and sustaining HAW in the working environment means investing in motivational dimensions by management. In addition, our proposed model for HRM in the hospitality and other industries will help maintain employee engagement, commitment, employee satisfaction and, therefore, customer satisfaction, service quality, and workforce sustainability in line with HRM objectives.

7. Limitations

This study has some limitations. First, the questionnaires were filled out by hospitality industry employees. Therefore, we acknowledge that different conclusions can be drawn if the same research is conducted in other sectors. Second, this study is cross-sectional and suggests that longitudinal studies should clarify our model as motivation and HAW levels can change over time. Third, self-reported questionnaires can lead to subjective responses. Given these limitations, new questions may be suggested for future research. How does the effect of motivation on HAW differ in a study comparing men and women? What role does the age, department, or education of the employees play in this relationship? Future research should examine moderator factors. A final limitation concerns the generalizability of the results to other cultures and countries. Since the example is from only one country, it will be interesting to examine whether the relationship between motivation and HAW is different in different cultures.

Author Contributions

Conceptualization, A.A. and H.O.; methodology, A.A. and H.O.; writing—original draft preparation, A.A.; writing—review and editing, A.A., H.O. and F.S.; supervision, H.O. and F.S. All authors have read and agreed to the published version of the manuscript.

Funding

This research received no external funding.

Institutional Review Board Statement

Ethical review and approval were waived for this study based on the consent of the thesis advisor, which is acknowledged by the ethical committee of the Cyprus International University.

Informed Consent Statement

Informed consent was obtained from all subjects involved in the study.

Data Availability Statement

The data will be made available on request from the corresponding author.

Conflicts of Interest

The authors declare no conflict of interest.

References

  1. Yadav, S.; Morya, K.K.A. Study of Employee Engagement and Its Impact on Organizational Citizenship Behavior in the Hotel Industry. IUP J. Organ. Behav. 2019, 18, 7–31. [Google Scholar]
  2. Kalleberg, A.L. Precarious Work, Insecure Workers: Employment Relationsin Transition. Am. Sociol. 2009, 74, 1–22. [Google Scholar] [CrossRef] [Green Version]
  3. Kossek, E.E.; Valcour, M.; Lirio, P. The Sustainable Workforce: Organizational Strategies for Promoting Work–Life Balance and Wellbeing. Work Wellbeing 2014, 3, 295–318. [Google Scholar]
  4. Wikhamn, W. Innovation, Sustainable HRM and Customer Satisfaction. Int. J. Hosp. Manag. 2019, 76, 102–110. [Google Scholar] [CrossRef]
  5. Baum, T.; Cheung, C.; Kong, H.; Kralj, A.; Mooney, S.; Nguyễn Thị Thanh, H.; Ramachandran, S.; Dropulić Ružić, M.; Siow, M. Sustaina-bility and the Tourism and Hospitality Workforce: A Thematic Analysis. Sustainability 2016, 8, 809. [Google Scholar] [CrossRef] [Green Version]
  6. Ismail, M. Women’s Role and Position in Hospitality. Available online: https://theaseanpost.com/article/womens-role-and-position-hospitality (accessed on 20 May 2021).
  7. Pritchard, A.; Morgan, N. Tourism’s Lost Leaders: Analysing Gender and Performance. Ann. Tour. Res. 2017, 63, 34–47. [Google Scholar] [CrossRef]
  8. WiH2020 Review. Available online: http://www.pwc.co.uk/hospitality-leisure/women-in-hospitality-and-leisure/assets/women-hospitality-travel-leisure-2019-edition-final.pdf (accessed on 20 May 2021).
  9. Campos-Soria, J.A.; Ortega-Aguaza, B.; Ropero-García, M.A. Gender Segregation and Wage Difference in the Hospitality Industry. Tour. Econ. 2009, 15, 847–866. [Google Scholar] [CrossRef]
  10. Campos-Soria, J.A.; Marchante-Mera, A.; Ropero-García, M.A. Patterns of Occupational Segregation by Gender in the Hospitality Indus-try. Int. J. Hosp. Manag. 2011, 30, 91–102. [Google Scholar] [CrossRef]
  11. Hartline, M.D.; Ferrell, O.C. The Management of Customer-Contact Service Employees: An Empirical Investigation. J. Mark. 1996, 60, 52–70. [Google Scholar] [CrossRef]
  12. Hochschild, A.R. The Managed Heart: Commercialization of Human Feeling, 8th ed.; University of California Press: Berkeley, CA, USA, 1985. [Google Scholar]
  13. Putra, E.D.; Cho, S.; Liu, J. Extrinsic and Intrinsic Motivation on Work Engagement in the Hospitality Industry: Test of Motivation Crowd-ing Theory. Tour. Hosp. Res. 2017, 17, 228–241. [Google Scholar] [CrossRef]
  14. Holston-Okae, B.L.; Mushi, R.J. Employee Turnover in the Hospitality Industry Using Herzberg’s Two-Factor Motivation-Hygiene Theory. Int. J. Acad. Res. Bus. Soc. Sci. 2018, 8, 218–248. [Google Scholar]
  15. Kotera, Y.; Adhikari, P.; van Gordon, W. Motivation Types and Mental Health of UK Hospitality Workers. Int. J. Ment. Health Addict. 2018, 16, 751–763. [Google Scholar] [CrossRef] [PubMed] [Green Version]
  16. Choudhury, N.; McIntosh, A. Retaining Students as Employees: Owner Operated Small Hospitality Businesses in a University Town in New Zealand. Int. J. Hosp. Manag. 2013, 32, 261–269. [Google Scholar] [CrossRef]
  17. Lee, C.; Huang, S.; Zhao, C. A Study of Factors Affecting Turnover Intention of Hotel Employees. Asian Econ. Financ. Rev. 2012, 2, 886. [Google Scholar]
  18. Brien, A.; Thomas, N.; Hussein, A.S. Turnover Intention and Commitment as Part of Organizational Social Capital in the Hotel Industry. J. Hum. Resour. Hosp. Tour. 2015, 14, 357–381. [Google Scholar] [CrossRef]
  19. Chaiprasit, K.; Santidhiraku, O. Happiness at Work of Employees in Small and Medium-Sized Enterprises, Thailand. Procedia Soc. Behav. Sci. 2011, 25, 189–200. [Google Scholar] [CrossRef] [Green Version]
  20. Brown, E.A.; Thomas, N.J.; Bosselman, R.H. Are They Leaving or Staying: A Qualitative Analysis of Turnover Issues for Generation Y Hospitality Employees with a Hospitality Education. Int. J. Hosp. Manag. 2015, 46, 130–137. [Google Scholar] [CrossRef] [Green Version]
  21. Wilson, A.; Zeithaml, V.A.; Bitner, M.J.; Gremler, D.D. Services Marketing, Third European; McGraw-Hill Education: Singapore, 2016. [Google Scholar]
  22. Koc, E.; Bozkurt, G.A. Hospitality Employees’ Future Expectations: Dissatisfaction, Stress, and Burnout. Int. J. Hospitality Tour. Adm. 2017, 18, 459–473. [Google Scholar] [CrossRef]
  23. Nohria, N.; Groysberg, B.; Lee, L.-E. Employee Motivation: A Powerful New Model. Harv. Bus. Rev. 2008, 86, 78–84. [Google Scholar] [PubMed]
  24. Ruthankoon, R.; Olu Ogunlana, S. Testing Herzberg’s Two-factor Theory in the Thai Construction Industry. Eng. Constr. Archit. Manag. 2003, 10, 333–341. [Google Scholar] [CrossRef]
  25. Madsen, K.B. Modern Theories of Motivation: A Comparative Metascientific Study; John Wiley and Sons: Oxford, UK, 1974. [Google Scholar]
  26. Herzberg, F. Motivation to Work, 2nd ed.; John Wiley and Sons: Nashville, TN, USA, 1959. [Google Scholar]
  27. Herzberg, F. Work and the Nature of Man; World Publishing: Cleveland, NY, USA, 1971. [Google Scholar]
  28. Herzberg, F. One More Time: How Do You Motivate Employees? Harvard Business Review Press: Boston, MA, USA, 2008. [Google Scholar]
  29. Duttweiler, P.C. Educational Excellence and Motivating Teachers. Clear. House 1986, 59, 371–374. [Google Scholar] [CrossRef]
  30. House, R.J.; Wigdor, L.A. Herzberg’s Dual-Factor Theory of Job Satisfaction and Motivation: A Review of the Evidence and a Criticism. Pers. Psychol. 1967, 20, 369–390. [Google Scholar] [CrossRef]
  31. Ewen, R.B.; Smith, P.C.; Hulin, C.L.; Locke, E.A. An Empirical Test of the Herzberg Two-Factor Theory. J. Appl. Psychol. 1966, 50, 544–550. [Google Scholar] [CrossRef] [PubMed]
  32. Bassett-Jones, N.; Lloyd, G.C. Does Herzberg’s Motivation Theory Have Staying Power? J. Manag. Dev. 2005, 24, 929–943. [Google Scholar] [CrossRef]
  33. Seligman, M.E.P.; Csikszentmihalyi, M. Positive Psychology: An Introduction. Am. Psychol. 2000, 55, 5–14. [Google Scholar] [CrossRef]
  34. Frawley, A. Happiness Research: A Review of Critiques. Sociol. Compass 2015, 9, 62–77. [Google Scholar] [CrossRef]
  35. Seligman, M.E. Fundamental assumptions. Psychologist 2003, 16, 126. [Google Scholar]
  36. Veenhoven, R. Greater Happiness for a Greater Number: Is That Possible and Desirable? J. Happiness Stud. 2010, 11, 605–629. [Google Scholar] [CrossRef] [Green Version]
  37. Ryan, R.M.; Deci, E.L. On Happiness and Human Potentials: A Review of Research on Hedonic and Eudaimonic Wellbeing. Annu. Rev. Psychol. 2001, 52, 141–166. [Google Scholar] [CrossRef]
  38. Ryff, C.D.; Singer, B.H. Know Thyself and Become What You Are: A Eudaimonic Approach to Psychological Wellbeing. J. Happiness Stud. 2008, 9, 13–39. [Google Scholar] [CrossRef]
  39. Kashdan, T.B.; Biswas-Diener, R.; King, L.A. Reconsidering Happiness: The Costs of Distinguishing between Hedonics and Eudaimonia. J. Posit. Psychol. 2008, 3, 219–233. [Google Scholar] [CrossRef]
  40. Waterman, A.S.; Schwartz, S.J.; Conti, R. The Implications of Two Conceptions of Happiness (Hedonic Enjoyment and Eudaimonia) for the Understanding of Intrinsic Motivation. J. Happiness Stud. 2008, 9, 41–79. [Google Scholar] [CrossRef]
  41. Seligman, M. Flourish; Simon Schuster: New York, NY, USA, 2011. [Google Scholar]
  42. Fisher, C.D. Happiness at Work: Happiness at Work. Int. J. Manag. Rev. 2010, 12, 384–412. [Google Scholar] [CrossRef]
  43. Chiumento, S. Happiness at Work Index: Research Report 2007; Chiumento: London, UK, 2007. [Google Scholar]
  44. Gunlu, M.E.; Aksarayli, D.M.; Percin, D.N.S. Job Satisfaction and Organizational Commitment of Hotel Managers in Turkey. Int. J. Contemp. Hosp. Manag. 2010, 22. [Google Scholar] [CrossRef]
  45. Maung, W.W.; Walsh, J. Factors Affecting Employee’s Performance in Mandalay Hotel Industry. Recent Issues Hum. Resour. Manag. 2018, 1, 18–43. [Google Scholar]
  46. Karatepe, O.M.; Uludag, O. Conflict, Exhaustion, and Motivation: A Study of Frontline Employees in Northern Cyprus Hotels. Int. J. Hosp. Manag. 2007, 26, 645–665. [Google Scholar] [CrossRef]
  47. Tükeltürk, Ş.A.; Perçin, N.Ş. Turizm Sektöründe Kadın Çalışanların Karşılaştıkları Kariyer Engelleri ve Cam Tavan Sendromu: Cam Tavanı Kırmaya Yönelik Stratejiler. Yönetim Bilimleri Derg. 2008, 6, 113–128. [Google Scholar]
  48. Kingir, S.; Mesci, M. Factors That Affect Hotel Employees Motivation, the Case of Bodrum. Serb. J. Manag. 2010, 5, 59–76. [Google Scholar]
  49. Guzel, F.Ö. Turizm Öğrencilerinin Staj Döneminde Edindikleri Motivasyonun Herzberg Teorisine Göre Değerlendirilmesine Yönelik Bir Araştırma. J. Yaşar Univ. 2010, 5, 3415–3429. [Google Scholar]
  50. Salas-Vallina, A.; Alegre, J. Happiness at Work: Developing a Shorter Measure. J. Manag. Organ. 2018, 1–21. [Google Scholar] [CrossRef]
  51. Hassanzadeh, R.; Mahdinejad, G. Relationship between Happiness and Achievement Motivation: A Case of University Students. J. Elem. Educ. 2013, 23, 53–65. [Google Scholar]
  52. Kahn, W.A. Psychological Conditions of Personal Engagement and Disengagement at Work. Acad. Manag. J. 1990, 33, 692–724. [Google Scholar]
  53. Zhang, J.; Kemp, S. The Relationships between Student Debt and Motivation, Happiness, and Academic Achievement. New Zealand J. Psychol. 2009, 38, 24–29. [Google Scholar]
  54. Judge, T.A.; Watanabe, S. Another Look at the Job Satisfaction-Life Satisfaction Relationship. J. Appl. Psychol. 1993, 78, 939. [Google Scholar] [CrossRef]
  55. Spector, P.E. Job Satisfaction: Application, Assessment, Causes, and Consequences; Sage: Thousand Oaks, CA, USA, 1997. [Google Scholar]
  56. Chitiris, L. Herzberg’s Proposals and Their Applicability to the Hotel Industry. Hosp. Educ. Res. J. 1988, 12, 67–79. [Google Scholar] [CrossRef]
  57. Faulkner, G.; Biddle, S.J.H. Exercise and Depression: Considering Variability and Contextuality. J. Sport Exerc. Psychol. 2004, 26, 3–18. [Google Scholar] [CrossRef]
  58. Spreitzer, G.M.; Sutcliffe, K.; Dutton, J.; Sonenshein, S.; Grant, A.M. A Socially Embedded Model of Thriving at Work. Organ. Sci. 2005, 16, 537–549. [Google Scholar] [CrossRef]
  59. Spreitzer, G.M.; Sutcliffe, K.M. Thriving in Organizations. In Positive Organizational Behavior; SAGE Publications Ltd.: London, UK, 2012. [Google Scholar]
  60. Lundberg, C.; Gudmundson, A.; Andersson, T.D. Herzberg’s Two-Factor Theory of Work Motivation Tested Empirically on Seasonal Workers in Hospitality and Tourism. Tour. Manag. 2009, 30, 890–899. [Google Scholar] [CrossRef]
  61. Simons, T.; Enz, C.A. Motivating Hotel Employees: Beyond the Carrot and the Stick. Cornell Hotel. Restaur. Adm. Q. 1995, 36, 20–27. [Google Scholar] [CrossRef]
  62. Froiland, J.M.; Worrell, F.C. Intrinsic Motivation, Learning Goals, Engagement, and Achievement in a Diverse High School: Motivation and Achievement in High School. Psychol. Sch. 2016, 53, 321–336. [Google Scholar] [CrossRef]
  63. Gillet, N.; Gagné, M.; Sauvagère, S.; Fouquereau, E. The Role of Supervisor Autonomy Support, Organizational Support, and Autonomous and Controlled Motivation in Predicting Employees’ Satisfaction and Turnover Intentions. Eur. J. Work Org. Psychol. 2013, 22, 450–460. [Google Scholar] [CrossRef]
  64. Ryan, R.M.; Deci, E.L. Self-Determination Theory and the Facilitation of Intrinsic Motivation, Social Development, and Well-Being. Am. Psychol. 2000, 55, 68–78. [Google Scholar] [CrossRef] [PubMed]
  65. Vale, F. A Measurement of Employee Engagement Using the Gallup Q12 Workplace Audit. Ph.D. Thesis, National College of Ireland, Dublin, Ireland, 2011. [Google Scholar]
  66. De Silva, D.A.M.; Yamao, M. The Involvement of Female Labor in Seafood Processing in Sri Lanka: Impact of Organizational Fairness and Supervisor Evaluation on Employee Commitment. In global Symposium on Gender and Fisheries; World Fish Center: Penang, Malaysia, 2006. [Google Scholar]
  67. Miller, K.A.; Deci, E.L.; Ryan, R.M. Intrinsic Motivation and Self-Determination in Human Behavior. Contemp. Sociol. 1988, 17, 253. [Google Scholar] [CrossRef]
  68. Walker, C.O.; Greene, B.A.; Mansell, R.A. Identification with Academics, Intrinsic/Extrinsic Motivation, and Self-Efficacy as Predictors of Cognitive Engagement. Learn. Individ. Differ. 2006, 16, 1–12. [Google Scholar] [CrossRef]
  69. Skinner, E.A.; Wellborn, J.G.; Connell, J.P. What It Takes to Do Well in School and Whether I’ve Got It: A Process Model of Perceived Control and Children’s Engagement and Achievement in School. J. Educ. Psychol. 1990, 82, 22–32. [Google Scholar] [CrossRef]
  70. Moynihan, D.P.; Pandey, S.K. Finding Workable Levers over Work Motivation: Comparing Job Satisfaction, Job Involvement, and Organizational Commitment. Adm. Soc. 2007, 39, 803–832. [Google Scholar] [CrossRef]
  71. Wright, B.E.; Kim, S. Participation’s Influence on Job Satisfaction: The Importance of Job Characteristics. Rev. Public Pers. Adm. 2004, 24, 18–40. [Google Scholar] [CrossRef]
  72. Ogihara, Y.; Uchida, Y. Does Individualism Bring Happiness? Negative Effects of Individualism on Interpersonal Relationships and Happiness. Front. Psychol. 2014, 5, 135. [Google Scholar] [CrossRef]
  73. Taniguchi, H. Interpersonal Mattering in Friendship as a Predictor of Happiness in Japan: The Case of Tokyoites. J. Happiness Stud. 2015, 16, 1475–1491. [Google Scholar] [CrossRef]
  74. Loscocco, K.A.; Spitze, G. Working Conditions, Social Support, and the Well-Being of Female and Male Factory Workers. J. Health Soc. Behav. 1990, 31, 313–327. [Google Scholar] [CrossRef]
  75. Demerouti, E.; Veldhuis, W.; Coombes, C.; Hunter, R. Burnout among Pilots: Psychosocial Factors Related to Happiness and Performance at Simulator Training. Ergonomics 2019, 62, 233–245. [Google Scholar] [CrossRef] [PubMed] [Green Version]
  76. Diener, E.; Sandvik, E.; Seidlitz, L.; Diener, M. The Relationship between Income and Subjective Well-Being: Relative or Absolute? Soc. Indic. Res. 1993, 28, 195–223. [Google Scholar] [CrossRef]
  77. Veenhoven, R.; Snyder, C.R.; Lopez, S.J.; Edwards, L.M.; Marques, S.C. Happiness in Nations; Oxford University Press: Oxford, England, 2018. [Google Scholar]
  78. Kahneman, D.; Deaton, A. High Income Improves Evaluation of Life but Not Emotional Well-Being. Proc. Natl. Acad. Sci. USA 2010, 107, 16489–16493. [Google Scholar] [CrossRef] [Green Version]
  79. Hwang, E. Effects of the Organizational Culture Type, Job Satisfaction, and Job Stress on Nurses’ Happiness: A Cross-Sectional Study of the Long-Term Care Hospitals of South Korea: Happiness of South Korean Nurses. Jpn. J. Nurs. Sci. 2019, 16, 263–273. [Google Scholar] [CrossRef] [PubMed]
  80. Turkish Republic of Northern Cyprus, Ministry of Tourismand Environment, Tourism Planning Office. Statistical Yearbook Of Tourism; Ministry of Tourism and Environment, Tourism Planning Office: Nicosia, Turkey, 2019. Available online: http://turizmplanlama.gov.ct.tr/Portals/131/%C4%B0statistikler/%C4%B0statistikler/YllkTumu.pdf?ver=2020-11-23-150953-367 (accessed on 20 May 2021).
  81. Guilford, J.P. Psychometric Methods; McGraw Hill: New York, NY, USA, 1954. [Google Scholar]
  82. Reid, D.M. Operationalizing Strategic Planning. Strateg. Manag. J. 1989, 10, 553–576. [Google Scholar] [CrossRef]
  83. Arıcıoğlu, M.A.; Gökce, Ş.; Gülnar, N. Mid-Level Managers in Terms of Strategic Role and Functions. In Contributions to Management Science; Springer International Publishing: Berlin/Heidelberg, Germany, 2020. [Google Scholar]
  84. Simon, D.; Kriston, L.; Loh, A.; Spies, C.; Scheibler, F.; Wills, C.; Härter, M. Confirmatory Factor Analysis and Recommendations for Improvement of the Autonomy-Preference-Index (API): Recommendations for Improvement of API. Health Expect. 2010, 13, 234–243. [Google Scholar] [CrossRef] [Green Version]
  85. Dehon, C.; Weems, C.F.; Stickle, T.R.; Costa, N.M.; Berman, S.L. A Cross-Sectional Evaluation of the Factorial Invariance of Anxiety Sensitivity in Adolescents and Young Adults. Behav. Res. Ther. 2005, 43, 799–810. [Google Scholar] [CrossRef]
  86. Hooper, D.; Coughlan, J.; Mullen, M. Evaluating Model Fit: A Synthesis of the Structural Equation Modelling Literature. In Proceedings of the 7th European Conference on Research Methodology for Business and Management Studies, London, UK, 18–20 June 2008; Academic Publishing: London, UK, 2008; pp. 195–200. [Google Scholar]
  87. Schermelleh-Engel, K.; Moosbrugger, H.; Müller, H. Evaluating the Fit of Structural Equation Models: Tests of Significance and Descriptive Goodness-of-Fit Measures. Methods Psychol. Res. Online 2003, 8, 23–74. [Google Scholar]
  88. Salas-Vallina, A.; López-Cabrales, Á.; Alegre, J.; Fernández, R. On the Road to Happiness at Work (HAW). Transformational Leadership and Organizational Learning Capability as Drivers of HAW in a Healthcare Context. Pers. Rev. 2017, 46, 314–338. [Google Scholar] [CrossRef]
  89. Salas-Vallina, A.; Alegre, J.; Fernández, R. Happiness at Work and Organisational Citizenship Behaviour: Is Organisational Learning a Miss-ing Link? Int. J. Manpow. 2017, 38, 470–488. [Google Scholar] [CrossRef]
  90. Şener, B. Sosyal Bilimler için veri Analizi el Kitabı; Pegem Yayıncılık: Ankara, Turkey, 2002. [Google Scholar]
  91. Tavsancil, E. Measuring Attitudes and Data Analysis with SPSS; Nobel Yayın Dağıtım: Ankara, Turkey, 2005. [Google Scholar]
  92. Meyer, J.P.; Becker, T.E.; Vandenberghe, C. Employee Commitment and Motivation: A Conceptual Analysis and Integrative Model. J. Appl. Psychol. 2004, 89, 991. [Google Scholar] [CrossRef] [PubMed] [Green Version]
  93. Al-Madi, F.N.; Assal, H.; Shrafat, F.; Zeglat, D. The Impact of Employee Motivation on Organizational Commitment. Eur. J. Bus. Manag. 2017, 9, 134–145. [Google Scholar]
  94. Hinkin, T.R.; Tracey, J.B. The Cost of Turnover: Putting a Price on the Learning Curve. Cornell Hotel. Restaur. Adm. Q. 2000, 41, 14–21. [Google Scholar] [CrossRef]
  95. Cho, S.; Johanson, M.M.; Guchait, P. Employees Intent to Leave: A Comparison of Determinants of Intent to Leave versus Intent to Stay. Int. J. Hosp. Manag. 2009, 28, 374–381. [Google Scholar] [CrossRef]
Figure 1. Research design.
Sustainability 13 07778 g001
Table 1. Sociodemographic Profiles.
n%
Age25 and below4516.6
26–3511341.7
36–457126.2
46 and above4215.5
Marital statusMarried13951.3
Single13248.7
Weekly Working Time20 h and below83.0
21–30 h10.4
31–40 h10338.0
41 h and above 15958.7
DepartmentFront desk/reception2710.0
Housekeeping13449.4
Food Bev./Kitchen4416.2
Personnel and HR176.3
Accounting51.8
Purchasing 31.1
Sales and marketing238.5
SPA114.1
Other72.6
Position LevelsLow 10639.1
Mid and Senior16560.9
EducationPrimary school4416.2
High School8431.0
College4717.3
University9635.4
Years of employment at the workplace6 months and below176.3
7–12 months5219.2
13–24 months7126.2
25–36 months4817.7
36 months and above8330.6
Years of employment in the Sector6 months and below10.4
7–12 months165.9
13–24 months4918.1
25–36 months7226.6
36 months and above13349.1
Total 271100.0
Table 2. EFA results of the Motivation scale.
Factors
Scale ItemF1: Growth and AchievementF2: Work Itself, Responsibility, and RecognitionF3: Interpersonal RelationshipsF4: Working ConditionsF5: SalaryTotal Item Correlation
I260.869 0.773
I240.818 0.848
I270.773 0.701
I250.652 0.638
I230.616 0.681
I17 0.765 0.580
I19 0.761 0.747
I28 0.710 0.610
I20 0.678 0.652
I29 0.663 0.517
I21 0.609 0.661
D8 0.831 0.784
D6 0.826 0.697
D7 0.775 0.807
D5 0.705 0.698
D11 0.806 0.638
D10 0.757 0.677
D12 0.704 0.651
D15 0.570 0.448
D1 0.9930.809
D2 0.8940.809
Reliability0.8850.8450.8830.7910.8930.908
Variance Explained (%)16.69316.66415.70512.6759.11370.849
Eigenvalue (Λ)7.8942.7331.6981.3601.203
KMO = 0.806; χ2(210) = 4054.098; Bartlett’s Test of Sphericity (p) = 0.000
Table 3. EFA results of the HAW scale.
Factors
Scale ItemF1: EngagementF2: Affective Org CommitmentF3: Job SatisfactionTotal Item Correlation
E30.942 0.848
E20.894 0.899
E10.848 0.827
A8 0.909 0.840
A7 0.845 0.869
A9 0.843 0.884
J5 0.9050.664
J6 0.8050.799
J4 0.5690.545
Reliability0.9290.9340.8120.903
Variance explained (%)31.77029.98923.25285.012
Eigenvalue (Λ)5.1811.5600.910
KMO = 0.810; χ2(36) = 2136.195; Bartlett’s Test of Sphericity (p) = 0.000
Table 4. Results for the “Motivation” measurement model.
FactorsScale ItemParameter Estimates (Factor Loads)Standard Errort
Values
p
Values
F1: Growth and Achievement I260.799---
I240.9590.06117.850***
I270.6160.05714.370***
I250.7540.08012.553***
I230.7180.06412.907***
F2: Work Itself, Responsibility, and RecognitionI170.473---
I190.8360.2298.928***
I280.5400.1876.930***
I200.8100.2487.490***
I290.4360.2075.473***
I210.8180.2497.513***
F3: Interpersonal RelationshipsD80.797---
D60.6930.06114.704***
D70.9020.06915.909***
D50.8010.07614.199***
F4: Working ConditionsD110.759---
D100.7920.09012.083***
D120.7650.08911.755***
D150.4900.0937.516***
F5: SalaryD10.749---
D20.8900.1678.060***
*** p < 0.05.
Table 5. Goodness of fit values of the Motivation.
Structural Model ValuesRecommended Values
GFI0.822≥0.80
CFI0.816≥0.80
NFI0.840≥0.80
SRMR0.083≤ 0.10
χ2: 982.187, df: 172, p: 0.00
Recommendations are based on GFI = Goodness-of-Fit [84], CFI = Comparative Fit Index [85], NFI = Normed Fit index [86], SRMR = Standardized Root Mean Residual [87].
Table 6. Results for the HAW measurement model.
FactorsScale ItemsParameter Estimates (Factor Loads)Standard Errort
Values
p
Values
F1: EngagementE30.877---
E20.9810.04824.691***
E10.8490.05619.450***
F2: Affective Org CommitmentA80.781---
A70.9160.06916.078***
A90.9380.06716.859***
F3: Job SatisfactionJ50.769---
J60.9450.08814.369***
J40.6550.07410.175***
*** p < 0.05.
Table 7. Goodness of fit values of the HAW.
Structural Model ValuesRecommended Values
GFI0.887≥0.80
CFI0.923≥0.80
NFI0.915≥0.80
SRMR0.080≤0.10
χ2: 185.265, df: 21, p: 0.000
Recommendations are based on GFI= Goodness-of-Fit [84], CFI = Comparative Fit Index [85], NFI = Normed Fit index [86], SRMR = Standardized Root Mean Residual [87].
Table 8. Summary of hypothesis testing.
EffectStd. Parameter EstimatesStd. ErrortpResult
H1: Growth and Achievement → ENG0.1030.0961.5950.111Not Supported
H2: Growth and Achievement → AOC0.4340.1286.5560.001 ***Supported
H3: Growth and Achievement → JS0.5320.0757.1070.001 ***Supported
H4: Work Itself, Responsibility, and Recognition → ENG0.5900.1088.7450.001 ***Supported
H5: Work Itself, Responsibility, and Recognition → AOC0.7360.13211.2890.001 ***Supported
H6: Work Itself, Responsibility, and Recognition → JS0.5970.0807.6650.001 ***Supported
H7: Interpersonal Relationships → ENG0.1560.0952.3810.001 ***Supported
H8: Interpersonal Relationships → AOC0.4860.1247.3740.001 ***Supported
H9: Interpersonal Relationships → JS0.2510.0673.7040.001 ***Supported
H10: Working Conditions → ENG0.5430.1536.6030.001 ***Supported
H11: Working Conditions → AOC0.6260.2346.9330.001 ***Supported
H12: Working Conditions → JS0.5330.1295.8440.001 ***Supported
H13: Salary → ENG−0.0590.077−1.5510.121Not Supported
H14: Salary → AOC0.2380.1013.5760.001 ***Supported
H15: Salary → JS0.4140.0565.6440.001 ***Supported
*** p < 0.001.
Publisher’s Note: MDPI stays neutral with regard to jurisdictional claims in published maps and institutional affiliations.

