
Implications for Tracking SDG Indicator Metrics with Gridded Population Data


 ,
,  , , , ,

Abstract
:1. Introduction
“By 2030, significantly reduce the number of deaths and the number of people affected and substantially decrease the direct economic losses relative to global gross domestic product caused by disasters, including water-related disasters, with a focus on protecting the poor and people in vulnerable situations.”
2. Materials and Methods
2.1. Dataset Descriptions
2.1.1. Population Data
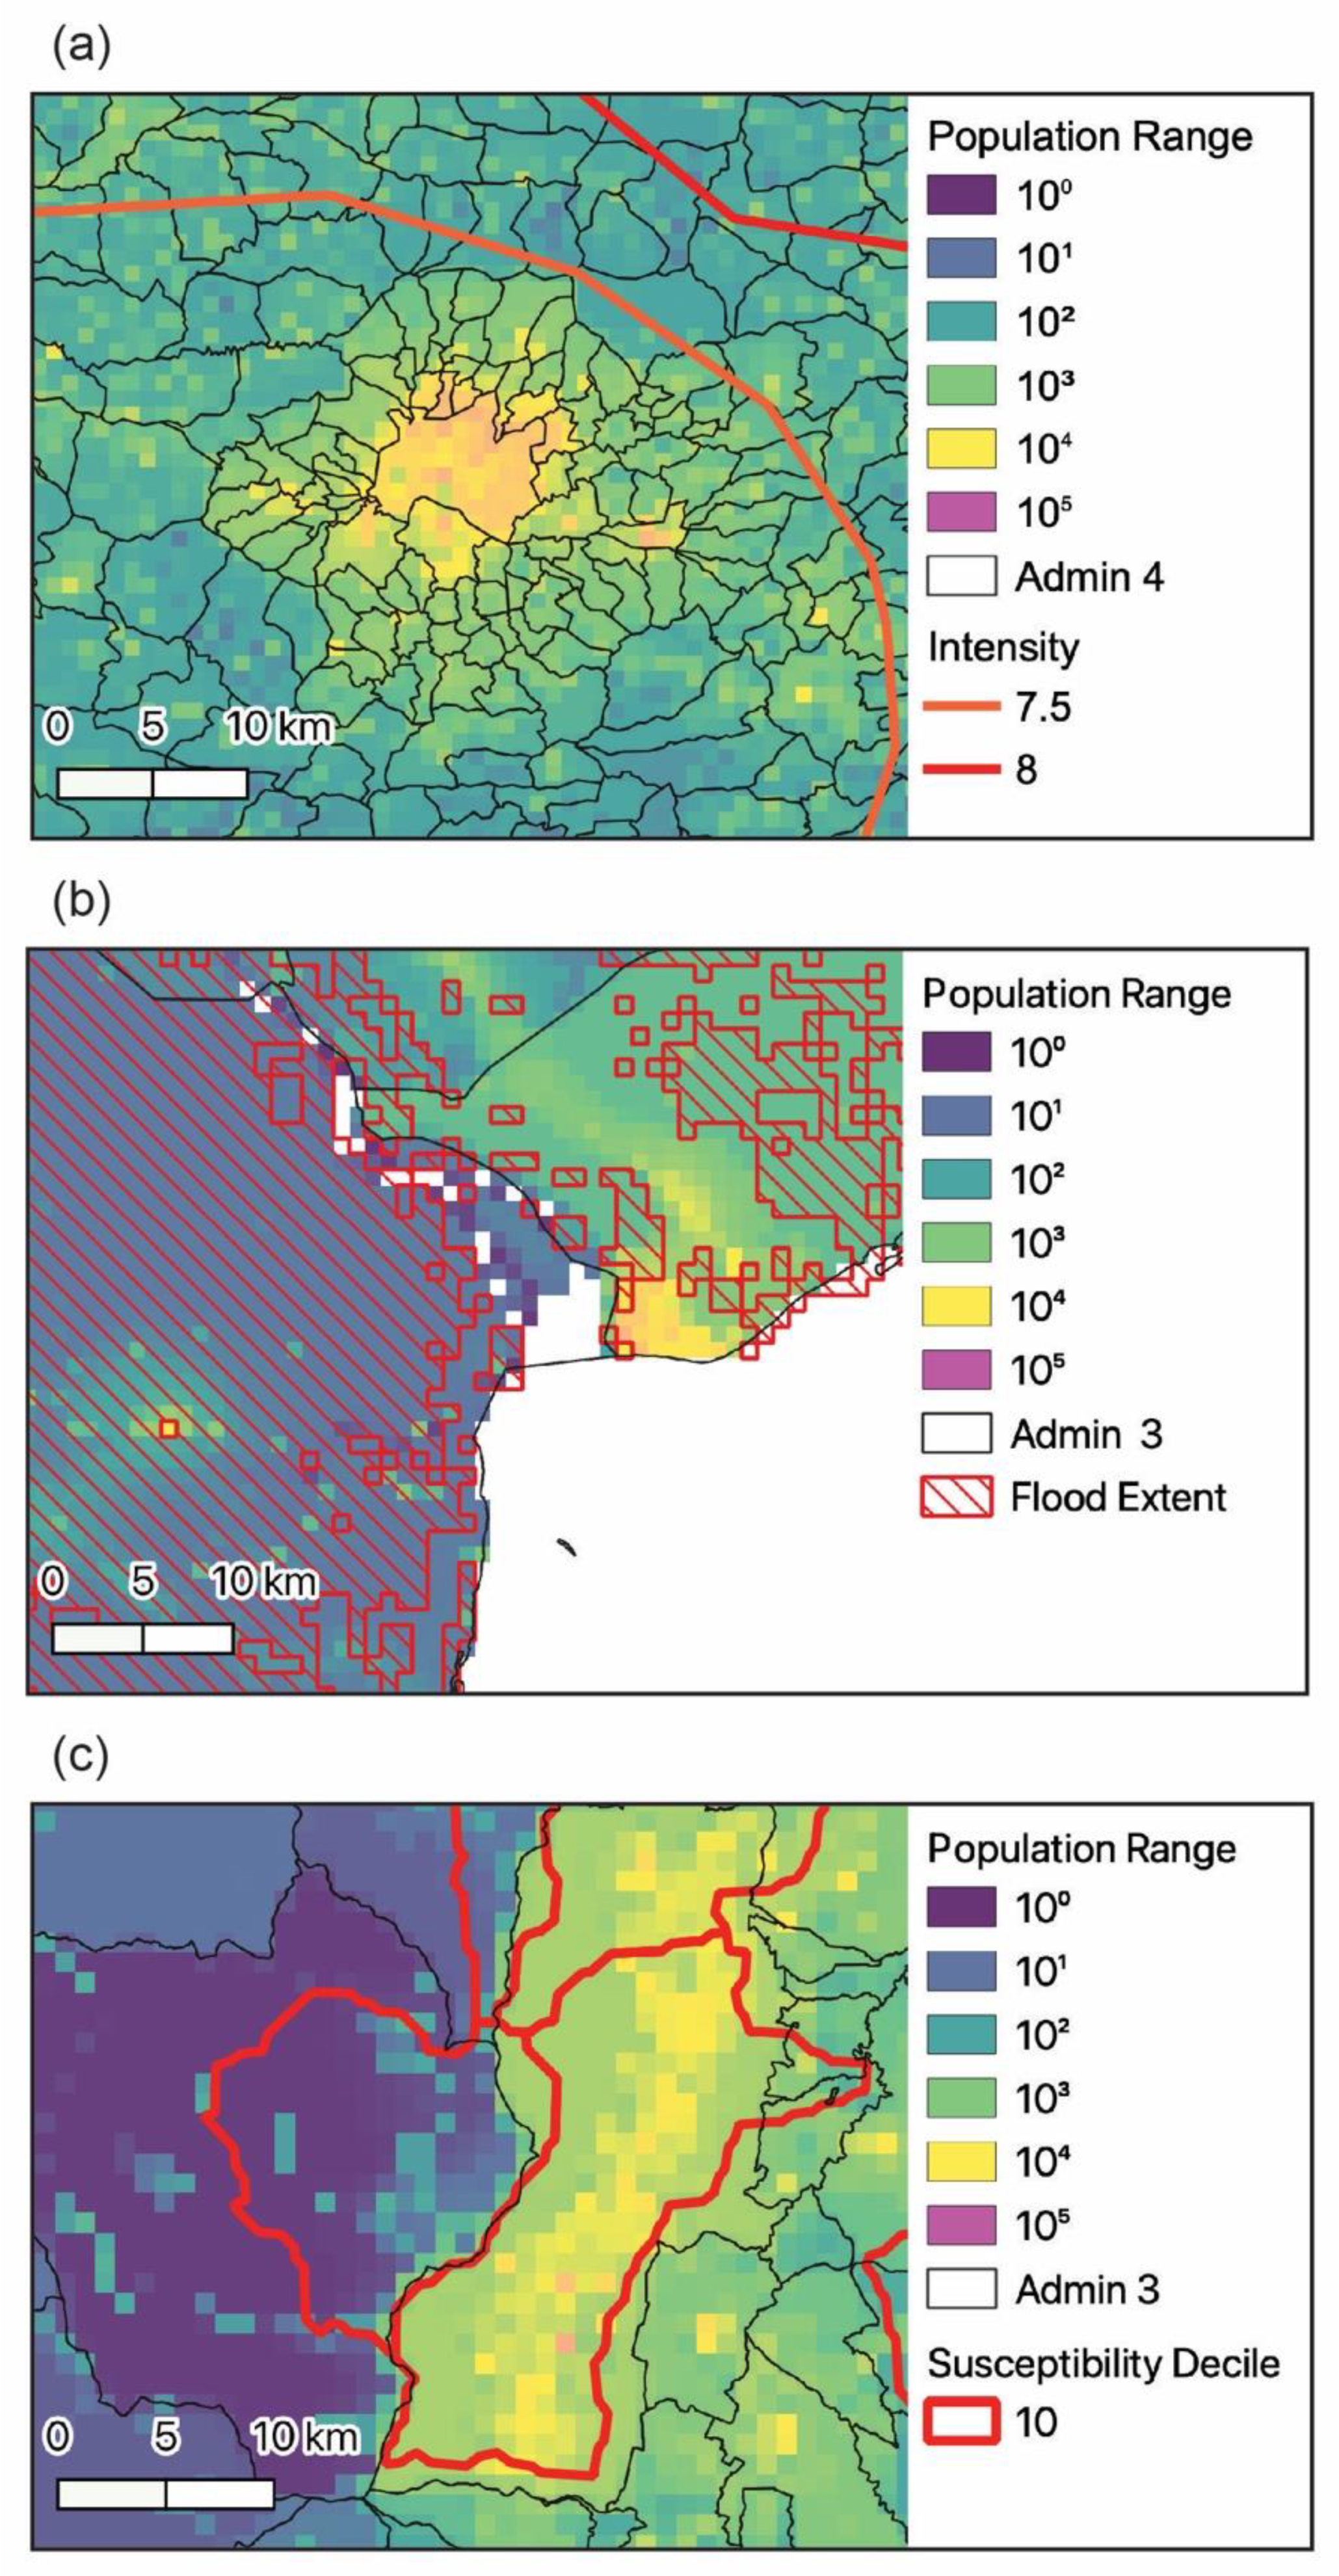
2.1.2. Hazards Impacts & Data
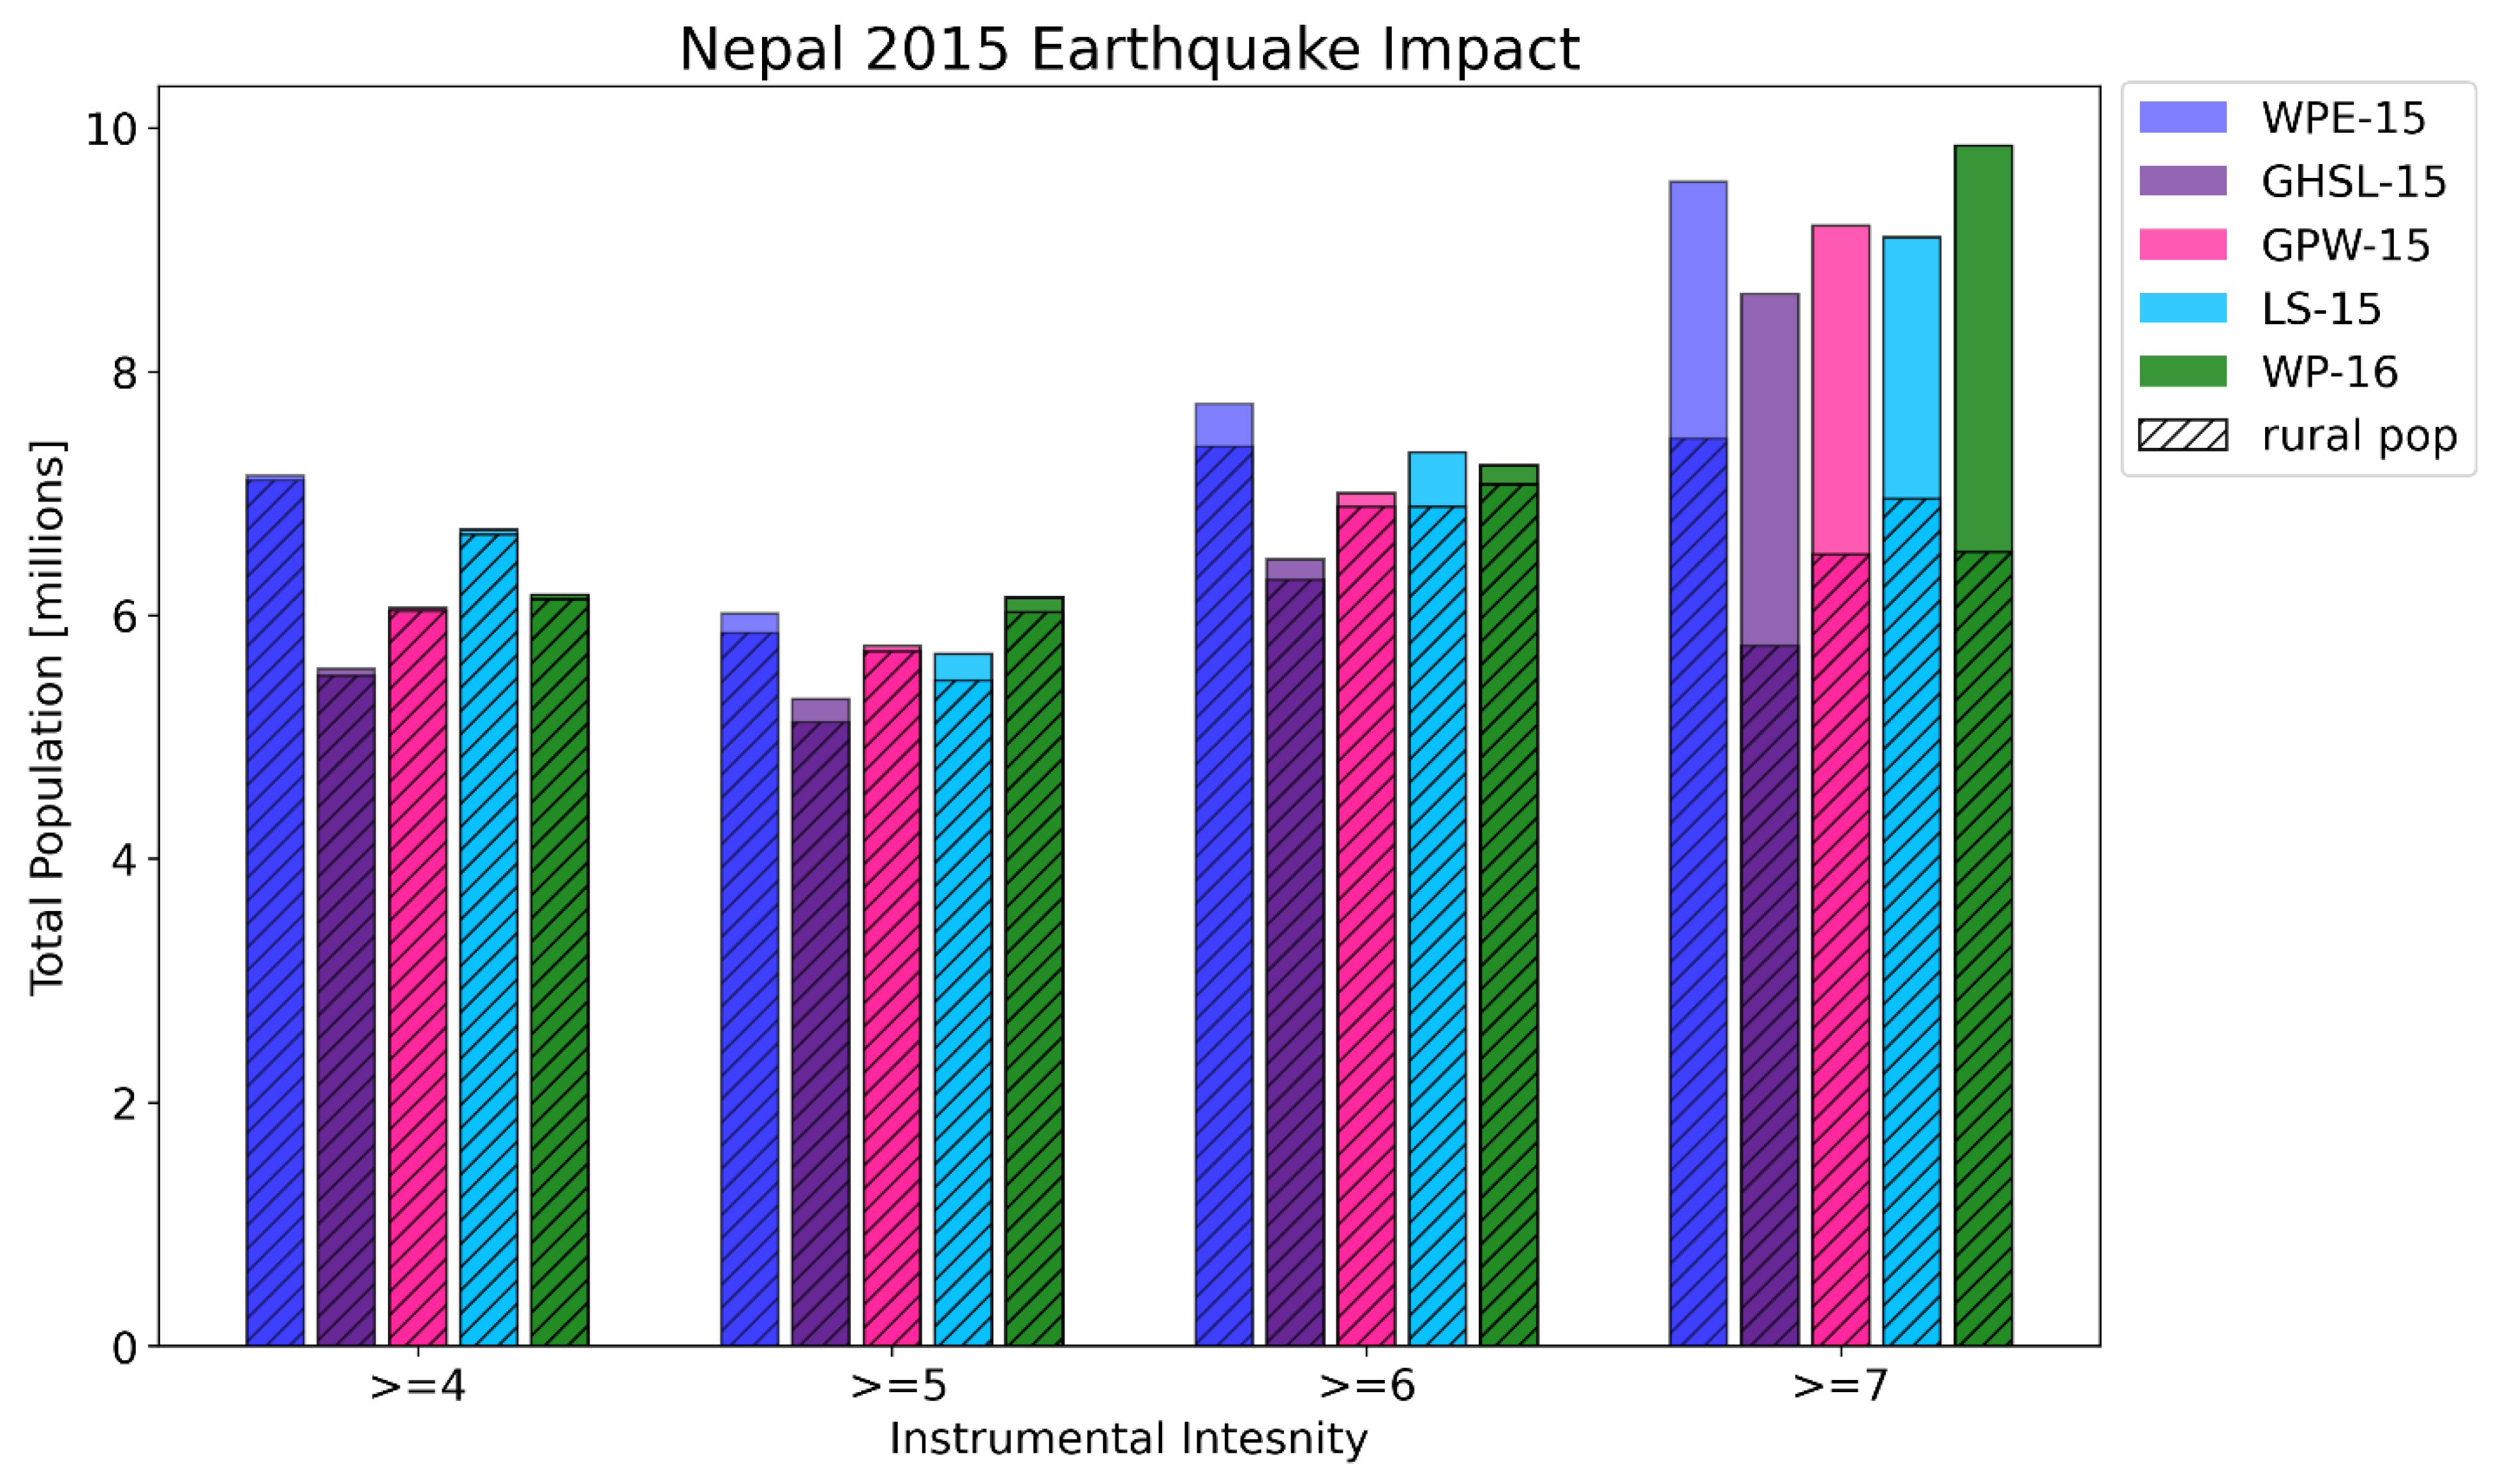
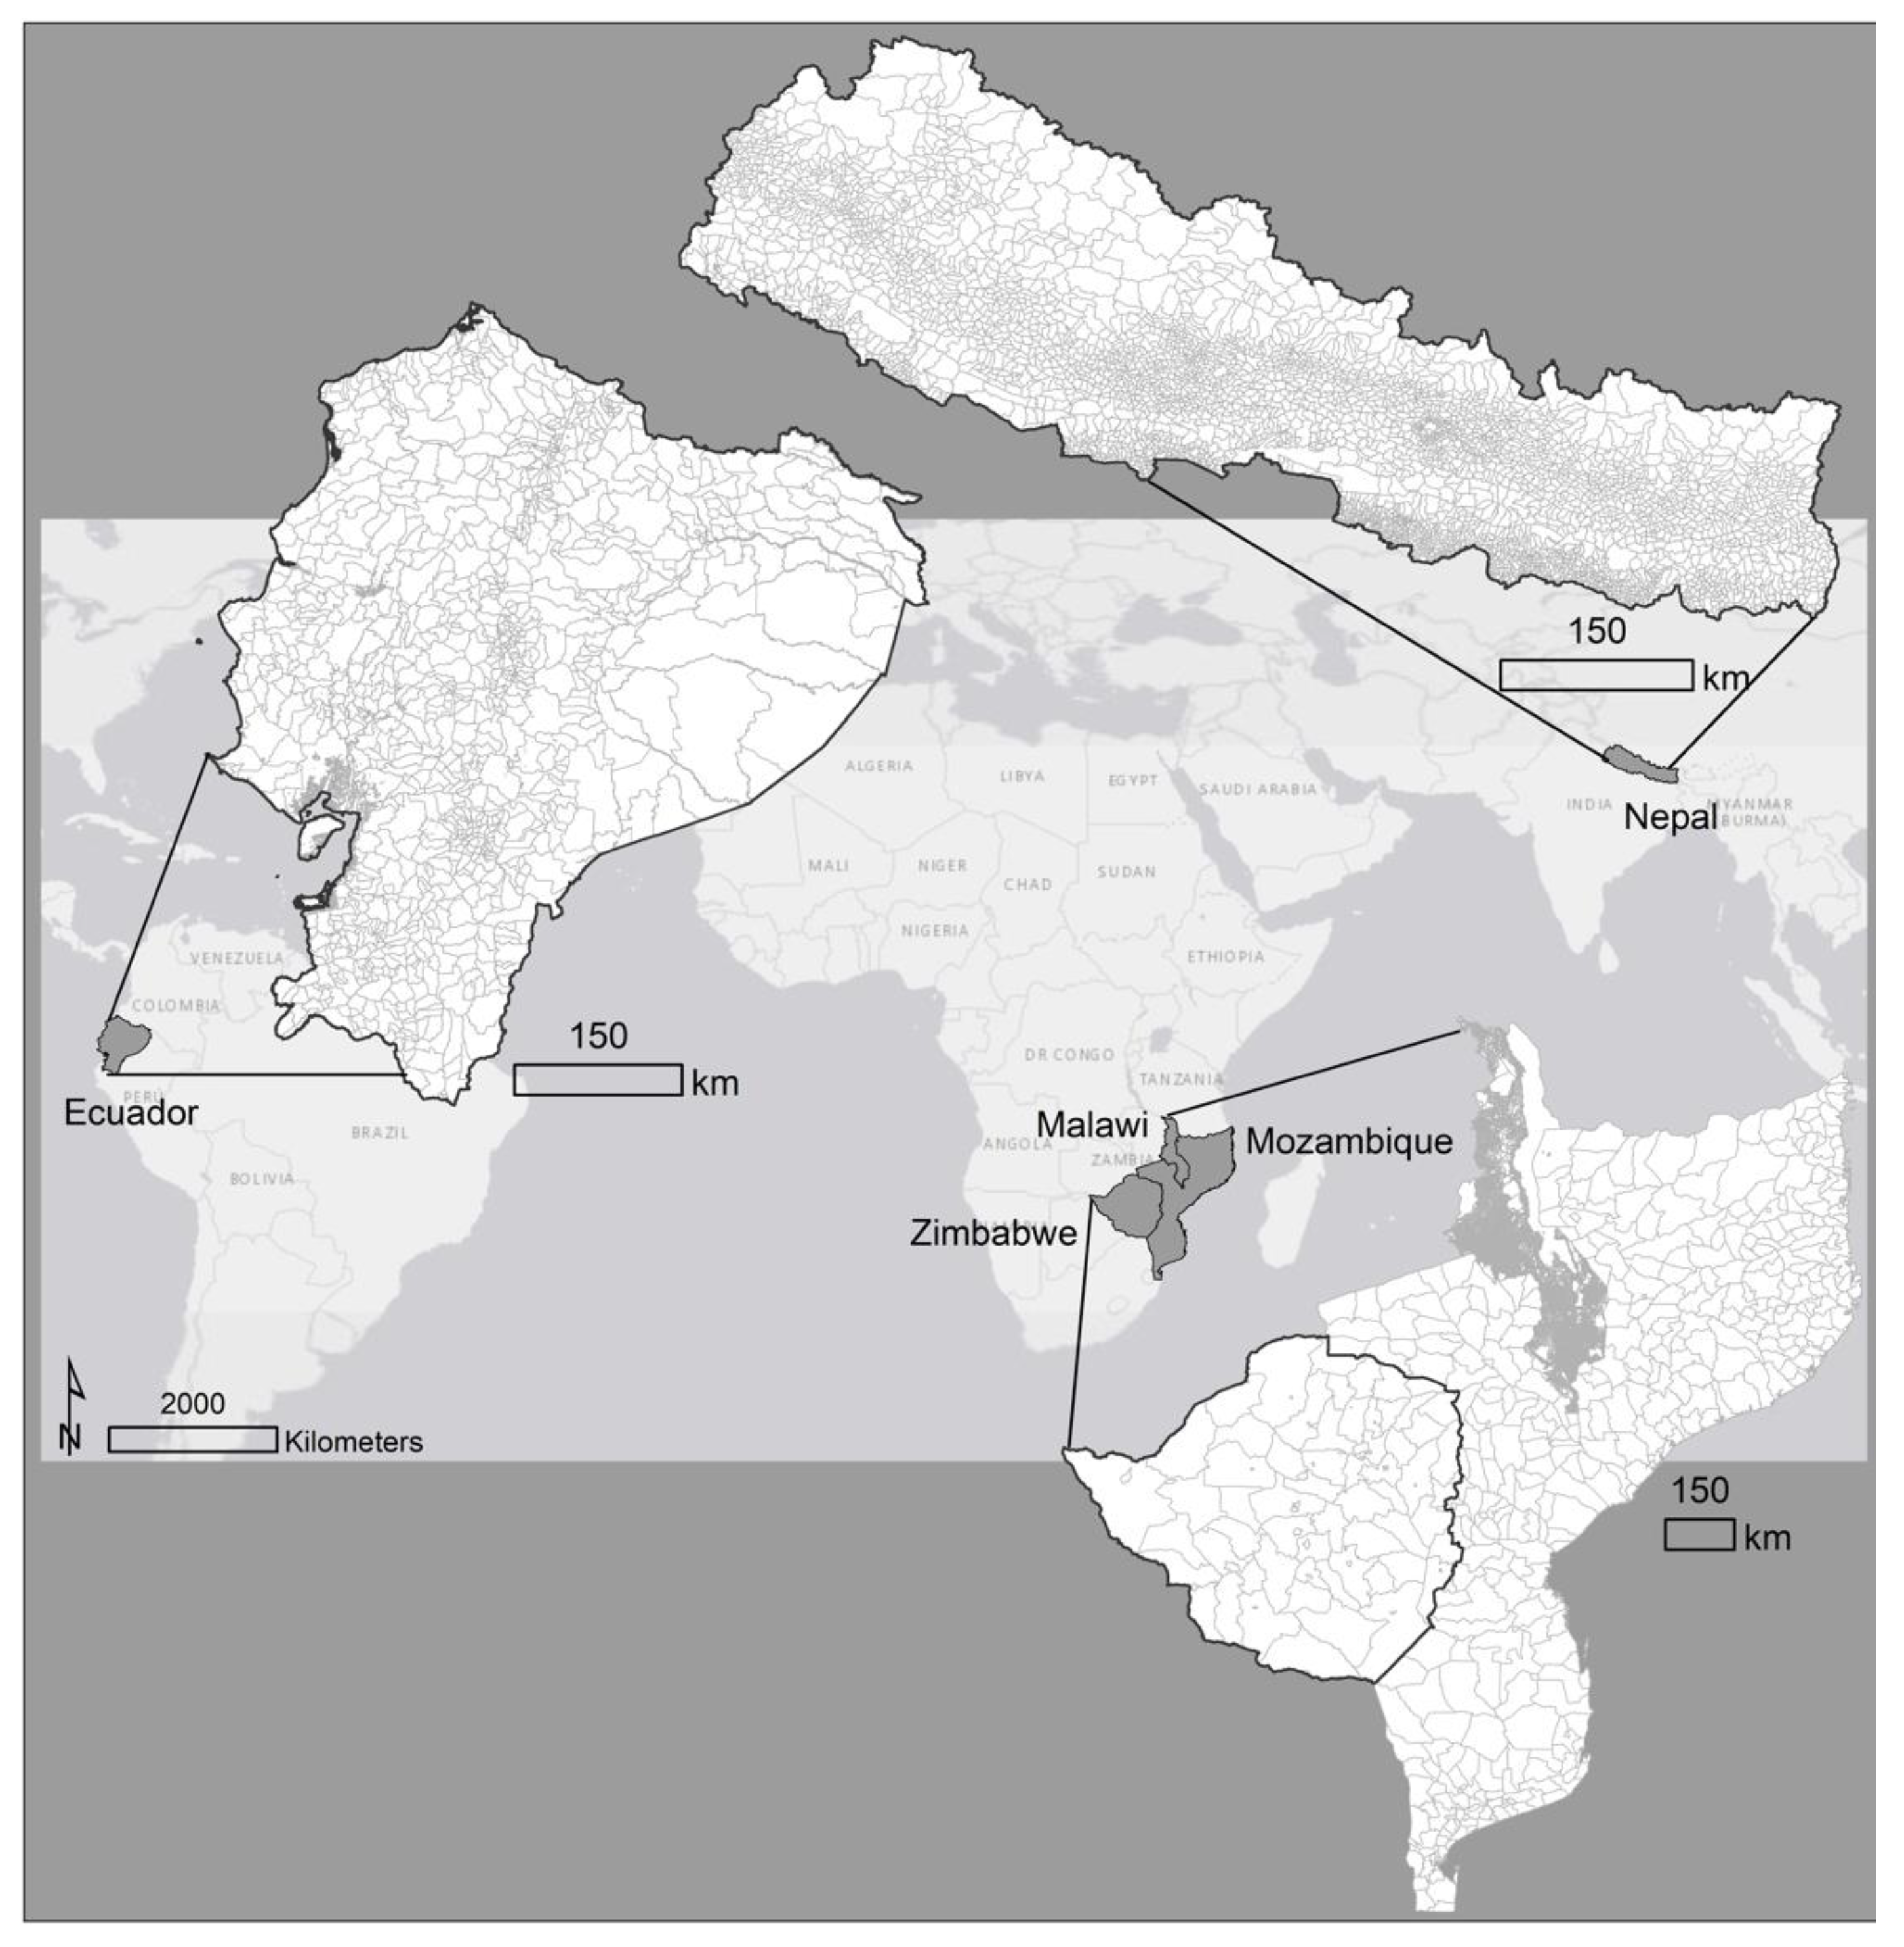
2015 Nepal Earthquake
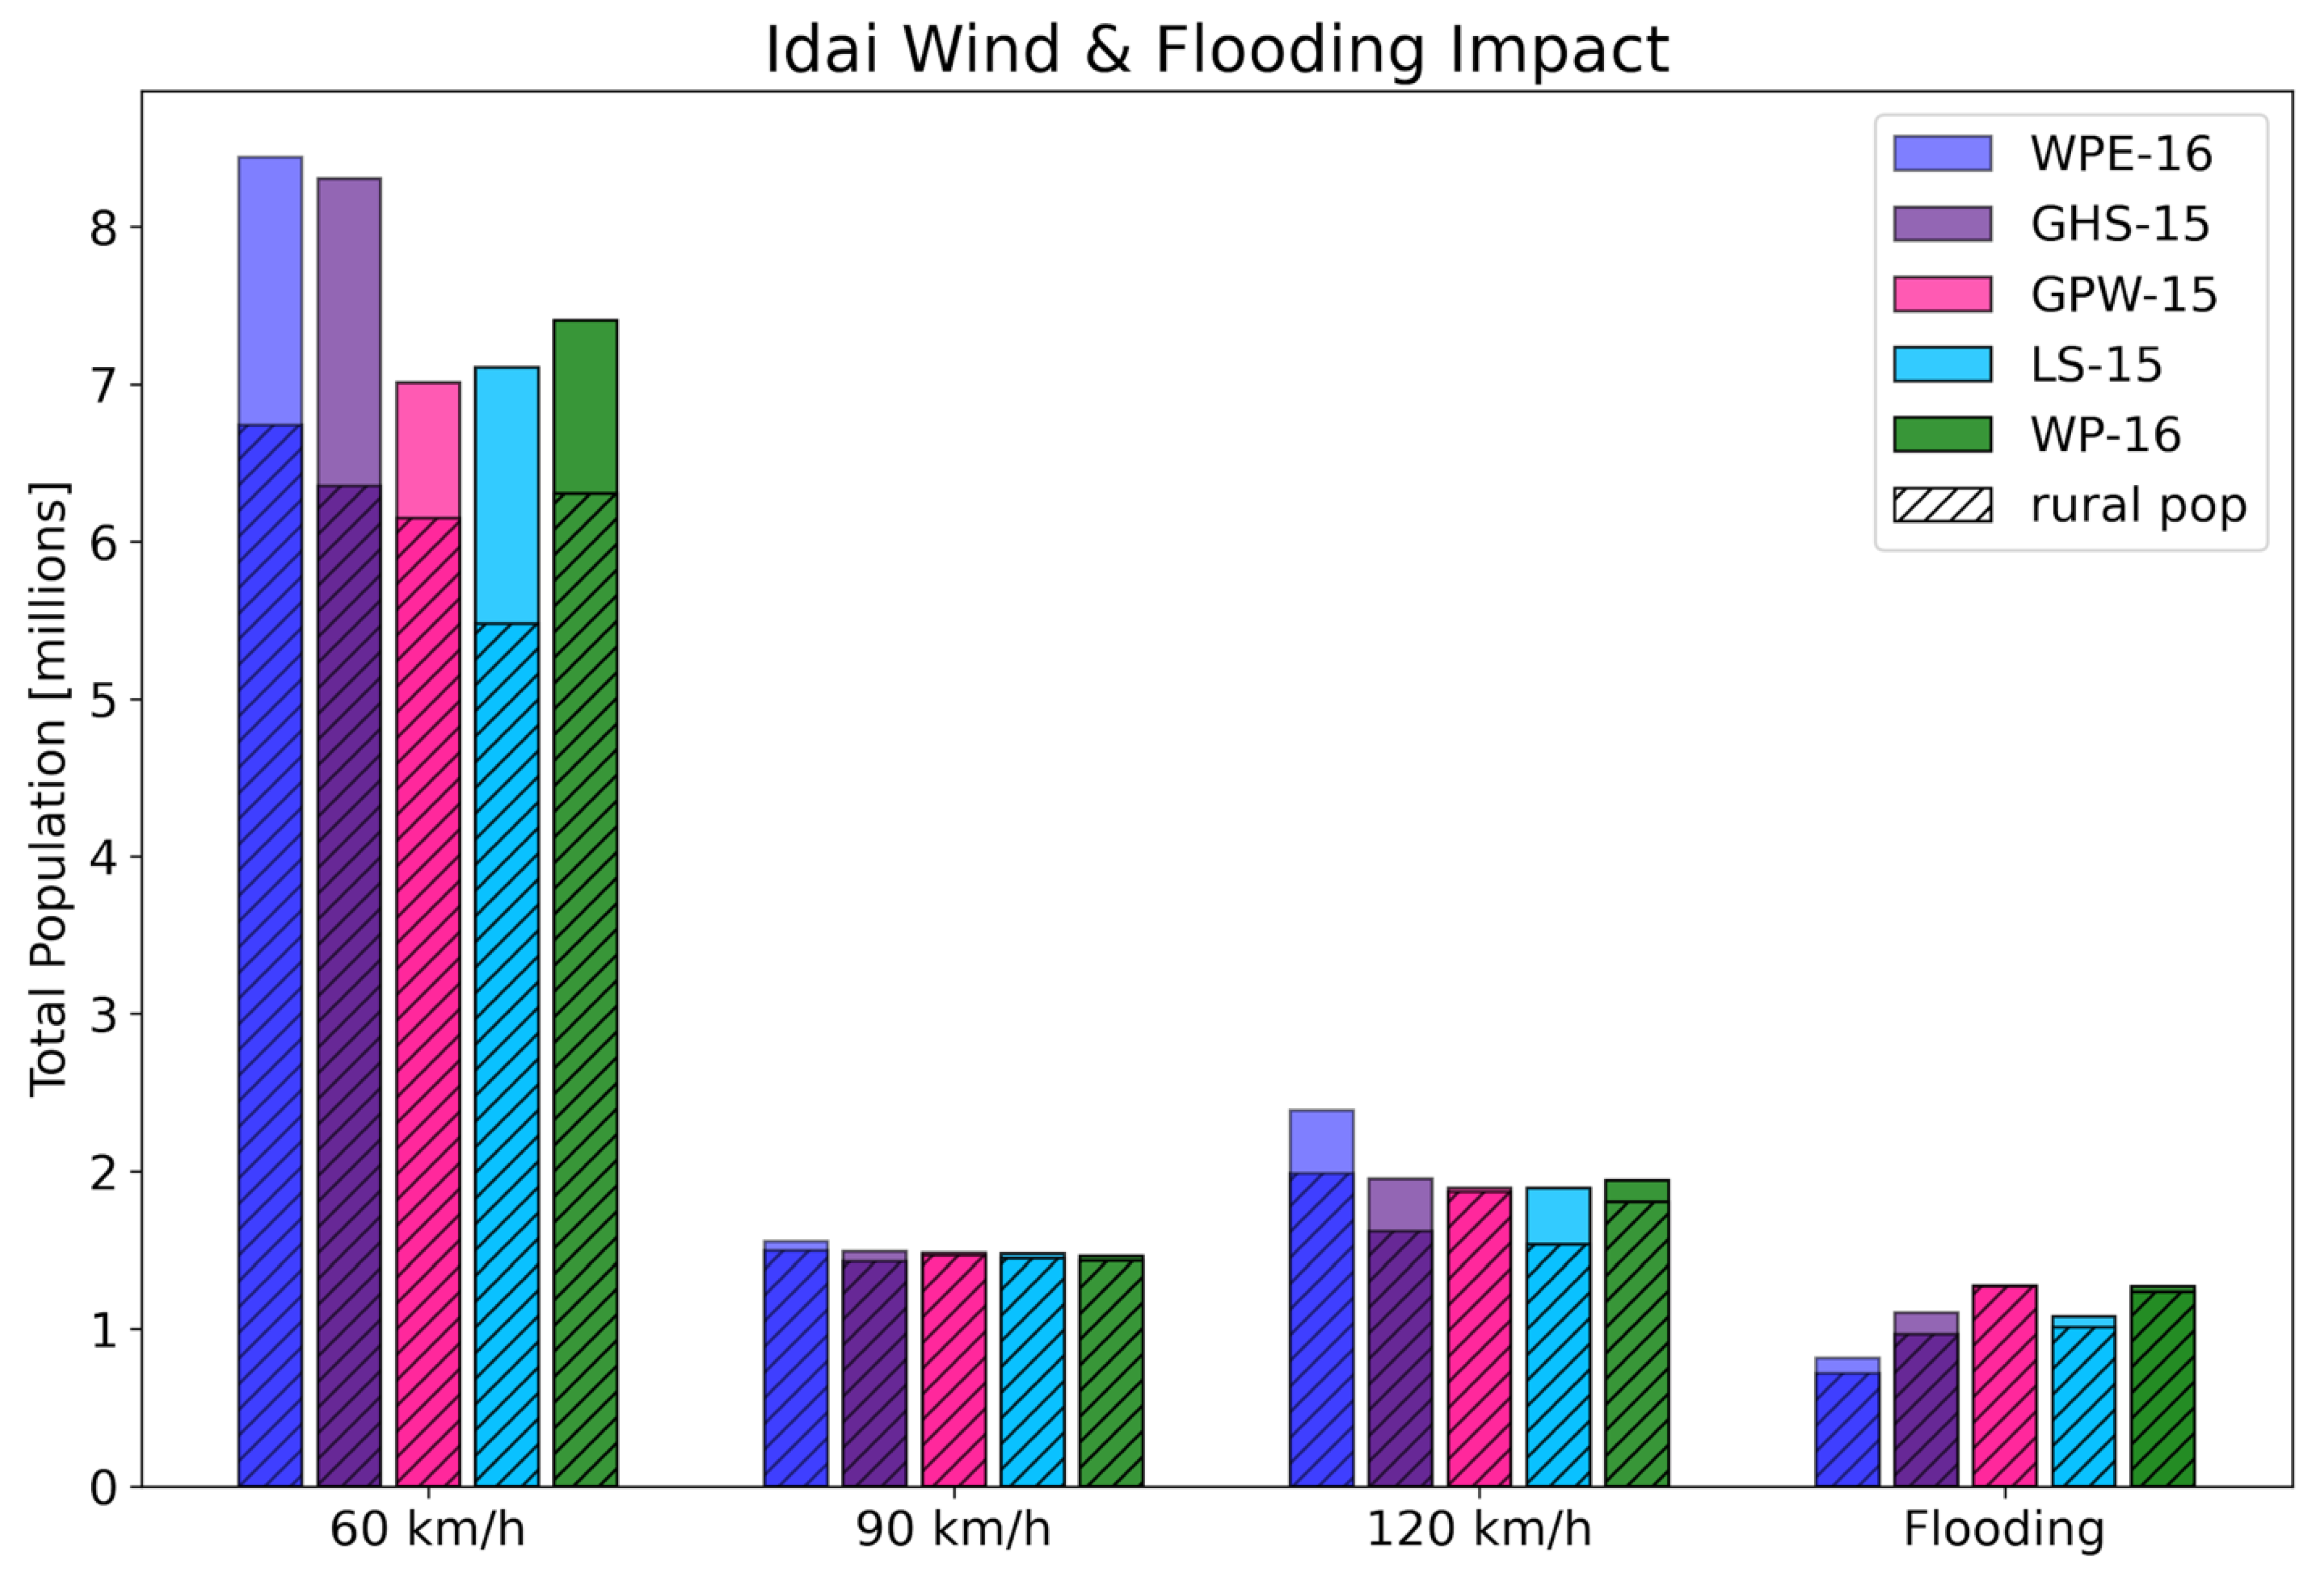
2019 Cyclone Idai
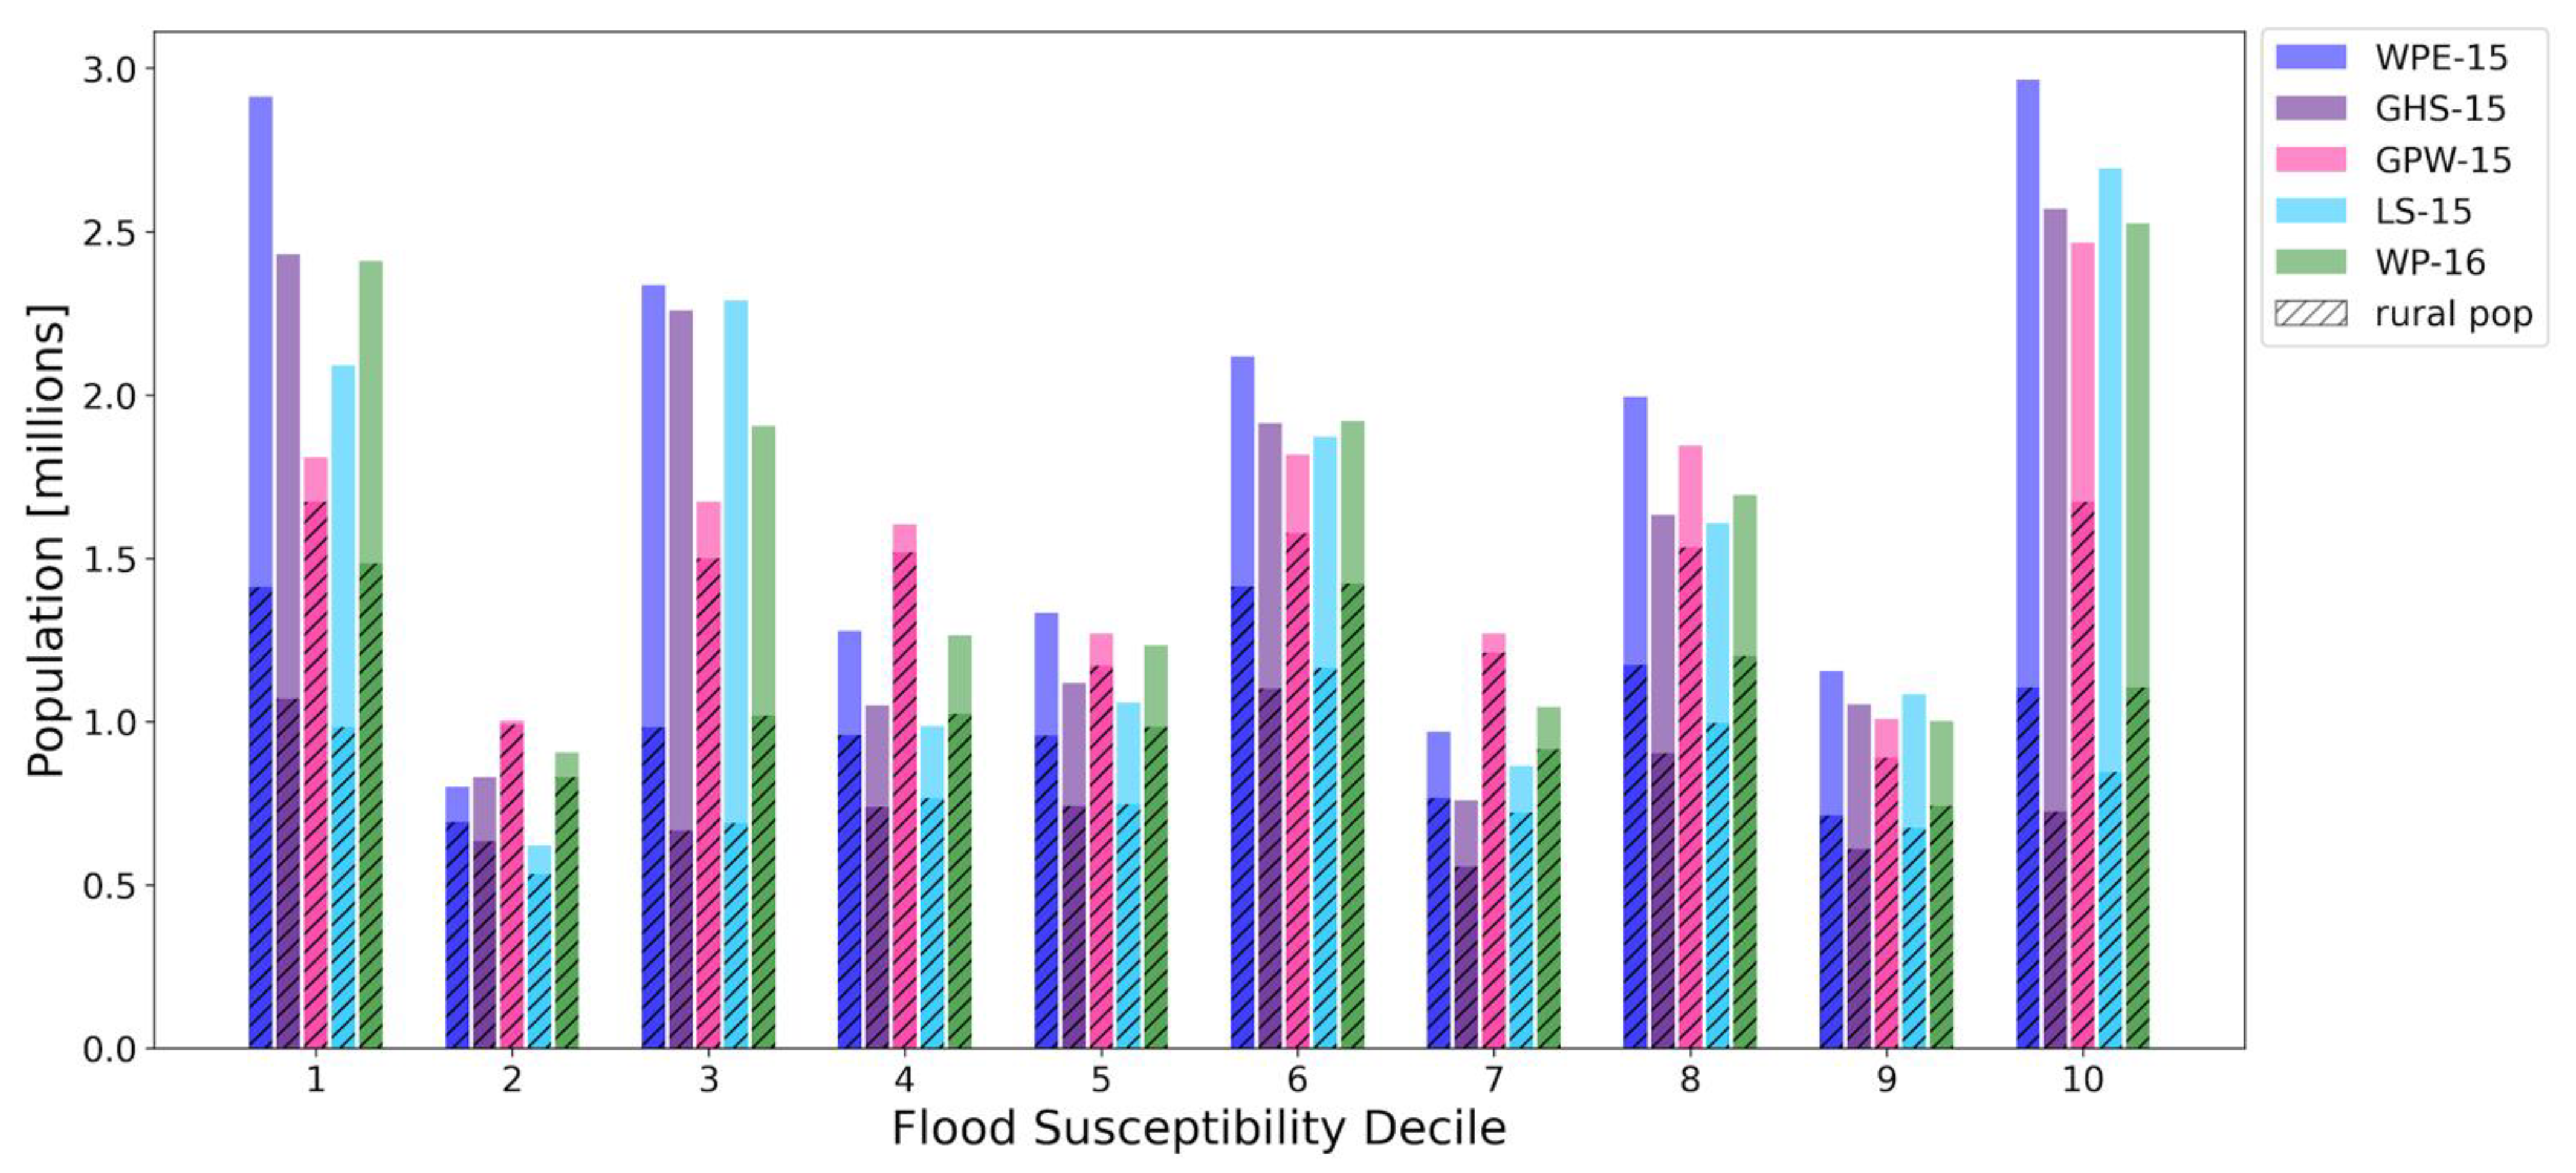
Ecuador Flash Flood Susceptibility
Urban/Rural Data
2.2. Raster Processing & Analysis
3. Results
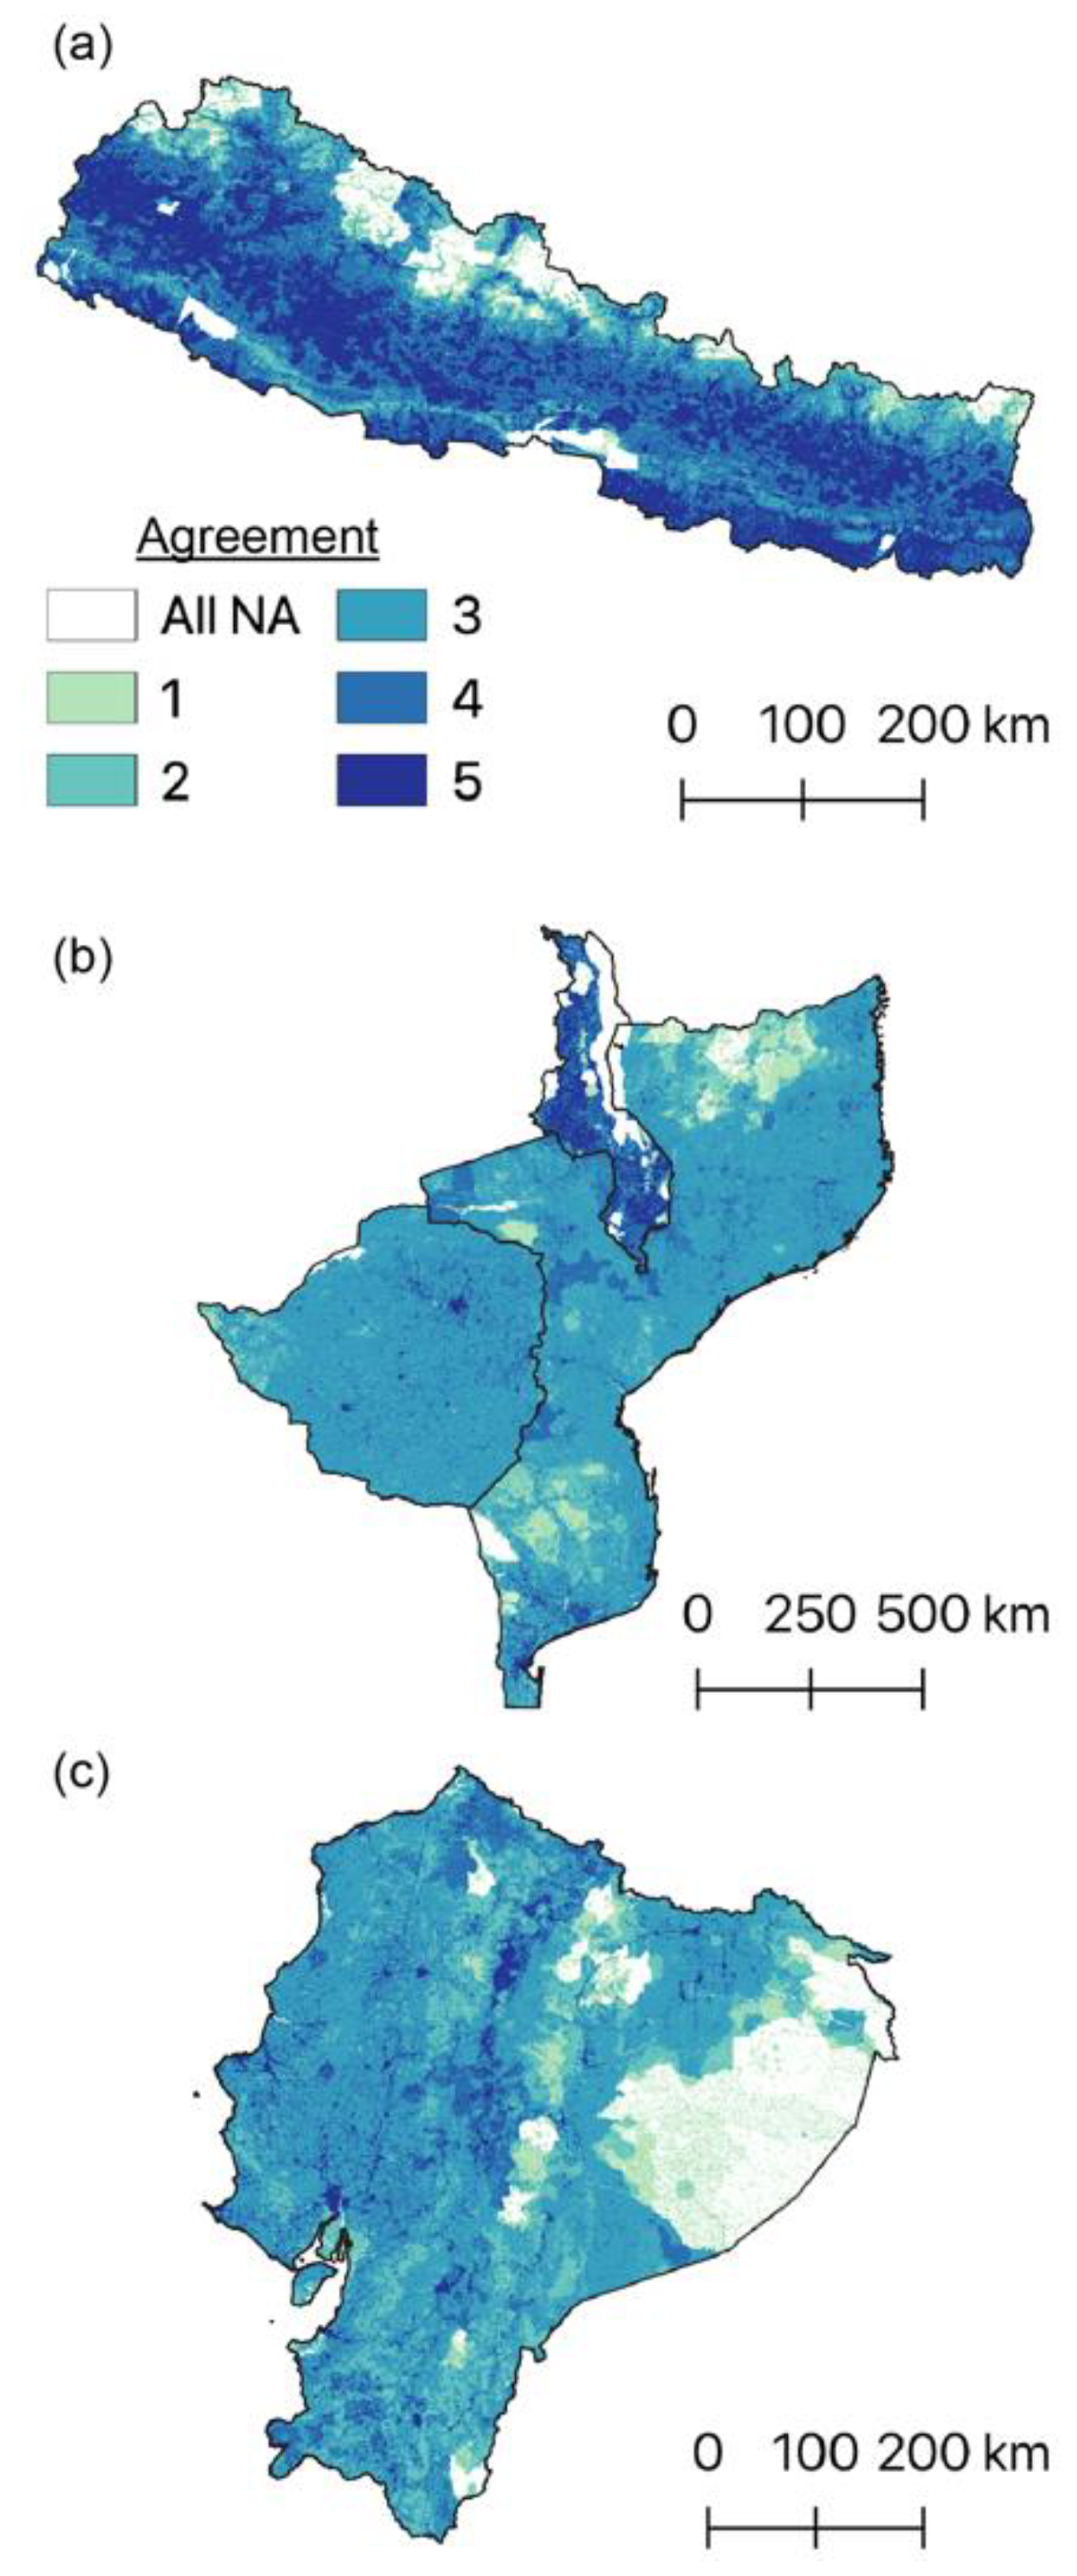
3.1. Pixel-Level Comparisons
3.1.1. Cyclone Idai Exposure in MMZ
3.1.2. Flash Flood Susceptibility in Ecuador
4. Discussion
5. Conclusions
Supplementary Materials
Author Contributions
Funding
Institutional Review Board Statement
Informed Consent Statement
Data Availability Statement
Acknowledgments
Conflicts of Interest
References
- UN-DESA. Sustainable Development Goals. Available online: https://sdgs.un.org/goals (accessed on 1 March 2021).
- Sachs, J.D. From millennium development goals to sustainable development goals. Lancet 2012, 379, 2206–2211. [Google Scholar] [CrossRef]
- Griggs, D.J.; Nilsson, M.; Stevance, A.; McCollum, D. (Eds.) A Guide to SDG Interactions: From Science to Implementation; International Council for Science (ICSU): Paris, France, 2017; Available online: https://council.science/wp-content/uploads/2017/05/SDGs-Guide-to-Interactions.pdf (accessed on 20 January 2021).
- Attaran, A. An immeasurable crisis? A criticism of the millennium development goals and why they cannot be measured. PLoS Med. 2005, 2, e318. [Google Scholar] [CrossRef] [Green Version]
- Thematic Research Network on Data and Statistics (TReNDS). Leaving No One Off the Map: A Guide for Gridded Population Data for Sustainable Development. 2020. Available online: https://static1.squarespace.com/static/5b4f63e14eddec374f416232/t/5eb2b65ec575060f0adb1feb/1588770424043/Leaving+no+one+off+the+map-4.pdf (accessed on 20 January 2021).
- About the Global Partnership for Sustainable Development Data. Available online: https://www.data4sdgs.org/index.php/about-gpsdd (accessed on 1 March 2021).
- Avtar, R.; Aggarwal, R.; Kharrazi, A.; Kumar, P.; Kurniawan, T.A. Utilizing geospatial information to implement SDGs and monitor their Progress. Environ. Monit. Assess. 2019, 192, 35. [Google Scholar] [CrossRef] [PubMed]
- Kavvada, A.; Metternicht, G.; Kerblat, F.; Mudau, N.; Haldorson, M.; Laldaparsad, S.; Friedl, L.; Held, A.; Chuvieco, E. Towards delivering on the sustainable development goals using earth observations. Remote Sens. Environ. 2020, 247, 111930. [Google Scholar] [CrossRef]
- Kussul, N.; Lavreniuk, M.; Kolotii, A.; Skakun, S.; Rakoid, O.; Shumilo, L. A workflow for sustainable development goals indicators assessment based on high-resolution satellite data. Int. J. Digit. Earth 2020, 13, 309–321. [Google Scholar] [CrossRef]
- Estoque, R.C. A review of the sustainability concept and the state of SDG monitoring using remote sensing. Remote Sens. 2020, 12, 1770. [Google Scholar] [CrossRef]
- Kavvada, A.; Held, A. Analysis-ready earth observation data and the united nations sustainable development goals. In Proceedings of the IGARSS 2018—2018 IEEE International Geoscience and Remote Sensing Symposium, Valencia, Spain, 22–27 July 2018; pp. 434–436. [Google Scholar]
- De Lamo, X.; Simonson, W. Earth Observation for SDG: Compendium of Earth Observation Contributions to the SDG Targets and Indicators. ESA. May 2020. Available online: https://eo4society.esa.int/wp-content/uploads/2021/01/EO_Compendium-for-SDGs.pdf (accessed on 20 January 2021).
- Wardrop, N.A.; Jochem, W.C.; Bird, T.J.; Chamberlain, H.R.; Clarke, D.; Kerr, D.; Bengtsson, L.; Juran, S.; Seaman, V.; Tatem, A.J. Spatially disaggregated population estimates in the absence of national population and housing census data. Proc. Natl. Acad. Sci. USA 2018, 115, 3529–3537. [Google Scholar] [CrossRef] [Green Version]
- Juran, S.; Broer, P.N.; Klug, S.J.; Snow, R.C.; Okiro, E.; Ouma, P.O.; Snow, R.; Tatem, A.J.; Meara, J.G.; Alegana, V.A. Geospatial mapping of access to timely essential surgery in sub-Saharan Africa. BMJ Glob. Health 2018, 3, e000875. [Google Scholar] [CrossRef] [Green Version]
- Dotse-Gborgbortsi, W.; Dwomoh, D.; Alegana, V.; Hill, A.; Tatem, A.J.; Wright, J. The influence of distance and quality on utilisation of birthing services at health facilities in Eastern Region, Ghana. BMJ Glob. Health 2019, 4, e002020. [Google Scholar] [CrossRef] [Green Version]
- Palacios-Lopez, D.; Bachofer, F.; Esch, T.; Marconcini, M.; MacManus, K.; Sorichetta, A.; Zeidler, J.; Dech, S.; Tatem, A.; Reinartz, P. High-resolution gridded population datasets: Exploring the Capabilities of the world settlement footprint 2019 imperviousness layer for the African continent. Remote Sens. 2021, 13, 1142. [Google Scholar] [CrossRef]
- Melchiorri, M.; Pesaresi, M.; Florczyk, A.J.; Corbane, C.; Kemper, T. Principles and applications of the global human settlement layer as baseline for the land use efficiency indicator—SDG 11.3.1. ISPRS Int. J. Geo Inf. 2019, 8, 96. [Google Scholar] [CrossRef] [Green Version]
- Qiu, Y.; Zhao, X.; Fan, D.; Li, S. Geospatial disaggregation of population data in supporting SDG assessments: A case study from Deqing county, China. ISPRS Int. J. Geo Inf. 2019, 8, 356. [Google Scholar] [CrossRef] [Green Version]
- Schiavina, M.; Melchiorri, M.; Corbane, C.; Florczyk, A.; Freire, S.; Pesaresi, M.; Kemper, T. Multi-scale estimation of land use efficiency (SDG 11.3.1) across 25 years using global open and free data. Sustain. Sci. Pract. Policy 2019, 11, 5674. [Google Scholar] [CrossRef] [Green Version]
- Leyk, S.; Gaughan, A.E.; Adamo, S.B. The spatial allocation of population: A review of large-scale gridded population data products and their fitness for use. Earth Syst. Monit. 2019. Available online: https://www.earth-syst-sci-data.net/11/1385/2019/essd-11-1385-2019-discussion.html (accessed on 20 January 2021). [CrossRef] [Green Version]
- Archila Bustos, M.F.; Hall, O.; Niedomysl, T.; Ernstson, U. A pixel level evaluation of five multitemporal global gridded population datasets: A case study in Sweden, 1990–2015. Popul. Environ. 2020, 42, 255–277. [Google Scholar] [CrossRef]
- Chen, R.; Yan, H.; Liu, F.; Du, W.; Yang, Y. Multiple global population datasets: Differences and spatial distribution characteristics. ISPRS Int. J. Geo Inf. 2020, 9, 637. [Google Scholar] [CrossRef]
- Smith, A.; Bates, P.D.; Wing, O.; Sampson, C.; Quinn, N.; Neal, J. New estimates of flood exposure in developing countries using high-resolution population data. Nat. Commun. 2019, 10, 1814. [Google Scholar] [CrossRef] [PubMed] [Green Version]
- Fries, B.F.; Guerra, C.A.; García, G.A.; Wu, S.L.; Smith, J.M.; Oyono, J.N.M.; Donfack, O.T.; Nfumu, J.O.O.; Hay, S.I.; Smith, D.L.; et al. Measuring the accuracy of gridded human population density surfaces: A case study in Bioko Island, Equatorial Guinea. Cold Spring Harb. Lab. 2020. [Google Scholar] [CrossRef]
- Tuholske, C.; Caylor, K.; Evans, T.; Avery, R. Variability in urban population distributions across Africa. Environ. Res. Lett. 2019, 14, 85009. [Google Scholar] [CrossRef]
- Green, H.K.; Lysaght, O.; Saulnier, D.D.; Blanchard, K.; Humphrey, A.; Fakhruddin, B.; Murray, V. Challenges with disaster mortality data and measuring progress towards the implementation of the sendai framework. Int. J. Disaster Risk Sci. 2019, 10, 449–461. [Google Scholar] [CrossRef] [Green Version]
- Mizutori, M. Reflections on the sendai framework for disaster risk reduction: Five years since its adoption. Int. J. Disaster Risk Sci. 2020, 11, 147–151. [Google Scholar] [CrossRef] [Green Version]
- Dagys, K. The Effectiveness of Forecast-Based Humanitarian Assistance in Anticipation of Extreme Winters: Evidence from an Intervention for Vulnerable Herders in Mongolia. 2020. Available online: https://www.researchgate.net/profile/Kadirbyek_Dagys/publication/347885328_The_effectiveness_of_forecast-based_humanitarian_assistance_in_anticipation_of_extreme_winters_Evidence_from_an_intervention_for_vulnerable_herders_in_Mongolia/links/5fe570d0a6fdccdcb8fc06a2/The-effectiveness-of-forecast-based-humanitarian-assistance-in-anticipation-of-extreme-winters-Evidence-from-an-intervention-for-vulnerable-herders-in-Mongolia.pdf (accessed on 2 March 2021).
- Cattaneo, A.; Nelson, A. Global mapping of urban–rural catchment areas reveals unequal access to services. Proc. Natl. Acad. Sci. USA 2021. Available online: https://www.pnas.org/content/118/2/e2011990118.short (accessed on 1 June 2021). [CrossRef] [PubMed]
- Frye, C.; Wright, D.J.; Nordstrand, E.; Terborgh, C.; Foust, J. Using classified and unclassified land cover data to estimate the footprint of human settlement. Data Sci. J. 2018, 17. Available online: https://datascience.codata.org/articles/10.5334/dsj-2018-020/?toggle_hypothesis=on (accessed on 20 January 2021). [CrossRef]
- Florczyk, A.J.; Corbane, C.; Ehrlich, D.; Freire, S.; Kemper, T.; Maffenini, L.; Melchiorri, M.; Pesaresi, M.; Politis, P.; Schiavina, M.; et al. GHSL Data Package 2019; JRC Technical Report: Luxembourg, 2019. [Google Scholar] [CrossRef]
- NASA Socioeconomic Data and Applications Center (SEDAC). Gridded Population of the World, Version 4; (GPWv4): Population Density Adjusted to Match 2015; NASA Socioeconomic Data and Applications Center (SEDAC): Palisades, NY, USA, 2018. [Google Scholar]
- LandScan. LandScan Datasets, LandScanTM. Available online: https://landscan.ornl.gov/index.php/landscan-datasets (accessed on 24 February 2019).
- Worldpop. WorldPop: Population. 18 November 2016. Available online: https://www.worldpop.org/doi/10.5258/SOTON/WP00004 (accessed on 24 February 2019).
- POPGRID. Input Layers for Global Gridded Data Sets. 2019. Available online: https://www.popgrid.org/data-docs-table2 (accessed on 24 February 2019).
- UN-DESA. World Urbanization Prospects 2018. Available online: https://esa.un.org/unpd/wup/ (accessed on 30 August 2018).
- Stevens, F.R.; Gaughan, A.E.; Linard, C.; Tatem, A.J. Disaggregating census data for population mapping using random forests with remotely-sensed and ancillary data. PLoS ONE 2015, 10, e0107042. [Google Scholar] [CrossRef] [PubMed] [Green Version]
- Dobson, J.E.; Bright, E.A.; Coleman, P.R.; Durfee, R.C.; Worley, B.A. LandScan: A global population database for estimating populations at risk. Photogramm. Eng. Remote Sens. 2000, 66, 849–857. [Google Scholar]
- USGS. M 7.8–36 km E of Khudi, Nepal. In Earthquake Hazards Program. Available online: https://earthquake.usgs.gov/earthquakes/eventpage/us20002926/executive (accessed on 4 March 2021).
- Hall, M.L.; Lee, A.C.K.; Cartwright, C.; Marahatta, S.; Karki, J.; Simkhada, P. The 2015 Nepal earthquake disaster: Lessons learned one year on. Public Health 2017, 145, 39–44. [Google Scholar] [CrossRef] [PubMed]
- Reid, K. 2015 Nepal Earthquake: Facts, FAQs, and How to Help. World Vision. 2018. Available online: https://www.worldvision.org/disaster-relief-news-stories/2015-nepal-earthquake-facts (accessed on 4 March 2021).
- Government of Nepal National Planning Commission, Kathmandu. Nepal Earthquake 2015 Post Disaster Needs Assessment Vol. B: Sector Reports. 2015. Available online: https://www.npc.gov.np/images/category/PDNA_volume_BFinalVersion.pdf (accessed on 20 January 2021).
- Ocha, U.N. Humanitarian Response Plan 2018–2019 (Revised Following Cyclone Idai, March 2019); United Nations Office for the Coordination of Humanitarian Affairs Mozambique. Available online: https://reliefweb.int/sites/reliefweb.int/files/resources/ROSEA_20190325_MozambiqueFlashAppeal.pdf (accessed on 20 January 2021).
- World Food Program. Mozambique Satellite Detected Waters, Cyclone Idai. 2019. Available online: https://data.humdata.org/dataset/mozambique-flood-detected-waters-cyclone-idai (accessed on 20 January 2021).
- EC-JRC. Overall Red Tropical Cyclone Alert for IDAI-19 in Mozambique, Zimbabwe, Miscellaneous (French) Indian Ocean Islands from 09 March 2019 06:00 UTC to 15 March 2019 00:00 UTC; Global Disaster Alert and Coordination System. Available online: https://www.gdacs.org/resources.aspx?eventid=1000552&episodeid=24&eventtype=TC (accessed on 20 January 2021).
- Ahern, M.; Kovats, R.S.; Wilkinson, P.; Few, R.; Matthies, F. Global health impacts of floods: Epidemiologic evidence. Epidemiol. Rev. 2005, 27, 36–46. [Google Scholar] [CrossRef] [PubMed] [Green Version]
- Montz, B.E.; Gruntfest, E. Flash flood mitigation: Recommendations for research and applications. Glob. Environ. Chang. Part B Environ. Hazards 2002, 4, 15–22. [Google Scholar] [CrossRef]
- Hallegatte, S.; Green, C.; Nicholls, R.J.; Corfee-Morlot, J. Future flood losses in major coastal cities. Nat. Clim. Chang. 2013, 3, 802–806. [Google Scholar] [CrossRef]
- SENPLADES. Boletín Informativo Costos de las Pérdidas por las Inundaciones, mes de Julio. 2012. Available online: https://reliefweb.int/sites/reliefweb.int/files/resources/Costos%20de%20las%20perdidas%20por%20las%20inundaciones%202012.pdf (accessed on 20 January 2021).
- Pinos, J.; Orellana, D.; Timbe, L. Assessment of microscale economic flood losses in urban and agricultural areas: Case study of the Santa Bárbara river, Ecuador. Nat. Hazards 2020, 103, 2323–2337. [Google Scholar] [CrossRef]
- Informe a la Nación 2007–2017; Planifica Ecuador Secretaría Técnica; 2017. Report No.: Informe Nacional, 214. Available online: www.planificación.gob.ec (accessed on 20 January 2021).
- Kruczkiewicz, A.; Bucherie, A.; Ayala, F.; Hultquist, C.; Vergara, H.; Mason, S.; Bazo, J.; de Sherbinin, A. Development of a flash flood confidence index from disaster reports and geophysical susceptibility. Remote Sens. 2021, 13. submitted. [Google Scholar]
- Chao, Y.-S.; Wu, C.-J. Principal component-based weighted indices and a framework to evaluate indices: Results from the Medical Expenditure Panel Survey 1996 to 2011. PLoS ONE 2017, 12, e0183997. [Google Scholar] [CrossRef]
- Janizadeh, S.; Avand, M.; Jaafari, A.; Van Phong, T.; Bayat, M.; Ahmadisharaf, E.; Prakash, I.; Pham, B.T.; Lee, S. Prediction success of machine learning methods for flash flood susceptibility mapping in the Tafresh watershed, Iran. Sustain. Sci. Pract. Policy 2019, 11, 5426. [Google Scholar] [CrossRef] [Green Version]
- Pham, B.T.; Avand, M.; Janizadeh, S.; Van Phong, T.; Al-Ansari, N.; Ho, L.; Das, S.; Van Le, H.; Amini, A.; Bozchaloei, S.K.; et al. GIS based hybrid computational approaches for flash flood susceptibility assessment. Water 2020, 12, 683. [Google Scholar] [CrossRef] [Green Version]
- Ullah, K.; Zhang, J. GIS-based flood hazard mapping using relative frequency ratio method: A case study of Panjkora river Basin, eastern Hindu Kush, Pakistan. PLoS ONE 2020, 15, e0229153. [Google Scholar] [CrossRef] [Green Version]
- Azmeri Hadihardaja, I.K.; Vadiya, R. Identification of flash flood hazard zones in mountainous small watershed of Aceh Besar Regency, Aceh Province, Indonesia. Egypt J. Remote Sens. Space Sci. 2016, 19, 143–160. [Google Scholar]
- Saharia, M.; Kirstetter, P.-E.; Vergara, H.; Gourley, J.J.; Hong, Y.; Giroud, M. Mapping flash flood severity in the United States. J. Hydrometeorol. 2017, 18, 397–411. [Google Scholar] [CrossRef]
- Mahmood, S.; Rahman, A.-U. Flash flood susceptibility modelling using geomorphometric approach in the Ushairy basin, eastern Hindu Kush. J. Earth Syst. Sci. 2019, 128. [Google Scholar] [CrossRef] [Green Version]
- Oruonye, E.D. Morphometry and flood in small drainage basin: Case study of Mayogwoi river basin in Jalingo, Taraba state Nigeria. J. Geogr. Environ. Earth Sci. Int. 2016, 5, 1–12. [Google Scholar] [CrossRef]
- Lehner, B.; Verdin, K.; Jarvis, A. New global hydrography derived from spaceborne elevation data. Eos 2008, 89, 93. [Google Scholar] [CrossRef]
- Huang, X.; Huang, J.; Wen, D.; Li, J. An updated MODIS global urban extent product (MGUP) from 2001 to 2018 based on an automated mapping approach. Int. J. Appl. Earth Obs. Geoinf. 2021, 95, 102255. [Google Scholar] [CrossRef]
- Global Human Settlement—Global Definition of Cities, Urban and Rural Areas—European Commission. 6 July 2016. Available online: https://ghsl.jrc.ec.europa.eu/degurba.php (accessed on 30 March 2021).
- Kulp, S.A.; Strauss, B.H. New elevation data triple estimates of global vulnerability to sea-level rise and coastal flooding. Nat. Commun. 2019, 10, 5752. [Google Scholar] [CrossRef] [Green Version]
- Mora, C.; Dousset, B.; Caldwell, I.R.; Powell, F.E.; Geronimo, R.C.; Bielecki, C.R.; Counsell, C.W.W.; Dietrich, B.S.; Johnston, E.T.; Louis, L.; et al. Global risk of deadly heat. Nat. Clim. Chang. 2017, 7, 501. [Google Scholar] [CrossRef]
- Lustgarten, A. The Great Climate Migration Has Begun; The New York Times. 16 December 2020. Available online: https://www.nytimes.com/interactive/2020/07/23/magazine/climate-migration.html (accessed on 6 March 2021).
- Gu, D. Exposure and Vulnerability to Natural Disasters for World’s Cities; UN DESA; 2019. Available online: https://www.un.org/en/development/desa/population/publications/pdf/technical/TP2019-4.pdf (accessed on 20 January 2021).
- McMichael, C.; Dasgupta, S.; Ayeb-Karlsson, S.; Kelman, I. A review of estimating population exposure to sea-level rise and the relevance for migration. Environ. Res. Lett. 2020, 15, 123005. [Google Scholar] [CrossRef] [PubMed]
- Nieves, J.J.; Stevens, F.R.; Gaughan, A.E.; Linard, C.; Sorichetta, A.; Hornby, G.; Patel, N.N.; Tatem, A.J. Examining the correlates and drivers of human population distributions across low- and middle-income countries. J. R. Soc. Interface 2017, 14. [Google Scholar] [CrossRef] [Green Version]
- IFRC. The Cost of Doing Nothing: The Humanitarian Price of Climate Change and How It Can Be Avoided. 2019. Available online: https://media.ifrc.org/ifrc/wp-content/uploads/sites/5/2019/09/2019-IFRC-CODN-EN.pdf (accessed on 20 January 2021).
- Stevens, F.R.; Gaughan, A.E.; Nieves, J.J.; King, A.; Sorichetta, A.; Linard, C.; Tatem, A.J. Comparisons of two global built area land cover datasets in methods to disaggregate human population in eleven countries from the global south. Int. J. Digit. Earth 2020, 13, 78–100. [Google Scholar] [CrossRef]
- Reed, F.J.; Gaughan, A.E.; Stevens, F.R.; Yetman, G.; Sorichetta, A.; Tatem, A.J. Gridded population maps informed by different built settlement products. Data 2018, 3, 33. [Google Scholar] [CrossRef] [Green Version]
- Bell, S.; Morse, S. Breaking through the glass ceiling: Who really cares about sustainability indicators? Local Environ. 2001, 6, 291–309. [Google Scholar] [CrossRef]


| Dataset | Producer | EO Data | Population | Constrained | Model Description | Citation |
|---|---|---|---|---|---|---|
| GPW-15: Gridded Population of the World v4.11, 2015 | CIESIN, Columbia University | None | Residential | No | Equal allocation of population to cells within admin. units | [32] |
| GHS-15: Global Human Settlement Layer-POP, 2015 | European Commission, Joint Research Centre (JRC) | Landsat | Residential | Yes | Binary dasymetric, proportional allocation to built-up areas extracted primarily from 30 m Landsat imagery | [31] |
| WP-16: WorldPop Global, Unconstrained, 2016 | WorldPop, Univ. of Southampton | Landsat, DMSP-OLS, VIIRS, MODIS, MERIS | Residential | No | Random Forest model with 24 covariates and weighted dasymetric redistribution | [34,37] |
| LS-15: LandScan, 2015 | Oak Ridge National Laboratory | Landsat, MODIS, DMSP-OLS | Ambient (24-h average) | No | Multivariable dasymetric model with 4 covariate types and weighted redistribution | [33,38] |
| WPE-16: ESRI World Population Estimate, 2016 | Esri Inc. | Landsat | Residential | No | Dasymetric algorithm with 16 covariate weighting data sets | [30] |
| Geography | Urban Pop | Rural Pop | Total Pop | Pct Urban | Urban Max | Rural Max | Urban Pixels | Rural Pixels | Uninhabited Pixels |
|---|---|---|---|---|---|---|---|---|---|
| Nepal 3990 level 3 units | |||||||||
| WPE-16 | 2.66 | 30.71 | 33.37 | 7.97% | 45,982 | 25,237 | 275 | 118,437 | 76,844 (39%) |
| GHS-15 | 3.3 | 25.16 | 28.46 | 11.6% | 46,472 | 117,462 | 271 | 104,208 | 91,077 (47%) |
| GPW-15 | 2.88 | 27.84 | 30.72 | 9.38% | 32,592 | 28,114 | 275 | 175,048 | 20,233 (10%) |
| LS-15 | 2.85 | 28.69 | 31.54 | 9.04% | 57,668 | 44,892 | 275 | 145,639 | 49,642 (25%) |
| WP-16 | 3.64 | 28.6 | 32.24 | 11.29% | 48,358 | 46,939 | 275 | 167,188 | 28,093 (14%) |
| UN-15 | 5.32 | 23.34 | 28.66 | 18.56% | |||||
| MMZ—Mozambique 413 level 3 units, Malawi 12,647 level 3 units, Zimbabwe 92 level 2 units | |||||||||
| WPE-16 | 6.84 | 59.52 | 66.36 | 10.31% | 26,168 | 17,138 | 1695 | 232,593 | 1,356,048 (85%) |
| GHS-15 | 8.34 | 52.13 | 60.47 | 13.79% | 81,852 | 156,171 | 1810 | 176,110 | 1,412,416 (89%) |
| GPW-15 | 3.46 | 51.9 | 55.37 | 6.25% | 26,555 | 17,190 | 2011 | 1,467,545 | 120,780 (8%) |
| LS-15 | 6.51 | 50.93 | 57.45 | 11.33% | 61,126 | 40,592 | 1976 | 1,370,043 | 218,317 (14%) |
| WP-16 | 5.01 | 51.81 | 56.82 | 8.82% | 26,995 | 25,233 | 2009 | 1,409,324 | 179,003 (11%) |
| UN-15 | 17.61 | 43.75 | 61.36 | 28.7% | |||||
| Ecuador 1047 level 3 units | |||||||||
| WPE-16 | 7.97 | 10.28 | 18.26 | 43.65% | 18,108 | 14,867 | 1457 | 41,897 | 247,071 (85%) |
| GHS-15 | 8.19 | 7.86 | 16.05 | 51.03% | 31,851 | 43,017 | 1510 | 41,755 | 247,160 (85%) |
| GPW-15 | 2.06 | 13.83 | 15.89 | 12.96% | 4172 | 4172 | 1664 | 235,809 | 52,952 (18%) |
| LS-15 | 7.58 | 8.24 | 15.82 | 47.91% | 44,304 | 31,740 | 1645 | 192,868 | 95,912 (33%) |
| WP-16 | 5.35 | 10.87 | 16.23 | 32.96% | 8782 | 8428 | 1663 | 224,407 | 64,355 (22%) |
| UN-15 | 10.24 | 5.91 | 16.14 | 63.44% | |||||
Publisher’s Note: MDPI stays neutral with regard to jurisdictional claims in published maps and institutional affiliations. |
© 2021 by the authors. Licensee MDPI, Basel, Switzerland. This article is an open access article distributed under the terms and conditions of the Creative Commons Attribution (CC BY) license (https://creativecommons.org/licenses/by/4.0/).
Share and Cite
Tuholske, C.; Gaughan, A.E.; Sorichetta, A.; de Sherbinin, A.; Bucherie, A.; Hultquist, C.; Stevens, F.; Kruczkiewicz, A.; Huyck, C.; Yetman, G. Implications for Tracking SDG Indicator Metrics with Gridded Population Data. Sustainability 2021, 13, 7329. https://doi.org/10.3390/su13137329
Tuholske C, Gaughan AE, Sorichetta A, de Sherbinin A, Bucherie A, Hultquist C, Stevens F, Kruczkiewicz A, Huyck C, Yetman G. Implications for Tracking SDG Indicator Metrics with Gridded Population Data. Sustainability. 2021; 13(13):7329. https://doi.org/10.3390/su13137329
Chicago/Turabian StyleTuholske, Cascade, Andrea E. Gaughan, Alessandro Sorichetta, Alex de Sherbinin, Agathe Bucherie, Carolynne Hultquist, Forrest Stevens, Andrew Kruczkiewicz, Charles Huyck, and Greg Yetman. 2021. "Implications for Tracking SDG Indicator Metrics with Gridded Population Data" Sustainability 13, no. 13: 7329. https://doi.org/10.3390/su13137329
APA StyleTuholske, C., Gaughan, A. E., Sorichetta, A., de Sherbinin, A., Bucherie, A., Hultquist, C., Stevens, F., Kruczkiewicz, A., Huyck, C., & Yetman, G. (2021). Implications for Tracking SDG Indicator Metrics with Gridded Population Data. Sustainability, 13(13), 7329. https://doi.org/10.3390/su13137329