Abstract
This work uses tools recently designed to conduct analyses and proposals around the cultural development of medium-sized cities. The Cultural and Creative Cities Monitor model, or CCCM, is first applied to the 81 cities in Spain with between 50,000 and 100,000 inhabitants. We also refer to the UNESCO Culture/2030 Indicators, specifically indicator 8 (Cultural companies), to investigate whether cultural dynamism is related to business vitality in those cities. Our observation of the 29 CCCM indicators and the C3 index, which synthesizes cultural performance, is explained, and these data are complemented with cultural business data (on assets, benefits, and jobs) from a sample of 13,204 firms. The C3 index values reveal significant differences in the cultural and creative performance of the selected cities according to their location (metropolitan or non-metropolitan) and their administrative rank. Moreover, when comparing the C3 index with the indicators on business activity, evidence indicates a clear positive relationship between cultural dynamism and firm vitality. These results support the contribution of culture to the sustainable development of medium-sized Spanish cities and further establish the suitability of the tools used to assist cities in designing appropriate cultural policies.
1. Introduction
In the explanatory memorandum for this Special Issue of Sustainability, the following is noted: “The last two decades have seen a massive increase in interest in culture as an important resource for sustainable development. However, the practical implementation of culture-driven strategies remains a challenge. The various impacts of culture are very difficult to monitor, as they span many different domains of the economy, society, and people’s lives.” From this premise, analyses based on non-habitual statistical sources are essential to complement the most frequently used indicators of culture and to allow key cultural impacts on the economy, society, and people’s lives to be addressed. The Cultural and Creative Cities Monitor (hereafter, CCCM) has been developed to help policymakers identify urban strengths and opportunities linked to culture [1]. Although the model takes into account the so-called “creative economy” of a city, among other aspects, and specifically how the creative sectors contribute to employment and favor its innovative capacity, the protagonists of such activity (companies) are not sufficiently present in its design. However, cultural companies are indeed considered in the UNESCO Culture/2030 Indicators (CI/2030), a tool recently developed by UNESCO to assess the impact of culture on sustainable development. In this work we employ both tools, the CCCM and the CI/2030, to analyze the relationship between cultural and business dynamism and to defend the role of culture in the sustainable development of cities. Using this method, we further seek to meet the request of the editors of this Special Issue to explore the potential of the CCCM to respond to relevant political questions.
For our object of study, we have chosen the 81 Spanish cities with between 50,000 and 100,000 inhabitants. This is an interesting group of cities since, despite their relatively homogeneous size, they present highly contrasted socioeconomic and functional characteristics, which can give rise to different nuances in the relationship between culture and urban development [2]. On the other hand, we approach this study assuming the ecological nature of the cultural and creative activities that take place in these cities, in the sense that they operate through interconnections and interdependences of resources and factors of various types [3,4]. It has been further found that these ecosystems specialize in diverse cultural and creative sectors and that companies form hubs or functional clusters indicating that this is by no means exclusive to large cities [5,6,7].
Evaluation of the relationship between culture and sustainable development in the selected cities entails a double requirement: indicators that quantify the cultural and business performance of these cities, and analysis of the effective relationship between culture and urban development. To fulfill the first requirement, we have obtained data for each city suitable for the 29 indicators proposed in the CCCM, as well as the 13 measures that synthesize them, including the C3 index. This has not always been easy, due to the lack of sources for cities of the size considered [8,9]. At the same time, we have obtained economic, accounting, and financial data for a sample of 13,204 cultural companies extracted from the SABI database; among other advantages, this information complements indicator 8 of the CI/2030 (Cultural companies). Using the CCCM indicators (and the C3 index in particular), we were able in an initial stage of analysis, to measure and characterize the performance of the cultural and creative ecosystems of the selected cities. In the next stage, we managed data on the cultural companies present in those cities, and we analyzed their relationship with the C3 index values. Specifically, we sought to verify whether the C3 index is capable of consistently detecting the presence of cultural companies and jobs, which would further allow it to corroborate favorable conditions for companies in a given territory [10].
The results are interesting in several ways. First, the CCCM model is clearly effective in characterizing these cultural ecosystems and capturing their diversity (Section 2). Thus, we demonstrate the viability of the tool in other contexts and territorial units, thereby meeting another request of the editors. Second, the results confirm an effective relationship between cultural dynamism and development: the C3 index is related positively to the indicators on business presence, supporting arguments that defend the role of culture as an engine and vector of sustainable development [10]. Third, application of the CCCM model and consideration of the relationship between cultural dynamism and development suggest that the varied behavior of cities is related to whether or not they form part of a larger metropolitan area. This result coincides with findings in other work [1,5,6,11], and it underlines the need to develop place-sensitive strategies [12]. These strategies are especially relevant at the time we are writing this paper, when economies are trying to recover from the effects of the COVID-19 pandemic. In this context and through the recommended place-sensitive strategies, the cultural and creative activities in cities can benefit from aid expected to be made available through extraordinary programs designed to address the effects of the pandemic, such as EU Next Generation or the Spanish “Plan for the recovery, transformation, and resilience of the economy” [13].
This article proceeds as follows. In Section 2, we raise certain theoretical questions about the contribution of culture to sustainable development and its measurement. In Section 3, we present the cities under study along with the determinations and sources adopted in order to apply the CCCM model and obtain both the C3 index and indicator 8 of the CI/2030. Section 4 contains the results of our analysis of the cultural and business performance of these cities, and of the association between the two factors, to illuminate the relationship between culture and development in this group of cities. The article concludes with an assessment of the results and some proposals for new lines of work focused on facilitating the recovery of cultural and creative ecosystems following the pandemic.
2. Culture and Sustainable Development of Cities
The potential contribution of culture to territorial development has promoted considerable research in this field of knowledge; in the long history of this research topic, since the 1990s, the relationship between cultural activities and local or regional development has been a favorite theme [14]. In relation to cities, both culture and creativity have been clearly shown to contribute to local identity and quality of life [14,15,16,17]. From the economic point of view, the importance of culture has been evidenced in the economic and social revitalization of cities by way of innovation, the creation of intersectoral links with contiguous activities along the value chain, the production of agglomeration effects, and the emergence of new opportunities for investment and employment [18]. Research on medium-sized cities has also revealed differing cultural profiles between cities that form part of large metropolitan areas and those that do not. The cultural profile of metropolitan cities reflects the “borrowed size effect” posited by Alonso to explain how cities that make-up metropolitan complexes “have access to the agglomeration benefits of larger neighboring cities” [19], favoring their specialization in cultural sectors that benefit from agglomeration economies or sectors linked to audiovisual and digital culture. On the other hand, the cultural profile of non-metropolitan cities tends to derive from their “centrality”, a Christallerian concept that predicts greater provision of services for such cities due to the broader markets they serve. This aspect of centrality—which leads cities to specialize in activities demanded by the public sector, as well as in scenic arts, handicrafts, and activities related to heritage—is further reinforced when cities also fulfill functions as administrative capitals [5,6,7].
As certain authors have recently pointed out possible explanations behind the relationship between culture and urban development are several [9,20]. Some refer to the concept of “creative milieu”, which is to say the importance of local amenities (cultural facilities and places of interest, natural spaces) and lifestyles that can attract artists and qualified populations along with visitors, thereby having a favorable impact on local economic dynamism. This hypothesis is a fundamental part of Richard Florida’s Creative Class Theory according to which creative classes are attracted to places with talent (human capital), tolerance (social capital) and technology (physical capital) [21]. A second mechanism derives from the growing presence of cultural and creative companies in a position to exploit economies of agglomeration, with the effect of spreading and stimulating innovation in other sectors [22] and causing companies and workers to cluster. Scott had already verified this clustering behavior of workers and cultural and creative companies [23]. This behavior would be related to the talent attraction processes described in the Florida theory, giving rise to a virtuous circle that favors urban development. In a different line, the links between culture, and cultural capital, have been highlighted with the formation of social capital and human capital—components of what is called comprehensive wealth (“all assets available to individuals, families, businesses, and the public sector”) [20]. On the one hand, consumption of culture or investment in it improves the human capital of a city, which in turn favors cultural development through the demand that relatively educated human capital will generate. On the other hand, the very nature of cultural activities, which are often essentially collective or participatory, reinforces social relationships and networks as well as feelings of trust, reciprocity, and civic commitment. By improving the local social capital (the resources and skills to act collaboratively), a road is paved for the local generation of cultural resources.
All these arguments have been broadly recognized in the United Nations General Assembly’s declaration of 2021 as the International Year of the Creative Economy for Sustainable Development, given that these activities can contribute to promoting positive externalities while preserving and promoting both heritage and cultural diversity. Further, such activities help job creation, support entrepreneurship and the growth of small- and medium-sized companies and stimulate innovation and individual empowerment while also favoring social inclusion and poverty reduction [24]. Moreover, the declaration represents the last step in a UNESCO strategy favoring a culture-based approach to development, recognizing the role of culture as an instrument and engine of sustainable development. The declaration implies a broad conception of culture and development and points to the role that culture can play in sustainable development through elements including heritage, creative activities, innovation, and others such as local products and materials or cultural diversity [10], sometimes overlooked by mainstream academic approaches. All of these qualities have been cited often during the coronavirus pandemic to underline its impact on the cultural sector and the subsequent need for revival [11,25,26]; they have also been included in arguments supporting the recuperation of cultural activities, which represent “powerful tools to bring people closer together, build a sense of community, and encourage citizens to be active members of society” [9]. We find references to the value of culture in preliminary considerations of the numerous plans being developed around the world to facilitate the recovery of the sector. Among these is the aforementioned “Plan for the recovery, transformation, and resilience of the economy”, point 9 of which on the promotion of the culture industry highlights its essential value for the development of free and open societies, its function as a generator of wealth and employment, and the need to advance a set of reforms and investments that promote its economic role in both the public and private spheres [13].
As indicated by the promoters of the Cultural and Creative Cities Monitor tool and others, any culture-oriented action such as those now being implemented in the wake of the pandemic, requires both clarification of the local creative and cultural ecologies and proper monitoring of significant aspects of culture and creativity that can be measured empirically [1,20]. We agree with Johnson and Fannin, and Gross et al. that the ecological approach facilitates the consideration of many types of resources, tangible and intangible, that influence the functioning of the creative economy and the systemic conditions through which they interrelate [3,4,20]. In this context, the CCCM has proven to be a very timely tool. First, it facilitates understanding of the ecological nature of cultural and creative activities developed in cities, implicitly assuming that they operate through interconnections and varied types of interdependences among many factors, all of which are necessary to mapping creative economies and their success [4,27]. Second, it identifies nine dimensions corresponding to aspects collected in the relevant literature and integrates them into three conceptual areas of analysis [1]. Dimensions range from those related to ‘Cultural Vibrancy’, referring to the local cultural supply and the demand it generates [28], to those which express the weight of the ‘Creative Economy’ through reciprocal relationships between culture and creativity (on one hand) and the urban economy (on the other), in terms of jobs and innovation [29], to other indicators around the ‘Enabling Environment’ dimensions formed by requirements that favor the development of cultural places and their economies. Ultimately, all these dimensions are understood to intervene in the performance or cultural dynamism of a city, and they are combined to obtain various standardized measures including the C3 index [8].
The need for an appropriate tool to measure and evaluate the contribution of culture to the Sustainable Development Goals also justifies the creation of the UNESCO Culture Indicators for the 2030 Agenda (CI/2030). These are 22 indicators grouped into four thematic dimensions: ‘Environment and resilience’; ‘Prosperity and livelihood’; ‘Knowledge and skills’; ‘Inclusion and participation’. The first three correspond to the three pillars of sustainable development: economy, society, and environment; the fourth refers to education, knowledge, and skills in cultural fields [10]. The seven indicators of the ‘Prosperity and livelihood’ dimension aim to assess the contribution of culture to key aspects of the economy (GDP, trade, employment, businesses, household expenditures) as well as the governance of culture.
Something that these two tools (CCCM and CI/2030) have in common is that their conceptual frameworks are based on internationally accepted principles on the nature, function, and impact of culture; additionally, from the methodological point of view, they construct their indicators from existing data sources, meanwhile favoring adaptation to the diverse statistical capacities of different territories (see Section 3.2 and Section 3.3). They also share an applicability to the urban scale. However, they do have differences in focus and content, such as that indicated earlier in relation to cultural companies (an aspect included in the CI/2030 but not in the CCCM), it being considered that income is generated and the economy stimulated through cultural companies, thus helping to promote economies that are more inclusive, sustainable, and in line with the ‘Prosperity’ concept of the Sustainable Development Goals [10]. On the other hand, the harsh effects of the pandemic on this sector have highlighted the structural shortcomings of cultural companies, as well as the need to address these shortcomings decisively in order to build more inclusive and resilient ecosystems. Other problems derived from the small size of cultural companies, the high proportion of self-employment they entail [30], and interrelationships between similar companies comprising production chains have all been observed in explaining the “domino effect” of the pandemic on this sector [31].
For all these reasons, we have deemed it appropriate to use both the CCCM and the CI/2030 in this analysis, first to measure and characterize the cultural and business dynamism of cities, then to verify the following hypothesis: There is a positive relationship between the cultural dynamism of a city and the presence and concentration of cultural enterprises. If this hypothesis is confirmed, we will be able to affirm that in the cities studied, culture is indeed a factor of business attraction and thereby contributes to cities’ sustainable development. We expect that the cultural dynamism of these cities will present some nuances, mainly due to their metropolitan or non-metropolitan character. As regards the results of companies in the sector and any possible structural deficiencies they may manifest, it should be recognized that location is only one aspect, and that these companies are conditioned by numerous factors that determine their competitive capacity in a global environment, as well as organizational elements intrinsic to the companies themselves.
3. Materials and Methods
3.1. Characteristics of the Cities Studied
The 81 Spanish cities with between 50,000 and 100,000 inhabitants form a rather heterogeneous group (Table 1). Among these are seven cities declared World Heritage Sites by UNESCO (Santiago de Compostela, Segovia, Ávila, Toledo, Cuenca, Cáceres, and Mérida) and certain well-known tourist destinations on the Mediterranean coast (Estepona, Fuengirola, Benidorm) and Canary Islands (San Bartolomé de Tirajana). Some other cities are ‘metropolitan’, being located within any of the 12 main metropolitan areas in Spain. These 12 metropolitan areas of reference are: Madrid, Barcelona, Valencia, Seville, Bilbao, Malaga, Zaragoza, Murcia, Alicante, Santa Cruz de Tenerife, Vigo-Pontevedra, and Oviedo-Gijón. Both Table 1 and the map in Figure 1 indicate which non-metropolitan cities are the capital of a province and which are touristic in character.

Table 1.
Characteristics of the cities studied (2019).

Figure 1.
Locations of the cities studied. Source: authors’ own elaboration.
3.2. Determinations for Application of the CCCM Model to the Cities under Study
Table 2 offers the complete list of domains, dimensions, and indicators handled by the original CCCM. As the model’s promoters explain [1], the 29 indicators (quantitative and qualitative) were selected according to criteria of theoretical pertinence as well as data sources coverage (positive for over 50% of the cities considered), availability and easy access, quality, opportunity, and relevance. The application of these criteria to the cities under study required various adaptations, summarized in the final column of Table 2 and detailed in Table A1 of the Appendix A. In 14 of the indicators, it was necessary to resort to sources different from (but equivalent in content to) those used in the original version. We also sought to choose sources that are common across most countries, so that our proposed adaptations may be replicated by other potential stakeholders. In eight indicators (the five based on opinion and the three related to local and foreign university populations), city-level data were lacking, so these are provided at the NUTS 2 or NUTS 3 level, understanding (as do the promoters of the model) that the regional or provincial average provides a good approximation to the city value of the indicator [1]. On the other hand, for indicators obtained from surveys, and for those of dimension 2.3 (new jobs in creative sectors), not only has the source been changed but also the description of the indicator, to reflect the specific wording of the questions selected (in the case of surveys) or the descriptive variables used. In indicator 28 (Rail accessibility), the definition from the 2017 version of the CCCM has been maintained due to deficiencies in European sources on rail accessibility in metropolitan areas. Finally, it is also worth noting that the selection of activities to obtain indicators for dimensions 2.1 (Creative and knowledge-based jobs) and 2.3 (New jobs in creative sectors) has been carried out at the level of NACE division instead of section, making it possible to refine the selection and to eliminate from analysis any activities less related to culture and creativity. Please refer to Table A1 of the Appendix A for details on all the adaptations made.
Table 2.
CCCM model sub-index, dimensions, indicators and adaptations for the analysis.
Of the 29 indicators described and obtained as indicated for the 81 cities under study, we constructed the C3 index following the guidelines established in the CCCM model: division of almost all indicators by the number of inhabitants of the city in question; winsorization of outliers of an indicator if the asymmetry is >2 and kurtosis is >3.5; imputation of unobserved values through ad hoc strategies based on similarities between the cities studied (see Table A2 of the Appendix A); and normalization of the resulting values. Regarding the weightings of the domains and their dimensions, we have maintained the criteria adopted in the original version, which we considered appropriate. With these criteria, the scores for each city of the sub-indices ‘Cultural Vibrancy’ (D1), ‘Creative Economy’ (D2), and ‘Enabling Environment’ (D3) were obtained first. Next, we calculated the C3 index as a weighted average of the three sub-indices. Subsequently, we verified the consistency of the indicators, sub-indices, and indices using Pearson correlations, making certain that the statistical structure of the C3 index is consistent with its conceptual framework, since most of the correlations of the dimensions with their respective indicators are good and positive (>0.5). (Appropriate correlations were not obtained in the following cases: D1.1 (Cultural venues) and indicator 3 (Cinema seats), with R = 0.32; D1.2 (Cultural participation) and indicator 8 (Cinema attendace), with R = 0.42; D1.2 (Cultural participation) and indicator 9 (Satisfaction with cultural facilities), with R = 0.39; and D3.2 (Openness, tolerance and trust) and indicator 22 (Foreign-born population), with R = 0.23). Furthermore, all dimensions are strongly correlated with the three descriptive sub-indices of their respective domains, and with the C3 index itself (see Table A2 in the Appendix A). Finally, we accepted the robustness tests and the effects of normalization carried out in the original version [1].
3.3. Determinations to Obtain the Sample of Companies and Information Related to Indicator 8 of the UNESCO Culture/2030 Indicators
The main objective of indicator 8 (Cultural companies) of the Culture/2030 Indicators is to assess existing conditions for such enterprises, especially small and micro enterprises. Although the indicator is based on the evolution of the number of cultural companies, the source used here allows us to obtain more complete information to detect to the extent to which the conditions in the cities under study (synthesized in the C3 index) favor cultural enterprises and, therefore, contribute to sustainable development. In fact, UNESCO itself recognizes the convenience of qualifying indicator 8 in terms of production, performance, and people employed [10]. The information available in the SABI database allows satisfaction of this requirement and meets other requirements such as using (as far as possible) existing data sources that offer national and urban/local information which can be replicated for other times and places.
Although SABI offers detailed financial information only on Spanish and Portuguese companies, this can be considered the Iberian equivalent of the AMADEUS and ORBIS bases, which refer to European and global companies, respectively. In all three, searches can be focused by company or by groups of companies, and detailed statistical and/or comparative analysis can be conducted according to the financial variables and the time period chosen by the user. The possibility of accessing individualized data on companies makes it possible to build aggregates by municipality, by group of municipalities, by productive sector, or any by way of another indicator defined for this purpose, thus satisfying another UNESCO recommendation: that of obtaining a larger view of the evolution of the nature of cultural enterprises in relation to sub-sectoral equilibrium, spatial concentration, or other aspects [10].
The informational advantages of the database used in this portion of the research are many, especially in fields of study where information sources are severely lacking. However, it must be taken into account that these databases extract their information from commercial registers, so the availability of data remains conditional on whether a company or institution is obligated to register its accounts (or, if not, whether it has done so regardless). The scope of available data also varies with the company profile considered, for example, listed companies are required to offer much more information than others. Consequently, this is a database that provides extensive (although not exhaustive) information on the companies within a given locality, so selection of the sample must be careful and based on application of minimum requirements of data quality.
For this study, a sample of companies was selected from the SABI base according to the following criteria: (a) they met the requirements of the CCCM model (that is, location in one of the 81 cities with between 50,000 and 100,000 inhabitants and belonging to a branch of activity taken into account in the construction of indicators 10 to 12 and 15 to 17) (The activities selected to obtain the sample of companies are: 90. Creative, arts, and entertainment activities and 91. Libraries, archives, museums, and other cultural activities, which make up the CCCM indicators 10 and 15; 58. Publishing activities, 60. Programing and broadcasting activities, 62. Computer programming, consultancy and related activities and 63. Information services activities, which integrate indicators 11 and 16; and 69. Legal and accounting activities, 70. Activities of head offices; management consultancy activities; 71. Architectural and engineering activities; technical testing and analysis, 72. Scientific research and development; 73. Advertising and market research and 74. Other professional, scientific and technical activities, all included in CCCM indicators 12 and 17); (b) they were active at the time the search was carried out.
The initial sample of 29,776 companies was subjected to a review process, with some companies ruled out in two phases: first, those that did not provide information on business assets; second, those whose most recent available data was prior to 2018. The aim of this elimination was to reduce the notable dispersion of companies according to the latest year of available information and to take into account the impact of the economic cycle on business activity.
The final sample comprised 13,204 companies. Descriptive information on the activity (name, NACE code, locality, state, corporate form) was selected for each, as well as dimension data (volume of assets, number of employees) and indicators of activity and results: turnover (measured from operating income), profit before interest and taxes, and economic profitability (measured from the ratio between profit and assets). The data refer to the years 2018 and 2019.
Based on these variables, and given that the purpose of analysis is to verify the relationship between business activity and the cultural and creative dynamism of the city (the C3 index), four indices of business activity concentration were constructed in the following way: companies in the sample were distributed into quartiles according to their C3 index values (group 1 corresponds to companies located in municipalities with the highest index values, while group 4 corresponds to the lowest); additionally, for each selected variable, concentration indices were calculated that permit visualization of the apparent impact of cultural dynamism on business demographics. The concentration indices are the result of comparing the weight of the aggregate of the variable in a group i with respect to the total, with the theoretical weight it would carry were it proportional to the population concentrated in the municipalities included in said i group.
4. Analysis and Results: The Cultural and Creative Dynamism of Cities, and Its Relationship with Business Vitality and Sustainable Development
In this section, we first present the results of our application of the CCCM model to measure the dynamism of the selected cities according to the C3 index, and to characterize their ecosystems according to the way the index is linked to the different dimensions that compose it (expressed by the sub-indices D1, D2, and D3). Next, we explore the relationship between cultural dynamism and sustainable development in these cities based on the values of the C3 index and of the three sub-indices, along with the descriptive variables of indicator 8, Cultural companies, of the CI/2030.
4.1. The Cultural and Creative Dynamism of the Ecosystems Studied According to the CCCM Model
The results of the application of the CCCM model to Spanish cities with between 50,000 and 100,000 inhabitants are summarized in the map in Figure 2, which represents the value of the index for the 81 cities studied. Santiago de Compostela leads the ranking (C3 = 54.82), at almost five times the score of Motril (on the Mediterranean coast of Granada), the city with the lowest value (C3 = 11.62). The variability of the value of the index is not especially high, but it shows in all cases (even in those that lead the ranking) a wide margin for improvement, since the values obtained are in every case well below the maximum of 100 (see Table A3 of the Appendix A for descriptions of this variable and those of sub-indices D1 to D3, to which we refer below).
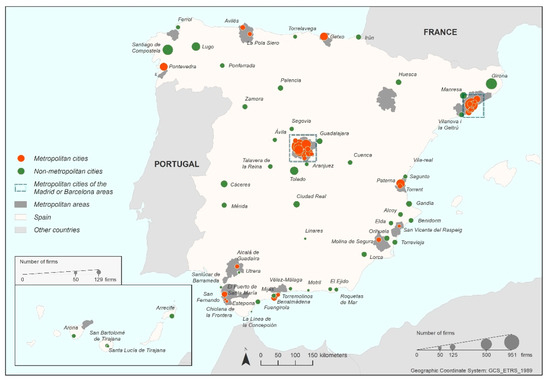
Figure 2.
The cities studied according to the C3 index values. Source: authors’ own elaboration.
Figure 3 shows that within the set of 81 cities studied, the values of the C3 index are highly correlated with those of the D2 sub-index, which measures the Creative Economy (R = 0.893). This result is in line with results obtained in the application of the CCCM to a sample of 190 European cities, where the presence of important European capitals (with a high density of creative industries generating and taking advantage of agglomeration economies, as well as proximity to institutions both public and private) encourages the co-location of related sectors [1,9]. In our group of cities, we verify these trends in the clustering of creative sectors in metropolitan cities [11], and this effect is manifested in that such cities are here most strongly related to the values of the D2 sub-index.
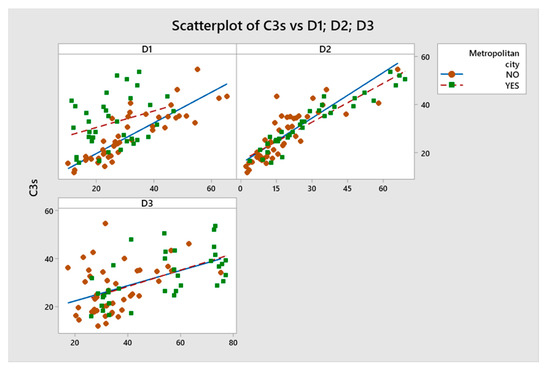
Figure 3.
Relationship between the C3 and the scores of the sub-indices D1, D2, and D3 that compose it.
The correlation of the C3 index with the other two sub-indices indicates a warmer association with both D1, Cultural Vibrancy (R = 0.549), and D3, Enabling Environment (R = 0.541). However, non-metropolitan cities clearly have a much better relationship between the C3 index and D1 sub-index, so that for this group of cities it can be said that cultural vitality is most influential in the value of the C3 index. This result has also been observed in the larger European sample with respect to medium-sized cities with significant cultural heritage and consistent resources [1].
To corroborate the different cultural and creative behaviors of metropolitan and non-metropolitan cities with respect to the C3 index and its component dimensions, we have subjected their values to a means test (Figure 4). Although deviations are high, the p-value (<0.05) of the comparison between means confirms that the difference between these two groups is indeed significant. The contrast with respect to the D3 sub-index precisely shows a clear contrast between the best performance (presented by metropolitan cities) and the worst (non-metropolitan cities). This result deviates from what was observed in application of the CCCM model to the European sample, where no systematic relationship between the value of the sub-index and a specific type of city [1] was apparent. It should be noted, however, that due to the diversity of the factors taken into consideration to evaluate the enabling environment conditions (see Table 2), certain non-metropolitan cities achieve very good scores in indicators on opinion and governance.
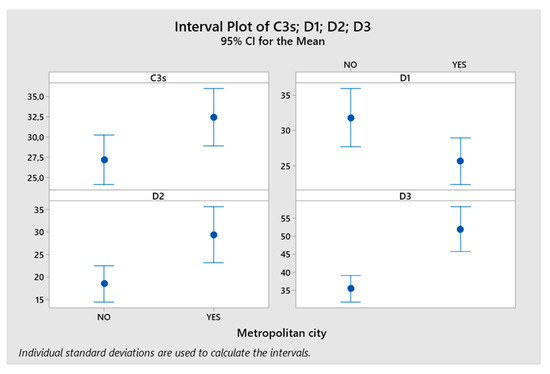
Figure 4.
Performance of the creative and cultural ecosystems. Contrasts in the average value of the C3 index and the D1, D2, and D3 sub-indices between metropolitan and non-metropolitan cities.
The difference observed in the cultural and creative behaviors of metropolitan and non-metropolitan cities confirms the hypothesis and the influence of the borrowed size effect on the dynamics of metropolitan cities, as well as the principle of centrality in non-metropolitan cities. Additionally, Figure 5 is in support of this principle and its influence on the behavior of non-metropolitan cities, showing the results of the contrast of means between the 15 non-metropolitan cities that are regional or provincial capitals and the remaining 66, with no administrative rank. The graph reveals that these capital cities perform better than the non-metropolitan group in general (the mean of the C3 index being higher), and especially in terms of Cultural Vitality (sub-index D1, ostensibly higher). They also perform better in Creative Economy (sub-index D2) compared to other non-metropolitan cities, although they fall short of the average values of metropolitan cities.
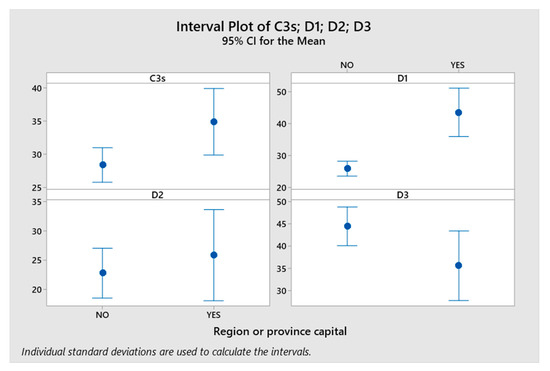
Figure 5.
Performance of the creative and cultural ecosystems. Contrasts in the average value of the C3 index and the D1, D2, and D3 sub-indices between cities that are capitals and those that are not.
4.2. Cultural Dynamism and Business Vitality—Relationship of the C3 Index with Business Indicators
A true reflection of business reality, the sample of companies obtained from SABI covers widely heterogeneous profiles in all the variables observed, including company form and size and the accounting and financial indicators examined. This diversity is even greater if we further consider structural differences according to the branch of activity or city of reference. Table 3 summarizes the characteristics of the sample by type of municipality and by cultural and creative sectors of activity (grouped according to indicators 10, 11, and 12, used by CCCM).
Table 3.
Description of the sample of companies.
The C3 index showed that creative and cultural capacity is greater in metropolitan cities, and the same can be said of the activity of cultural companies. The cultural enterprises located in the metropolitan cities studied are larger in size, concentrate most of the sector’s jobs and assets, and achieve higher profits and returns. In non-metropolitan cities, only the cultural companies that make up indicator 10 (creative, artistic, and entertainment activities, libraries, archives, museums, and other cultural activities) present better results (in endowment and size, not in profitability). Beyond the structural elements typical of metropolitan areas, the influence that certain large-scale company profiles may have on aggregate results cannot be ruled out. Consider that the 26 largest companies in the sample together represent 40% of total assets and are located mainly in metropolitan cities; on the other hand, the 7000 smallest companies (53% of the companies in the sample) collectively amass only 10% of assets.
The geographic distribution of the cultural companies and jobs in the sample (maps in Figure 6 and Figure 7, respectively) does not fit the demographic patterns of the population. The 10 municipalities with the largest presence of such companies are mostly metropolitan (7 out of 10), accounting for 41% of the companies in the sample and 64% of the jobs; these figures are unquestionably high, considering that only 15% of the population reside in these cities.
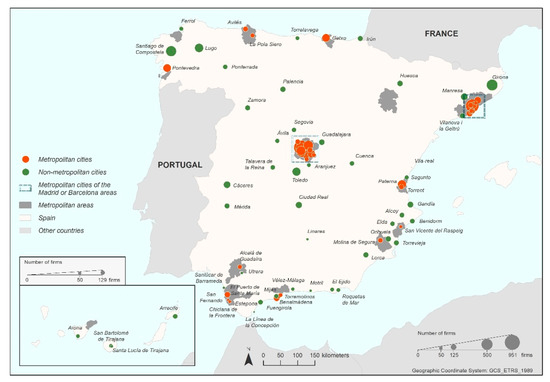
Figure 6.
Number of companies in the sample within the cities studied. Source: authors’ own elaboration, from SABI database.
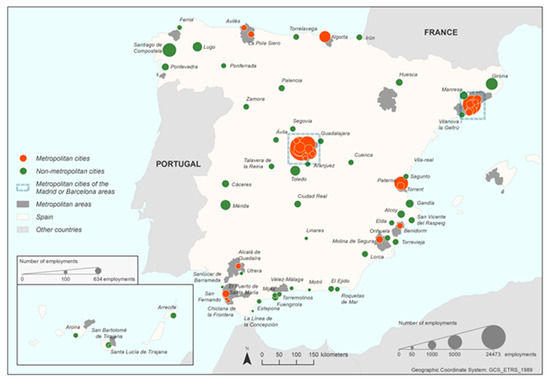
Figure 7.
Number of employees in the sample within the cities studied. Source: authors’ own elaboration, from SABI database.
The only non-metropolitan municipalities presenting remarkable business activity are those of high cultural importance, including Santiago de Compostela, Lugo, Gerona, Pontevedra, Toledo, and Mérida (if the cultural employment generated by such activity is analyzed). At the other extreme, in the group of less active municipalities, the percentages of population, companies, and employment are 10%, 2%, and 1%, respectively (in this case, 7 of the 10 municipalities are non-metropolitan).
The metropolitan or non-metropolitan character of a city appears to be a determining factor to explain its business structure, but this is not the only factor. The analysis presented below gives evidence that the cultural context is also an element that contributes to economic dynamism. The C3 index summarizes the cultural and creative behavior of the cities considered, making it possible to order the municipalities and, where appropriate, the companies, as well as to define groups according to increasing levels of cultural dynamism. This exercise permits the evaluation of the possible relationship between economic activity and the creative environment. For this purpose, the companies in the sample have been organized into quartiles according to C3 index value, where group 1 corresponds to the companies located in municipalities with the highest index values and group 4 comprises those in cities with the lowest values.
From here, the added value is calculated by groups of companies, assets, employment, and benefits. The quotient between benefits and assets measures the economic profitability of the companies in each group, and the relationship between the relative weight of each group in each of the variables compared to the weight it represents in terms of population results in the concentration index. The ordering of companies by quartiles is repeated for each of the sub-indices that make up the C3 index. Table 4 and Table 5 offer a synthesis of the main results obtained from this analysis.
Table 4.
Concentration of firms by groups of cities based on the C3 index and D1, D2, and D3 sub-index values.
Table 5.
Characteristics of the firms by city groups, based on the C3 index.
Together, these analyses provide evidence in favor of the existence of a positive relationship between the cultural dynamism of a municipality and the business community, thus supporting the role of culture and its contribution to the sustainable development of territories. The concentration of companies by group increases in those groups where the cultural indicators present higher values, regardless of the index from which the groups are formed. The following should also be noted:
- i.
- Of the companies in the sample, 53% are located in one of the municipalities included in group 1 (those with the highest C3 index values). This percentage is very distant from what would correspond if the proportion in terms of population were maintained (27% of the total population of the 81 municipalities reside in these localities). The quotient of both percentages results in a company concentration index of 193 (the percentage of companies located in municipalities with the highest cultural dynamism is 93% higher than the proportion of the population concentrated in these territories).
- ii.
- The company concentration index progressively decreases in groups with less cultural dynamism. In group 4, the company concentration index is 49; that is, the percentage of companies located in those territories with lower cultural dynamism is 51% beneath the percentage that would correspond according to population.
- iii.
- The above results are exacerbated when the variable used is business assets. Here, the companies located in the municipalities of group 1 account for 74% of total assets, and those of group 4 only 9.5%. When compared with the population percentages, the result is an asset concentration index of 268 and 40, respectively. If the employment variable is analyzed, the concentration indices are 274 for group 1 and 27 for group 4. The indices of employment concentration in the same groups are 283 and 47, respectively.
- iv.
- The trend that shows the profit and profitability does not adjust precisely to that observed in the previous variables. Although there is a clear difference in the results between groups 1 and 4, the downward trend seen for the other variables is not sustained in all groups. It is necessary to take into account that, in terms of profitability, conjunctural components within this variable carry more weight than in assets or employment, and market factors exert influences beyond the territorial scope.
Another approach to the relationship between cultural and business dynamics results from analysis of the association between individual city data and the C3 index. For such purposes, it must be noted that shifting from analysis by group to disaggregated analysis by city affects the precision of the results, in that the sample size is reduced and the potential impact becomes more acute (for example, where companies of large size determine the results of the territory in which they are located). In any case, the results do confirm the relationship observed in the aggregate study. The correlation coefficient between the concentration index of companies in each city and the C3 index is R = 0.69; if the concentration index is employment, it is R = 0.70; in the case of assets, R = 63. Figure 8 illustrates these results for the case of companies. Variables are expressed in logarithms to avoid negative data.
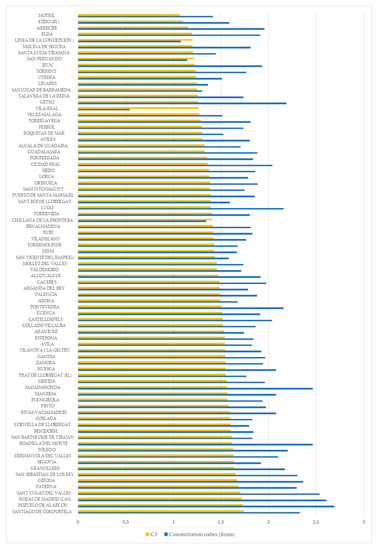
Figure 8.
Relationship between the C3 index and the company concentration index. Source: authors’ own elaboration.
5. Conclusions
On the eve of the coronavirus pandemic, certain very prominent international initiatives had made clear the importance of culture and creativity to urban development. In 2017, the Joint Research Center of the European Commission presented the Cultural and Creative Cities Monitor, a tool that combines 29 indicators to obtain various synthetic, weighted, and normalized measures of the cultural performance of a city; a second edition of this tool was presented in 2019 [1,9]. Additionally, in 2019, UNESCO published its Culture/2030 Indicators, with the purpose of measuring and evaluating the contributions of culture to the Sustainable Development Goals [10]. The decision by the United Nations General Assembly on 8 November 2019 to declare 2021 the International Year of the Creative Economy for Sustainable Development was added to these initiatives. Given all this, we found ourselves equipped with appropriate principles and tools with which to analyze the performance and prosperity of the cultural and creative ecosystems of cities, including the 81 medium-sized Spanish cities studied in this work.
More than a year after the outbreak of the pandemic, the data collected at all scales (global, regional, and local) have unfortunately confirmed the worst of expectations [25]. According to the Bank of Spain, the severity of confinement, the intense impacts on businesses linked to leisure and mobility and the high presence of small companies all suggest that the recovery of economic activity in Spain is lagging behind that of Europe, while the economic contraction and loss of wealth are even more significant. With a view to the recovery of the cultural sector, the support of public resources has acquired considerable importance, as framed in the EU Next Generation instrument and in the “Plan for recovery, transformation, and resilience of the economy” [13]. In this context, we have sought to reinforce arguments in favor of culture, highlighting its links with sustainable development. To do so, we have used the above-mentioned international analytical tools, testing their potential to analyze cultural and business dynamism as well as their combined use for accreditation of the relationships between culture and sustainable urban development.
Application of the CCCM model allowed us to obtain indicators, sub-indices, and descriptive indices of cultural and creative dynamism for the cities studied. We believe that we have successfully managed to overcome the stumbling block of irregular data sources for these medium-sized cities, although this remains an area in which there is certainly room for improvement. The C3 index has proven effective in showing that cultural and creative ecosystems are very heterogeneous, even in the small group these 81 cities represent. We find it positive that this index has been able to detect and confirm the distinction between metropolitan and non-metropolitan cities. We have confirmed the outstanding weight of the Cultural Vibrancy dimension in non-metropolitan cities, particularly provincial and regional capitals, and this met our expectations based on their centrality. We have also observed the strength of the Creative Economy dimension in metropolitan cities, thus proving that smaller cities can indeed ‘borrow size’ and sustain the functions, amenities, and performance usually associated with metropolitan areas if they are well embedded in networks [32]. Both these results coincide with earlier observations of the sample of 190 European cities to which the original CCCM model was applied; additionally, in this group, large capitals stood out in Creative Economy due to factors of agglomeration and proximity to public and private institutions. Many of the medium-sized cities studied also stand out in Cultural Vibrancy, and it should be noted that this result has been influenced by the methodological choice of expressing most indicators in per capita terms, which undoubtedly favors smaller cities due to disproportionate endowments of cultural resources per inhabitant.
Another contribution of this work has been to obtain diverse data that make up indicator 8 of the UNESCO Culture/2030 Indicators (Cultural companies) for a sample of 13,204 enterprises located in the 81 cities. We have shown the diversity of this business group in terms of employment, assets, and benefits, also confirming structural shortcomings in the sector that have been highlighted during the pandemic. Most importantly, we have shown that the C3 index is an efficient approach for capturing business vitality; the concentration indices of companies, employment, and assets all present decreasing values for the cities included in quartiles 1 to 4 of said index. We have interpreted this as evidence of the relationship between cultural dynamism (expressed by the value of the C3 index) and business presence (collected by the concentration indices). As the index consistently interprets the presence of cultural companies in cities, we found that favorable conditions were corroborated for companies in the cities under study, and we can affirm that culture is an attractive factor to business and thereby contributes to the sustainable development of cities.
As in all work of this type, numerous new lines for research have been opened with its completion. Regarding the CCCM model, the 29 indicators obtained for each of the cities continue to deserve in-depth analysis. These indicators reveal much about the urban cultural sector as it was on the eve of the COVID-19 pandemic, so further analysis may facilitate the preparation of recovery strategies based on shared reflection by local actors on the present state and future of culture. Such reflection could take advantage of the detected strengths of metropolitan cities in relation to the creative economy. Additionally, measures should be taken to assist non-metropolitan cities in regaining their cultural liveliness, which will have been greatly affected due to the specialization of such cities in particular sectors where the pandemic has had the strongest impact [11]. Finally, we believe that this work justifies the consideration of the metropolitan or non-metropolitan location of cities with 50,000 to 100,000 inhabitants in the computation of the C3 index, due to the influence that this aspect has been found to have on indicators of cultural and business dynamism. The same can be said of the inclusion of indicators on business conditions among those within dimension 2, which evaluates Creative Economy.
Regarding the information collected in relation to indicator 8 (Cultural companies) of the CI/2030, we believe that the structural characteristics of the business sector are worth delving into, given that sector’s strengths and shortcomings. The high concentration of assets into a small number of the companies studied, with only 10% of assets shared among 7000 (53%) of the 13,204 considered, highlights the vulnerability and precariousness typical of these enterprises. In the face of post-pandemic recovery and the consolidation of more inclusive and sustainable ecosystems, access to and management of business microdata would offer novel possibilities for study when working with aggregate data. This would open possibilities for reviewing the management and governance systems of cultural industries in small and medium-sized cities, considering strategic aspects of their competitiveness (both individual and sectoral), identifying the factors of financial success, investigating the connection between business activity and territorial development, and establishing the possibility of exporting success factors from the private to the public sphere. Other potential lines of work would include: the proposal of alternative groupings of municipalities, profiles of companies, or sectors of activity; the incorporation of other indicators of activity; addressing the relationship between cultural and economic dynamism with a two-way perspective that examines in greater depth how cultural and creative dynamism represents a factor of attraction for companies; and how (or whether) economic activity contributes to cultural and creative reality by joining two synergies that, ultimately, contribute to sustainable development.
While these lines of work are being implemented, the information handled in this paper and, specifically, the indicators collected to obtain the C3 index and the other CCCM, synthetic measures of cultural behavior, can facilitate policy makers the preparation of strategies for the post-pandemic recovery of the cultural and creative ecosystems of cities. These strategies can be based on a shared reflection on aspects such as what cultural strengths to reinforce; what gaps to fill; what good practices from other cities could be adopted; what cooperation formulas can be carried out between various cities; how to make the cultural offer reach the surrounding population or how to improve, where appropriate, the quality of governance [9].
Author Contributions
Conceptualization, A.I.E.-O., M.C.N.-P. and M.P.-G.; methodology, A.I.E.-O., M.C.N.-P. and M.P.-G.; software, B.S.-V.G.; validation, B.S.-V.G. and M.C.N.-P.; formal analysis and investigation, A.I.E.-O., B.S.-V.G., M.C.N.-P. and M.P.-G.; resources and data curation, B.S.-V.G. and A.C.-S.; writing—original draft preparation, A.I.E.-O.; writing—review and editing, A.I.E.-O., M.C.N.-P. and M.P.-G. All authors have read and agreed to the published version of the manuscript.
Funding
This research was funded by the Ministry of Economy and Competitiveness of the Government of Spain (Ministerio de Economía y Competitividad del Gobierno de España) (project code: CSO2017-83603-C2-1-R). In addition, the work has received a grant from the Instituto Universitario de Investigación en Ciencias Ambientales de Aragón, IUCA (2020 call for the financing of edition costs).
Institutional Review Board Statement
Not applicable.
Informed Consent Statement
Not applicable.
Data Availability Statement
The values of the 29 indicators resulting from the application of the CCCM model to the 81 cities studied can be consulted here: http://culturayterritorio.com/base-de-datos-de-indicadores-version-de-2019/ (accessed on 25 May 2021). Additional graphic materials developed on these indicators are accessible here: http://culturayterritorio.com/cultural-and-creative-cities-monitor-en-graficas/ (accessed on 25 May 2021).
Conflicts of Interest
The authors declare no conflict of interest. The founding organization has no role in the collection, analyses or interpretation of data; in the writing of the manuscript, or in the decision to publish the results.
Appendix A
Table A1.
Characteristics of the CCCM indicators for the analysis of the Spanish medium-sized cities.
Table A1.
Characteristics of the CCCM indicators for the analysis of the Spanish medium-sized cities.
| Description (Different Descriptions to Those of the Original CCCM Stand out in Italics) | Geo Level | Year/Period of Reference | Source Original CCCM (% Coverage/Use) | Other Source (Final % Coverage) | Estimation Procedure for Missing Values. Other Questions | |
|---|---|---|---|---|---|---|
| Sub-index: | 1. Cultural Vibrancy | |||||
| Dimension: | D1.1 Cultural Venues and Facilities | |||||
| 1. Sights and landmarks | Points of historical, cultural and or artistic interest, such as architectural buildings, religious sites, monuments and statues, churches and cathedrals, bridges, towers and fountains, divided by the total population and then multiplied by 100,000. | City | 2019 | Tripadvisor (100) | Not necessary | -- |
| 2. Museums and art galleries | Number of museums and art galleries that are open to the public divided by the total population and then multiplied by 100,000. | City | 2019 | Tripadvisor (100) | Not necessary | -- |
| 3. Cinemas | Number of cinemas in the city divided by the total population and then multiplied by 1000. | City | 2019 | OpenStreetmap (not used) | AIMC (Asociación para la Investigación de Medios de Comunicación, Association for Media Research) (100) | -- |
| 4. Concerts and music halls | Number of theatres and other music venues (concert halls, clubs, etc.) and current shows divided by the total population and then multiplied by 100,000. | City | 2019 | Tripadvisor (100) | Not necessary | -- |
| 5. Theatres | Number of theatres in the city divided by the total population and then multiplied by 100,000 | City | 2019 | OpenStreetmap (not used) | Tripadvisor (100) | -- |
| Dimension: | D1.2 Cultural Participation and Attractiveness | |||||
| 6. Tourist overnight stays | Total annual number of nights that tourists/guests have spent in tourist commodation establishments (hotel or similar) in the city divided by the total population. | City | 2010–2018 | Eurostat’s Urban audit (60,4) | INE (Instituto Nacional de Estadística, National Statistical Institute) (75,31) | Note 1 in Table 2 |
| 7. Museum visitors | Total number of museum tickets sold during the reference year divided by the total population and then multiplied by 1000. | City | 2010–2018 | Eurostat’s Urban audit (17) | Other official regional and local sources (66,6) | Note 2 in Table 2 |
| 8. Cinema attendance | Total number of tickets sold, referring to all films screened during the year, divided by the total population and then multiplied by 1,000 | City | 2010–2018 | Eurostat’s Urban audit (86,41) | Not used | Note 3 in Table 2 |
| 9. Satisfaction with cultural facilities | Average rating of the degree of interest in museum, music and performing arts by region and city size | NUTS 2 | 2014 | Survey on “Quality of life in cities” by TNS/EC (not used) | Encuesta de hábitos y prácticas culturales (Survey on cultural habits and practices) (100) | Note 4 in Table 2 |
| 10. Jobs in arts, culture and entertainment | Number of jobs in arts, culture- and entertainment-related activities such as performing arts, museums and libraries (NACE Rev. 2, 90 and 91), divided by the total population and then multiplied by 1,000. | City | 2018 | Eurostat’s Urban audit (not used) | Estadística “Afiliados en alta laboral”. Tesorería de la Seguridad Social (Statistics “Affiliates with employment” Social Security Treasury (100) | Note 5 in Table 2 |
| Subindex | 2. Creative economy | |||||
| Dimension | D2.1 Creative and knowledge based jobs | |||||
| 11. Jobs in media and communication | Number of jobs in media and communication related activities such as book and music publishing, film production and TV (NACE Rev. 2, 58 to 60; 62 and 63), divided by the total population and then multiplied by 1000 | City | 2018 | Eurostat’s Urban audit (not used) | The same as for indicator 10 | Note 5 in Table 2 |
| 12. Jobs in other creative sectors | Number of jobs in professional, scientific and technical activities such as architecture, advertising, design, and photographic activities (NACE Rev. 2, 69 to 74), divided by the total population and then multiplied by 1000. | City | 2018 | Eurostat’s Urban audit (not used) | The same as for indicators 10 and 11 | Note 5 in Table 2 |
| Dimension: | D2.2 Intellectual Property and Innovation | |||||
| 13. ICT patent applications | Three-year average number of ICT patent applications (including: consumer electronics, computers and office machinery, and telecommunications) filed to the European Patent Office (EPO) by priority year divided by the total population and then multiplied by 1 million. | NUTS 3 | 2013–2015 | OECD Regpat (100) | not necessary | -- |
| 14. Community design applications | Three-year average number of Community, design applications filed to the Office for Harmonization in the Internal Market (OHIM) divided by the total population and then multiplied by 1 million. | NUTS 3 | 2014–2016 | Eurostat’s Regional Statistics (100) | not necessary | -- |
| Dimension: | D2.3 New Jobs in Creative Sectors | |||||
| 15. Jobs in new arts, culture and entertainment enterprises | New contracts in arts, culture and entertainment activities such as performing arts, museums and libraries (NACE Rev. 2, 90 and 91) divided by the total population and then multiplied by 100,000 | City | 2018 | Eurostat’s Regional Statistics (not used) | Servicio Público de Empleo Estatal (Public Service of State Employment) (100) | Note 6 in Table 2 |
| 16. Jobs in new media and communication enterprises | New contracts in activities such as book and music publishing, film production and TV (NACE Rev. 2, 58 to 60; 62 and 63), divided by the total population and then multiplied by 100,000. | City | 2018 | Eurostat’s Regional Statistics (not used) | The same as for indicator 15 | Note 6 in Table 2 |
| 17. Jobs in new enterprises in other creative sectors | New contracts in professional, scientific and technical activities such as architecture, advertising, design and photographic activities (NACE Rev. 2, 69 to 74), divided by the total population and then multiplied by 100,000. | City | 2018 | Eurostat’s Regional Statistics (not used) | The same as for indicators 15 and 16 | Note 6 in Table 2 |
| Sub-index: | 3. Enabling Environment | |||||
| Dimensión: | D3.1 Human Capital and Education | |||||
| 18. Graduates in arts and humanities | Number of tertiary education students enrolled in arts and humanities courses in the reference year divided by the total population and then multiplied by 100,000 | NUTS 2 | 2018 | ETER project (100) | not necessary | Note 7 in Table 2 |
| 19. Graduates in ICT | Number of tertiary education graduates enrolled in Information and Communication Technologies courses in the reference year divided by the total population and then multiplied by 100,000 | NUTS 2 | 2018 | ETER project (100) | not necessary | Note 7 in Table 2 |
| 20. Average appearances in university rankings | Average number of a university’s degree appearances in the EL Mundo ranking | NUTS 2 | 2018 | QS, Shanghai, Leiden, Times, rankings(not used) | El Mundo: Ranking de las mejores universidades de España por Grado (El Mundo, Best Spanish universities by degree) (100) | Note 8 in Table 2 |
| Dimension: | D3.2 Openness, Tolerance and Trust | |||||
| 21. Foreign graduates | Number of foreign graduates enrolled in tertiary education courses in the reference year divided by the total number of tertiary education graduates in the same academic years | NUTS 2 | 2018 | ETER project (100) | not necessary | -- |
| 22. Foreign-born population | Percentage of the total population which is foreign-born | City | 2018 | Eurostat’s Urban audit (not used) | Instituto Nacional de Estadística, Padrón municipal (Statistics National Institute, (100) | -- |
| 23. Tolerance of foreigners | Average of the positive answers percentages to the question: “En términos generales, ¿cree Ud. que la inmigración es muy positiva, positiva, negativa o muy negativa para este país?” (In general terms, do you think that immigration is very positive, positive, negative or very negative for this country?) | NUT 3 and cities between 20,000 to 100,000 inhabitants within the same NUT | 2015 | Flash Euro-barometer | Centro de Investigaciones Sociológicas. Encuesta sobre actitudes hacia la inmigración (Center for Sociological Research. Survey on attitudes towards immigration) (100) | -- |
| 24. Integration of foreigners | Average of the positive answers percentages to the question: “¿Cómo diria ud que los españoles, en general, tratan a los inmigrantes extranjeros? (How would you say that Spaniards, in general, treat foreign immigrants? | The same as for indicator 23 | 2015 | Flash Euro-barometer (not used) | The same as for indicator 23 | Note 9 in Table 2 |
| 25. People trust | Average of the positive answers percentages to the question: “¿Diría usted que, por lo general, se puede confiar en la mayoría de la gente, o que nunca se es lo bastante prudente en el trato con los demás?” (Would you say that, in general, most people can be trusted, or that you are never wise enough to deal with others?) | The same as for indicators 23 and 24 | 2015 | Flash Euro-barometer (not used) | The same as for indicators 23 and 24 | Note 10 in Table 2 |
| Dimension: | D3.3 Local and International Connections | |||||
| 26. Accessibility to flights | Population-weighted average number of accessible passenger flights per day, within 1h30 of travel by road | City | 2018 | EC Directorate General for Regional and Urban policy (not used) | AENA, Aeropuertos Españoles y Navegación Aérea (Spanish Airports and Air Navigation) (100) | -- |
| 27. Accessibility by road | Population accessible within 1h30 by road, as share of the population in a neighbourhood of 120 km radius | City | 2017 | EC Directorate General for Regional and Urban policy (not used) | Instituto Geográfico Nacional (National Geographic Institute (100) | -- |
| 28. Accessibility by rail | Average hourly number of departures between 6:00 and 20:00 of direct trains to other cities or greater cities divided by the total population and then multiplied by 1 million | City | 2014–2019 | EC Directorate General for Regional and Urban policy (not used) | ADIF, Administrador de Infraestructuras Ferroviarias (Rail Infrastructure Manager) | -- |
| Dimension: | D3.4 Quality of governance | |||||
| 29. Quality of governance | Average of the positive answer percentages to the following three questions: 1.“Independientemente de que los utilice o no, ¿está Ud. muy satisfecho/a, bastante, poco o nada satisfecho/a con el funcionamiento de la enseñanza pública? (Regardless of whether you use them or not, are you very satisfied, quite, little or not at all satisfied with the functioning of public education); 2. “Independientemente de que los utilice o no, ¿está Ud. muy satisfecho/a, bastante, poco o nada satisfecho/a con el funcionamiento de la Administración de Justicia?” (Regardless of whether you use them or not, are you very satisfied, quite, little or not at all satisfied with the functioning of the administration of justice) and 3. “¿Está Ud. satisfecho/a o insatisfecho/a con el modo en que el sistema sanitario público funciona en España?” (Are you satisfied or dissatisfied with the way in which the public health system works in Spain?) | NUTS 3; 20,000 to 100,000 inhabitants cities | 2016–2017 | DG Regio (not used) | Centro de Investigaciones Sociológicas. Barómetro sanitario; Encuesta sobre la calidad de los servicios públicos (Center for Sociological Research. Sanitary barometer; Survey on the quality of public services (100) | Note 13 in Table 2 |
Source: authors’ own elaboration based on [9].
Table A2.
Complementary considerations about the indicators.
Table A2.
Complementary considerations about the indicators.
| Note number | Indicator | Definitions in the CCCM Model (If Different from the Used in This Work); Imputation Criteria for Missing Values and Other Methodological Considerations |
|---|---|---|
| 1 | 6 | Missing values in the variable were replaced after classifying the 81 cities according to their size and tourist character (yes/no) and assigning to the cities without data the median of the value of the variable in that group |
| 2 | 7 | Missing values in the variable were replaced after classifying the 81 cities according to their size and number of museums and assigning to the cities without data the median of the value of the variable in that group |
| 3 | 8 | Missing values in the variable were replaced after classifying the 81 cities according to their size, number of cinemas and metropolitan condition (Yes/not) and assigning to the cities without data the median of the value of the variable in that group |
| 4 | 9 | CCCM model description, geo-level and sources: Percentage of population that is very satisfied with cultural facilities (i.e., concert halls, theatres, museums, libraries) in the city; City; 2015 Survey on “Quality of life in cities” by TNS/EC. |
| 5 | 10–12 | Activities included in the CCCM model: NACE Rev. 2, R-U for indicator 10; NACE Rev. 2, J for indicator 11; NACE Rev. 2, M-N for indicator 12. For this adaptation activity 92, Gambling and betting activities, is excluded from the computation of the indicator 10; activity 61, Telecommunications, is excluded from the computation of the indicator 11 and activities 77 to 82, corresponding to section N, Administrative and support service activities, are excluded from the computation of the indicator 12. |
| 6 | 15–17 | CCCM model description: “Number of persons employed in the enterprises established in the reference year in ….” (corresponding activities). As explained for indicators 10–12 activities 92, 61 and 77 to 82 have been excluded from the computation of these indicators. |
| 7 | 18–19 | All the cities belonging to the same NUT 2 are assigned the same value in the variable. |
| 8 | 20 | CCCM model description: Average number of a university’s appearances in four different university rankings: QS, Shanghai, Leiden and Times. All the cities belonging to the same NUT 2 are assigned the same value in the variable |
| 9 | 23 | CCCM model description: Percentage of the population which very strongly agrees with the statement: ‘The presence of foreigners is good for this city’. All the cities belonging to the same NUT 3 are assigned the same value in the variable. |
| 10 | 24 | CCCM model description: Percentage of the population which very strongly agrees with the statement: ‘Foreigners who live in this city are well integrated’. All the cities belonging to the same NUT 3 are assigned the same value in the variable. The answers considered positive are: “normally” and “with kindness”. |
| 11 | 25 | CCCM model description: Percentage of the population which very strongly agrees with the statement: ‘Generally speaking, most people in this city can be trusted”. All the cities belonging to the same NUT 3 are assigned the same value in the variable. The answers considered as positive are those of value greater than or equal to 7. |
| 12 | 28 | CCCM model description: Population accessible within 1 h 30 min by rail (average total travel time), as share of the population in a neighbourhood of 120 km radius |
| 13 | 29 | CCCM model description: “Computed indicator measuring the quality of government in three areas of public services: education, healthcare and law enforcement”. The answers considered as positive are: “Muy satisfecho” (very satisfied) and “bastante satisfecho” (quite satisfied) for questions 1 and 2; rating >7 points for question 3. |
Table A3.
Descriptive statistics of C3s index and the sub-index.
Table A3.
Descriptive statistics of C3s index and the sub-index.
| Variable | N | Mean | St. Dev | Minimum | Median | Maximum |
|---|---|---|---|---|---|---|
| D1 Cultural Vibrancy | 81 | 29.9 | 12.39 | 10.19 | 27.09 | 65.37 |
| D2 Creative Economy | 81 | 23.36 | 16.66 | 2.16 | 19.32 | 69.14 |
| D3 Enabling Environ. | 81 | 42.8 | 17.31 | 17.3 | 35.52 | 7.2 |
| C3s | 81 | 29.54 | 10.54 | 11.62 | 28.59 | 54.82 |
Source: authors’ own elaboration.
References
- Montalto, V.; Tacao Moura, J.T.; Langedijk, S.; Saisana, M. Culture counts: An empirical approach to measure the cultural and creative vitality of European cities. Cities 2019, 89, 167–185. [Google Scholar] [CrossRef]
- Barrado-Timón, D.; Palacios, A.; Hidalgo-Giralt, C. Medium and Small Cities, Culture and the Economy of Culture. A Review of the Approach to the Case of Spain in Light of International Scientific Scholarship. Sustainability 2020, 12, 7321. [Google Scholar] [CrossRef]
- Gross, J.; Heinonen, J.; Burlina, C.; Comunian, R.; Conor, B.; Crociatta, A.; Dent, T.; Guardans, I.; Hytti, U.; Hytönen, K.; et al. Managing Creative Economies as Cultural Eco-Systems. Developing Inclusive and Sustainable Creative Economies (DISCE). 2020. Available online: https://disce.eu/wp-content/uploads/2020/07/DISCE-Policy-Brief-1.pdf?fbclid=IwAR2TksBnPjtTlKciwcurr2X7pyGK4o4Fc3gKVv8A9mYyBNyNyjHfhoqbbdw (accessed on 27 April 2021).
- Gross, J.; Wilson, N. Cultural Democracy: An Ecological and Capabilities Approach. Int. J. Cult. Policy 2018, 26, 328–343. [Google Scholar] [CrossRef]
- Escalona, A.; Sáez, L.; Sánchez-Valverde, B. Patterns and drivers of cultural economy in Spain’s extra-metropolitan small towns. Investig. Reg. J. Reg. Res. 2017, 38, 27–45. [Google Scholar]
- Escalona-Orcao, A.; Sáez-Pérez, L.; Sánchez-Valverde, B. Location conditions for the clustering of creative activities in extra-metropolitan areas: Analysis and evidence from Spain. Appl. Geogr. 2018, 91, 1–9. [Google Scholar] [CrossRef]
- Barrado, D.; Escalona, A.; Escolano, S.; Sánchez, B. Creative clusters outside and within metropolitan areas: A comparative analysis. In Proceedings of the Fifth Global Conference on Economic Geography of Creative Industries IV (Session 97), Köln, Germany, 24–28 July 2018. [Google Scholar]
- Montalto, V.; Tacao Moura, C.J.; Langedijk, S.; Saisana, M. The Cultural and Creative Cities Monitor; European Commission, Joint Research Centre: Ispra, Italy, 2017; p. 114. Available online: https://publications.jrc.ec.europa.eu/repository/handle/JRC107331 (accessed on 28 April 2021).
- Montalto, V.; Tacao Moura, C.; Panella, F.; Alberti, V.; Becker, W.; Saisana, M. The Cultural and Creative Cities Monitor: 2019 Edition; JRC117336; EUR 29797 EN; Publications Office of the European Union: Luxembourg, 2019. [Google Scholar] [CrossRef]
- UNESCO. Indicadores Cultura 2030; UNESCO: Paris, France, 2020; Available online: https://unesdoc.unesco.org/ark:/48223/pf0000373570 (accessed on 27 April 2021).
- Escalona-Orcao, A.; Barrado-Timón, D.A.; Escolano-Utrilla, S.; Sánchez-Valverde, B.; Navarro-Pérez, M.; Pinillos-García, M.; Sáez-Pérez, L.A. Cultural and Creative Ecosystems in Medium-Sized Cities: Evolution in Times of Economic Crisis and Pandemic. Sustainability 2021, 13, 49. [Google Scholar] [CrossRef]
- Iammarino, S.; Rodriguez-Pose, A.; Storper, M. Regional inequality in Europe: Evidence, theory and policy implications. J. Econ. Geogr. 2019, 19, 273–298. [Google Scholar] [CrossRef]
- Gobierno de España. Plan de Recuperación, Transformación y Resiliencia; Gobierno de España: Madrid, Spain, 2020; Available online: https://www.lamoncloa.gob.es/presidente/actividades/Documents/2020/07102020_PlanRecuperacion.pdf (accessed on 27 April 2021).
- Lazeretti, L.; Capone, F.; Innocenti, N. Exploring the intellectual structure of creative economy research and local economic development: A co-citation analysis. Eur. Plan Stud. 2017, 25, 1693–1713. [Google Scholar] [CrossRef]
- Guiso, L.; Sapienza, P.; Zingales, L. Does culture affect economic outcomes? J. Econ. Perspect. 2006, 20, 23–48. [Google Scholar] [CrossRef] [Green Version]
- Sacco, P.; Ferilli, G.; Blessi, G. Understanding culture-led local development: A critique of alternative theoretical explanations. Urban Stud. 2014, 51, 23–48. [Google Scholar] [CrossRef]
- Gong, H.; Hassink, R. Exploring the clustering of creative industries. Eur. Plan. Stud. 2017, 25, 583–600. [Google Scholar] [CrossRef]
- Andres, L.; Chapain, C. Creative systems: A new integrated approach to understanding the complexity of cultural and creative industries in Easten and Wester countries. In Handbook of Service Business; Edward Elgar Publishing: Cheltenham, UK, 2015; pp. 349–370. [Google Scholar]
- Alonso, W. Urban Zero Population Growth. In Daedalus; The MIT Press: Cambridge, MA, USA, 1973; pp. 191–206. Available online: https://www.jstor.org/stable/i20024159 (accessed on 27 April 2021).
- Johnson, T.G.; Fannin, J.M. A New Conceptual Framework for Rural Cultural Wealth; National Endowment for the Arts Research Labs, Rural Policy Research Institute. 2019. Available online: https://rupri.org/wp-content/uploads/A-New-Conceptual-Framework-for-Rural-Cultural-Wealth.pdf (accessed on 27 April 2021).
- Florida, R. The Rise of the Creative Class; Basic Books: New York, NY, USA, 2002. [Google Scholar]
- Throsby, D. The Economics of Cultural Policy; Cambridge University Press: Cambridge, UK, 2010. [Google Scholar]
- Scott, A. The cultural economy of cities. Int. J. Urban Reg. Res. 1997, 21, 323–329. [Google Scholar] [CrossRef]
- Organización de las Naciones Unidas. Resolución Aprobada por la Asamblea General el 19 de Diciembre de 2019 (Sobre la Base del Informe de la Segunda Comisión (A/74/379)); A/RES/74/198; Organización de las Naciones Unidas: New York, NY, USA, 2020; Available online: https://undocs.org/es/A/RES/74/198 (accessed on 27 April 2021).
- Travkina, E.; Sacco, P.L.; Morari, B. Culture Shock: COVID-19 and the Cultural and Creative Sectors; OECD Responses to Coronavirus (COVID–19); OECD: Paris, France; Available online: https://www.oecd.org/coronavirus/policy-responses/culture-shock-covid-19-and-the-cultural-and-creative-sectors-08da9e0e/ (accessed on 27 April 2021).
- Ramos Murphy, T.; Rausell, R. La Cultura y la Creatividad en la Europa de la Recuperación: Ahora o Nunca. Culturplaza. 2 August 2020. Available online: https://valenciaplaza.com/la-cultura-y-la-creatividad-en-la-europa-de-la-recuperacion-ahora-o-nunca (accessed on 27 April 2021).
- Johnson, T.; Raines, N.; Pender, J. Comprehensive wealth accounting: Bridging place-based and people-based measures of wealth. In Rural Wealth Creation, 1st ed.; Pender, J., Johnson, T., Weber, B., Fannin, J., Eds.; Routledge: New York, NY, USA, 2014; pp. 30–54. [Google Scholar]
- Jackson, M.R.; Kabwasa-Green, F.; Herranz, J. Cultural Vitality in Communities: Interpretation and Indicators; Culture, Creativity and Communities Program; The Urban Institute: Washington, DC, USA, 2006; Available online: https://www.urban.org/sites/default/files/publication/50676/311392-Cultural-Vitality-in-Communities-Interpretation-and-Indicators.PDF (accessed on 27 April 2021).
- Musterd, S.; Gritsai, O. The creative knowledge city in Europe: Structural conditions and urban policy strategies for competitive cities. Eur. Urban Reg. Stud. 2013, 20, 343–359. [Google Scholar] [CrossRef]
- Montalto, V.; Sacco, P.L.; Alberti, V.; Panella, F.; Saisana, M. European Cultural and Creative Cities in COVID-19 Times. Jobs at Risk and the Policy Response; Office of the European Union: Luxembourg, 2020; p. 33. [Google Scholar] [CrossRef]
- Dubini, P. L’effetto domino del Covid-19 sull’economia delle filiere culturali. Ag Cult. 31 March 2020. Available online: https://agcult.it/a/16656/2020-03-31/sviluppo-sostenibile-l-effetto-domino-del-covid-19-sull-economia-delle-filiere-culturali (accessed on 27 April 2021).
- Meijers, E.J.; Burger, M.J. Stretching the concept of ‘borrowed size’. Urban Stud. 2015, 54, 269–291. [Google Scholar] [CrossRef]
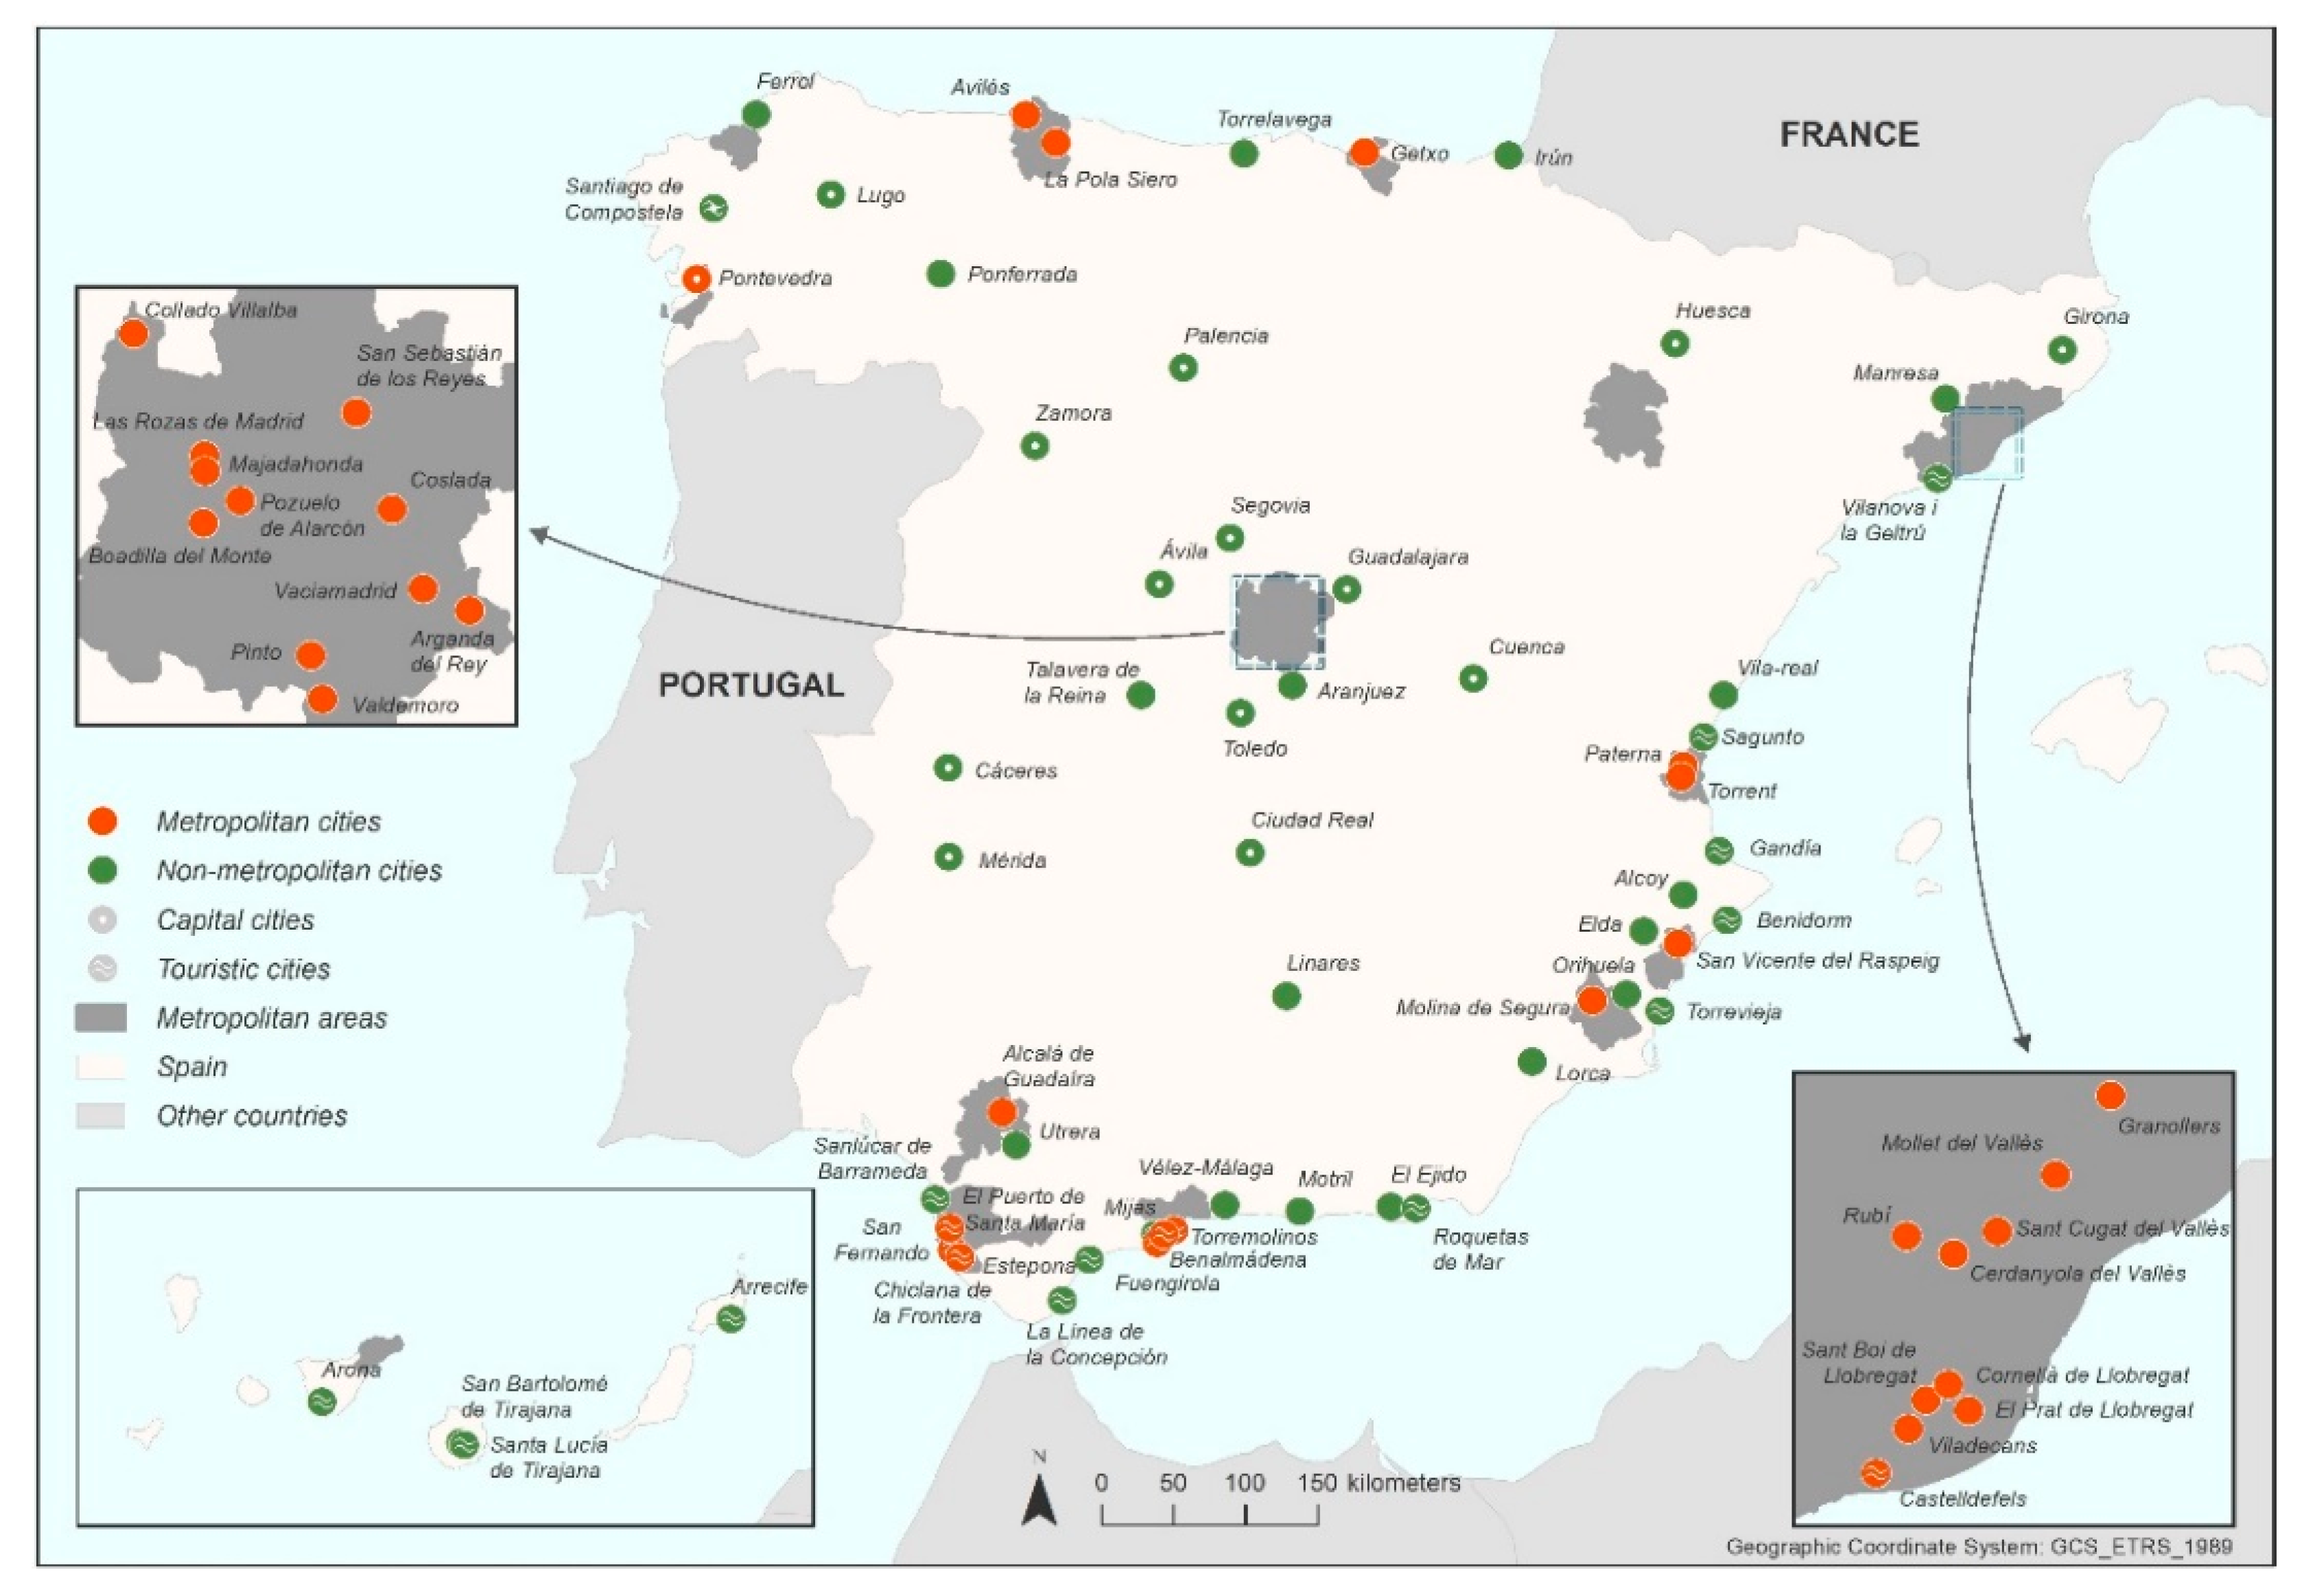
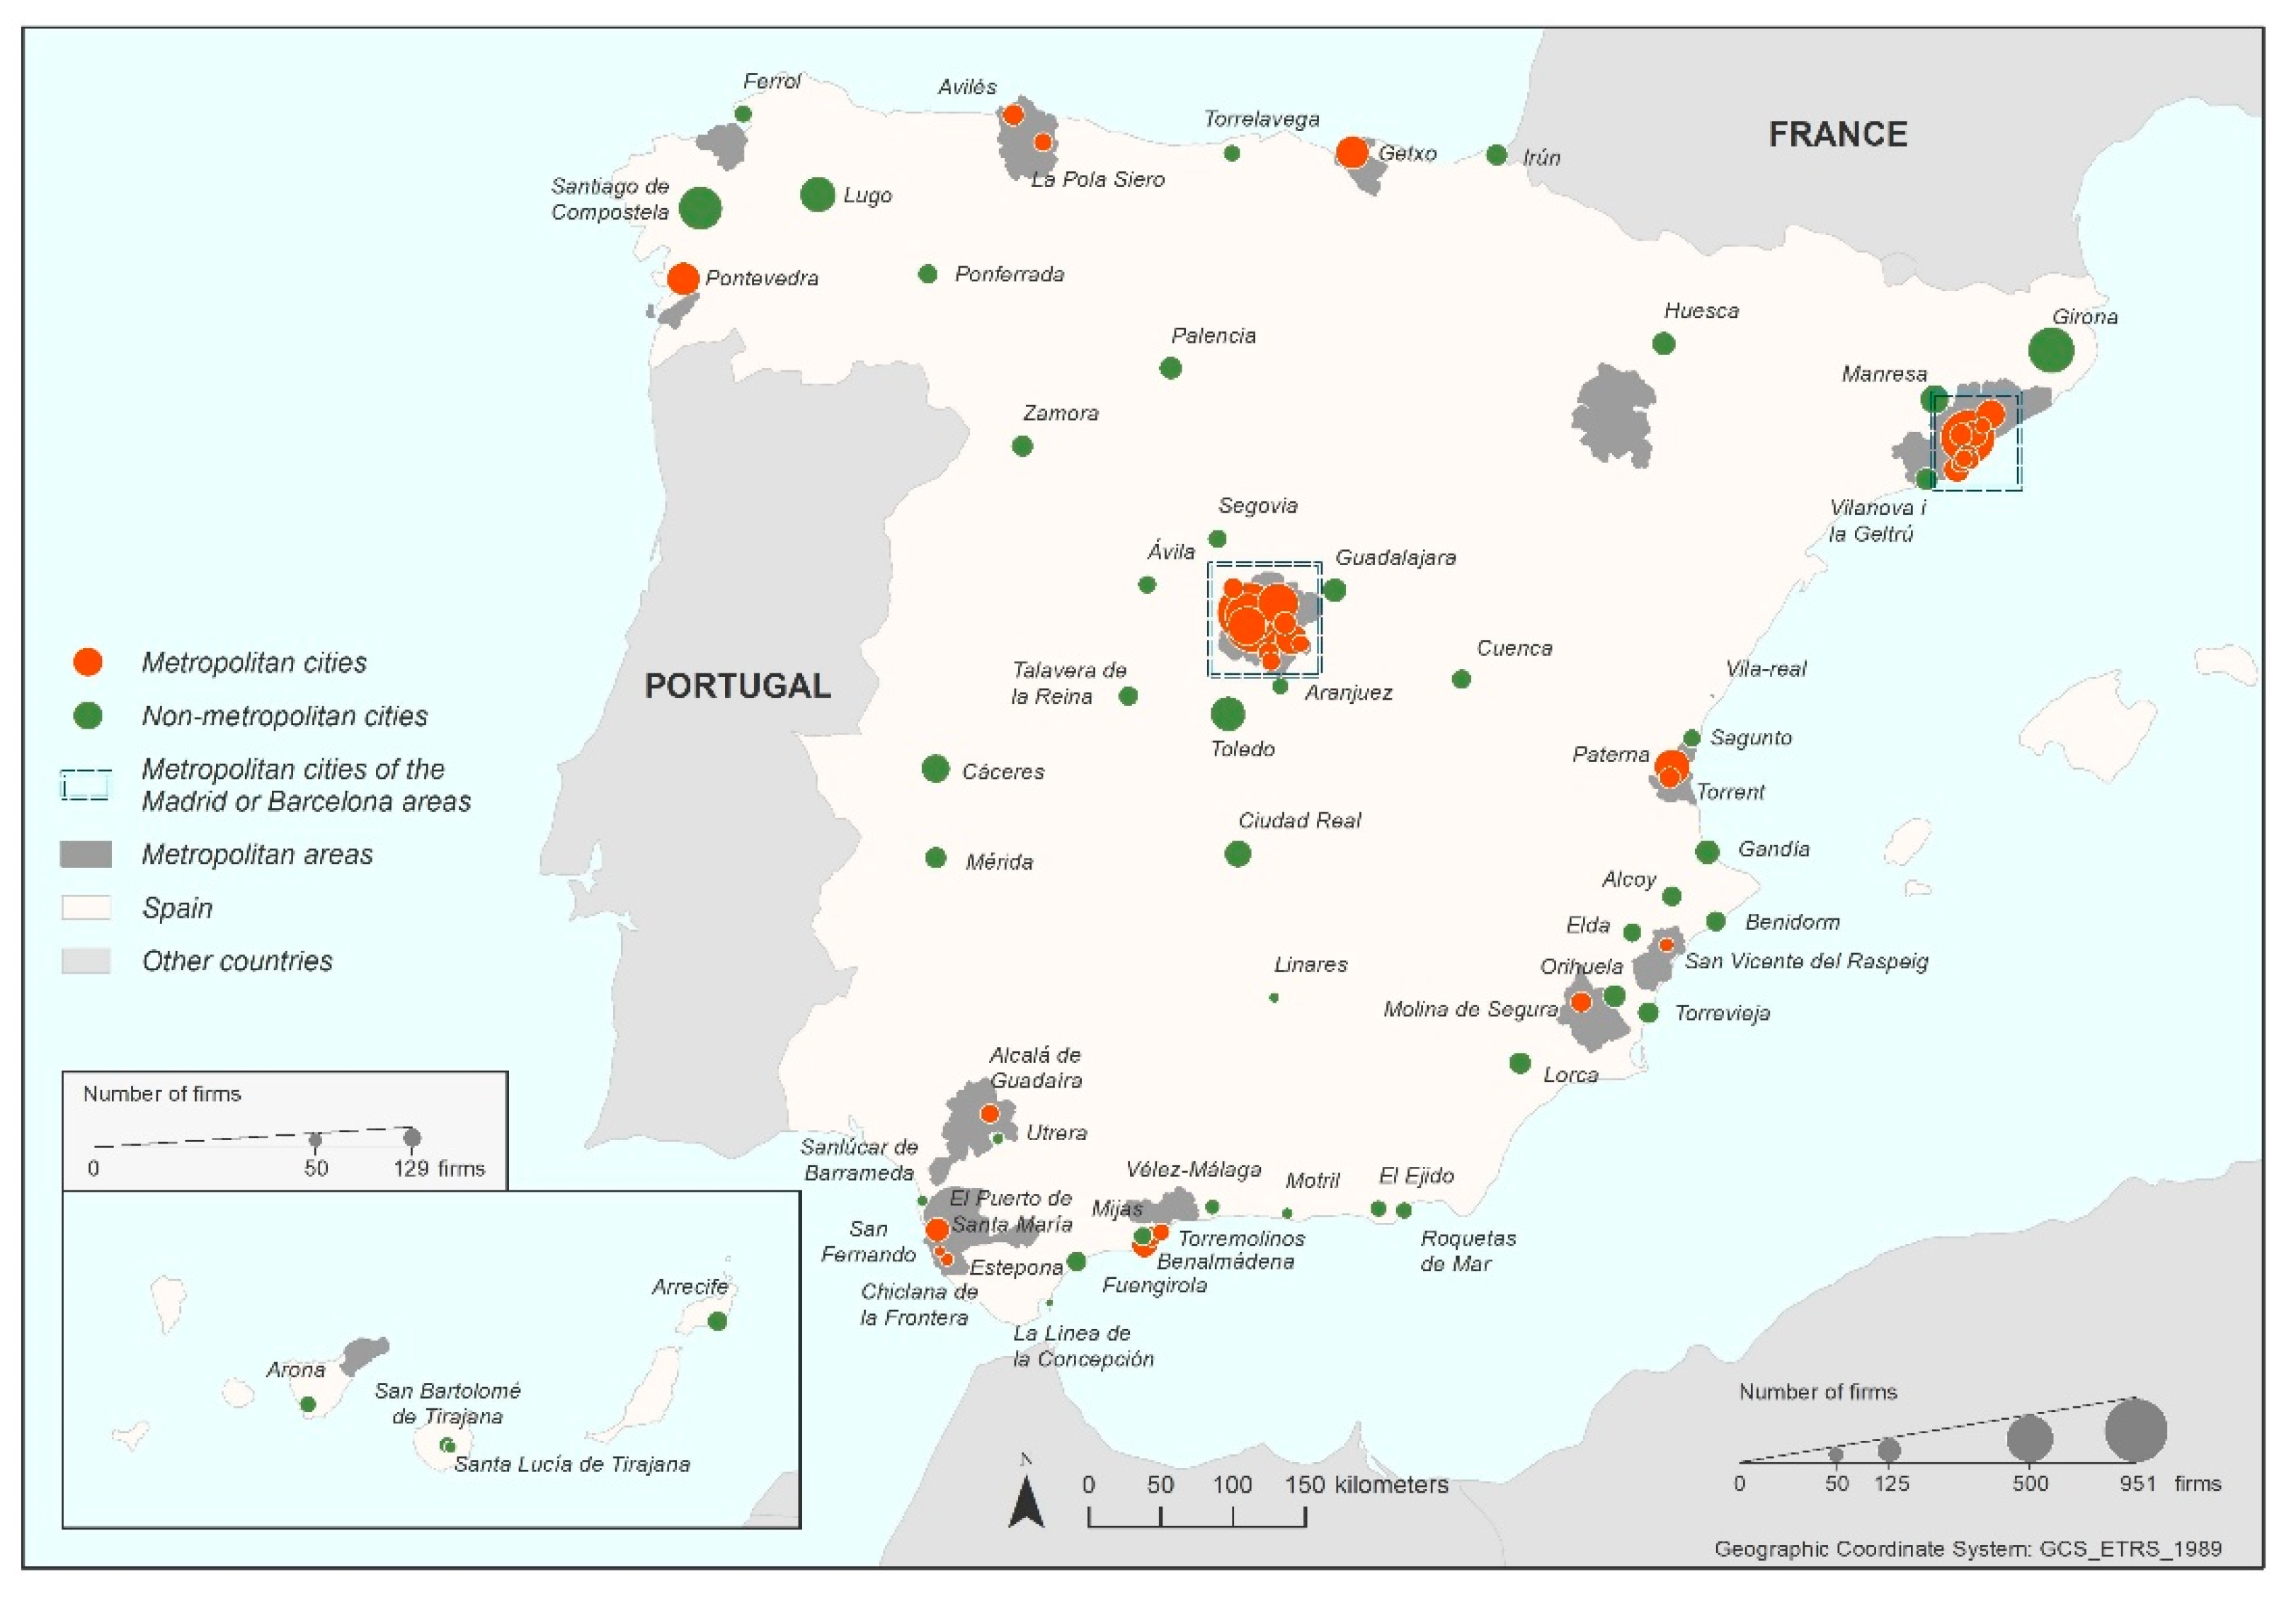

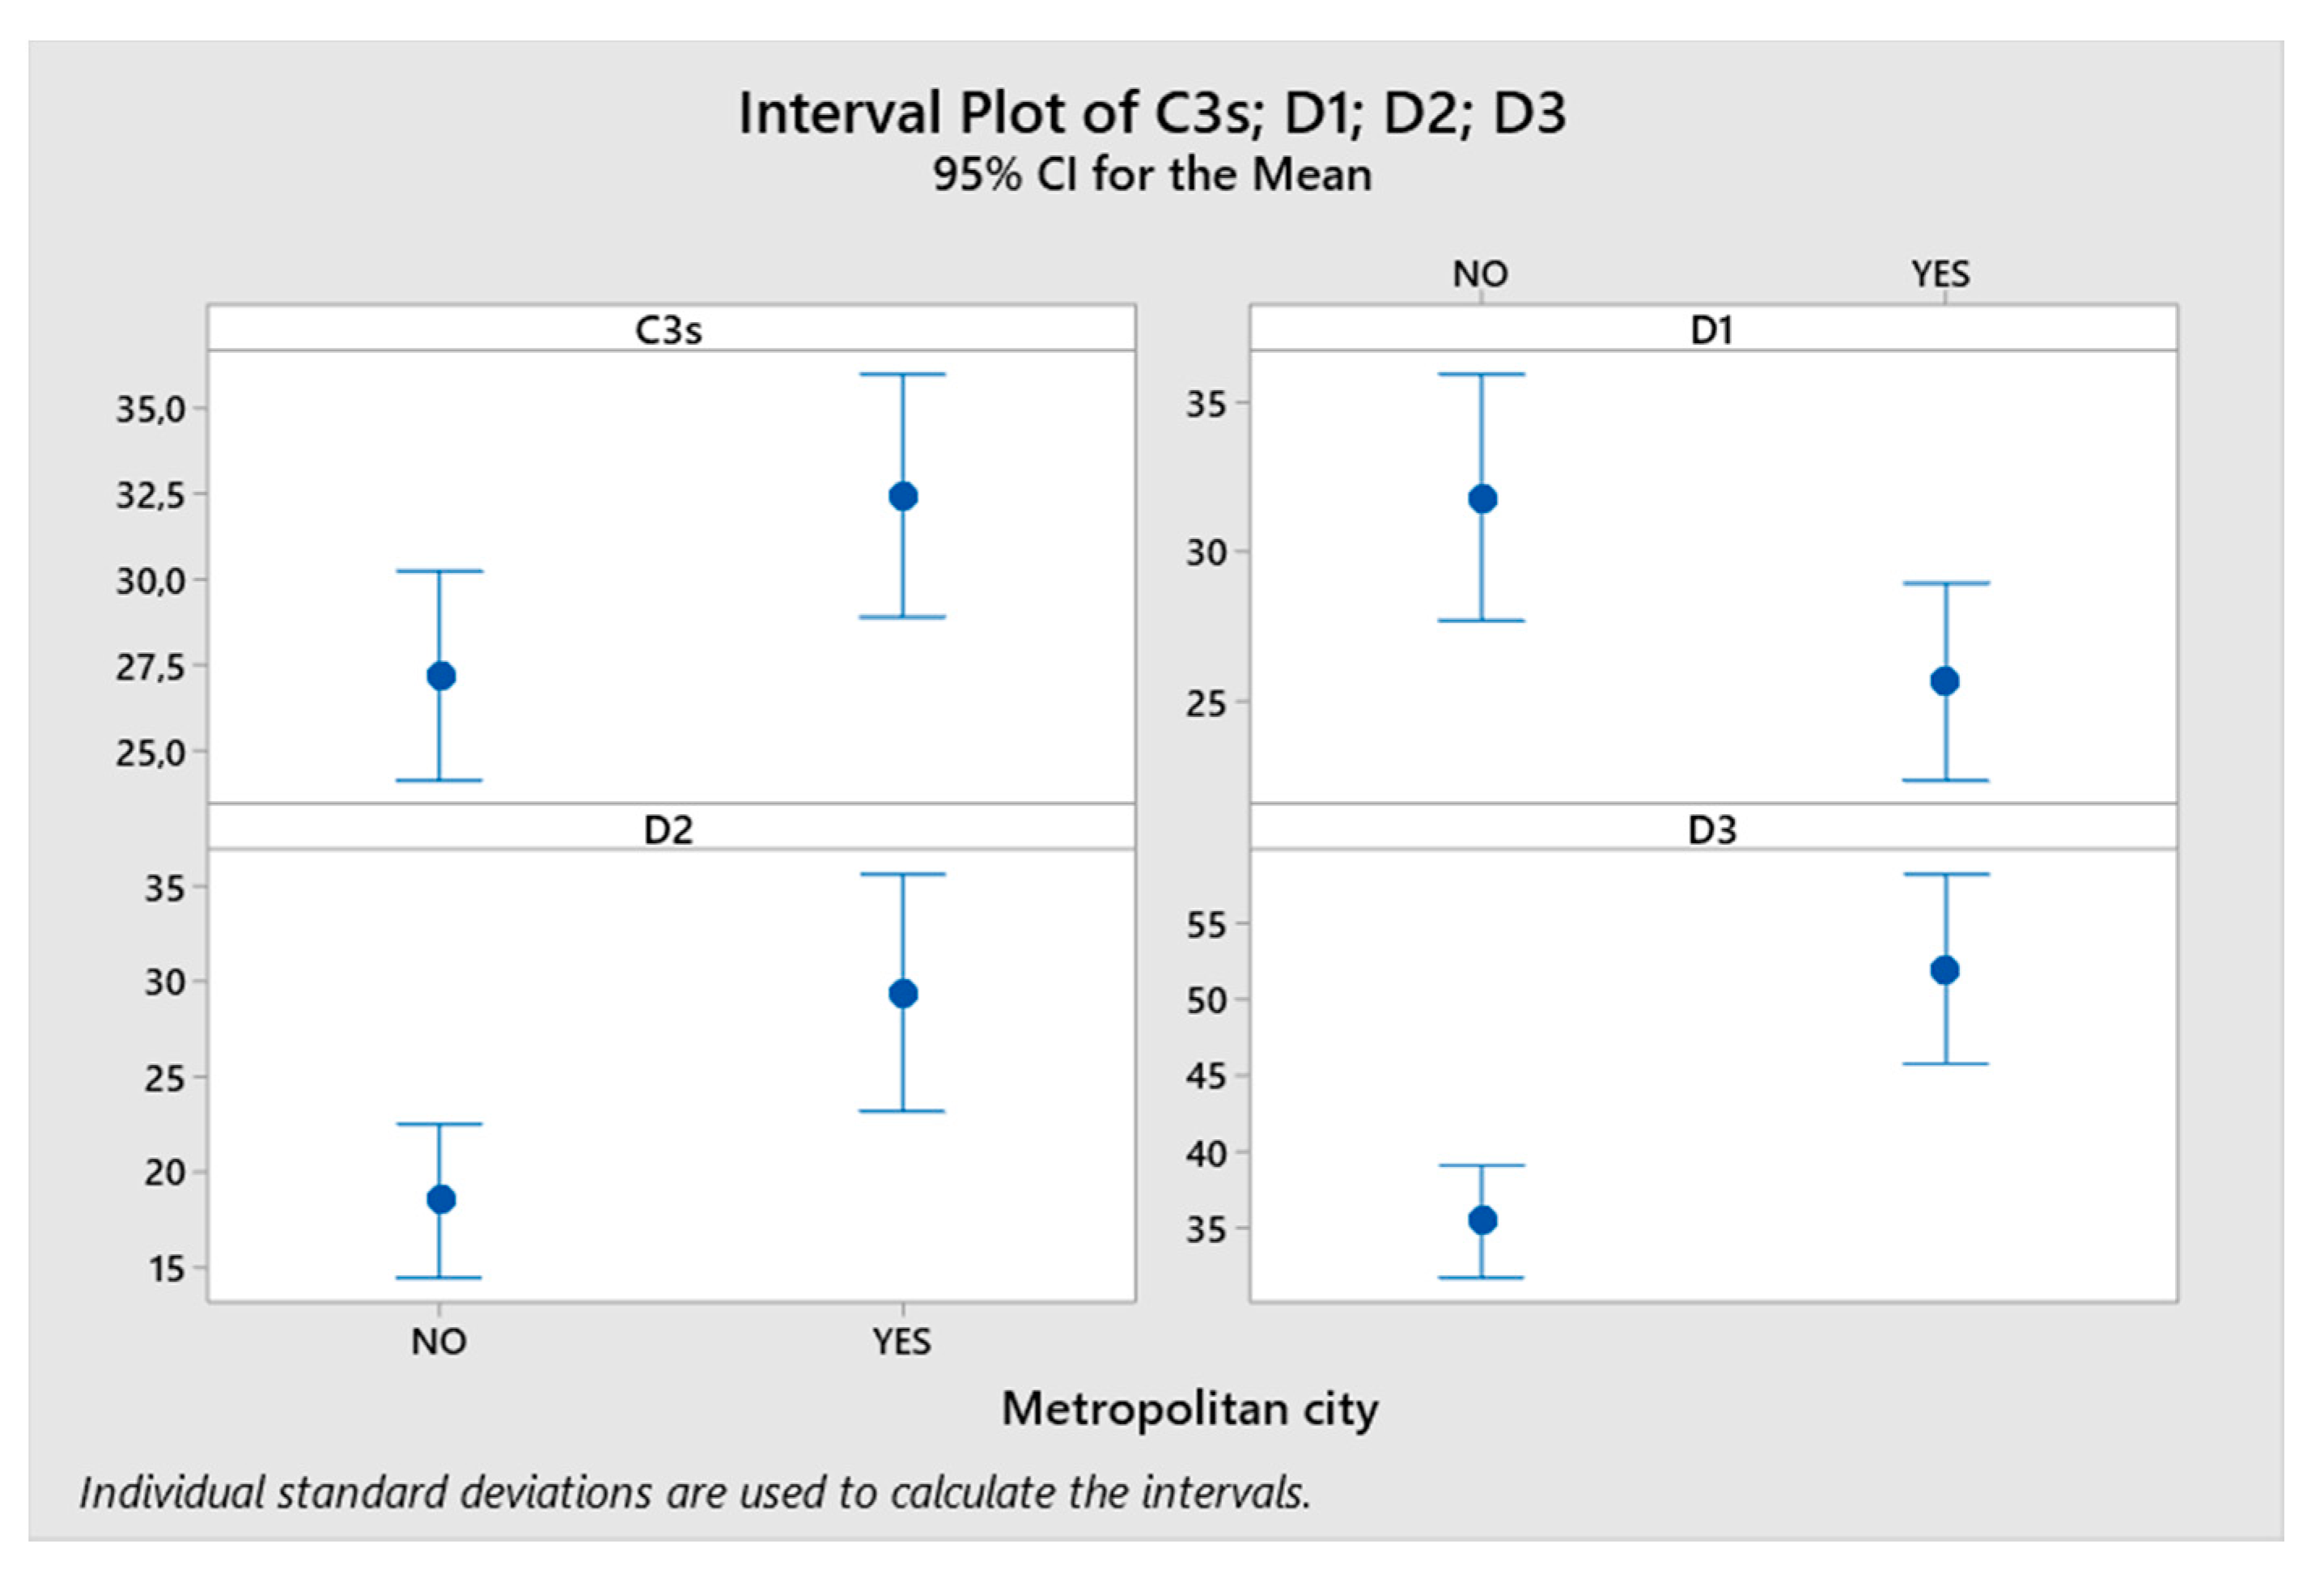
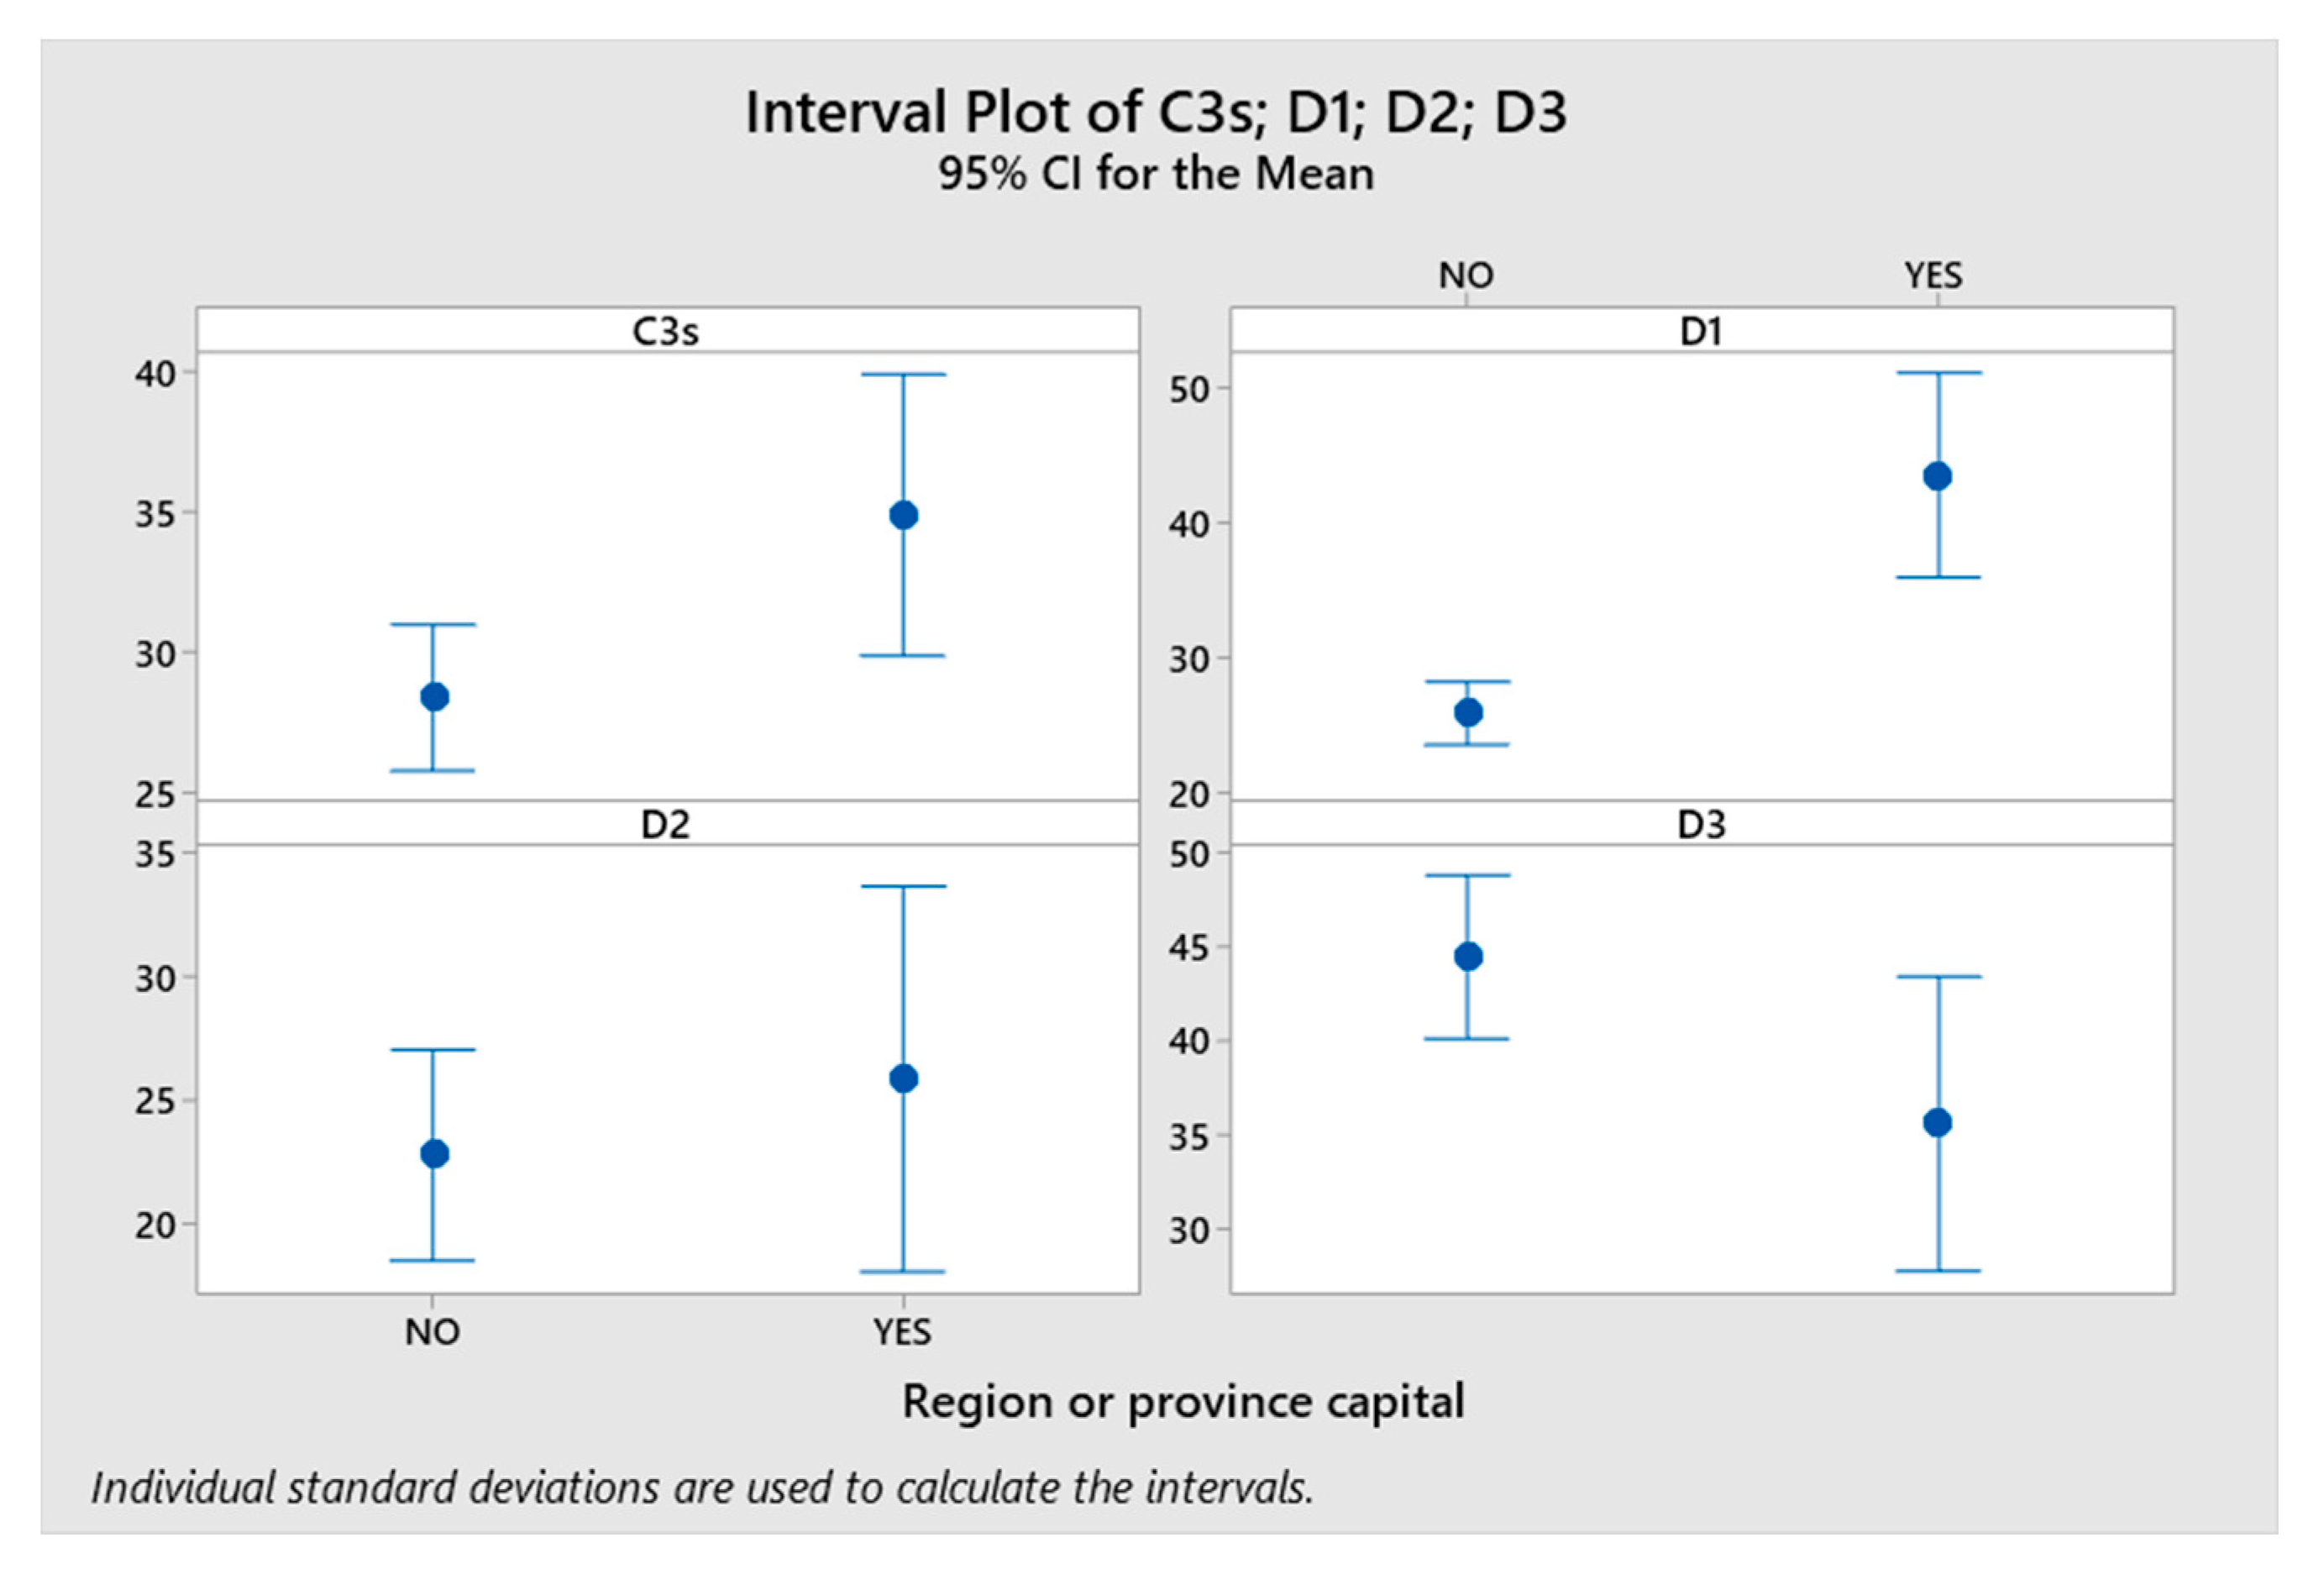
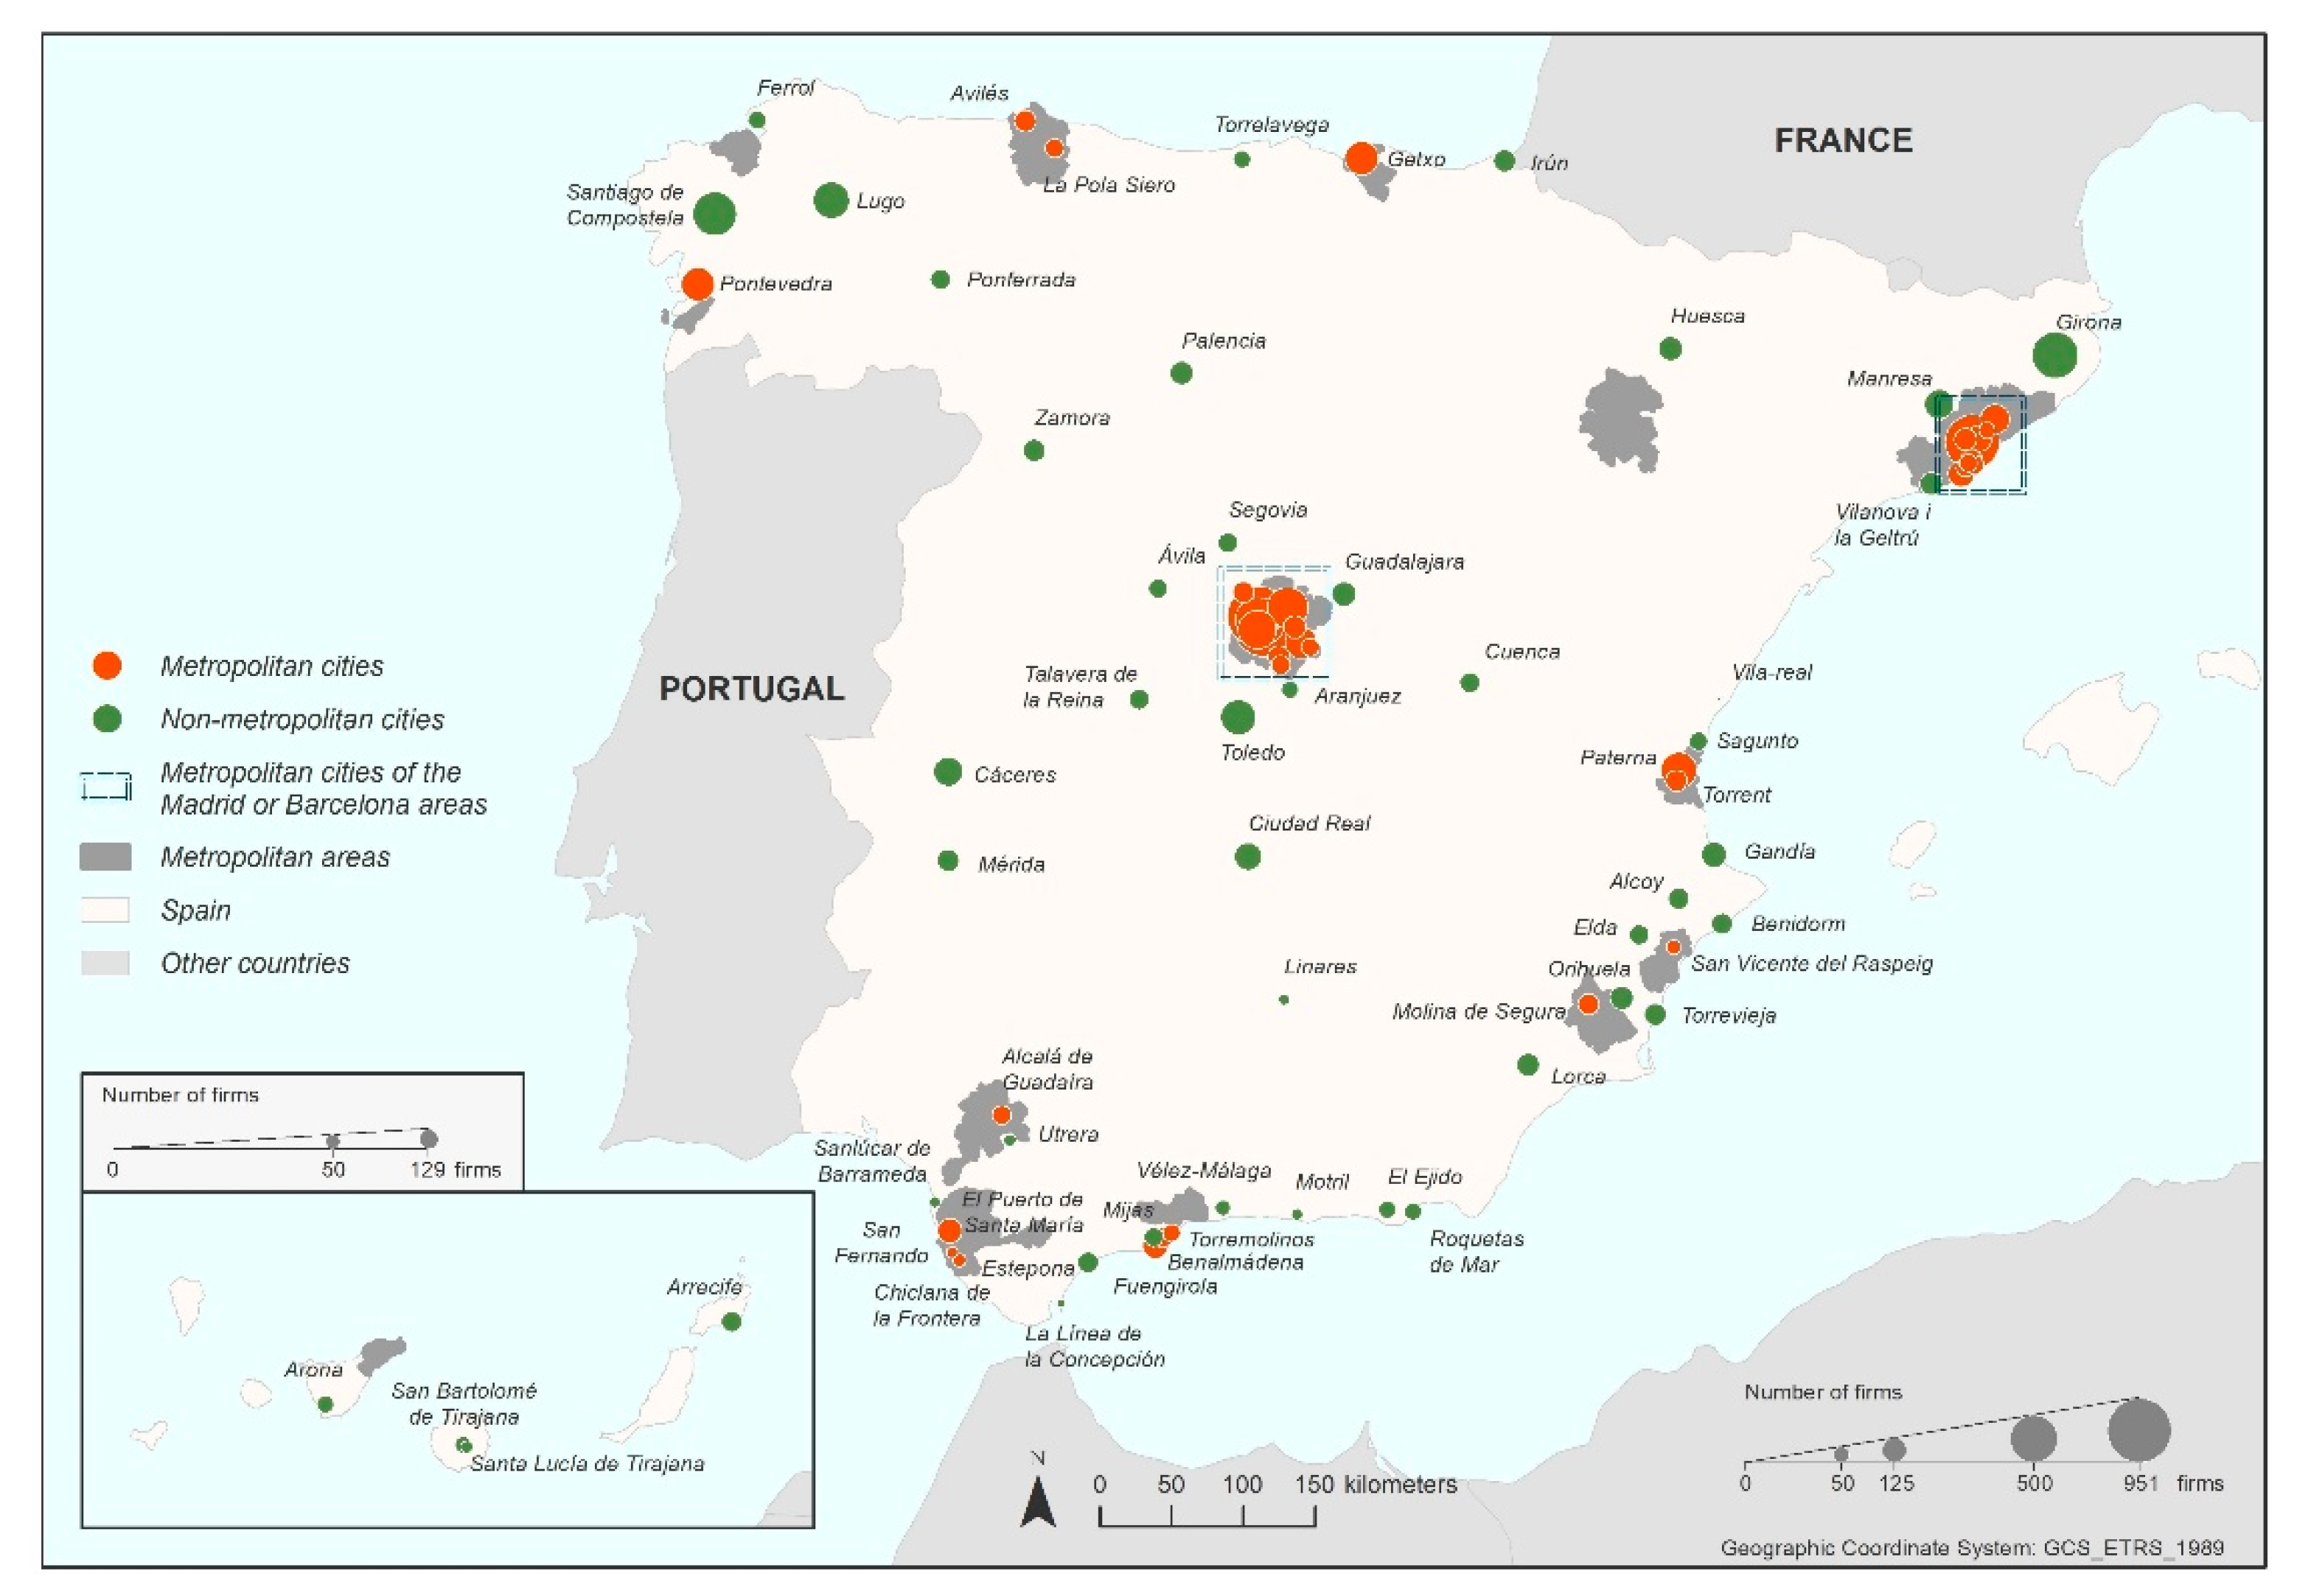
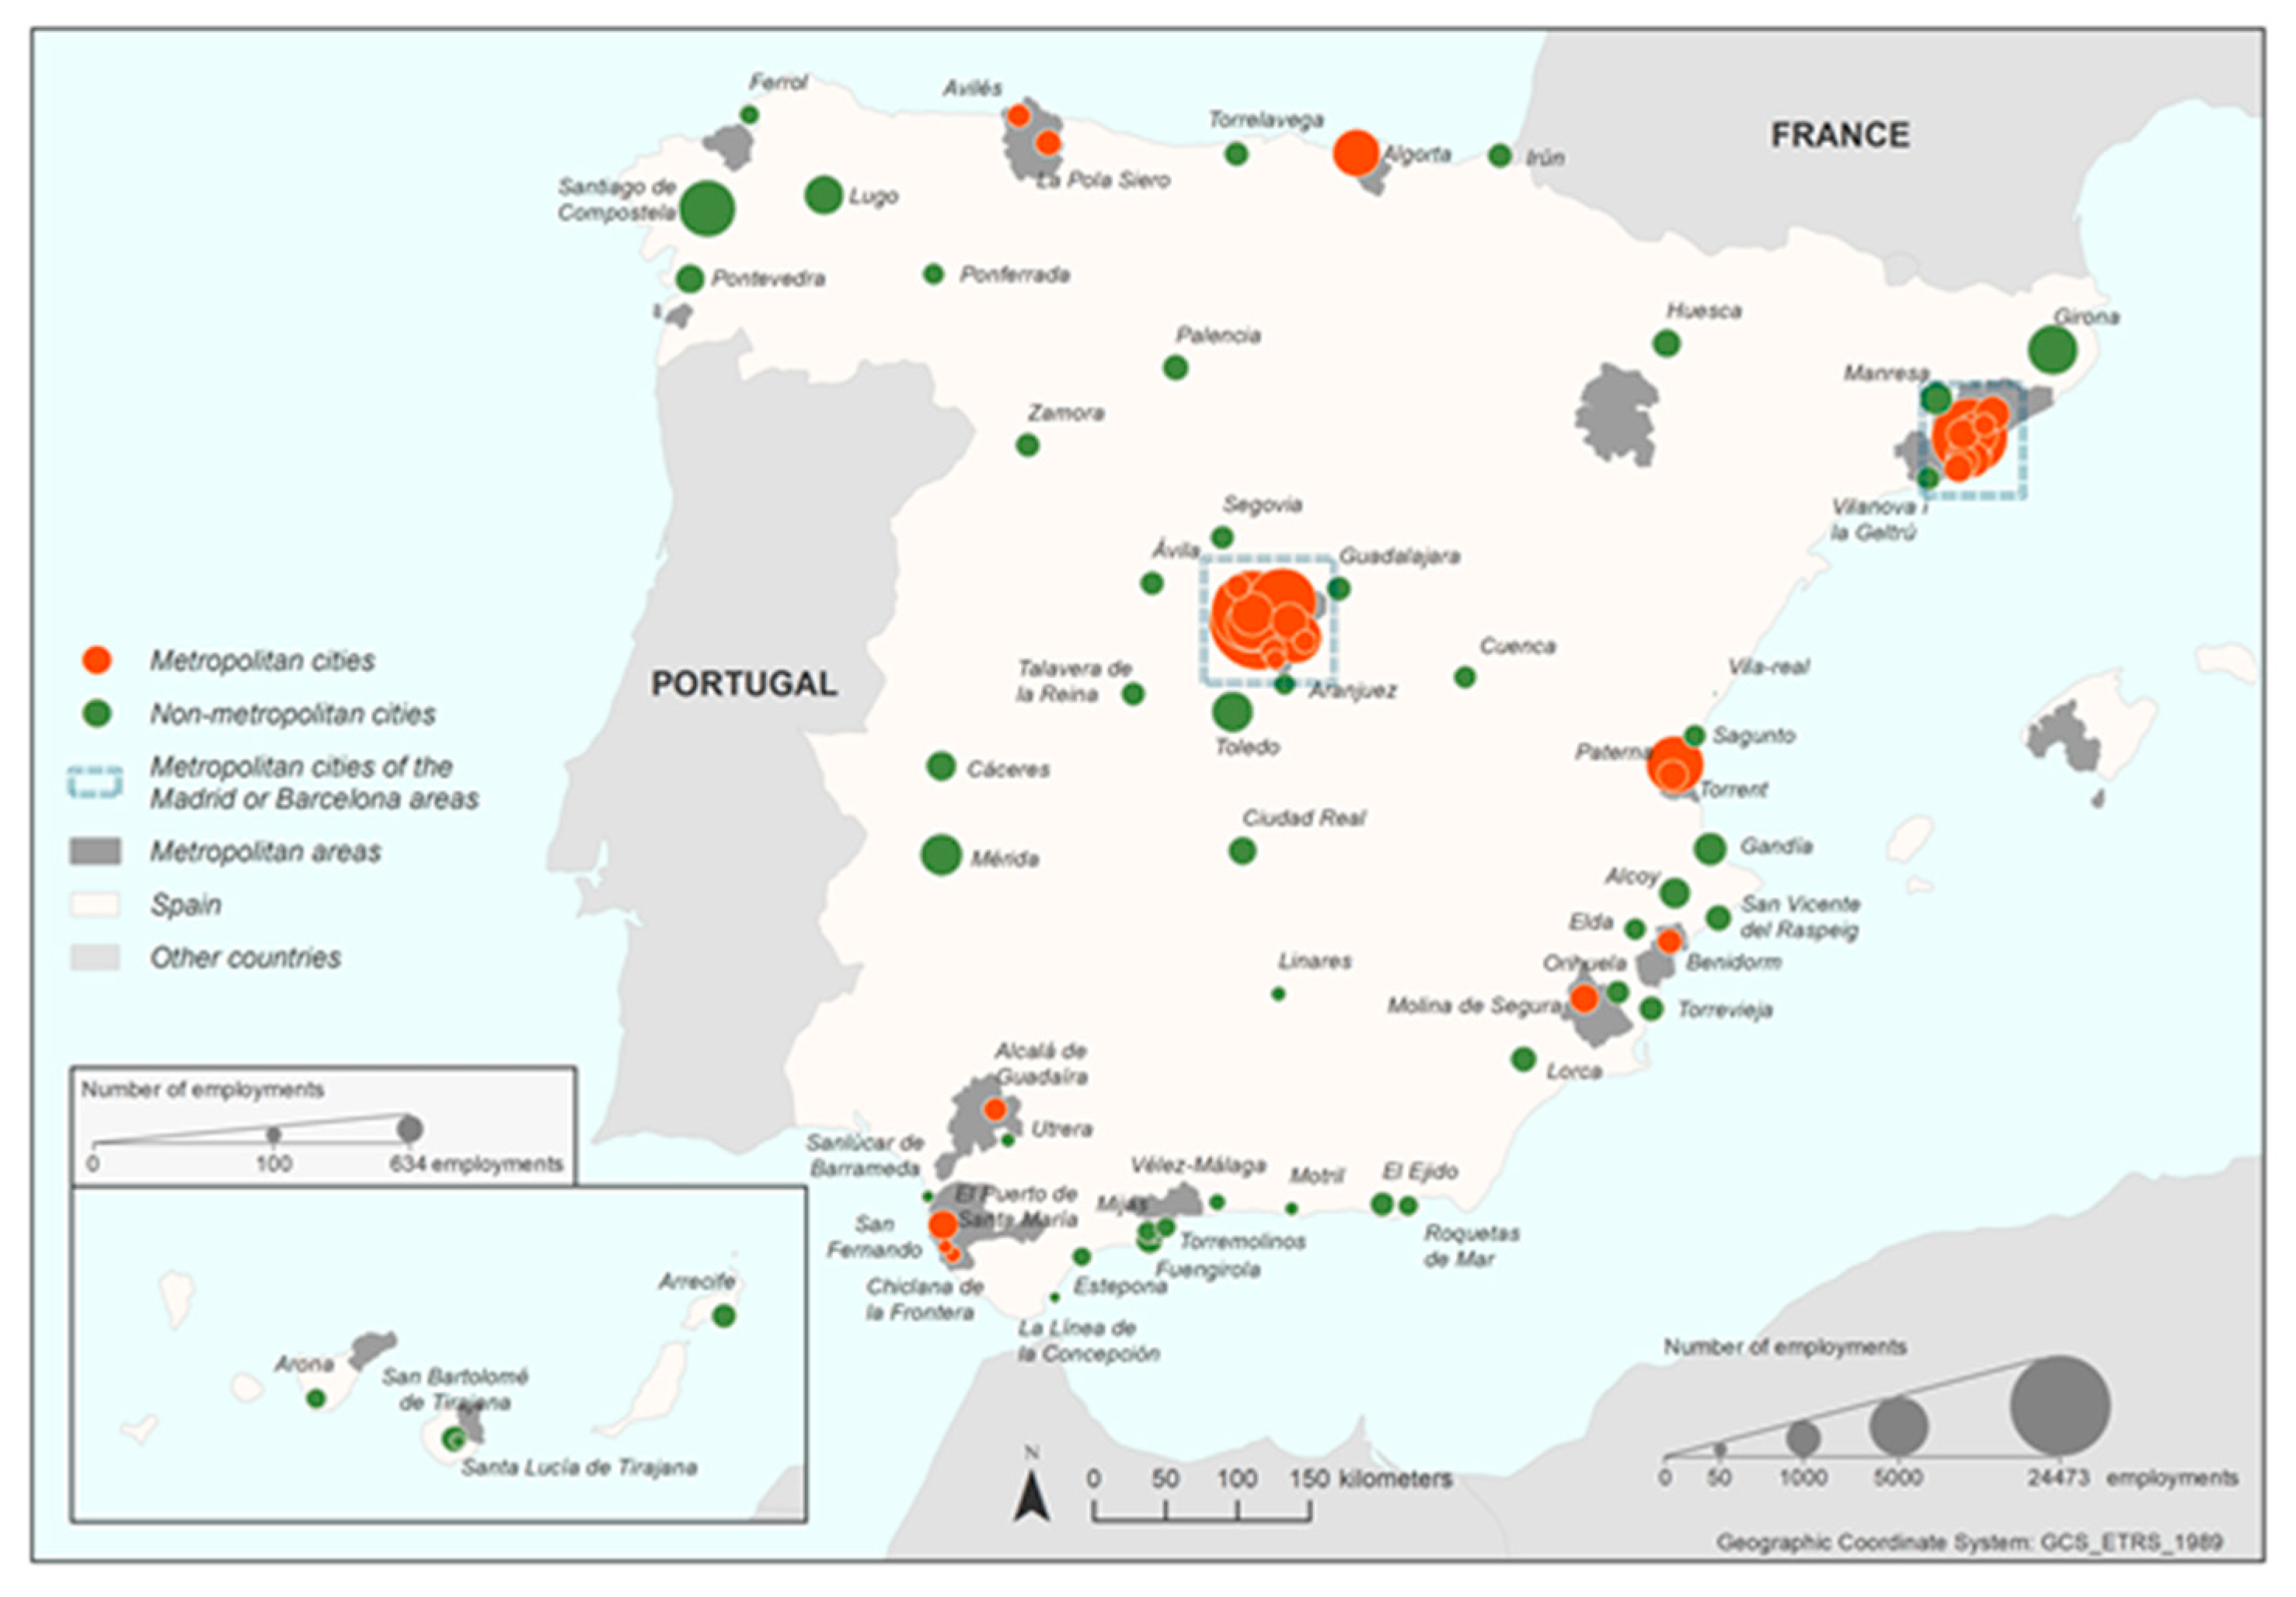
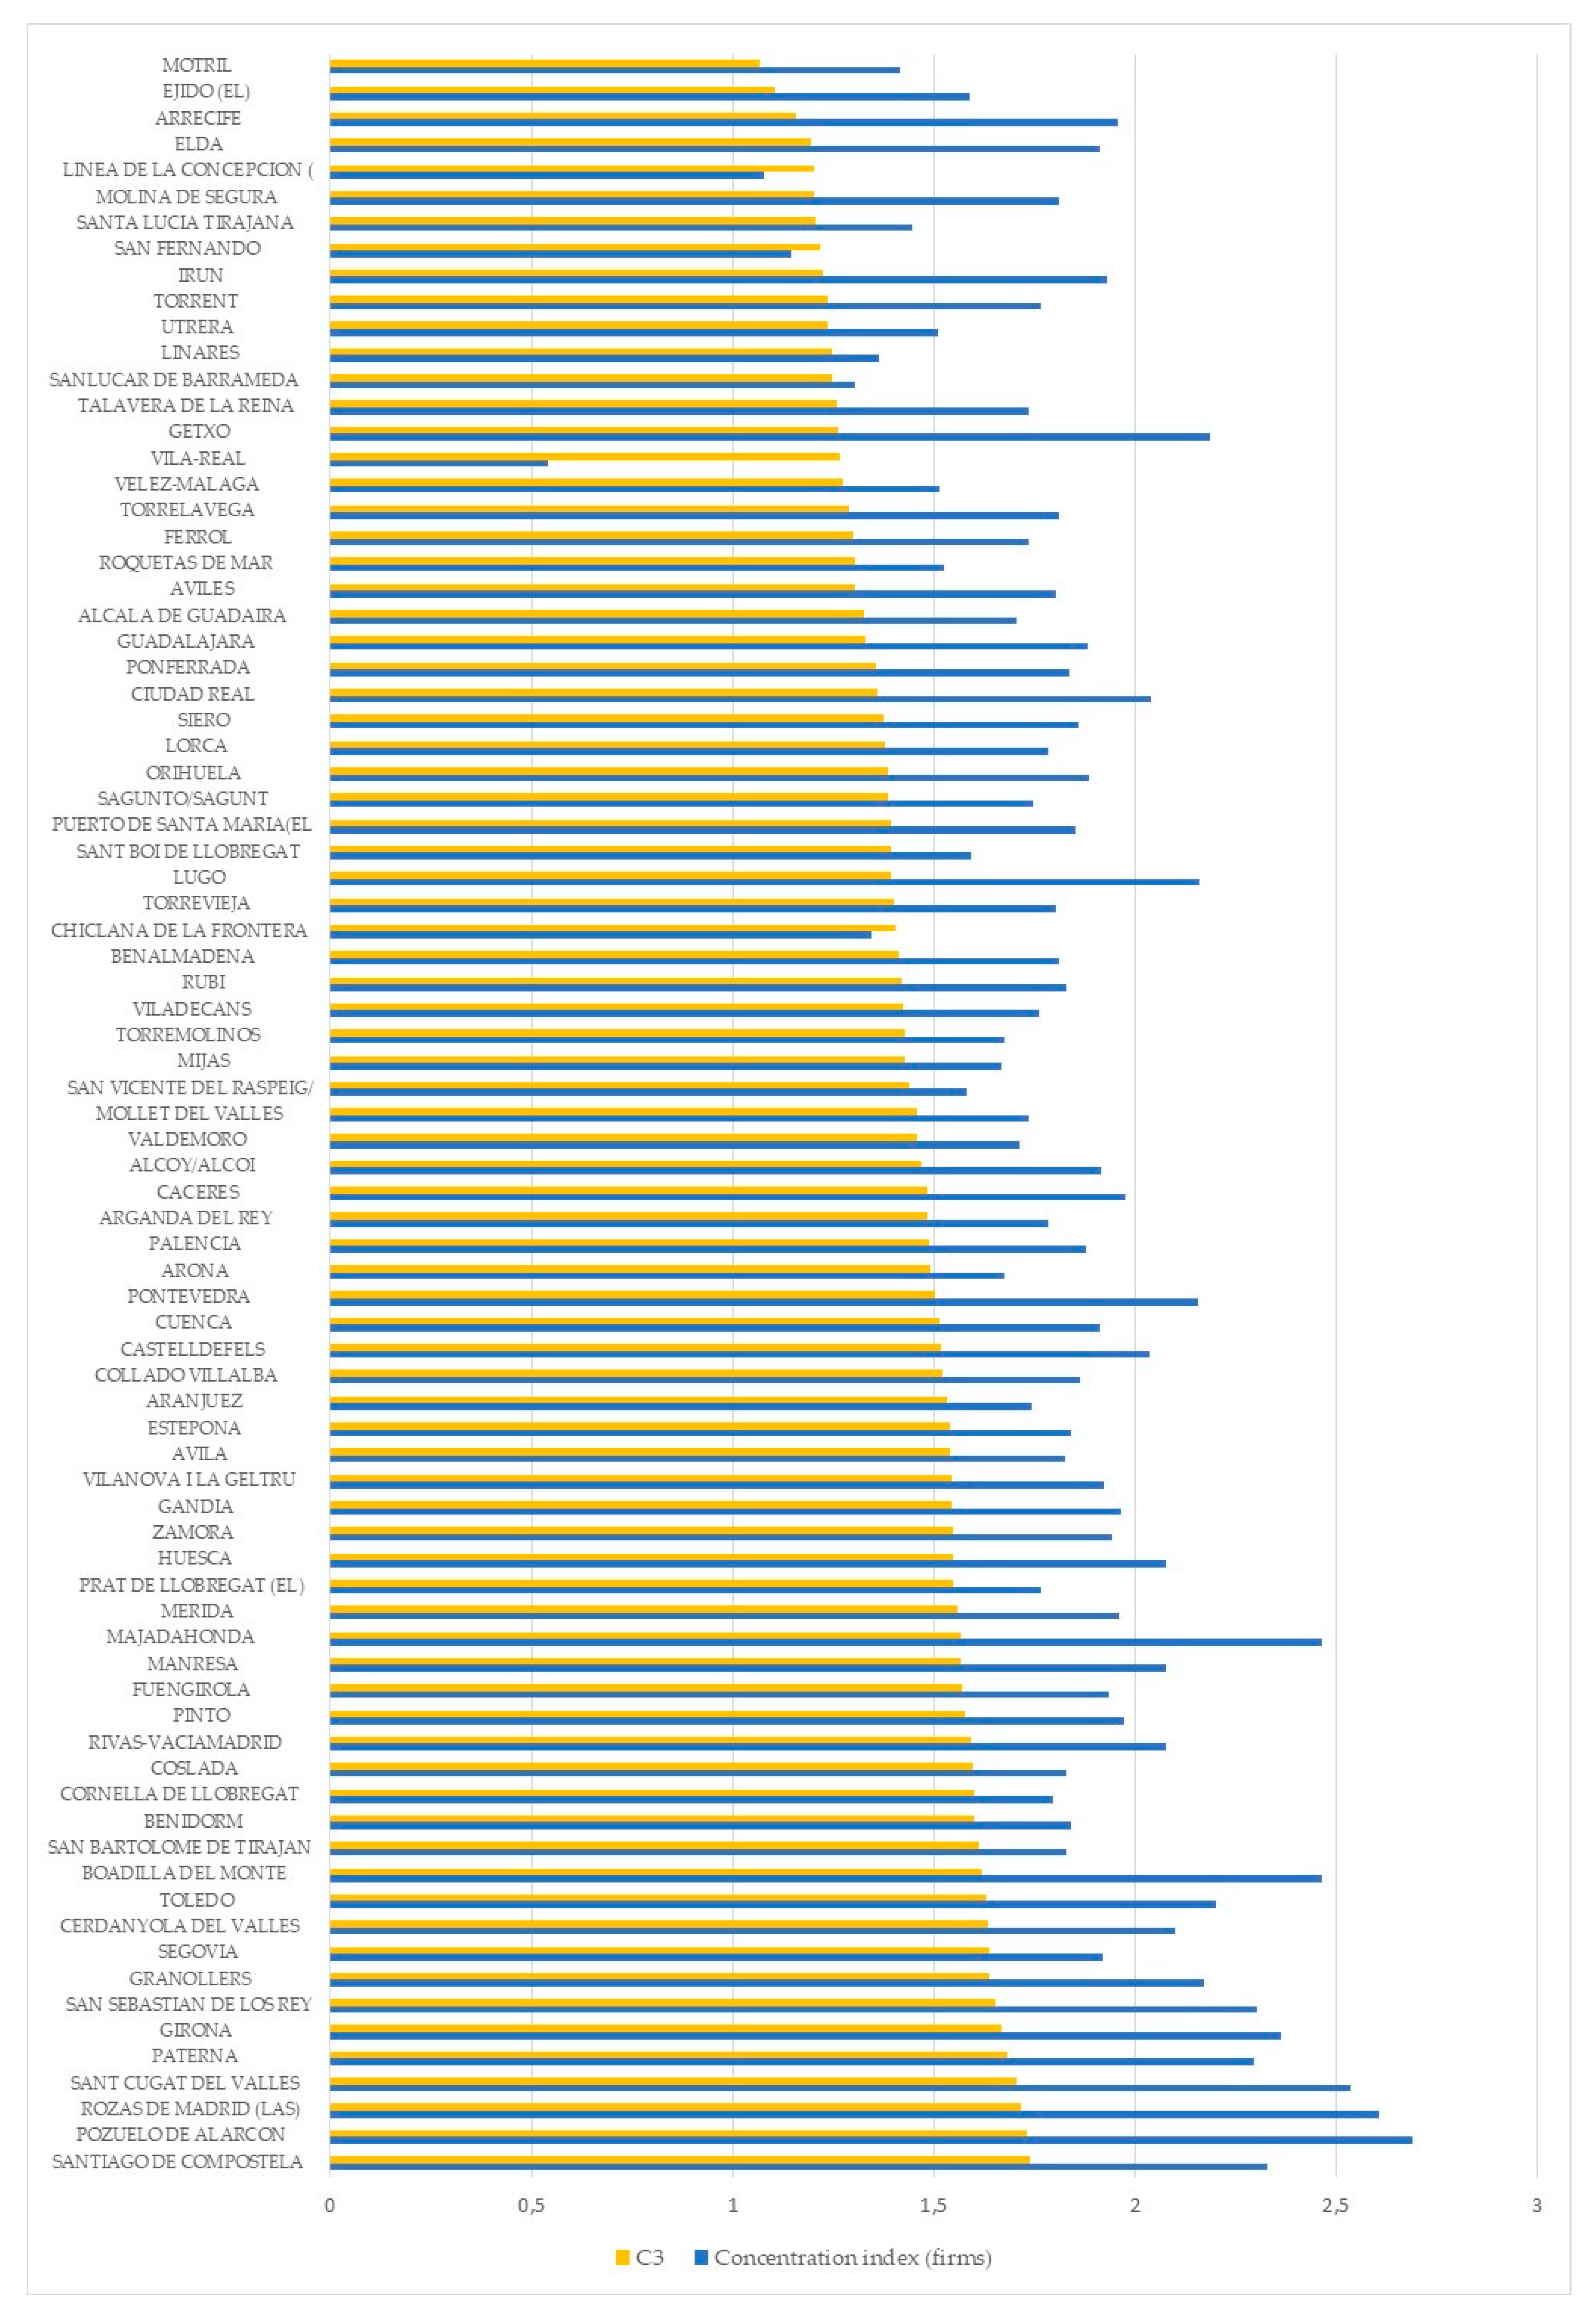
Publisher’s Note: MDPI stays neutral with regard to jurisdictional claims in published maps and institutional affiliations. |
© 2021 by the authors. Licensee MDPI, Basel, Switzerland. This article is an open access article distributed under the terms and conditions of the Creative Commons Attribution (CC BY) license (https://creativecommons.org/licenses/by/4.0/).