Article

Soil and Water Management Practices as a Strategy to Cope with Climate Change Effects in Smallholder Potato Production in the Eastern Highlands of Ethiopia

1
Department of Horticulture, College of Agriculture, Wolaita Sodo University, Wolaita Sodo 138, Ethiopia
2
Africa Centre of Excellence for Climate Smart Agriculture and Biodiversity Conservation, Haramaya University, Dire Dawa 138, Ethiopia
3
College of Agriculture and Environmental Sciences, Haramaya University, Dire Dawa 138, Ethiopia
4
Department of Crop Production, Faculty of Agriculture, University of Eswatini, P.O.Luyengo, Kwaluseni M201, Eswatini
*
Author to whom correspondence should be addressed.
Sustainability 2021, 13(11), 6420; https://doi.org/10.3390/su13116420
Submission received: 28 April 2021 / Revised: 31 May 2021 / Accepted: 2 June 2021 / Published: 4 June 2021
(This article belongs to the Special Issue Adaptation Strategies for Climate Change)

Abstract

:
Low soil fertility and climate change-induced low soil moisture are major problems constraining potato (Solanum tuberosum L.) production in the eastern highlands of Ethiopia. Climate events are projected to become more pervasive. Therefore, research was conducted with the objective of analyzing smallholder potato farmers’ adaptation strategies to cope with the issues of low soil fertility and low soil moisture that are exacerbated by climate change. The research involved surveying eight purposively selected peasant associations in four major potato-producing districts in east and west Hararghe zones. The survey employed a multistage sampling procedure. Data were collected from 357 households using a standard questionnaire, focus group discussions, and key informant interviews. The data were analyzed using descriptive statistics, index ranking, and analysis of variance for survey data. The observed climate data for the period of 1988 to 2017 were analyzed. The Mann-Kendall trend test, standard anomaly index, precipitation concentration index, and coefficient of variation were used to analyze the observed climate data. The survey results revealed the farmers, on average, applied 159 kg urea, 165 kg NPS (63 kg P2O5, 31 kg N and 12 kg S), and 1.8 ton of farmyard manure per hectare for producing potatoes. Most smallholder farmers (68.91%) used supplemental irrigation for potato production during the main growing season. The method of irrigation the farmers used was overwhelmingly the furrow method (92.72%). Analyzing the climate data showed that the mean annual temperature increased whereas the mean annual rainfall decreased during the 30-year period. It was concluded that climate change is markedly affecting potato production; in response to this, most of the farmers used supplemental irrigation to cope with moisture stress, all of them applied mineral fertilizers, and some of them additionally applied organic fertilizer to alleviate the problems of soil degradation and nutrient depletion. This implies that soil moisture and nutrient stresses are the major problems constraining potato production against which the farmers need policy and institutional supports to consolidate their coping strategies and build resilience against climate change.

1. Introduction

The potato (Solanum tuberosum L.) is an important food security crop and a major source of household income for smallholder farmers in the eastern highlands of Ethiopia [1,2]. The crop contributes to the growth of the national economy and to the incomes of millions of smallholder farmers in the country [3,4]. It is the main source of calories and accounts for about 60% of the total vegetable crops cultivated in the eastern highlands of Ethiopia [5]. Despite its importance for household food security and income generation in Ethiopia, the national average yield of the crop is only about 14.17 ton ha−1 [6], which is far less than the world’s average of 20.1 ton ha−1 [7]. The major causes of reduced national productivity of potato in Ethiopia are several biological and environmental stress factors, among which low soil fertility and drought are the most significant ones [8,9,10].
The global average temperature has increased by 1 °C compared with the pre-industrial period and is projected to further increase by 1.5 °C between 2030 and 2050 if it continues to increase at the current rate [11]. Climate change is presenting an additional challenge to potato production globally, and the challenge is exacerbated in tropical and subtropical regions wherein resource-poor farmers lack the necessary means to adapt to its impact [12,13,14]. The impact of climate change has already manifested in the eastern highlands of Ethiopia through recurrent droughts and erratic rainfall in the region, which are expected to increase in frequency [15]. Increases in soil temperature enhance the rates of organic matter decomposition which, in turn, reduces soil organic carbon and increases the release of carbon dioxide into the atmosphere [16,17]. Additionally, low soil moisture content reduces microbial activity in the soil and hence the decomposition of organic matter decreases [18,19]. Therefore, low soil fertility and low soil moisture are the major problems constraining potato production in the region [8]. The potato is particularly susceptible to low soil fertility and low soil moisture due to its shallow and coarse root system, of which about 85% is concentrated in the upper 0.3 m of the soil profile, requiring proper soil and water management practices [20,21].
To reduce the vulnerability of the potato to low soil fertility and moisture stress, there is a need to use climate-smart approaches in managing the impact of the changing climate. Therefore, it is important to first analyze how farmers manage soil fertility and irrigation water at the local level to cope with the impacts of climate change. Previous studies revealed that farmers used various soil fertility management practices to cope with the impact of low soil fertility. For example, ref. [22] reported that farmers used diammonium phosphate, urea, and manure to maintain soil fertility in the Haramaya and Kombolcha districts in the eastern highlands of Ethiopia. Ref. [23] also analyzed nutrient management practices of onion in the Central Rift Valley region of Ethiopia and reported that 98% of the respondents (farmers) applied urea and diammonium phosphate (DAP) fertilizers. Similarly, ref. [24] analyzed soil fertility and irrigation water management practices for vegetable production in Kumasi, Ghana, and reported that farmers used conservation tillage, crop rotation, bio-fertilizer, and poultry manure to cope with low soil fertility. Additionally, ref. [25] analyzed soil fertility management among smallholder farmers in Mount Kenya, East region, and reported that farmers used farmyard manure, mineral fertilizers, and agroforestry to cope with low soil fertility.
Similarly, previous studies showed that farmers used various irrigation water management practices to cope with the impact of climate change-induced moisture stress. For example, ref. [26] analyzed irrigation water management practices in the Gumselassa irrigation scheme, northern Ethiopia, and reported that farmers harvested drainage water and rainwater to cope with climate change-induced moisture stress in crop production. Similarly, ref. [27] analyzed irrigation water management practices in smallholder vegetable production in the Central Rift Valley region of Ethiopia and reported that 90.9% of the respondents determined the sufficiency of irrigation water applied when the water level reached the furrow basin head. Furthermore, ref. [28] analyzed smallholder farmers’ agricultural drought adaptation technologies in south-western, central, and mid-western regions of Uganda and reported that farmers used drip irrigation at night timing to reduce the effect of evapotranspiration and wind speed. Likewise, ref. [29] analyzed smallholder farmers perception of climate change and adaptation strategies in South Africa’s Western Cape and reported that farmers used drought-tolerant crop varieties and drip irrigation to cope with climate change-induced low soil moisture in crop production.
Despite the considerable number of studies that have been conducted on various soil fertility and irrigation water management practices to cope with climate change-induced low soil fertility and moisture stress, a limited number of studies have been conducted so far in Ethiopia. Most of the existing studies did analyze the effect of climate change and farmers’ coping strategies. Smallholder farmers’ adaptation strategies that farmers use to cope with the impact of climate change depend on the accessibility and affordability of a particular adaptation technology. However, there is no documented research study aimed at investigating smallholder potato farmers’ soil fertility and irrigation water management practices as a strategy to cope with climate change-induced low soil fertility and low soil moisture in the eastern highlands of Ethiopia. This implies that there is a need to study smallholder potato farmers’ adaptation strategies used to cope with low soil fertility and low soil moisture at the local level, including observed weather trends, identifying factors affecting soil fertility, and irrigation water management practices. Therefore, it was hypothesized that smallholder potato farmers amended soil fertility in various ways and used various irrigation water management practices to cope with climate change-induced low soil fertility and low soil moisture and increase potato yields.
The results of the study provided baseline information for formulating appropriate adaptation strategies to climate change-induced low soil fertility and low soil moisture and policy measures in the study districts. Additionally, the results could play an important role in further research to provide better climate change coping strategies for smallholder potato farmers. The results of the study could also provide strategic directions for agriculture policymakers to support and strengthen the adaptive capacity and livelihoods of smallholder potato farmers in the face of climate change. Therefore, the objectives of this study were to: (1) analyze smallholder potato farmers’ adaptation strategies to climate change-induced low soil fertility and low soil moisture; (2) analyze rainfall and temperature trends and variability in selected potato growing districts in the eastern highlands of Ethiopia.

2. Materials and Methods

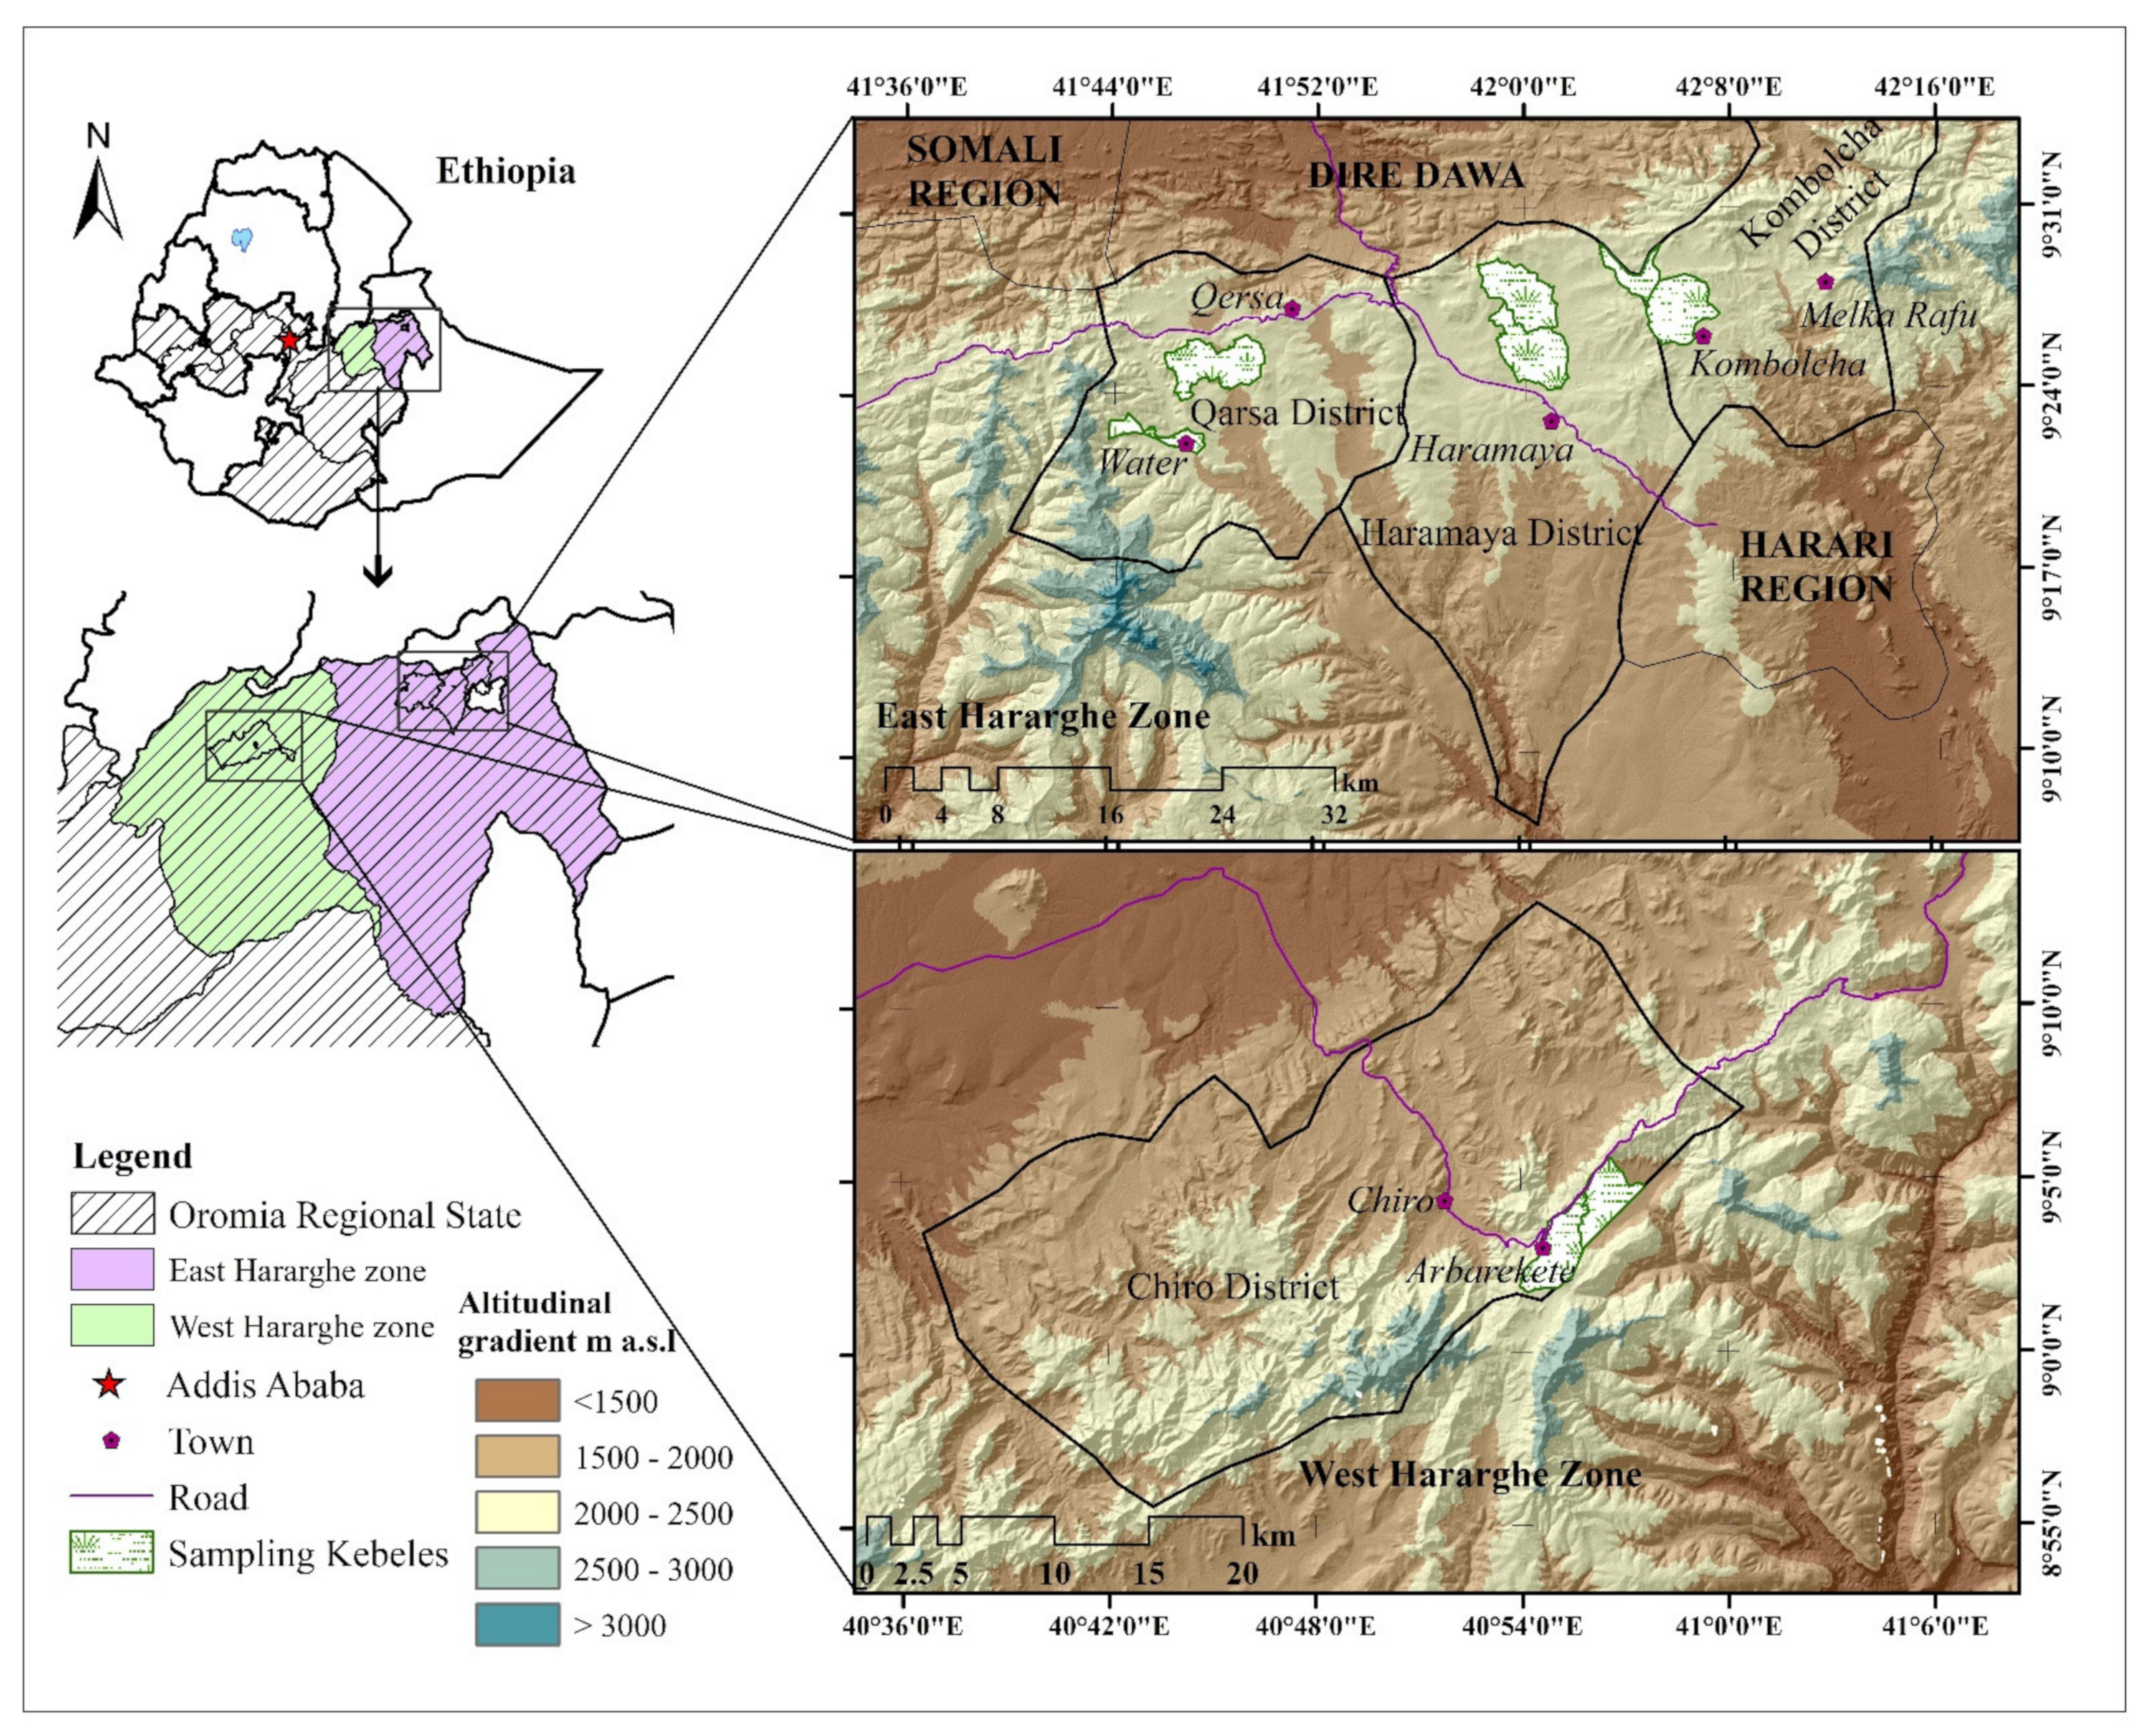
2.1. Description of the Study Areas

The study was conducted in the eastern highlands of Ethiopia, which is located in the East and West Hararghe Zone in the Oromia Regional State between 8°50′–9°30′ N latitude and 40°38′–42°20′ E longitude (Figure 1). The altitude of the study areas ranges between 1400 to 2460 m above sea level. Four districts were selected purposively for the study. The annual rainfall in the study area ranges from 743 mm to 816 mm. The mean maximum temperatures in the study areas range from 20 °C to 25 °C whereas the mean minimum temperatures range from 10 °C to 15 °C (Table 1). Three districts, namely, Haramaya, Kombolcha, and Qarsa were selected from the East Hararghe Zone, and one district, namely, Chiro was selected from the West Hararghe Zone. The study areas experience a bimodal rainfall distribution pattern. The small rainy season occurs from February to May (belg), whereas the main rainy season occurs from June to September (kiremt). The farming system is mixed crop-livestock production. The major crops produced include sorghum, maize, pulses, wheat, oilseed, vegetables, fruits, and cash crops such as coffee (Coffee arabica L.) and khat (Catha edulis Forsk). The components of the livestock system are cattle, donkeys, goats, sheep, and poultry [1]. The major soil types of the study districts include Leptosols, Cambisols, Luvisols, Fluvisols, Vertisols, Nitisols, and Regosols [30].

2.2. Source of Data and Sampling Design

Both primary and secondary data were collected. The primary data were obtained from interviewing households using structured and pre-tested questionnaires. The data were obtained from zonal agriculture offices, district agriculture offices, development agents, field visits, and group discussions. Secondary data were collected from the National Meteorological Service Agency (NMSA) of Ethiopia, relevant records and reports of zonal agricultural offices, district agricultural offices, and other literature.
Multi-stage sampling techniques were employed to select the final sample units. Initially, four districts, three from the East Hararghe Zone and one from the West Hararghe Zone, were selected purposively based on their potato production potential under irrigation and rain-fed systems. These districts were Haramaya, Qarsa, and Kombolcha from the East Hararghe Zone, and Chiro from the West Hararghe Zone. In the second stage, a total of eight peasant associations (two peasant associations from each district) were purposively chosen. A peasant association (PAs) is the smallest administrative unit of the farming community in Ethiopia, which is also termed as Kebele. In the districts on which the whole farmhouse holds were producing potato under rain-fed and irrigation systems, the PAs were selected randomly. In the third stage, a sample size of eight PAs was determined as per the procedure described by [31].
n = N 1 + N e 2
where n = sample size (total number of households interviewed); N = total number of households producing potato under rain-fed and irrigation systems in eight PAs (3324); e = level of precision (0.05). Thus, the survey drew a total of about 357 in terms of sample size.
The sample size of each PAs was determined as (A/B) × C using the method developed by [32]. Where, A = total number of households producing potato under rain-fed and irrigation systems in each PAs (Table 2); B = total number of households producing potato under rain-fed and irrigation systems in eight PAs (3324); C = sample size of the study area (357).

2.3. Method of Data Collection

Daily rainfall and temperature data over 30 years (1988−2017) for each study districts were obtained from the National Meteorological Service Agency (NMSA) of Ethiopia. Data were carefully inspected for quality and completeness. According to [33], a minimum of 30-year data are required for searching evidence for climate change. Primary data were collected from February to June 2019. Structured questionnaires were used for the field interviews. Only household heads were interviewed. The questionnaire was pre-tested on five to ten selected respondents from each PA before conducting the survey.
Based on the feedback obtained from the pre-test, the questionnaire was amended and translated into the local Oromo language to accommodate the respondents. The data were collected by eight development agents hired as enumerators from the Agricultural Development Office with the assistance of agricultural experts working in the districts. Moreover, qualitative data were collected using focus group discussions and key informant interviews. These techniques helped to acquire useful and detailed information, which was difficult to collect through the questionnaire survey alone. The primary data focused on households’ demographic and resource characteristics, production experiences, fertilizer management practices (constraints in the application of organic and inorganic fertilizers), and irrigation water management practices (constraints of using irrigation water for potato production). The data also included general soil fertility and irrigation water management practices on potato production as supplementary information.

2.4. Survey Data Analysis

Data were analyzed using descriptive statistics, namely the mean, frequency distribution, and percentages using SPSS (Version 20) package software. Depending on the nature of the data, ANOVA was employed to compare quantitative dependent variables among the districts. Indices were calculated to provide an overall ranking of a particular character according to the formula described by [34]
Index   = 6 × No   of   HHR   1 st   + 5 × No   of   HHR   2 nd   + 1 × No   of   HHR   6 th   for   X   6 × No   of   HHR   1 st   + 5 × No   of   HHR   2 nd   + 1 × No   of   HHR   6 th   for   Y
where: No of HHR = the number of household head ranked; X = for each constraint; Y = for all constraints.

2.5. Climate Data Analysis

2.5.1. Analyzing Rainfall and Temperature Trends

In this study, the Mann-Kendall trend test was employed. The Mann-Kendall trend test is a non-parametric method which is less sensitive to outliers and tests for a trend in time series without specifying whether the trend is linear or non-linear [35].
The Mann-Kendall’s test statistic is given as:
S = i = 1 N 1 j = i + 1 N s g n ( x j x i )
where S is the Mann-Kendal’s test statistics; x i and x j are the sequential data values of the time series in the years i and j (j > i) and N is the length of the time series. A positive S value indicates an increasing trend and a negative value indicates a decreasing trend in the data series.
The sign function is given as:
s g n ( x j x i ) = + 1   i f   x j x i > 0 0   i f   x j x i = 0 1   i f   x j x i < 0
The variance of S, for the situation where there may be ties (i.e., equal values) in the x values, is given by
V a r S = 1 18 N N 1 2 N + 5 i = 1 m t i t i 1 2 t i + 5
where m is the number of tied groups in the data set and t i is the number of data points in the i t h tied group. For n larger than 10, Z M K approximates the standard normal distribution [35] computed as:
Z MK = S 1 V a r   S   i f   S > 0 0   i f   S = 0 S + 1 V a r   S   i f   S < 0
The presence of a statistically significant trend was evaluated using the Z M K value. In a two-sided test for trend, the null hypothesis Ho should be accepted if Z M K < Z 1 α 2   at a given level of significance. Z 1 α   2   is the critical value of Z M K from the standard normal table, e.g., for the 5% significance level, the value of Z 1 α   2 is 1.96.
The Sen’s estimator of slope test was applied in cases where the trend was assumed to be linear, depicting the quantification of changes per unit time. The slope (change per unit time) was estimated following the procedure of [36].
Q i = Median   X j X i j i j > i
where Q i is Sen’s slope estimator, x j and x i data value at time j and i, (j > i), respectively. The positive slope Q i obtained indicates an increasing trend whereas the negative slope Q i obtained indicates a decreasing trend. However, if Q i obtained showed zero it indicates no trend.

2.5.2. Rainfall Variability

The standardized anomaly index, rainfall/precipitation concentration index, and coefficient of variation were used as descriptors of rainfall variability. The standardized anomaly index (SAI) was calculated and graphically presented to evaluate inter-annual fluctuations in rainfall in the study areas throughout the period of observation. It was used to examine the frequency and severity of drought events and analyzed with the formula described by [37].
S A I = P t P m δ
where, SAI is a standardized rainfall anomaly; Pt = annual rainfall in year t; Pm = long-term mean annual rainfall throughout the period of observation and δ = standard deviation of annual rainfall throughout the period of observation. Positive normalized rainfall anomalies indicated greater than long-term mean rainfall, while negative anomalies indicating less than the mean rainfall. The precipitation concentration index (PCI) was used for characterizing the monthly rainfall distribution and analyzed with the formula described by [38] as:
P C I = 100   x i = 1 12 P 2 i / ( i = 1 12 P i ) 2
where, P i   is the rainfall amount of the i t h month. According to [39], PCI values of less than 10 indicate uniform monthly distribution of rainfall; values between 11 and 20 indicate high concentration, and values above 21 indicate very high concentration. The coefficient of variation (CV) was calculated to evaluate the variability of the rainfall and its characteristics by dividing the standard deviation of the event with its mean. According to [40], CV values less than 20 indicate less, values between 20 and 30 indicate moderate (20 < CV < 30), and values greater than 30 indicate high (CV > 30).

3. Results and Discussion

3.1. Commonly Grown Potato Cultivars

Among the varieties grown in the districts, the improved varieties Gudane (24.1%) and Bubu (21.3%) as well as the farmers’ (local) cultivar Jarso (17.6%) were the major ones (Figure 2). The Gudane variety and Jarso cultivar were early maturing compared with the Bubu variety [41]. The Bubu and Gudane varieties had comparable average tuber yields. However, the Bubu variety was more resistant to the late blight disease than Gudane variety, but the Jarso cultivar was very susceptible to the disease [42]. From the focus group discussion held and key informant interviews conducted with the farmers, it was learned that high yield, disease resistance, drought tolerance, and early maturity were the major criteria the farmers use to select potato varieties for cultivation.
In this connection, the respondents expressed strong interest in acquiring drought-tolerant potato varieties. This is related to the scarcity of sources of irrigation water and erratic rainfall. Analyses of the observed climate data in all study districts exhibited an increasing trend for mean temperature and a decreasing trend for annual rainfall (Table 3). The increasing trend in mean temperature was significant (p < 0.05) for the Haramaya and Kombolcha districts. Additionally, the standard anomaly index revealed that the number of years that had records of rainfall below the long-term average at Haramaya, Qarsa, Kombolcha and Chiro were 50%, 53%, 53%, and 40%, respectively (Figure 3). Moreover, the data showed that the frequency of decreasing rainfall trends increased in the last decade. In this regard, 50–70% of the years in the last decade had records of annual rainfall below the long-term average in all study districts (Figure 3). This finding suggested the need for drought-tolerant potato varieties and appropriate agronomic practices to mitigate the impact of drought in the districts. This suggestion is corroborated by the observed climate data trends.

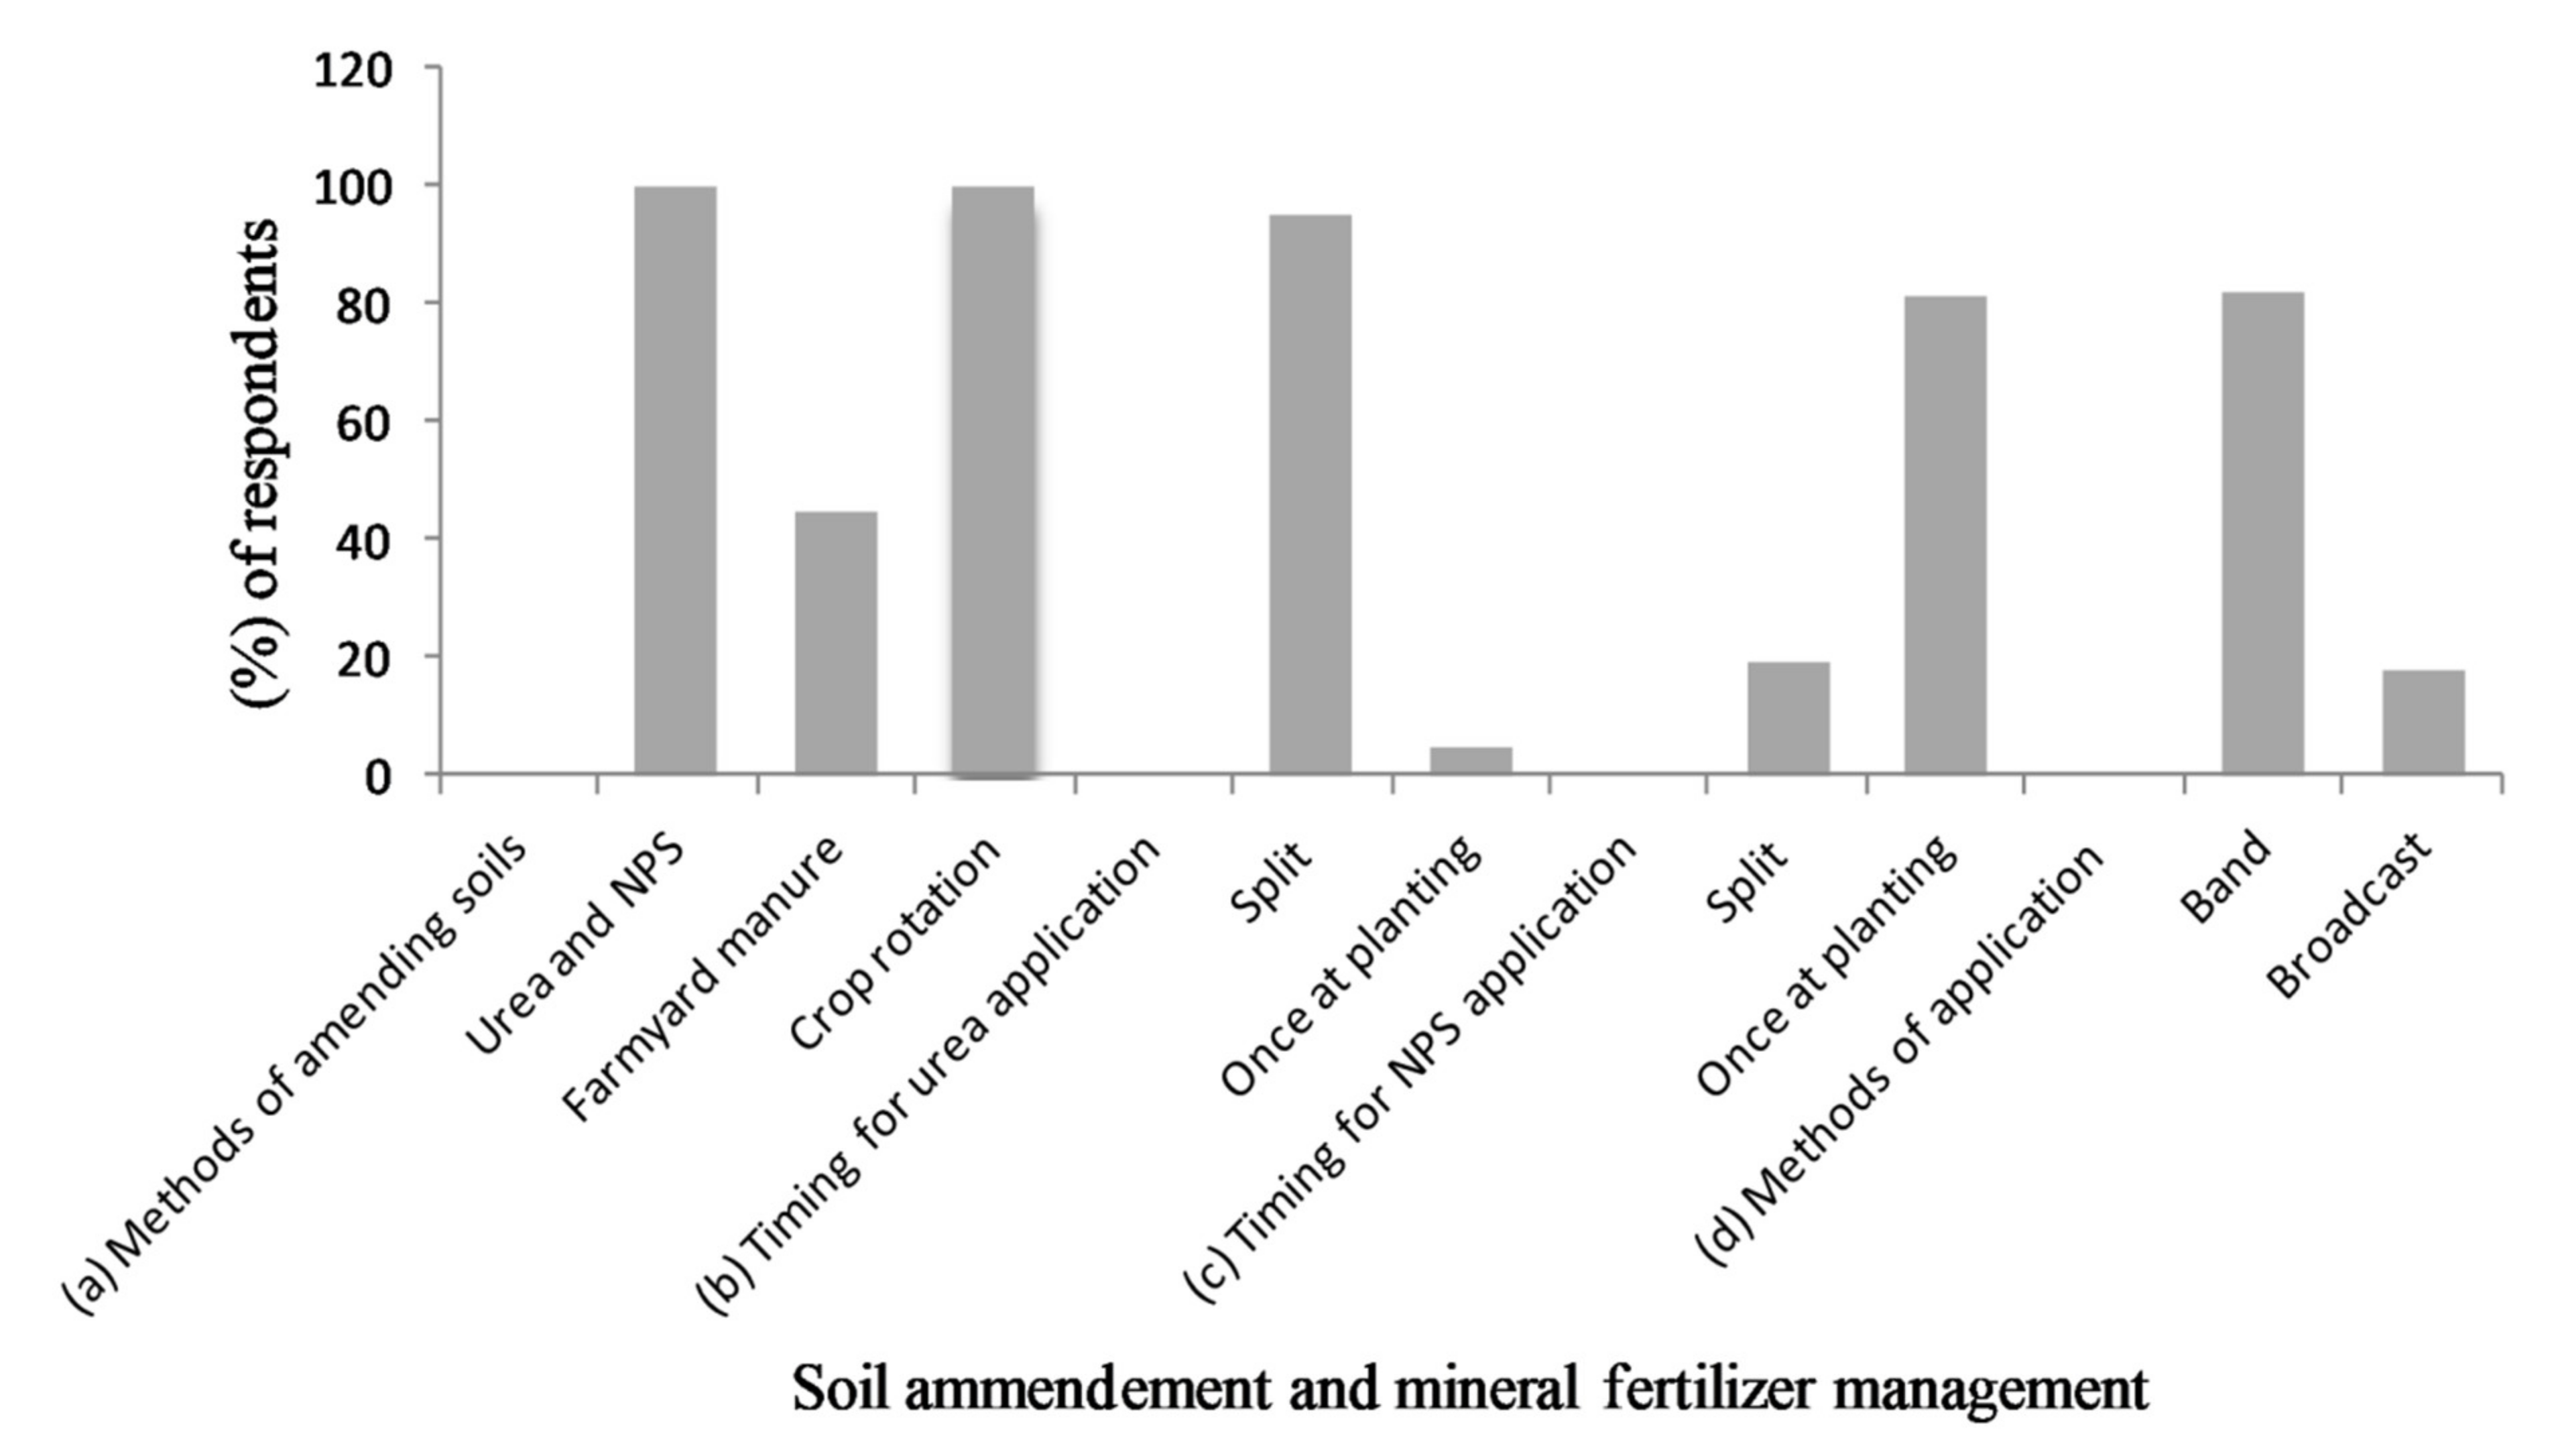
3.2. Maintaining Soil Fertility

The methods used for managing soil fertility in potato production in the study areas included the application of mineral fertilizers, namely urea [Co(NH2)2] 46% N, NPS (19% N, 38% P2O5, 7% S) and farmyard manure as well as practicing crop rotation. The results of the survey revealed that all household respondents (100%) used mineral fertilizer and crop rotation while 44.8% of them additionally used farmyard manure to produce potatoes (Figure 4). The use of mineral fertilizer by all sampled households and farmyard manure by almost half of the households signified the low-fertility status of soils in the studied areas. This result was consistent with the reports of [22] that stated the application of diammonim phosphate (DAP), urea, and manure were the most common soil amendments practiced by farmers in Haramaya and Kombolcha districts, with only a few of them integrating application of manure with mineral fertilizers. Additionally, [43] indicated that the most common rates of applying mineral fertilizer in Kombolcha district were 100 kg DAP, 100 kg urea per hectare, whereas the most common rate of applying farmyard manure ranged between 1.0 to 1.2 tons per hectare.
In the study areas, the potato is cultivated in the pure stand (100%) in rotation with different cereal and vegetable crops, mainly maize (Zea mays L.), sorghum (Sorghum bicolor (L.) Moench), onions (Allim cepa L.), cabbages (Brassica oleracea L.), beetroots (Beta vulgaris L.), sweet potatoes [Ipomoea batatas (L.) Lam], carrots (Daucus carota L.), lettuce (Lactuca sativa L.), and other annual crops. Crop rotation is practiced to enhance soil organic matter and nutrient availability by incorporating different crop residues. Similarly, [24] reported that farmers used conservation tillage, crop rotation, bio-fertilizer, and poultry manure in vegetable production to cope with low soil fertility in Kumasi, Ghana.

3.3. Fertilizer Management Practices

3.3.1. Amount of NPS and Urea Applied

Households on average applied 159 kg urea ha−1 and 165 kg NPS ha−1, which would amount to 104 kg N, 63 kg P2O5, and 11.6 kg S. The amount ranged from 70–270 kg urea ha−1 and 120–250 kg NPS ha−1, which are about 41 kg ha−1 and 35 kg ha−1 less than the regional blanket recommendation for urea and NPS (200 kg urea and 200 kg NPS ha−1) [44]. Additionally, the analysis of variance showed a non-significant difference in the amounts of urea and blended NPS used among the districts studied (Figure 5). This may be due to the similarity of farmers in terms of socio-economic status. Consistent with this finding, [45] reported that potato-producing farmers in the southern region of Ethiopia often applied fertilizer at rates that were much lower than the blanket regional recommendation rates due to high prices of fertilizers. In contrast to this finding, [23] reported that farmers in the Central Rift Valley region of Ethiopia applied excess rates of nitrogen fertilizer amounting to about 300 kg urea and 300 kg DAP ha−1 for onion production, which was about threefold higher than the recommended rate. This difference may be attributed to variations in soil type and soil fertility as well as the difference in the values of produce obtained from the land, with the tendency of applying more rates of fertilizers for high-value crops that fetch higher market prices.

3.3.2. Timing and Methods of Applying Urea and NPS Fertilizers

Considering the timing of application, most of the farmers (95.2%) applied urea to the potato crop in two splits, one after full emergence of the sprouts of the tubers from the soil and the other one at the start of flowering. The majority (81%) of the respondents applied NPS once at planting while 19% applied it in two splits, one at planting and the other one at the start of flowering (Figure 4). Regarding the method of application, most of the farmers (82.1%) applied urea and NPS in bands near plant roots while 17.9% of them applied it by broadcasting (Figure 4). Farmers applied urea to potatoes by dividing it into two equal rates. This may have reduced nitrogen losses by leaching, denitrification, and enhance nitrogen use efficiency over a one-time application, which is in line with the findings of [46], who reported that applying ammonium nitrate in two splits improved the nitrogen-use efficiency of potato in sandy soils. On the other hand, most of the farmers applied the whole rates of NPS fertilizer during planting by placing it slightly below the seed tubers and urea near plant roots to avoid the burning of sprouts. This is in line with the report of [47], who stated that applying diammonium phosphate (DAP) and urea fertilizers near potato plant roots enhanced phosphorous and nitrogen use efficiency in sandy loam soil. However, a few farmers used mineral fertilizers as a top dressing, which could result in loss of nutrients. The farmers probably practiced this method of application because it saves labour and time compared with banding.

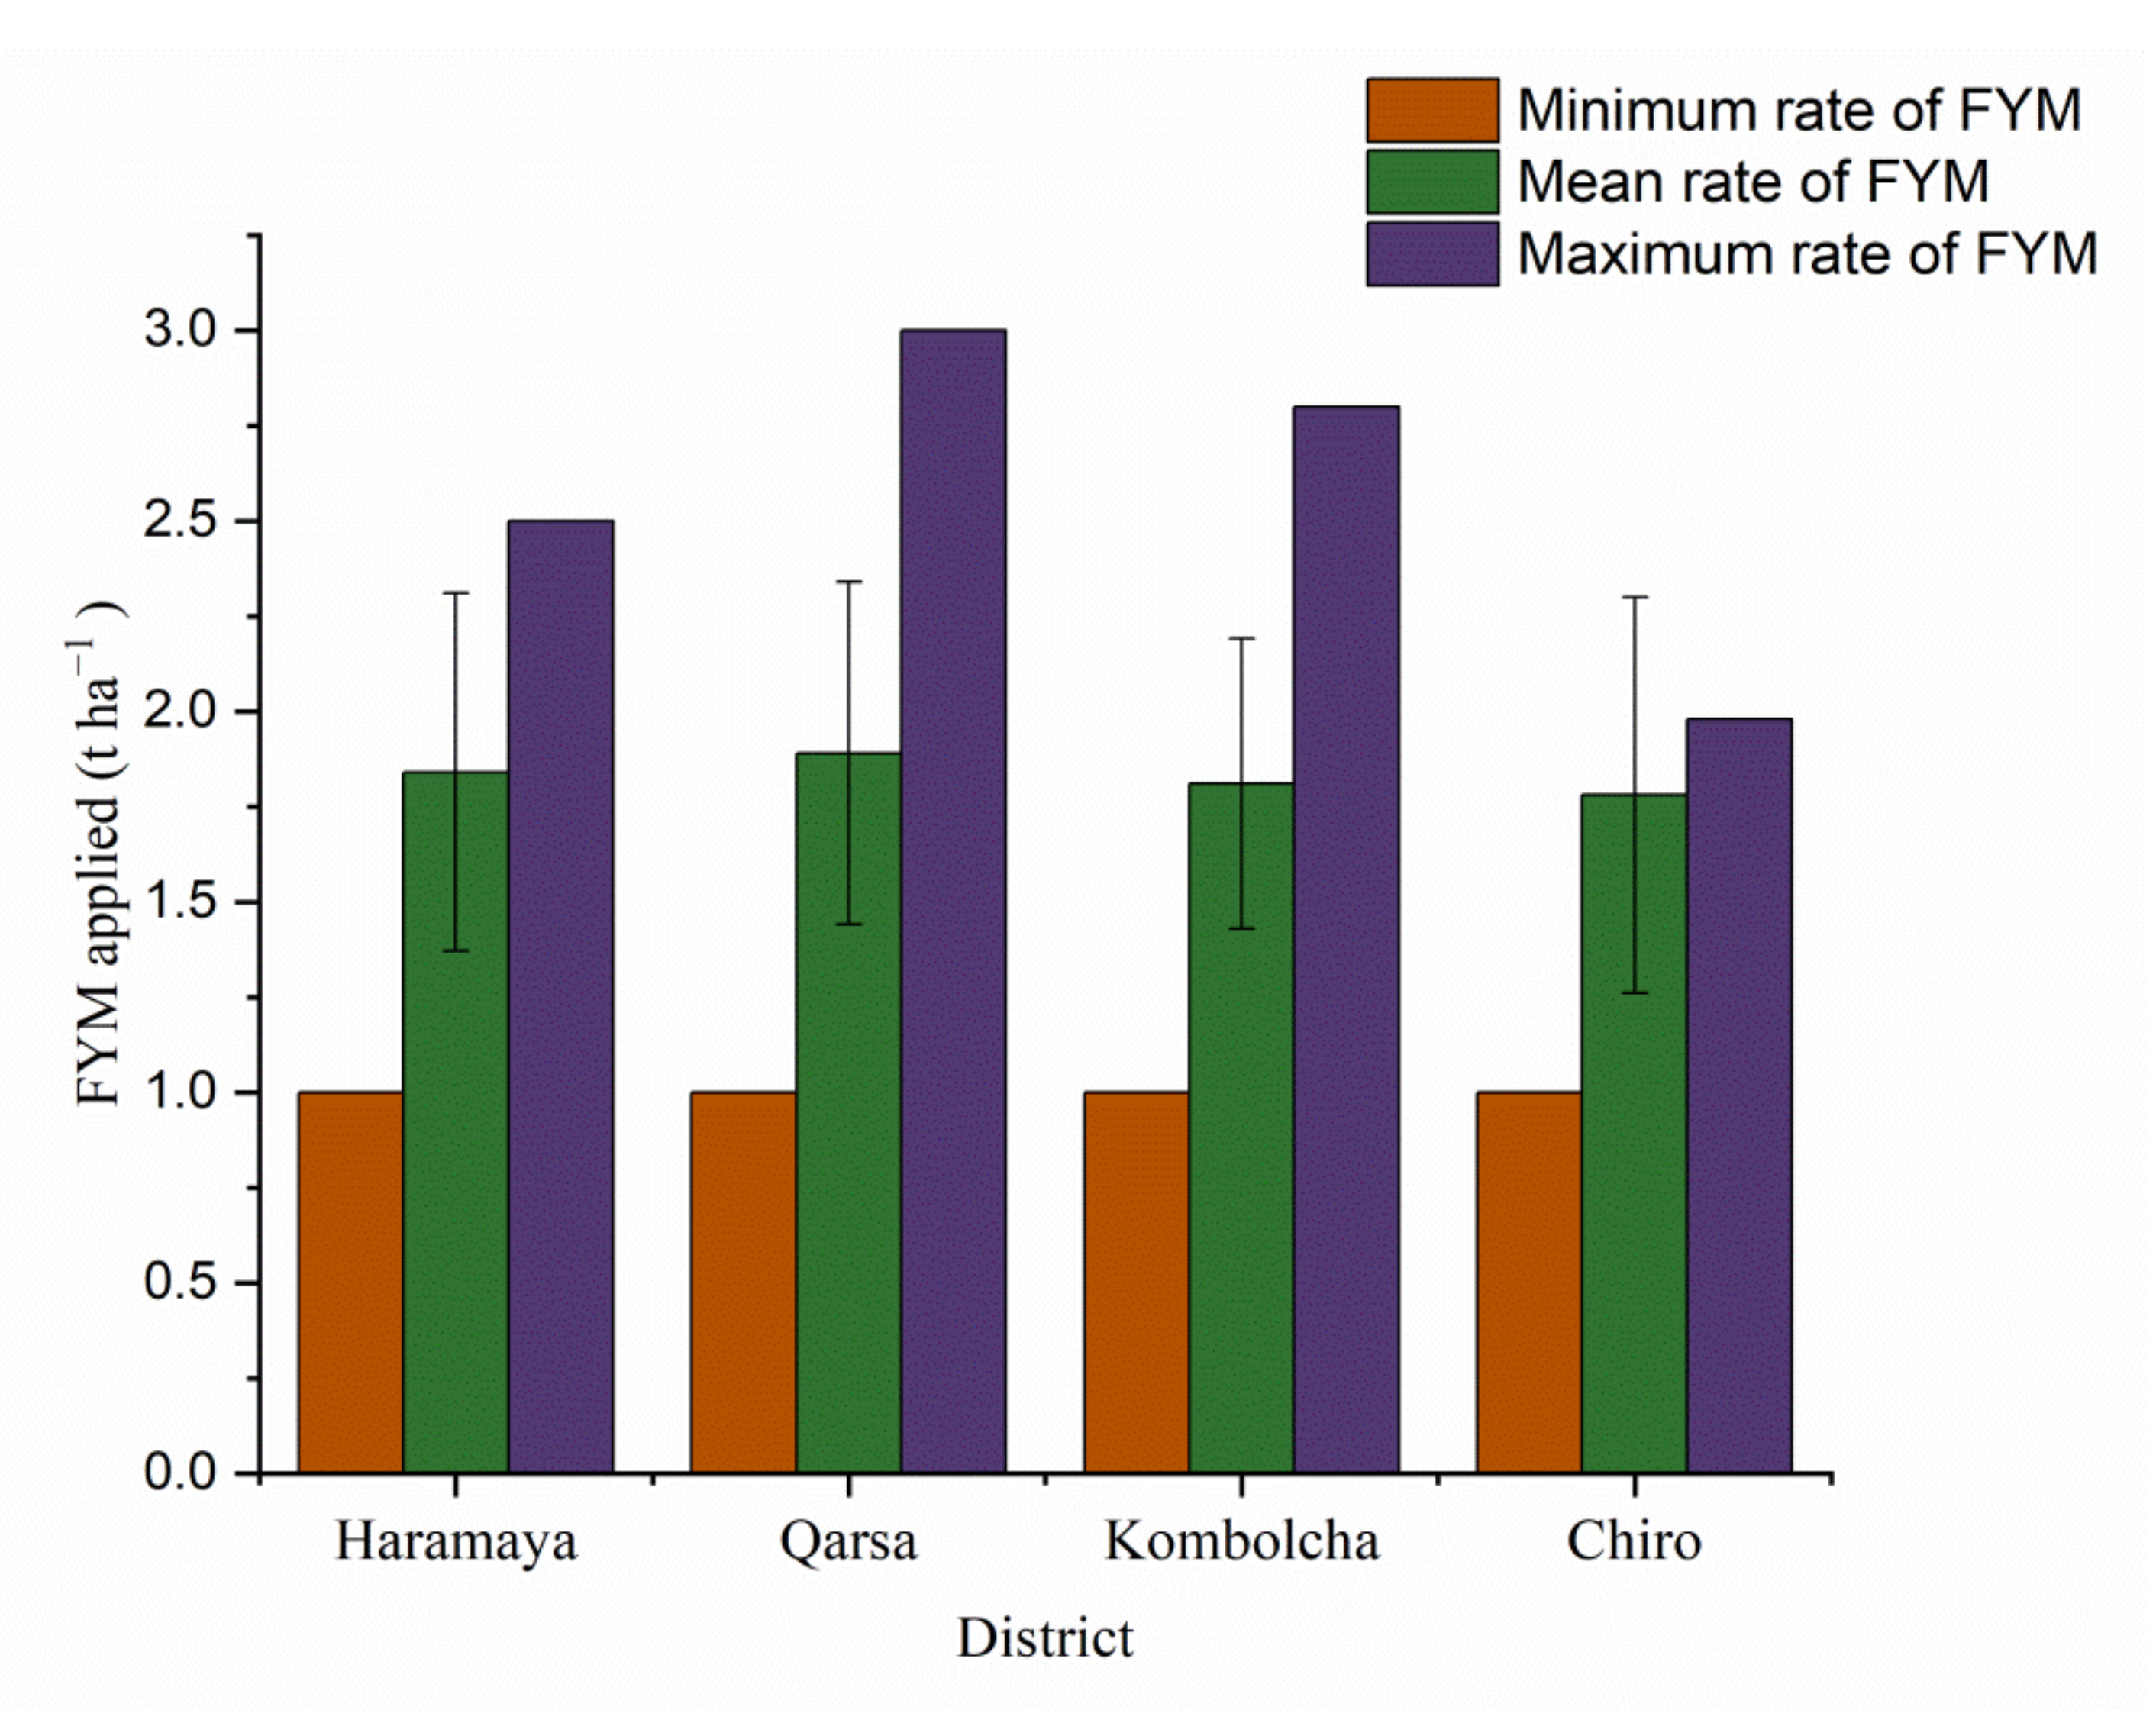
3.3.3. Management Practices of Farmyard Manure (FYM)

From the total sampled households, 44.8% used farmyard manure for potato production and applied it 15–30 days before planting. This may be attributed to the fact that farmyard manure supplies not only a variety of nutrients to the crop, but also improves soil organic carbon content, enhances proliferation of soil biota, and increases moisture-holding capacity of the soil, thereby enabling the potato crop to tolerate dry spells and give reasonably good yield [48]. The percentage of farmers that used farmyard manure for potato production in this study area was twice as much as the percentage of farmers that used farmyard manure for potato production (26.1%) in the central highlands of Ethiopia as reported by [49]. The average amount of farmyard manure used by the farmers was 1.83 ton ha−1 (Figure 6). This rate of farmyard manure application was almost twice as much as that used in Kombolcha district for potato production (1.2 ton ha−1) as reported by [43]. However, it was lower than the rate of farmyard manure (3.0 ton ha−1) applied by potato farmers in the Central Highlands of Ethiopia that was reported by [49]. The rates of farmyard manure applied by the farmers for potato production was very low in view of the recommended rate of the organic fertilizer for producing the crop in the country, which is 5.0–7.0 ton ha−1 [50]. Farmers used less farmyard manure than the recommended amount perhaps because of the low supply of organic matter. This is attributable to the low number of livestock units owned by farmers in the study area [51]. The low use of farmyard manure as fertilizer material by the farmers may also be attributed to competing uses of the material as the source of energy for cooking [52].

3.3.4. Constraints in the Use of Urea and NPS

Different constraints were identified in the use of urea and NPS fertilizers for potato production in the study districts. In decreasing order of severity, high cost, unavailability, and absence of access to credit were the most significant constraints that smallholder potato farmers faced in the use of the fertilizers (Table 4). The focus group discussions revealed that fertilizers were distributed by cooperative unions and were not available in time due to ineffective functioning of the supply chain. Hence, the dispatching process/selling to potato producers was mostly delayed. Consistent with this suggestion, [45] reported that high prices and inadequate availability of mineral fertilizers were the major factors constraining the use of fertilizers in potato production in the southern region of Ethiopia.

3.3.5. Constraints in the Use of FYM

Various constraints were identified in the use of farmyard manure for potato production in the study districts. In decreasing order of severity, bulkiness for transport, limited availability, and poor knowledge about the importance of farmyard manure for maintaining and improving soil fertility were the most significant constraints that potato farmers faced (Table 5). The limited availability of farmyard manure may be due to the low number of livestock units owned by farmers in the study area [51]. The cost of transporting the fertilizer is high given its sheer bulk, and the application process is tedious. Consistent with this suggestion, [53] reported that bulkiness and difficulty of transporting farmyard manure were the major constraints faced vegetable farmers in Nigeria.

3.4. Irrigation Water Management Practices

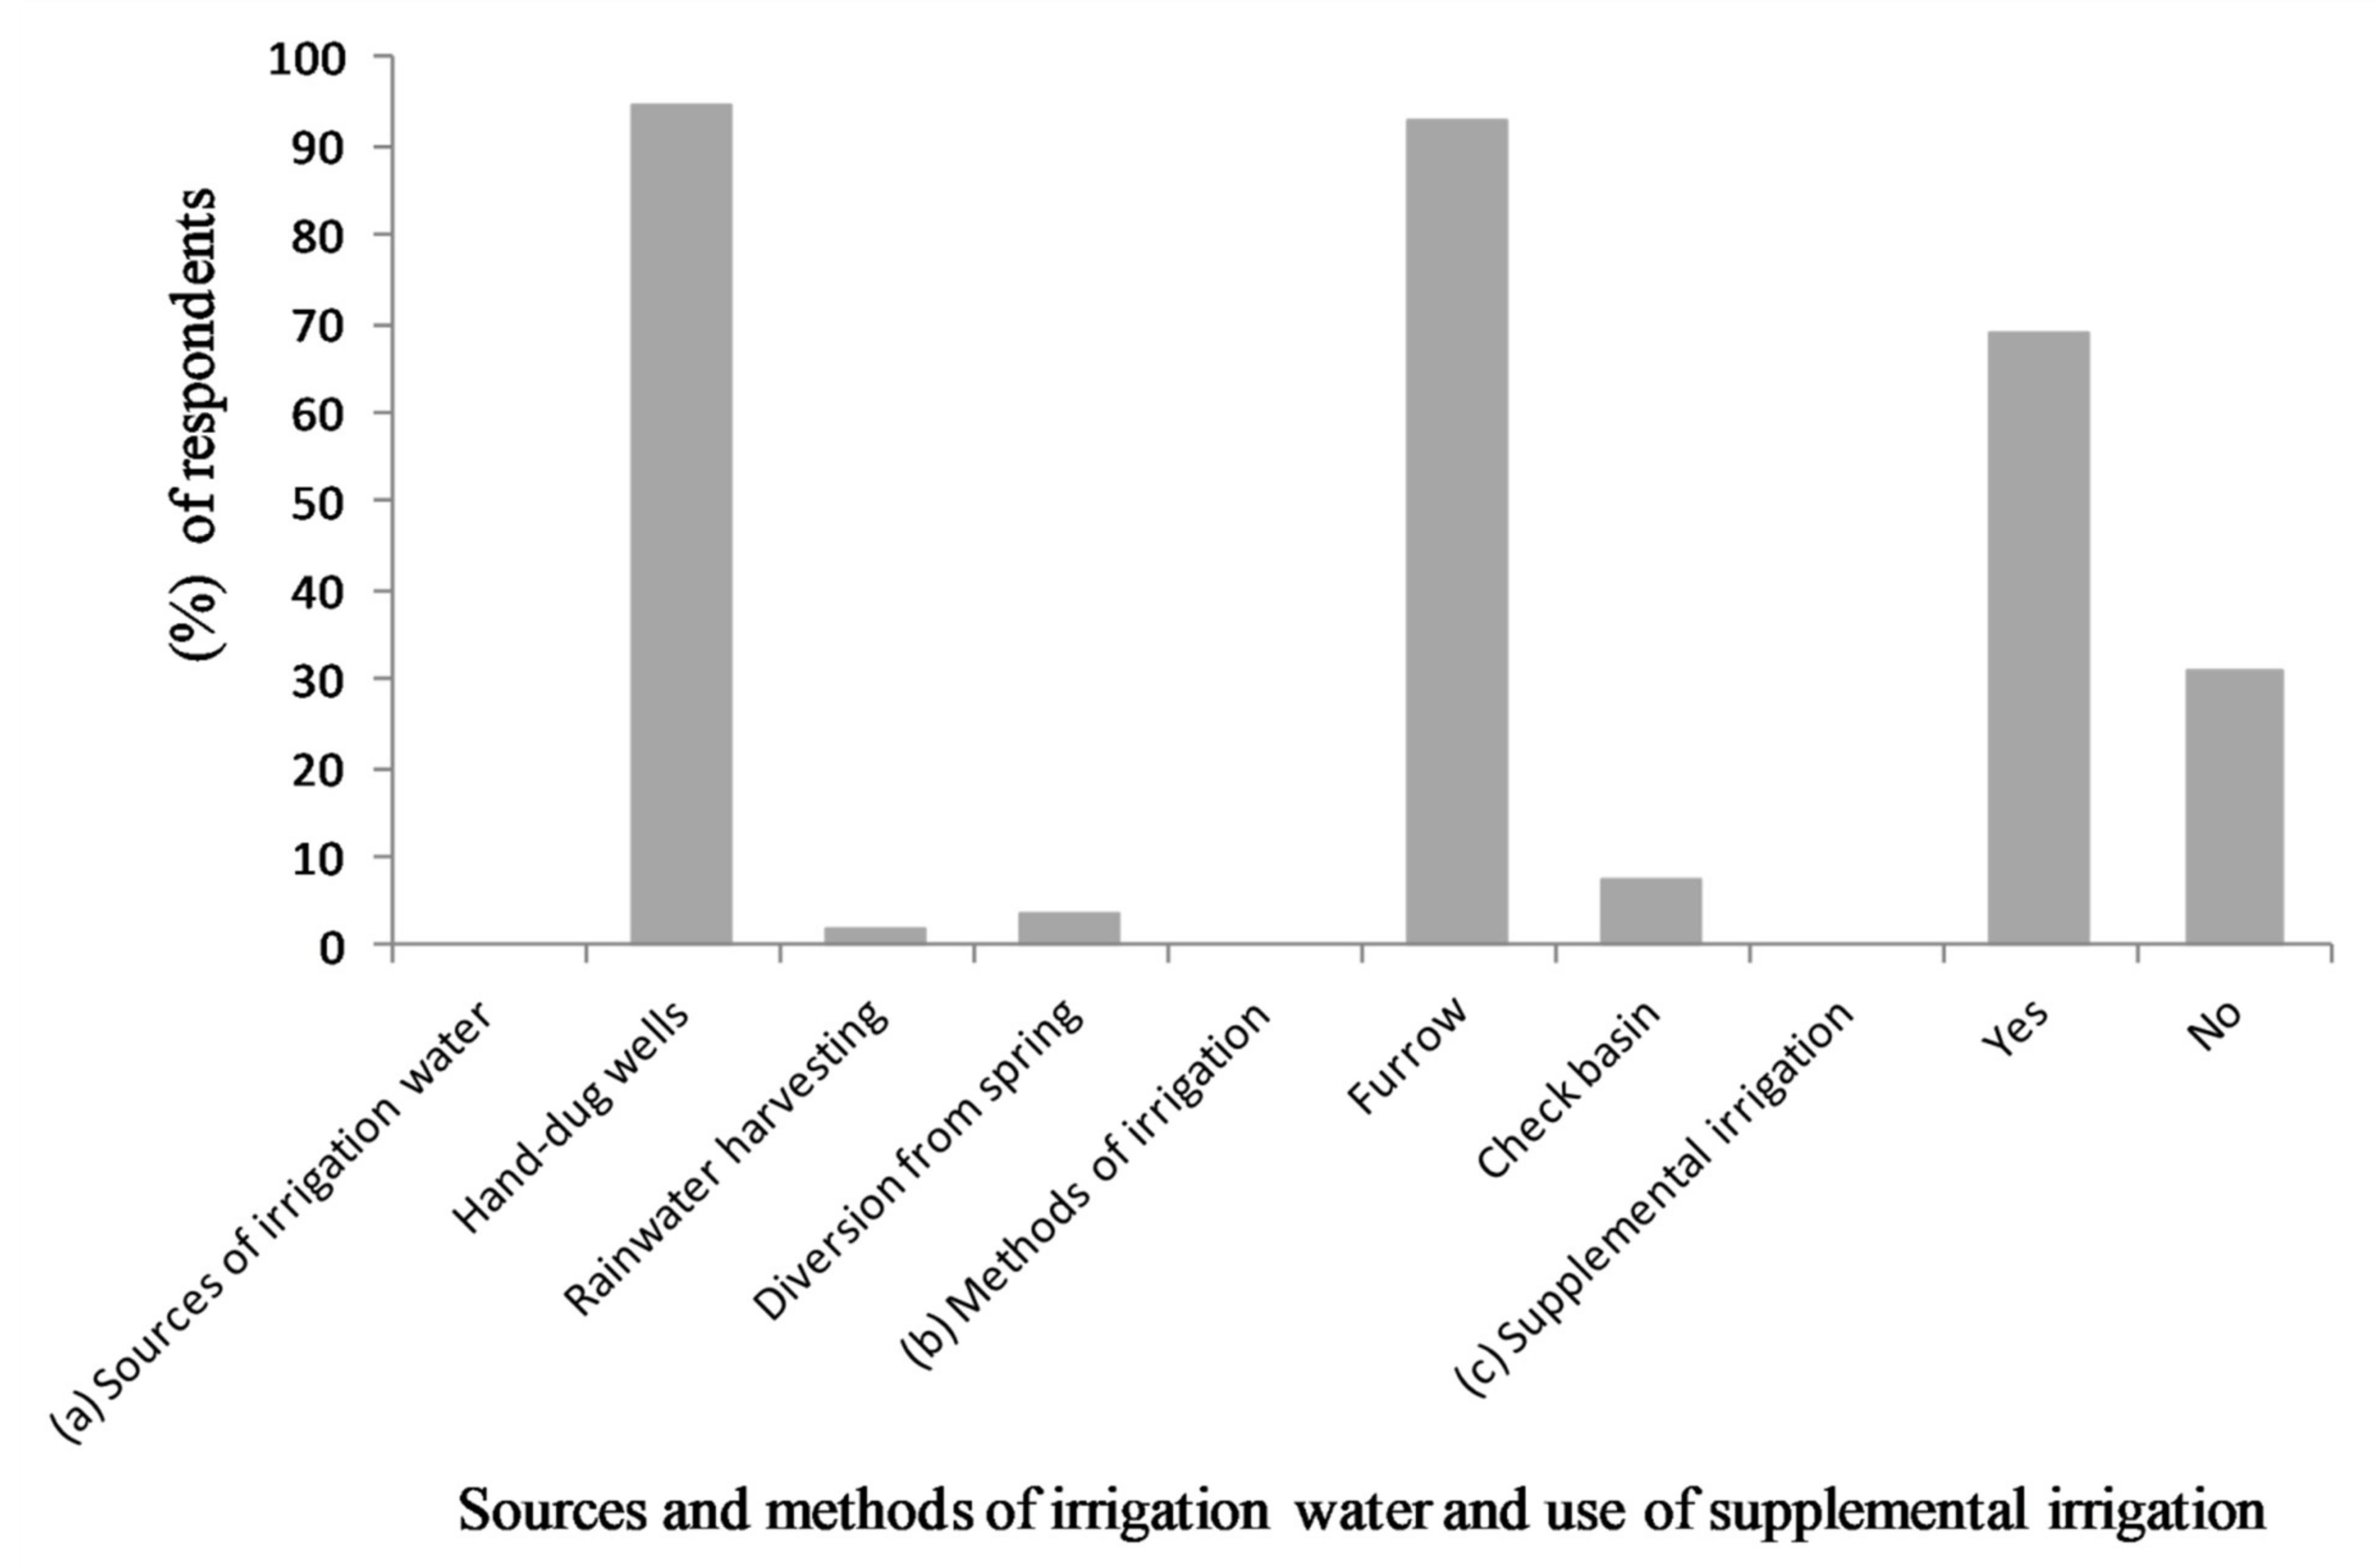
3.4.1. Source of Irrigation Water and Methods of Irrigation

Most of the households (94.7%) used hand-dug wells while a few of them used spring water (3.4%) and harvested rainwater (2%) as a source of irrigation water for potato production (Figure 7). This revealed that the households predominantly used groundwater as a source for irrigation water and domestic consumption. In contrast, [26] reported that farmers in northern Ethiopia predominantly used harvested rain as a major source of irrigation water for vegetable production. Most of households (92.72%) used furrow irrigation for potato production while a few of them (7.28%) used check basin irrigation (Figure 7). Farmers probably used furrow irrigation because of its low cost of initial investment. Farmers also used check-basin irrigation, which is a form of furrow irrigation in which potato production fields are levelled and divided into compartments into which water is flown turn-by-turn. Farmers probably used check-basin irrigation with the aim of reducing surface runoff and enhancing irrigation water-use efficiency. This suggestion was consistent with the finding of [54], who reported that check basin irrigation reduced surface runoff as well as deep infiltration and enhanced irrigation application efficiency for crop production in India. Therefore, water-saving irrigation technologies and appropriate irrigation methods could enhance adaptive capacity of smallholder farmers to moisture stress.

3.4.2. Supplemental Irrigation

Most of the farmers (68.91%) provided supplemental irrigation for potato production during the main rainy season (kirmet) when soil moisture deficit occurred, while 31.09% of them did not have access to irrigation water (Figure 7). The root system of the potato is coarse and shallow, which makes the crop inefficient in terms of uptake of water and minerals from the soil [20]. Therefore, the farmers wanted to bridge the gap. Some of the farmers applied no supplemental irrigation not because of lack of interest, but because of lack of equipment and supplies such as pumps, fuel, and etc. It is evident that also analyzing observed climate data in all study districts revealed that the precipitation concentration index (PCI) ranged between 15.1–17.7%. Therefore, according to the scale defined by [39], the result indicated poor monthly rainfall distribution in the districts. Furthermore, the coefficient of variation (CV) for the annual rainfall for all districts studied ranged from 69–82%, indicating high annual rainfall variability across the districts in the last thirty years. Corroborating this suggestion, [27] reported that vegetable farmers in the Central Rift Valley region of Ethiopia provided supplemental irrigation during the main rainy season in response to soil moisture deficits.

3.4.3. Time of Irrigation, Irrigating Interval, and Irrigation Depth

Most of the households (71.71%) irrigated potatoes in the afternoon while 11.2% and 17.09% of them irrigated the crop in the morning and both in the morning and in the afternoon, respectively (Figure 8). Most of the farmers avoided irrigating potatoes during the middle of the day (the hottest hours of the day) to minimize water loss through evapotranspiration. Consistent with this suggestion, ref. [28] reported that farmers used drip irrigation during the night to reduce the effect of evapotranspiration and wind speed in the western regions of Uganda.
Most of the households (67.5%) determined irrigation intervals on the basis of soil moisture content, while some of them (32.5%) based it on pumping cost (Figure 8). Farmers estimated the soil moisture content by using their experience through the feel and appearance method. They collected four to eight soil samples from potato fields before irrigating the crop and squeezed each soil sample firmly by hand several times to form an irregular-shaped ball and observed the firmness and roughness of the ball. Thus, based on this method, they estimated the moisture content of the soil and determined irrigation intervals. Consistent with this finding, ref. [24] reported that most vegetable farmers in Kumasi, Ghana used soil moisture content and weather as indicators for determining irrigation intervals.
Most of the households (95.24%) determined the optimum irrigation water applied (assumed to be optimum) when water touched the furrow basin head and 4.76% assumed that enough irrigation water was applied when the water stopped infiltrating into the soil for some minutes (Figure 8). Farmers applied irrigation water into the furrows and waited until the water reached the furrow basin. Some of them also waited until infiltration into the soil stopped for some minutes and immediately closed the furrows and guided the incoming water to the next furrows. However, such practices caused waterlogging, favored insect and disease incidences, and leeching of nutrients [27]. Therefore, appropriate irrigation water management packages should be developed for smallholder potato farmers in the studied districts.

3.4.4. Constraints in the Use of Irrigation Water

In decreasing order of severity, high cost of fuel for pumping water, scarcity of irrigation water, and low availability of drought-tolerant potato varieties were the most significant constraints that potato farmers faced in the use of irrigation water (Table 6). The major sources of irrigation water were hand-dug wells and boreholes, as indicated in the preceding section. Thus, farmers may not be able to supply optimum soil moisture for potato production due to the increasing costs of water pumping. Consistent with these suggestions, [55] reported that energy consumption in agricultural practices is threatening in terms of access to irrigation water for optimum crop production. The reduced irrigation water availability in the study districts was also evident with analysis of observed climate data, which revealed that annual rainfall in the Haramaya, Kombolcha, and Chiro districts decreased by 17.67, 184.5 and 142.8 mm, respectively (Table 3).

4. Conclusions

The results of this study revealed that, over the past 30-year period, the mean temperature increased whereas the mean annual rainfall decreased in the study area. To cope with the problem of moisture stress, farmers have been using supplemental irrigation during dry spells in the main growing season for potato production. However, the results showed that the irrigation practices used by the farmers are not water-efficient and sustainable. Similarly, to cope with the problem of soil degradation and nutrient depletion, potato-producing farmers have been using various soil fertility management practices, namely, applying mineral fertilizers, integrated use of mineral and farmyard manure fertilizers, and crop rotation. However, the farmers in the study areas applied lower rates of mineral fertilizer and farmyard manure than the blanket national recommendations rates for potato production. The overall results of the study highlighted that farmers made efforts to tackle the impact of climate change on potato production through various soil and irrigation water management practices. Agricultural policymakers should make efforts to support farmers’ efforts to cope with climate change by promoting the use of integrated and optimum fertilizer management and water harvesting technologies, and by supplying drought-tolerant potato varieties and water-efficient irrigation technologies. Future research efforts should focus on identifying and developing effective water-efficient irrigation technologies and formulating optimum rates of integrated fertilizer application and drought-tolerant and early maturing potato varieties.

Author Contributions

Writing—original draft, A.W.; writing—review and editing, N.D., Y.A., T.T. and B.B. All authors have read and agreed to the published version of the manuscript.

Funding

Africa Centre of Excellence for Climate Smart Agriculture and Biodiversity Conservation, Haramaya University, Ethiopia. The research is part of a study.

Institutional Review Board Statement

Not applicable.

Informed Consent Statement

Not applicable.

Data Availability Statement

This is not applicable to this article since no data sets were generated.

Acknowledgments

The authors thank farmers and agricultural experts for participating in this study by providing first-hand information through interviews and questionnaires. We also thank the Ethiopian Meteorological Agency for providing the 30-year climate data of the study districts free of charge.

Conflicts of Interest

The authors declare that they have no conflict of interest.

References

  1. Mulatu, E.; Ibrahim, O.E.; Bekele, E. Policy Changes to Improve Vegetable Production and Seed Supply in Hararghe, Eastern Ethiopia. Veg. Sci. 2005, 11, 81–106. [Google Scholar] [CrossRef]
  2. Gelmesa, D. Promoting Drought and Heat Resilient Potato Genotypes in Eastern Ethiopia; Drylands Coordination Group (DGC): Addis Ababa, Ethiopia, 2018; pp. 1–77. [Google Scholar]
  3. Tadesse, Y.; Almekinders, C.; Schulte, R.P.O.; Struik, P.C. Potatoes and Livelihoods in Chencha, Southern, Ethiopia. Wagening. J. Life Sci. 2019, 88, 105–111. [Google Scholar] [CrossRef]
  4. Wassihun, A.N.; Koye, T.D.; Koye, A.D. Analysis of Technical Efficiency of Potato (Solanum tuberosum L.) Production in Chilga District, Amhara National Regional State, Ethiopia. J. Econ. Struct. 2019, 8, 2–18. [Google Scholar] [CrossRef] [Green Version]
  5. Ketema, K.; Ayele, S.; Teha, A.; Nur, J. Linking Agricultural Research Center with Seed Producer Cooperatives Farmers for Solving Seed Value Chain Bottlenecks. Int. J. Agric. Agribus. 2019, 6, 56–63. [Google Scholar]
  6. CSA (Central Statistical Agency of Ethiopia). Report on Area and Production of Major Crops; CSA: Addis Ababa, Ethiopia, 2019; pp. 1–54. [Google Scholar]
  7. Koch, M.; Naumann, M.; Pawelzik, E.; Gransee, A.; Thiel, H. The Importance of Nutrient Management for Potato (Solanum tuberosum L.) Production part I: Plant Nutrition and Yield. Potato Res. 2019, 63, 97–119. [Google Scholar] [CrossRef] [Green Version]
  8. Mohammed, A.; Mohammed, M.; Dechasa, N.; Abduselam, F. Effects of Integrated Nutrient Management on Potato (Solanum tuberosum L.) Growth, Yield and Yield Components at Haramaya Watershed, Eastern Ethiopia. Open Access Libr. J. 2018, 5, 1–20. [Google Scholar] [CrossRef]
  9. Yebo, B. Integrated Soil Fertility Management for Better Crop Production in Ethiopia. Int. J. Soil Sci. 2015, 10, 1–16. [Google Scholar] [CrossRef] [Green Version]
  10. Gebremedhin, Y.; Berhe, A.A. Impact of Climate Change on Potato Yield (Solanum tuberosum L.) at Mekelle Areas, in Northern Ethiopia. World J. Agric. Sci. 2015, 11, 62–69. [Google Scholar] [CrossRef]
  11. IPCC (Intergovernmental Panel on Climate Change). Summary for policymakers. In Global Warming of 1.5 °C. An IPCC Special Report on the Impacts of Global Warming of 1.5 °C Above Pre-Industrial Levels and Related Global Greenhouse Gas Emission Pathways, in the Context of Strengthening the Global Response to the Threat of Climate Change, Sustainable Development, and Efforts to Eradicate Poverty; Masson-Delmotte, P., Zhai, H.O., Pörtner, D., Roberts, J., Skea, P.R., Shukla, A., Pirani, W., Moufouma-Okia, C., Péan, R., Pidcock, S., et al., Eds.; IPCC: Cambridge, UK; New York, NY, USA, 2018; pp. 1–24. [Google Scholar]
  12. Raymundo, R.; Asseng, S.; Robertson, R.; Petsakos, A.; Hoogenboom, G.; Quiroz, R.; Hareau, G.; Wolf, J. Climate Change Impact on Global Potato Production. Eur. J. Agron. 2018, 100, 87–98. [Google Scholar] [CrossRef]
  13. Ahmed, S.M. Impacts of Drought, Food Security Policy and Climate Change on Performance of Irrigation Schemes in Sub-saharan Africa: The case of Sudan. Agric. Water Manag. 2020, 232, 1–9. [Google Scholar] [CrossRef]
  14. Gonzalez-Orrozco, C.E.; Porcel, M.; Alzate, D.F.; Orduz-Rodriguez, J.O. Extreme Climate Variability Weakens a Major Tropical Agricultural Hub. Ecol. Indic. 2020, 111, 1–9. [Google Scholar] [CrossRef]
  15. IGAD (Intergovernmental Autority for Development). Report on Historical Climate Baseline Statistics for East and West Hararghe Zones. Clim. Pred. Appl. 2017, 2, 1–48. [Google Scholar]
  16. Alvarenga, P.; Carneiro, J.P.; Fangueiro, D.; Cordovil, C.M.D.S.; Bernal, M.P. Managing Organic Amendments in Agroecosystems to Enhance Soil Carbon Storage and Mitigate Climate Change, 2nd ed.; Elsevier: Murcia, Spain, 2020; pp. 89–141. [Google Scholar] [CrossRef]
  17. Ofiti, N.O.E.; Zosso, C.U.; Soong, J.L.; Solly, E.F.; Torn, M.S.; Wiesenberg, G.L.B.; Schmidt, M.W.I. Warming Promotes Loss of Subsoil Carbon through Accelerated Degradation of Plant-Derived Organic Matter. Soil Biol. Biochem. 2021, 156, 1–10. [Google Scholar] [CrossRef]
  18. Whalen, J.K. Managing Soil Biota-Mediated Decomposition and Nutrient Mineralization in Sustainable Agroecosystems. Adv. Agric. 2014, 13, 1–13. [Google Scholar] [CrossRef]
  19. Butcher, K.R.; Nasto, M.K.; Norton, J.M.; Stark, J.M. Physical Mechanisms for Soil Moisture Effects on Microbial Carbon-Use Efficiency in a Sandy Loam Soil in the Western United States. Soil Biol. Biochem. 2020, 150, 2–10. [Google Scholar] [CrossRef]
  20. Dechassa, N.; Schenk, M.K.; Claassen, N.; Steingrobe, B. Phosphorus Efficiency of Cabbage (Brassica oleraceae L. vat. capitata), Carrot (Daucus carota L.), and Potato (Solanum tuberosum L.). Plant Soil 2003, 250, 215–224. [Google Scholar] [CrossRef]
  21. Joshi, M.; Fogelman, E.; Belausov, E.; Ginzberg, I. Potato (Solanum tuberosum L.) Root System Development and Factors that Determine its Architecture. J. Plant Physiol. 2016, 205, 113–123. [Google Scholar] [CrossRef]
  22. Dechassa, N.; Ketema, N.; Deressa, H.; Kinati, W.; Amanu, T.; Birru, O.; Tegene, S.; Ayele, S. Participatory Rural Appraisal Report: Haramaya Woreda, Eastern Oromia Region; CASCAPE: Haramaya, Ethiopia, 2014. [Google Scholar]
  23. Tekeste, N.; Dechassa, N.; Kebede, W.; Lemma, D.; Abuhay, T. Characterization of Soil Nutrient Management and Post-Harvest Handling Practices for Onion (Allium cepa L.) Production in the Central Rift Valley Region of Ethiopia. Agric. For. Fish. 2013, 2, 184–195. [Google Scholar] [CrossRef] [Green Version]
  24. Keraita, B.; Cofie, O. Irrigation and Soil Fertility Management Practices; Accra: Kumasi, Ghana, 2010; pp. 74–88. [Google Scholar]
  25. Wawire, A.W.; Csorba, A.; Toth, J.A.; Micheli, E.; Szalai, M.; Mutuma, E.; Kovacs, E. Soil Fertility Management Among Smallholder Farmers in Mount Kenya East Region. Heliyon 2021, 7, 2–11. [Google Scholar] [CrossRef]
  26. Yohannes, D.F.; Ritsema, C.J.; Solomon, H.; Froebrich, J.; Van Dam, J.C. Irrigation Water Management: Farmers’ Practices, Perceptions, and Adaptations at Gumselassa Irrigation Scheme, North Ethiopia. Agric. Water Manag. 2017, 191, 16–28. [Google Scholar] [CrossRef]
  27. Etissa, E.; Dechassa, N.; Alamirew, T.; Alemayehu, Y.; Desalegne, L. Irrigation Water Management Practices in Smallholder Vegetable Crops Production: The case of the Central Rift Valley of Ethiopia. Sci. Technol. Arts Res. J. 2014, 3, 74–83. [Google Scholar] [CrossRef] [Green Version]
  28. Mfitumukiza, D.; Barasa, B.; Kiggundu, N.; Nyarwaya, A.; Muzei, J.P. Smallholder Farmers’ Perceived Evaluation of Agricultural Drought Adaptation Technologies Used in Uganda: Constraints and opportunities. J. Arid Environ. 2020, 177, 104–137. [Google Scholar] [CrossRef]
  29. Talanow, K.; Topp, E.N.; Loss, J.; Martin-Lopez, B. Farmers’ Perceptions of Climate Change and adaptation Strategies in South Africa’s Western Cape. J. Rural Stud. 2020, 81, 203–219. [Google Scholar] [CrossRef]
  30. Kibret, K. Characterization of Agricultural Soils in CASCAPE Intervention Woredas in Eastern Region of Ethiopia. Final Report. 2014, pp. 1–263. Available online: https://edepot.wur.nl/481240 (accessed on 20 May 2021).
  31. Yamane, T. Statistics: An Introduction Analysis; Harper and Row: New York, NY, USA, 1967. [Google Scholar]
  32. Cochran, W. Sampling Techniques; Harvard University: Cambridge, MA, USA, 1977. [Google Scholar]
  33. IPCC (Intergovernmental Panel on Climate Change). Guidelines on the Use of Scenario Data for Climate Impact and Adaptation Assessment; Cambridge University: Cambridge, UK, 1999; pp. 1–878. [Google Scholar]
  34. Gebru, H.; Mohammed, A.; Dechassa, N.; Belew, D. Assessment of Production Practices of Smallholder Potato (Solanum tuberosum L.) Farmers in Wolaita Zone, Southern Ethiopia. Agric. Food Secur. 2017, 6, 1–11. [Google Scholar] [CrossRef] [Green Version]
  35. Partal, T.; Kahya, E. Trend Analysis in Turkish Precipitation Data. Hydrol. Process. 2006, 20, 2011–2026. [Google Scholar] [CrossRef]
  36. Sen, P.K. Estimates of the Regression Coefficient Based on Kendall’s Tau. J. Am. Stat. Assoc. 1968, 63, 1379–1389. [Google Scholar] [CrossRef]
  37. Koudahe, K.; Kayode, A.J.; Samson, A.O.; Adebola, A.A.; Djaman, K. Trend Analysis in Standardized Precipitation Index and Standardized Anomaly Index in the Context of Climate Change in Southern Togo. Atmos. Clim. Sci. 2017, 7, 401. [Google Scholar] [CrossRef] [Green Version]
  38. De Luís, M.; Raventós, J.; González-Hidalgo, J.C.; Sánchez, J.R.; Cortina, J. Spatial Analysis of Rainfall Trends in the Region of valencia (East Spain). Climatology 2000, 20, 1451–1469. [Google Scholar] [CrossRef]
  39. Oliver, J.E. Monthly Precipitation Distribution: A comparative index. Prof. Geogr. 1980, 32, 300–309. [Google Scholar] [CrossRef]
  40. Hare, W. Assessment of Knowledge on Impacts of Climate Change, Contribution to the Specification of Art, 2 of the UNFCCC; WBGU: Berlin, Germany, 2003; pp. 1–104. [Google Scholar]
  41. Tessema, L.; Mohammed, W.; Abebe, T. Evaluation of Potato (Solanum tuberosum L.) Varieties for Yield and Some Agronomic Traits. Open Agric. 2020, 5, 63–74. [Google Scholar] [CrossRef] [Green Version]
  42. Mohammed, W. Genetic Variability in Potato (Solanum tuberosum L.) Genotypes for Late blight [Phytophthora infestans]. East Afr. J. Sci. 2014, 8, 13–28. [Google Scholar]
  43. Dechassa, N.; Ketema, N.; Deressa, H.; Kinati, W.; Amanu, T.; Birru, O.; Tegene, S.; Ayele, S. Participatory Rural Appraisal Report: Kombolcha Woreda, Eastern Oromia Region; CASCAPE: Kombolcha, Ethiopia, 2014. [Google Scholar]
  44. Eastern Harargeh Agricultural Office. Management Practices of Crops in the Eastern Highlands of Ethiopia; Eastern Harargeh Agricultural Office: Harar, Ethiopia, 2019; pp. 1–59. [Google Scholar]
  45. Emana, B.; Nigussie, M. Potato Value Chain Analysis and Development in Ethiopia Case of Tigray and SNNP Regions; CIP-Ethiopia: Addis Ababa, Ethiopia, 2011; pp. 1–71. [Google Scholar]
  46. Souza, E.F.C.; Soratto, R.P.; Sandaña, P.; Venterea, R.T.; Rosen, C.J. Split Application of Stabilized Ammonium Nitrate Improved Potato (Solanum tuberosum L.) Yield and Nitrogen-Use Efficiency with Reduced Application Rate in Tropical Sandy soils. Field Crops Res. 2020, 254, 1–13. [Google Scholar] [CrossRef]
  47. Rosen, C.J.; Kelling, K.A.; Stark, J.C.; Porter, G.A. Optimizing Phosphorus Fertilizer Management in Potato (Solanum tuberosum L.) Production. Potato Res. 2014, 91, 145–160. [Google Scholar] [CrossRef]
  48. Meena, B.P. Sustainability of Popcorn-Potato Cropping System Improves due to Organic Manure Application and its Effect on Soil Health. Potato Res. 2019, 62, 253–279. [Google Scholar] [CrossRef]
  49. Gildemacher, P.R.; Kaguongo, W.; Ortiz, O.; Tesfaye, A.; Woldegiorgis, G.; Wagoire, W.W.; Kakuhenzire, R.; Kinyae, P.M.; Nyongesa, M.; Struik, P.C.; et al. Improving Potato (Solanum tuberosum L.) Production in Kenya, Uganda and Ethiopia: A system diagnosis. Potato Res. 2009, 52, 173–205. [Google Scholar] [CrossRef]
  50. Asresie, H.; Alemu, W.; Molla, T.; Mekonen, T.; Abel, A.; Seferew, D.; Yihenew, S.G.; Desallegn, M.; Tesfaye, A. Best Fit Practice Manual for Potato Production and Utilization; Tigray, Ethiopia, 2015; pp. 1–37. Available online: https://www.researchgate.net/publication/341050872_Best_Fit_Practice_Manual_for_Potato_Production_and_Utilization_in_Tigray_Region_Ethiopia (accessed on 20 May 2021).
  51. Shumetie, A.; Mamo, K. Effect of Cropland and Livestock Ownership on Child Labour in Eastern Ethiopia: Empirical Examination of the Wealth Paradox. Int. J. Child Care Educ. Policy 2019, 13, 1–15. [Google Scholar] [CrossRef]
  52. Tucho, G.T.; Nonhebel, S. Bio-Wastes as an Alternative Household Cooking Energy Source in Ethiopia. Energies 2015, 8, 9565–9583. [Google Scholar] [CrossRef] [Green Version]
  53. Aderinoye, M.; Salami, S.T. Assessment of Organic Fertilizer Usage by Vegetable Farmers in Asa Local Government Area of Kwara State, Nigeria. Agrosearch 2017, 17, 101–114. [Google Scholar] [CrossRef] [Green Version]
  54. Sable, R.S.; Kolekar, A.; Gawdel, S.; Takle, H.; Adesh, P. A review on Different Irrigation Methods. Appl. Agric. Res. 2019, 14, 49–60. [Google Scholar]
  55. Belaud, G.; Mateos, L.; Aliod, R.; Buisson, M.C.; Faci, E.; Gendre, S.; Ghinassi, G.; Gonzales, P.R.; Lejars, C.; Maruejols, F.; et al. Irrigation and Energy: Issues and Challenges. Irrig. Drain. 2020, 69, 177–185. [Google Scholar] [CrossRef]
Figure 1. Location map of the study districts.
Sustainability 13 06420 g001
Figure 2. Proportion (%) of potato varieties grown in the Haramaya, Qarsa, Kombolcha, and Chiro districts in the East and West Hararghe Zones of the Oromia Regional State in Ethiopia during the 2019 main cropping season. (N = 357).
Sustainability 13 06420 g002
Figure 3. The standardized anomaly index (SAI) of rainfall in the Qarsa, Kombolcha, Haramaya, and Chiro districts in the East and West Hararghe Zones of the Oromia Regional State in Ethiopia (1988–2017).
Sustainability 13 06420 g003
Figure 4. Soil ammendements and mineral fertilizer management by smallholder farmers in the Haramaya, Qarsa, Kombolcha, and Chiro districts in the East and West Hararghe Zones of the Oromia Regional State in Ethiopia during the 2019 main cropping season. (N = 357).
Sustainability 13 06420 g004
Figure 5. The amount of blended NPS and urea fertilizer applied by smallholder farmers in the Haramaya, Qarsa, Kombolcha, and Chiro districts in the East and West Hararghe Zones of the Oromia Regional State in Ethiopia during the 2019 main cropping season. (N = 357).
Sustainability 13 06420 g005
Figure 6. The amount of farmyard manure applied by smallholder farmers in the Haramaya, Qarsa, Kombolcha, and Chiro districts in the East and West Hararghe Zones of the Oromia Regional State in Ethiopia during the 2019 main cropping season. (N = 160).
Sustainability 13 06420 g006
Figure 7. Sources of irrigation water and irrigation water management by smallholder potato farmers in Haramaya, Qarsa, Kombolcha, and Chiro districts in East and West Hararghe Zones of the Oromia Regional State in Ethiopia during the 2019. (N = 357).
Sustainability 13 06420 g007
Figure 8. Timing, determinant for irrigation interval and depth by smallholder potato farmers in the Haramaya, Qarsa, Kombolcha, and Chiro districts in the East and West Hararghe Zones of the Oromia Regional State in Ethiopia in the 2019 cropping season. (N = 357).
Sustainability 13 06420 g008
Table 1. Agro-ecological settings of the study districts in East and West Hararghe Zones of the Oromia Regional State in eastern highlands of Ethiopia.
Major Feature District
HaramayaChiroQarsaKombolcha
Altitude (m a.s.l.)1400–23401500–28001550–28001200–2460
Total cultivated land (ha)24,00035,84021,13012,604
Mean annual rainfall (mm)816798743807
Mean maximum temperature (°C)2527.924.627.8
Mean minimum temperature (°C)10.313.912.214.6
Number of peasant association33403519
Total number of households36,96134,41028,95025,600
Total population314,780201,705231,659190,544
m a.s.l. = meters above sea level. Source: Eastern/Western Hararghe Zone Agricultural Office, 2018/19.
Table 2. Households producing potatoes in the East and West Hararghe Zones of the Oromia Regional State in Ethiopia during the 2019 main cropping season.
Sample DistrictsSample PAsTNHPPSample SizePercent
HaramayaKuro Jalala5505916.55
Tuji Gabisa5205615.64
QarsaBela Langie4504813.54
Madda Oda290318.72
KombolchaBilisuma4805214.44
Qerensa5706117.15
ChiroArbarakate159174.78
Funyan Dimo305339.18
Total3324357100
TNHPP = Total Number of Households Producing Potato. PA = Peasant Association.
Table 3. Sen’s estimator of slope (mm/year) of annual rainfall total and (°C/year) of annual and seasonal mean maximum and mean minimum temperature trends in Haramaya, Qarsa, Kombolcha, and Chiro in the East and West Hararghe Zones of the Oromia Regional State in Ethiopia (1988–2017).
Variables Season
BelgKiremtAnnual
Sen’s slopeSen’s slopeSen’s slope
Rainfall totals
Haramaya−2.744 ns2.93 ns−0.589 ns
Qarsa−3.368 ns3.26 ns0 ns
Kombolcha−3.829 ns−1.529 ns−6.15 ns
Chiro−3.613 ns−0.259 ns−4.76 ns
Tmax
Haramaya0.025 ns0.22 *0.2 *
Qarsa0.033 *0.036 ns0.028 ns
Kombolcha0.061 *0.027 ns0.039 ns
Chiro−0.014 ns0.00 ns−0.009 ns
Tmin
Haramaya−0.008 ns0.018 ns0 ns
Qarsa0.015 ns0.024 *0.023 ns
Kombolcha0.025 *0.02 *0.2 *
Chiro0.112 ns0.112 ns0.114 ns
ns = non-significant trend at p = 0.05; * significant trend at p < 0.05; Tmax = mean maximum temperature; Tmin = mean minimum temperature.
Table 4. Constraints faced in using urea and NPS fertilizers by smallholder farmers in the Haramaya, Qarsa, Kombolcha, and Chiro districts in East and West Hararghe Zones during the 2019 cropping season. (N = 357).
Ranking
Constraints 1st2nd3rd4th5th6thIndexRank
High cost48201442000.427921
Poor knowledge & Ext.ser.0001322170.075075
Absence of access to credit141212106120.184683
Limited availability on time13171410530.196692
Inaccessibility0914513120.115614
Total755854804644
where 1st = severe constraint; 2nd = very high constraint; 3rd = high constraint; 4th = medium constraint; 5th = low constraint; 6th = very low constraint.
Table 5. Constraints in using farmyard manure in potato production by smallholder farmers in the Haramaya, Qarsa, Kombolcha, and Chiro districts in the East and West Hararghe Zones of the Oromia Regional State in eastern Ethiopia in the 2019 cropping season. (N = 357).
Ranking
Constraints1st2nd3rd4th5th6thIndexRank
Limited availability 27191615000.2572032
Bulkiness for transport30242320000.3176391
Poor knowledge and Ext.Ser.1716201318110.2445543
Spread weeds 009111050.0660585
Absence of own land0014291000.1145474
Total745982883816
where 1st = severe constraint; 2nd = very high constraint; 3rd = high constraint; 4th = medium constraint; 5th = low constraint; 6th = very low constraint.
Table 6. Constraints in using irrigation water in potato production by smallholder farmers in the Haramaya, Qarsa, Kombolcha, and Chiro districts in the East and West Hararghe Zones of the Oromia Regional State in Ethiopia during the 2019 cropping season. (N = 357).
Ranking
Constraints 1st2nd3rd4th5th6thIndexRank
Lack of drought-tolerant potato var.11172231000.215033
High cost of fuel for water pump3041320000.332251
Scarcity of irrigation water24192312300.241582
Land scarcity108157620.126304
High cost of irrigation equipment001221920.084845
Total758510471184
where 1st = severe constraint; 2nd = very high constraint; 3rd = high constraint; 4th = medium constraint; 5th = low constraint; 6th = very low constraint.
Publisher’s Note: MDPI stays neutral with regard to jurisdictional claims in published maps and institutional affiliations.

