Abstract
The rapid implementation of large scale floating solar panels has consequences to water quality and local ecosystems. Environmental impacts depend on the dimensions, design and proportions of the system in relation to the size of the surface water, as well as the characteristics of the water system (currents, tidal effects) and climatic conditions. There is often no time (and budget) for thorough research into these effects on ecology and water quality. A few studies have addressed the potential impacts of floating solar panels, but often rely on models without validation with in situ data. In this work, water quality sensors continuously monitored key water quality parameters at two different locations: (i) underneath a floating solar park; (ii) at a reference location positioned in open water. An underwater drone was used to obtain vertical profiles of water quality and to collect underwater images. The results showed little differences in the measured key water quality parameters below the solar panels. The temperature at the upper layers of water was lower under the solar panels, and there were less detected temperature fluctuations. A biofouling layer on the floating structure was visible in the underwater images a few months after the construction of the park.
1. Introduction
1.1. Water Management and Energy Transition in the Netherlands
The quality of surface water in the Netherlands is improving, but not all Water Framework Directive (WFD; [1]) targets will be achieved by 2027 [2]. Additionally, the Netherlands is facing the major task of making the transition from fossil fuels to renewable energy, and the main governmental agencies agreed to be climate and energy neutral by 2025 and contribute to the national goal of making the Netherlands energy-neutral by 2050 [2]. To achieve these objectives, energy infrastructure must be as climate-adaptive as possible. The coming years will see an even sharper increase in the generation capacity of renewable energy, including solar energy. Making solar energy generation more widely applicable is key for making the transition to renewable energy and achieving the associated national targets. This technology requires large areas available for the deployment of photovoltaic panels (PV), which creates conflicts with other land-uses such as agricultural activities. As land is a limited resource in densely populated countries, such as the Netherlands, placing these systems on the water surface is being considered to face this challenge.
1.2. Floating Solutions
More and more functions are being added to water bodies that can influence water quality. This increasing competition between functions and the condition of water resources requires innovative solutions that safeguard water quality and corresponding ecosystems. Floating construction is considered one of the most effective climate adaptation measures in construction [3], as structures move along with changing water levels, and facilitate multiple uses of space. Floating solutions offer the opportunity to combine different infrastructure with water storage and, through multiple uses of space, they create additional value to water resources. The structures are flexible and relocatable, which is an advantage for fast-growing cities where space is scarce and innovative construction is required due to, for example, earthquakes, land subsidence or flood risk.
1.3. Floating Solar Panels
Over the last few years, floating solar parks have gained significance [4,5,6], with many solar power plants being considered and constructed worldwide at very large scales [7,8]. The total capacity of floating solar panels in the world in 2019 exceeded 319,000 kW [9], and the estimated potential of floating solar parks exceeds 4000 GWp (gigawatt-peak) with 10% of the total water surface area used [4]. The two largest floating solar parks in the world are located in China in Anhui Guqiao Huainan, with a capacity of 150 MW each [10]. Much bigger projects that reach power generation capacities of multiple GW are already being announced [11]. Most international large-scale implementations of this type of floating solar project are located in countries such as Singapore, China, Taiwan, France, South Korea and the USA. Some of these international examples are mapped on ClimateScan [12].
This type of renewable energy solution is currently high on (inter)national political agendas, as it is characterized by the following advantages:
- Limited need for (land) space and cost (efficient use of space) [13].
- Contributes to climate adaptation and mitigation goals (drought or flooding will not affect them).
- Feasibility of large-scale implementations (Figure 1) face less public resistance than similar projects on land.
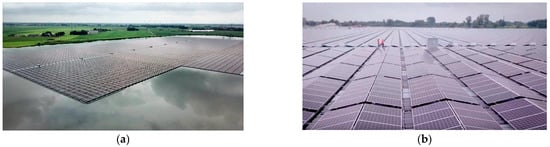 Figure 1. Impression of the floating solar panels at the study site: (a) aerial view of the floating solar park at the Bomhofsplas lake, Zwolle; (b) view from the center of the floating solar park during monitoring activities.
 - Higher efficiency of PV systems than land-based solutions, due to water cooling and reflecting light from water surface [14], although conflicting information can be found in the literature [15].
- Reduces evaporation in lakes, which could have a positive impact in locations prone to drought or water shortages [16].
1.4. Floating Solar Panels in the Netherlands
Dutch surface water bodies are essential as water storage during intensive showers or during prolonged droughts in the future. The Netherlands is currently one of the leading countries in Europe towards this type of green energy solution [17], and there are already several examples of floating solar panels in the Netherlands (e.g., Bomhofsplas, the study site where data were collected in this research, is the largest project in Europe in 2020 [11]). However, the latest projects are (still) covering relatively small areas compared to those in Asia, but the scale of this type of project is rapidly increasing. Local stakeholders aim to realize 2 GWp of floating PV systems in the country between 2017 and 2023 [18], making the Netherlands one of the biggest floating solar park markets within Europe.
1.5. Legislation and Need for Environmental Monitoring
Harvesting solar energy from water by covering the surface of water bodies raises the question of how this type of installation affects other objectives and functions of water systems. Water managers need to take into account potential environmental impacts and enforce legal frameworks by issuing licenses or restricting new projects. There is a strong demand for short licensing processes that has led to deployment of renewable energy sources without extensive practical research [19]. Dutch water authorities are concerned about assessing the environmental impact of this type of projects and are enforcing strict monitoring programs that also include the monitoring of biological and chemical parameters. Considering the novelty and uncertainties associated with this type of solution, water systems, such as the lake, considered in this study are being used as test/pilot locations: as the lake is artificial (sandpit), and high impact activities to the local ecosystem, such as sand extraction are still ongoing, it provides the ideal site for screening and assessing potential impacts before expansion to more sensitive locations.
The implementation of these projects in other (natural) water systems that are subject to water resources protection and planning, require the development of new policies and legislation that fit within existing water management frameworks such as the European Water Framework Directive (WFD) or nature protection objectives (Natura 2000), but also consider other environmental constraints and alignment with other water uses. A recent study [19] has provided guidance for licensing initiatives in the Netherlands for floating solar parks based on theoretical knowledge. It inventories existing legislation and regulations, provides a model/tool to assess the effects of floating solar parks on water quality and ecology, and proposes recommendations for additional practical research on this topic. There are no other established guidelines for mitigation actions or for the design and construction of this type of project.
The existing knowledge on the effects of floating solar panels on the Dutch environment is mostly based on literature and assumptions, which cannot answer all the questions from the authorities [19]. There are only a few studies that report findings based on in situ measurements, which encumbers the task of updating and adjusting legal policies and guidelines at the required rate to cope with industry developments. This is not surprising since this type of implementation is very recent. Most documents stress urgency for acquiring long term continuous monitoring from different disciplines, such as water quality or ecology (focusing on separate fields as birds and fish).
1.6. Potential Environmental Impacts Caused by Floating Solar Panels
Installing floating solar panels on surface water affects the water system, not only during the assembly and installation phases, but also during the lifetime of the parks [20,21]. With rapid implementation of innovations, and as the scale of this type of solution increases, there may be consequences to the environment (Table 1), such as blocking of sunlight, changes in ecosystems, reduction in photosynthesis, change in currents and wind patterns, reduction in evaporation, or leaching of substances/heavy metals [22]. Environmental impacts depend on the dimensions, design and proportions of the system in relation to the size of the surface water body, as well as the system characteristics of the water system (currents, tidal effects) and climatic conditions. Other studies have already addressed some of these aspects for other types of floating structures (e.g., floating houses, airports, or docks) [23,24,25,26,27].

Table 1.
Potential changes to ecosystems.
There is often no time (and budget) for thorough research into these effects on ecology and water quality, which could be negative or positive. A few studies have addressed the potential impacts of floating solar panels [28,29] and other types of structures, but often rely on models without validation with in situ data. A recent monitoring campaign in the Netherlands [15] did not detect significant changes in water quality parameters, such as total nitrogen, water temperature, total phosphorus, Chlorophyll-a or cyanobacteria concentrations, but does report changes in plant biomass and an increase in the frequency of hypoxia conditions (concentrations of dissolved oxygen lower than 6 mg/L). Water managers need a deep understanding of the effects to prevent water quality problems that may lead to, for example, algae blooms, loss of aquatic life, or unfavorable oxygen balances. Especially when dealing with water bodies that are used for recreation, these effects could have high economical and societal relevance. Research on this topic could contribute to providing design guidelines for new systems or to optimizing existing systems to minimize impacts or enhance certain aspects (e.g., to improve conditions for ecosystem development).
1.7. Objectives
The aim of this paper is to collect and analyze in situ data before and after construction of a large-scale floating solar park to understand how water quality and ecology are affected by a floating solar park, namely for key parameters such as temperature, dissolved oxygen or electrical conductivity. We address this issue by presenting continuous water quality data collected with permanent water quality sensors installed in the field, and by presenting data and underwater images from measurements using an underwater drone. The outcomes are relevant to shorten the knowledge gap needed for implementation of new policies regarding floating solar panels.
2. Materials and Methods
As there were no measurements available at this site before implementation, the measuring strategy was to measure and compare water quality at several depths at the center of the solar farm (underneath the panels/floater blocks) and at a reference location. The latter was located at open water, over 100 m away from the solar panels and, therefore, outside the influence of the floating solar system (Figure 2). To accomplish this, two sets of sensors were installed to measure water quality continuously at fixed locations. Additionally, separate measurements were performed with underwater drones at the same locations to obtain vertical profiles of the variation of water quality parameters (dissolved oxygen and temperature) with water depth.
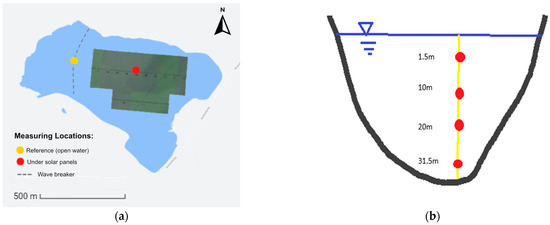
Figure 2.
(a) The points marked in the map indicate the position of the sensors (and of the underwater drone dives) at the center of the solar park (red point) and at open water/reference location (yellow point). The position of the solar panels on the lake is also illustrated in this Figure (approximately 30% cover of the total water surface), as well as the estimated position of the small wave breaker. (b) Vertical schematization of the different sensors positioned at different water depths.
2.1. Study Site
The Bomhofsplas lake is a deep sand extraction quarry/pit located northeast of the Dutch city Zwolle. The lake is surrounded by a polder and peat meadow landscape. The Bomhofsplas has a total of 63 ha and the water depth can reach up to 35 m in some places.
Installed between January and March 2020, the floating solar park at the Bomhofsplas is currently the largest floating solar park in Europe (Figure 1). It consists of 72,000 solar panels with a 27.4 MWp capacity (megawatt-peak), and covers an area of 18.25 ha, which corresponds to approximately 30% of the lake. It produces enough electricity for more than 7200 households.
The solar park is located at an artificial water lake where sand extraction activities are still ongoing. Due to the size of the solar park and high coverage of the water surface, it is a relevant case study for environmental monitoring, as it can contribute to a further understanding of potential effects. It can provide an indication on how water quality and ecology are disrupted in other locations under similar conditions, before the implementation in protected or natural water systems.
2.2. Continuous Measurements of Water Quality
Different sensors with built-in dataloggers for continuously monitoring water quality (Figure 3, Table 2) were used to measure temperature, electrical conductivity, and pressure. The data loggers were programmed to record measurements every 15 min, and the measurements were stored in the sensor’s internal memory. The sensors were placed at two different locations in the lake (Figure 2). The first monitoring point was situated at open water, and the second monitoring point was situated at the center of the floating solar park. Figure 2 shows the location of the two monitoring locations in relation to the position of the floating solar panels. At each monitoring point, the sensors were attached to a cable and positioned at the specified water depths (Table 3). In order to monitor seasonal fluctuations of water quality parameters, the sensors were installed in the field for a period of approximately 10 months, divided in two main periods from February–June and July–December 2020. During the interruption for maintenance the sensors were cleaned, re-calibrated and re-positioned in the field. Table 2 relates the different sensors to each location and measurement period. In addition to the temperature loggers, two electrical conductivity sensors and one dissolved oxygen sensor were available to be installed at the locations during the second measurement period. After retrieval of the sensors, the datasets were downloaded from the sensors and compared to determine differences that may indicate how the solar park is affecting the measured parameters in the lake. Paired t-test statistical analyses were performed to assess the significance of the differences between the data collected underneath the floating solar panels with data collected at open water. The tests were performed for each parameter for each depth position.
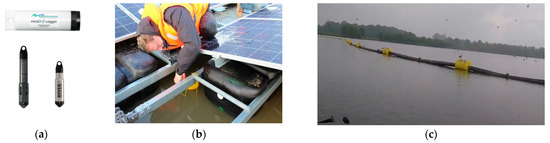
Figure 3.
Field installation of (a) water quality sensors: (b) under the floating panels and (c) at the open water/reference location: one of the yellow buoys (part of a wave breaker system) was used to attach the sensors.
Table 2.
Sensor information and number of sensors available at each location and monitoring period.
Table 3.
Indication of the initial and final depths of the sensors (monitoring in 2020).
2.3. Depth Profiles (Underwater Drone)
In addition to the continuous measurements of water quality, an unmanned underwater drone (ROV; Figure 4; [30]) was used to obtain vertical profiles of water quality parameters by performing dives at the same locations where the continuous sensors were installed (Figure 2). The same sensors that were installed permanently at the Bomhofsplas (Table 2) were integrated in the underwater drone and set for a measurement frequency of every 5 s (measurement of dissolved oxygen, temperature, electrical conductivity and pressure/depth). Similar to the continuous-measurements methodology, the strategy was to compare the depth profiles from dives at the open water reference location with dives under the floating solar panels. The drone was deployed from either a boat, or directly from the metallic walkways of the floating construction (Figure 4) and was remote controlled to slowly dive by steps (each depth was fixed for some time to allow the sensors to stabilize), both during the descend and when re-surfacing. In addition to the data collection, the aquatic drones were used to collect underwater images of beneath the floating panels. The underwater drone measurements were carried out at the moments of installation and retrieval of the continuous sensors (beginning and end of the monitoring periods).
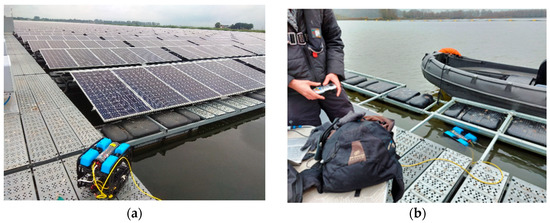
Figure 4.
Measurements with the underwater drone/ROV: (a) Impression of the underwater drone equipped with various sensors near the solar panels; (b) operation of the underwater drone from the floating platform to collect depth profiles and inspect the floater blocks.
2.4. Meteorological Data
As weather conditions affect water quality, local meteorological data were downloaded from the Royal Netherlands Meteorological Institute (KNMI) website (https://wow.knmi.nl/, accessed on 15 January 2021). The closest available station was at the Weblog Zwolle Centrum station, located at the Warmoesstraat in Zwolle (52.517206° N, 6.102916° E), 4.5 km away from the Lake Bomhofsplas. Parameters such as air temperature (°C), wind speed (m/s), precipitation intensity (mm/h), global radiation (W/m2), cloud cover (%) and relative humidity (%) data were available for download.
3. Results and Discussion
3.1. Continuous Measurements
The available data consist of two monitoring periods: Table 3 indicates the depth and coordinates at which the multiple sensors were positioned.
Figure 5 shows the position/depth of the different sensors as recorded by the sensors. The output of the pressure sensors was converted to depth estimations by subtracting a fixed atmospheric pressure value. Pressure data were only available from the sensors positioned within the first 12 m layer due to the range limitation of the sensors. The sensor placed at 9 m depth at the reference location showed high variation in its position, fluctuating within a water layer of almost 2 m (standard deviation of 0.45 at the reference point, compared to 0.09 for the data measured by the sensor positioned under the solar panels at the same water depth). This indicates the presence of wind-generated currents at open water that pushed the sensors/cable, causing changes to its position/depth. On the surface, this effect is not noticeable, as the length of the available cable to be displaced is small. This effect was not constant throughout the monitoring period, as there seems to be moments when the data fluctuate less (for example, around the 9th of September). A comparison with windspeed data reveals that indeed lower windspeeds were recorded around this period, which was surrounded by higher values before and after (peaks on 30 August and 8 October). The sensors located underneath the solar parks did not record pressure variations of this magnitude, suggesting that these sensors were sheltered from these currents and waves.
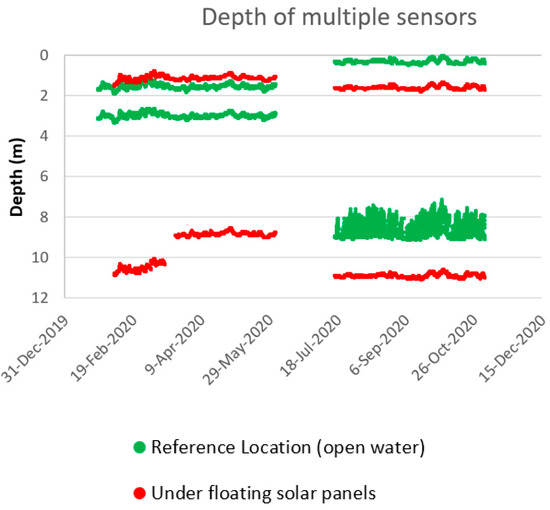
Figure 5.
Representation of the position/depth of the different sensors during the monitoring period.
Figure 6 shows the temperatures at different layers recorded by the sensors at multiple depths. The measured water quality parameters display similar behaviors at both locations. The temperature at the top layers of water is subject to seasonal variations, while the deeper layers remain stable throughout the year. The maximum detected temperature was higher at the reference location, reaching 26.6 °C, in comparison to the maximum under the solar park of 25.3 °C. The minimum temperatures recorded are similar: 6.1 °C at the reference location and 6.3 °C under the floating solar park.
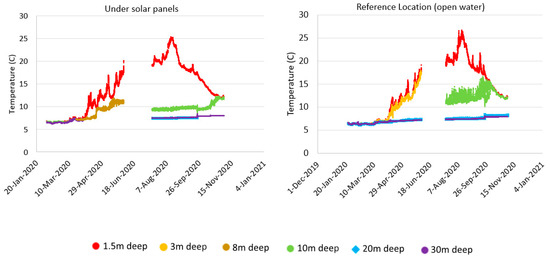
Figure 6.
Temperature at multiple water depths at each monitoring location.
Figure 7 shows direct comparisons between the data underneath the solar panels and at the reference location at specific water depths. Only the data from the second monitoring period were considered in this comparison, as more sensors with comparable depth levels were available. The results from the t-tests indicate that the differences between the measured parameters are statically significant with a 95% confidence level, and indicated high correlation factors (>0.98) for the pair of sensors placed at 1.5 m water depth and for the sensors placed near the bottom of the lake. The sensors placed at 10 m water depth showed no correlation between each other, while the sensors placed at 20 m water depth are considered moderately correlated with a factor higher than 0.5. Figure 7a shows that the solar panels mostly influence the peak values. There is a delay in the heating of water under the solar park and a reduction in the peak values, which can be attributed to the shading effect caused by the solar panels that block direct solar radiation. The temperature differences visible in Figure 7b could be due to the 2 m (depth) difference between the position of the two sensors. The strong fluctuation, which is due to the vertical changes in the position of the sensor (Figure 5), is in accordance with the position of the thermocline, as detected by the underwater drone (Section 3.2). Interestingly, this variation suddenly stops as the temperatures at both locations overlap, suggesting a better mixing of the water in this period. The data from the sensors placed at 20 m depth (Figure 7c) show very similar water temperature at both locations. However, the data from the reference location show more fluctuations, most likely due to oscillation of the vertical position of the sensors, as described in reference to Figure 5. At deeper layers (Figure 7d), the difference in temperature between the two locations is low, and it is likely due to the slight difference in depth between the two sensors (sensor under floating panels placed at 34 m against 31.5 m at open water).
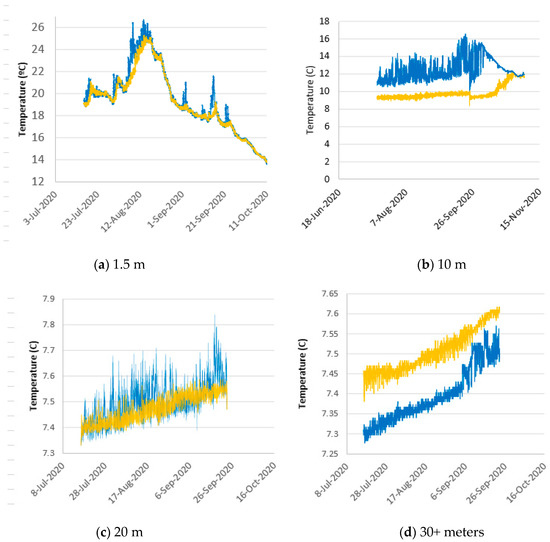
Figure 7.
Comparison between the temperature at the reference location and under the floating solar panels at specific water depths: (a) 1.5 m; (b) 10 m; (c) 20 m; (d) 30+ meters.
Figure 8 shows the evolution of meteorological data over the course of the monitoring campaign. The variation in the temperature of the water at both locations is in accordance with the meteorological data, remaining low (under 15 °C) and without much fluctuation during winter, until the temperature starts increasing in the spring (beginning of April). This is immediately visible in the data of the upper layers of water in the lake, with a similar behavior both under the solar panels and in open water. A similar pattern is also observed when temperatures start decreasing during the fall season.
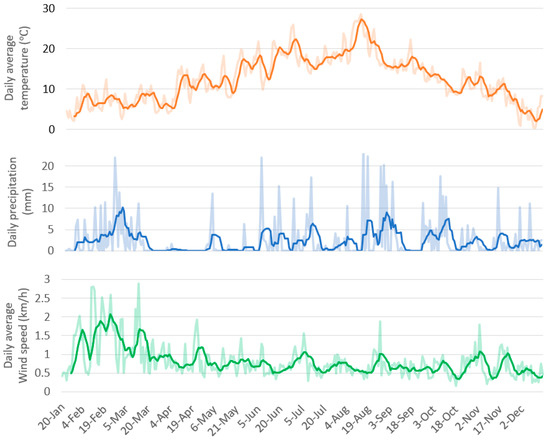
Figure 8.
Representation of meteorological data downloaded from Weblog Zwolle weather station. Daily precipitation values and daily average of windspeed and temperature are represented with opacity behind a 7-day moving average trendline.
From July till December 2020, in addition to the temperature sensors, two electrical conductivity sensors and a dissolved oxygen logger were installed at the study site, at around 1.5 m depth. Interestingly, Figure 9a shows that electrical conductivity is similar in both locations, but it is slightly higher at the reference point than underneath the solar park during most of the monitoring period. The correlation is high (0.939), and the differences are statistically significant. The data collected at open water also seem to be more stable than the values detected under the floating solar panels. Electrical conductivity values seem to show a correlation with air temperature (Figure 8), reaching a maximum value at the beginning of August, followed by a consistent decrease as colder months arrive. A sudden drop in electrical conductivity at the reference location in the beginning of September seems to follow a period of higher precipitation and lower temperatures. This decrease was not observed under the floating solar panels, indicating that the panels act as a buffer for sudden weather changes. Figure 9b shows dissolved oxygen concentrations and saturations under floating solar panels over a 5-month period. It can be observed that, although, there is some fluctuation, dissolved oxygen levels remain at healthy levels during the monitoring period [1], never decreasing from a minimum concentration of 6.48 mg and of 65.87% saturation.
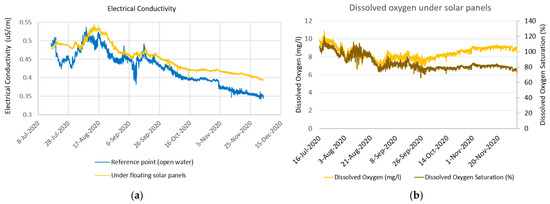
Figure 9.
Water quality data from the period between July and December 2020: (a) comparison between electrical conductivity at the reference point and under the solar park (b) dissolved oxygen levels (concentration and saturation) under floating solar panels.
3.2. Depth Profiles
The resulting profiles of water quality (averages within each depth interval) obtained with the underwater drone are represented in Figure 10. The first dives at the beginning of the monitoring campaign during the winter show little variation in the water quality parameters with depth. The vertical profiles of both locations follow similar patterns, with the higher difference recorded for dissolved oxygen concentrations, which was, on average, 1.1 mg/L lower under the floating solar panels during winter, and 1.7 mg/L lower during the summer. This small difference could be due to the fact that the dives were performed 10 days apart. The profiles obtained during the summer months (Figure 10) show that all three parameters rapidly decrease in the first 6–8 m from higher values near the surface. The temperature of the water then remains stable through the deeper layers of the lake. Dissolved oxygen concentrations seem to have different layers along the water depth, which is consistent with the seasonal stratification in lakes. It reaches its lower value at maximum water depth. Electrical conductivity seems to slightly increase near the bottom of the lake (more visible under the floating solar panels), which could be due to the underwater drone reaching the sediments. The main difference between the data from und er the solar panels and the reference point is that dissolved oxygen concentrations were lower under the floating solar park (reaches 4.6 mg/L) than in open water (minimum of 6 mg/L).
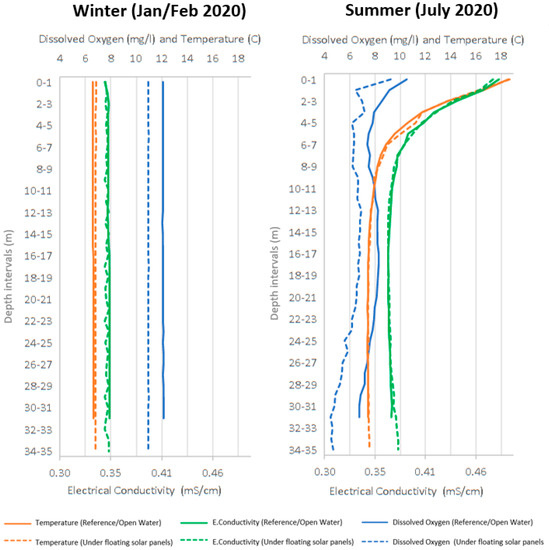
Figure 10.
Depth profiles of different water quality parameters captured by an underwater drone in different seasons for both situations under floating solar panels and in open water (reference location). Values represent average values for each depth interval.
3.3. Underwater Images
In addition to the water quality data, the underwater drones also provided underwater images from underneath the floating solar panels (Figure 11, Video S1). The quality of the images was poor (less than 1 m visibility), when compared to other locations in the Netherlands [30], due to high water turbidity caused by ongoing dredging activities. An additional dive with the underwater drone was performed in December when the water was clearer. Although the solar park had only been placed on the water for approximately 4–5 months, a thin layer of biofouling was visible during the summer. In December 2020 (9 months after construction) small bivalves were already covering most of the submerged part of the plastic floater blocks.
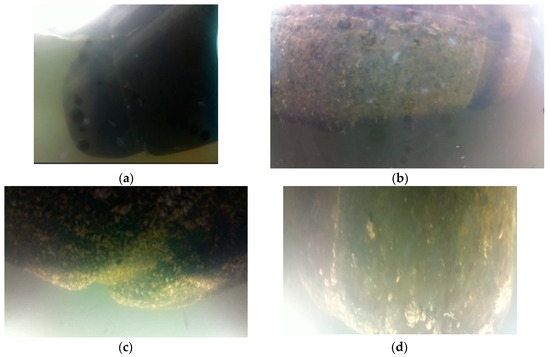
Figure 11.
Underwater image of the floater blocks that support the solar panels. Only a few months after installation, the floater blocks were covered with biofouling and small bivalves: (a) February 2020, with the park still under construction no biofouling is visible on the black floater blocks; (b) July 2020, thin layer of biofouling is visible; (c,d) December 2020, small bivalves are covering most of the submerged part of the floater blocks.
3.4. Field Observations and Challenges
Several birds were visible on the platforms and between the solar panels during the measurements. While walking on the floating structure, birds/ducks could occasionally also be heard underneath the floating solar panels, suggesting that they use this sheltered space to build nests and rest. It was noticeable that the part of the solar park located closer to open water (west part) was covered by droppings of birds (Figure 12a), while the remaining part of the solar panels was less affected. The coverage of the panels with bird droppings may reduce the efficiency of the solar panels [15]. It can also have a deteriorating influence on the water quality as it may lead to higher nutrient levels in the area, due to flushing after rainfall events. A novel technology based on ultrasounds has been installed as a trial measure to reduce the presence of birds at this location.
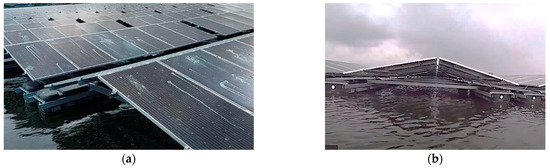
Figure 12.
Solar panels: (a) top view of the west section of the solar park with the solar panels covered by droppings from birds; (b) view from the side of the triangular metal structure that supports the floating panels: wind and light is able to penetrate under the floating panels.
Finally, it was observed that, despite being more sheltered than open water, wind is still present underneath the floating solar panels, which seems sufficient to ensure adequate aeration and allow for air–water interactions. Additionally, it is also possible that light is still able to reach the water surface under the solar panels (Figure 12b), suggesting that only a percentage of the light is being blocked by the floating park.
When the sensors were installed in February 2020 the solar park was still under construction. This led to the platform where the sensors were placed to be moved after a few months, causing the cable to get tangled (Figure 13a) and therefore changing the depth and position of the sensors and leading to data loss. At the reference point, the wave barrier buoy where the sensors were installed also drifted away due to strong waves generated during a storm. During the summer, this situation was detected, and the sensors were re-installed. The sensors positioned at the top layers were covered by biofouling (Figure 13b) after a few months and required maintenance/cleaning.
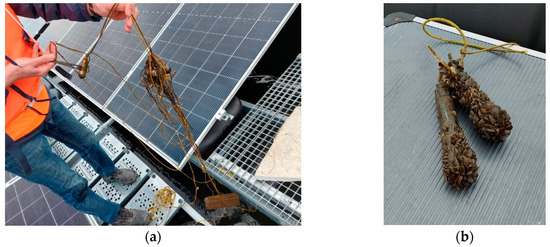
Figure 13.
(a) Biofouling on sensors after 5 months of measurements in situ; (b) the sensors were installed in an under-construction site which led to the floating solar panels being moved and the cable of the sensors getting tangled.
4. Conclusions
The assessment of environmental impacts caused by floating structures is a complex subject, as it involves interaction between different components of the water system, ecosystems and human activities. The measurement campaign presented in this study consists of a first screening/investigation of the potential impacts on a few basic water quality parameters. The presented data are not sufficient for a thorough assessment of environmental impacts, which would require the monitoring of biological and chemical parameters and the evaluation of ecological indicators.
This study compared different water quality parameters below floating solar panels with a location away from the platforms. The data were collected at the largest floating solar park in Europe (Lake Bomhofsplas). Similar values were measured at the two locations with strong correlation at most of the measured water depths, although statistically significant differences were detected: electrical conductivity was, on average, 0.03 mS/cm lower at open water (difference of 6.6%), and the temperature was approximately 3.3% higher underneath the floating solar panels (0.4 ℃ difference measured at the surface, and 0.2 ℃ at deeper water layers). The data followed clear seasonal and day/night variations and was in accordance with meteorological data. The variation with depth, as assessed by the underwater drone, resulted in depth profiles with similar behavior (and values) of the various parameters. The differences in dissolved oxygen concentrations across the complete water column were, on average, 1.1 mg/L lower under the solar panels during winter, and 1.7 mg/L during the summer (reaching a difference of 28% for the latter). The results showed no major differences in the measured key water quality parameters below the solar panels, such as temperature or dissolved oxygen. This was also previously observed for (small) floating homes at various measurement locations [6,7,8,9]. The temperature at the upper layers was lower under the solar panels, and there were less temperature fluctuations detected. It has been observed that there is a time difference between temperature peaks in surface water below the solar farm. It takes longer for the water under the panels to warm up or cool down. These results are likely the result of a shading effect created by the solar panels, as well as a sheltering effect that restricts wind action, currents or reduced raindrop impact on the water surface, but further studies are needed to assess these drivers. It was observed that the floating photovoltaic design used in this study location still allows wind and a percentage of sunlight to reach the water surface under the floating solar panels, suggesting that different designs would affect the water system differently. The biofouling layer and colonization by bivalves that developed on the platforms over a short period of time (visible in the underwater images), as well as the strong presence of birds, shows potential to combine this type of floating structures with ecological and biodiversity enhancement measures.
The techniques used, which included the use of multiparameter sondes/data-loggers and underwater drones for visual inspections and for obtaining depth profiles of water quality, provided useful insights into basic water quality parameters and the biofouling coverage of the floating units. The research team had to face different field challenges, such as loss of equipment, moving of platforms due to ongoing construction works, or biofouling growth on sensors. Occasional checking/maintenance is recommended after a few months. The operation of the underwater drone under floating solar parks is feasible, but requires knowledge about the location and characteristics of the mooring system to avoid the entanglement of the tether. The lack of visibility (turbidity) complicates the navigation of the underwater vehicle, and reduces the quality of the underwater images.
Further research is still needed to achieve a better understanding of the effect of (different configurations of) floating solar panels on water quality at various locations and under different conditions. This study considered a single solar park that is located in a sandpit, and used a specific type of floating design that allows light to reach the water surface under the solar panels. Additional monitoring campaigns that (i) collect longer datasets of several years (before/baseline and after implementation of the solar parks); (ii) consider a wider list of parameters; (iii) provide information at more points within the water system; (iv) include other locations with different characteristics and designs, are key to further understanding aquatic processes and assess the potential impact of this type of infrastructure. When combined with modelling studies, they can support licensing and policy-making activities and establishing of guidelines for design, implementation and management of floating infrastructure and, therefore, to maintain a healthy environment and promote sustainable energy transition. The deployment of cost-effective monitoring methods that use clever and remote/automated measuring devices (e.g., unmanned aquatic drones/ROV used in this project) plays an increasingly important role in asset management and in sustainable water management and planning activities.
Supplementary Materials
The following are available online at https://www.mdpi.com/article/10.3390/su13116421/s1, Video S1: Impression of floating solar park and underwater images.
Author Contributions
All listed authors have contributed substantially to the work, namely: conceptualization, F.C.B., R.L.P.d.L. and. F.-Y.L.; methodology, R.L.P.d.L., F.C.B. and O.A.; formal analysis, R.L.P.d.L., K.P.; fieldwork activities R.L.P.d.L., K.P., O.A. and F.C.B.; fieldwork coordination, R.L.P.d.L., K.P., O.A.; writing—original draft preparation, R.L.P.d.L. and K.P.; writing—review and editing, R.L.P.d.L., F.C.B., F.-Y.L. and K.P.; funding acquisition, F.C.B.; supervision, F.C.B., F.-Y.L. and O.A. All authors have read and agreed to the published version of the manuscript.
Funding
This research was funded by Regieorgaan SIA (KIEM-hbo project entitled Drijvende zonnepanelen), Hanze Hogeschool, Indymo, Waterschap Noorderzijlvest and Solarplaza.
Institutional Review Board Statement
Not applicable.
Informed Consent Statement
Not applicable.
Data Availability Statement
All the data of the study are presented within the manuscript.
Acknowledgments
The authors would like to thank Willem Biesheuvel (Groenleven) for his help in accessing the floating solar park for conducting the measurements, and for providing background information about the design and operation of the solar panels.
Conflicts of Interest
The authors declare no conflict of interest.
References
- European Union Water Framework Directive. Available online: https://ec.europa.eu/environment/water/water-framework/info/intro_en.htm (accessed on 31 January 2021).
- Unie van Waterschappen Kaders Voor Invulling Krw-Doelen in de Derde Stroomgebiedbeheeplannen, Bestuurlijke Notitie (Administrative Memorandum: TARGETS and Frameworks for River Basin Management Plans). Available online: https://www.uvw.nl/wp-content/uploads/2018/05/KRW-18-04-kaders-KRW-doelen-bestuurlijke-notitie-vastgesteld-Stuurgroep-Water-4-april.pdf?x36965 (accessed on 31 January 2021).
- Zanon, B.D.B.; Roeffen, B.; Czapiewska, K.; Dinther, R.D.G.-V.; Mooij, P. Potential of floating production for delta and coastal cities. J. Clean. Prod. 2017, 151, 10–20. [Google Scholar] [CrossRef]
- World Bank Group, ESMAP and SERIS. Where Sun Meets Water: Floating Solar Market Report; World Bank: Washington, DC, USA, 2019. [Google Scholar]
- Sahu, A.; Yadav, N.; Sudhakar, K. Floating photovoltaic power plant: A review. Renew. Sustain. Energy Rev. 2016, 66, 815–824. [Google Scholar] [CrossRef]
- Liu, H.; Kumar, A.; Reindl, T. The Dawn of Floating Solar—Technology, Benefits, and Challenges. In Lecture Notes in Civil Engineering; Springer: Singapore, 2020; Volume 41, pp. 373–383. [Google Scholar]
- Abid, M.; Abid, Z.; Sagin, J.; Murtaza, R.; Sarbassov, D.; Shabbir, M. Prospects of floating photovoltaic technology and its implementation in Central and South Asian Countries. Int. J. Environ. Sci. Technol. 2019, 16, 1755–1762. [Google Scholar] [CrossRef]
- Maués, J.A. Floating solar PV-hydroelectric power plants in Brazil: Energy storage solution with great application potential. Int. J. Energy Prod. Manag. 2019, 4, 40–52. [Google Scholar] [CrossRef]
- Solarplaza. Comprehensive Overview of 120 + Global Floating Solar Plants; Floating Solar Conference 2019: Amsterdam, The Netherlands, 2019. [Google Scholar]
- Solarplaza. Top 50 Operational Floating Solar Projects 2021; Floating Solar Plaza: Amsterdam, The Netherlands, 2021. [Google Scholar]
- RechargeNews ‘World’s Largest Floating Solar Plant Outside China’ Ready in Weeks after ‘Record’ Build|Recharge. Available online: https://www.rechargenews.com/transition/worlds-largest-floating-solar-plant-outside-china-ready-in-weeks-after-record-build/2-1-754179 (accessed on 31 January 2021).
- Restemeyer, B.; Boogaard, F.C. Potentials and pitfalls of mapping nature-based solutions with the online citizen science platform climatescan. Land 2021, 10, 5. [Google Scholar] [CrossRef]
- Cagle, A.E.; Armstrong, A.; Exley, G.; Grodsky, S.M.; Macknick, J.; Sherwin, J.; Hernandez, R.R. The land sparing, water surface use efficiency, and water surface transformation of floating photovoltaic solar energy installations. Sustainability 2020, 12, 8154. [Google Scholar] [CrossRef]
- Choi, Y.K. A study on power generation analysis of floating PV system considering environmental impact. Int. J. Softw. Eng. Its Appl. 2014, 8, 75–84. [Google Scholar] [CrossRef]
- Ziar, H.; Prudon, B.; Lin, F.Y.; Roeffen, B.; Heijkoop, D.; Stark, T.; Teurlincx, S.; de Senerpont Domis, L.; Goma, E.G.; Extebarria, J.G.; et al. Innovative floating bifacial photovoltaic solutions for inland water areas. Prog. Photovolt. Res. Appl. 2020. [Google Scholar] [CrossRef]
- Gorjian, S.; Sharon, H.; Ebadi, H.; Kant, K.; Scavo, F.B.; Tina, G.M. Recent technical advancements, economics and environmental impacts of floating photovoltaic solar energy conversion systems. J. Clean. Prod. 2021, 278, 124285. [Google Scholar] [CrossRef]
- TNO Prognosis of Cummulative Installed Energy Capacity of Floating Solar Parks in The Netherlands. Available online: https://www.tno.nl/nl/aandachtsgebieden/energietransitie/roadmaps/hernieuwbare-elektriciteit/zonne-energie/zonnepark/drijvend-zonnepark/ (accessed on 26 February 2021).
- Zon op Water Nationaal Consortium Zon op Water. Available online: https://zonopwater.nl/home (accessed on 26 February 2021).
- Loos, S.; Wortelboer, R. Handreiking Voor Drijvende Zonneparken op Water (Guide for Floating Solar Parks on Water); STOWA: Amersfoort, The Netherlands, 2018. [Google Scholar]
- Costa, S.G. Impactos Ambientais de Sistemas Fotovoltaicos Flutuantes (Environmental Impacts of Floating Solar Panels). Master’s Thesis, University of Lisbon, Lisbon, Portugal, 2017; p. 83. [Google Scholar]
- Pimentel Da Silva, G.D.; Branco, D.A.C. Is floating photovoltaic better than conventional photovoltaic? Assessing environmental impacts. Impact Assess. Proj. Apprais. 2018, 36, 390–400. [Google Scholar] [CrossRef]
- Mathijssen, D.; Hofs, B.; Spierenburg-Sack, E.; Vanasperen, R.; Vanderwal, B.; Vreeburg, J.; Ketelaars, H. Potential impact of floating solar panels on water quality in reservoirs; pathogens and leaching. Water Pract. Technol. 2020, 15, 807–811. [Google Scholar] [CrossRef]
- Kitazawa, D.; Tabeta, S.; Fujino, M.; Kato, T. Assessment of environmental variations caused by a very large floating structure in a semi-closed bay. Environ. Monit. Assess. 2010, 165, 461–474. [Google Scholar] [CrossRef] [PubMed]
- de Lima, R.; Boogaard, F.; de Graaf, R.; Pires, M.D.; Sazonov, V. Monitoring the Impacts of Floating Structures on the Water Quality and Ecology Using an Underwater Drone. In Proceedings of the IAHR World Congress, The Hague, The Netherlands, 28 June–3 July 2015; p. 4. [Google Scholar]
- Härtwich, H. The Impact of Floating Platforms on the Benthic Community Structure in Dutch Freshwater Ecosystems. Master’s Thesis, University of Amsterdam, Amsterdam, The Netherlands, 2016. [Google Scholar]
- Lenz, J. Impact Assessment of Floating Houses on Water Temperature and Dissolved Oxygen in Himpenser Wielen, Leeuwarden (Netherlands). Master’s Thesis, Freie Universität Berlin, Berlin, Germany, 2018. [Google Scholar]
- Alexander, C.; Robinson, M. Assessing the Impacts of Floating Docks on Bottom Character and Benthic Productivity in Coastal Georgia; Georgia Department of Natural Resources: Brunswick, GA, USA, 2006. [Google Scholar]
- Haas, J.; Khalighi, J.; de la Fuente, A.; Gerbersdorf, S.U.; Nowak, W.; Chen, P.J. Floating photovoltaic plants: Ecological impacts versus hydropower operation flexibility. Energy Convers. Manag. 2020, 206, 112414. [Google Scholar] [CrossRef]
- Armstrong, A.; Page, T.; Thackeray, S.J.; Hernandez, R.R.; Jones, I.D. Integrating environmental understanding into freshwater floatovoltaic deployment using an effects hierarchy and decision trees. Environ. Res. Lett. 2020, 15, 114055. [Google Scholar] [CrossRef]
- de Lima, R.L.P.; Boogaard, F.C.; de Graaf-Van Dinther, R.E. Innovative dynamic water quality and ecology monitoring to assess about floating urbanization environmental impacts and opportunities. In Proceedings of the International Water Week, Amsterdam, The Netherlands, 5 November 2015. [Google Scholar]
Publisher’s Note: MDPI stays neutral with regard to jurisdictional claims in published maps and institutional affiliations. |
© 2021 by the authors. Licensee MDPI, Basel, Switzerland. This article is an open access article distributed under the terms and conditions of the Creative Commons Attribution (CC BY) license (https://creativecommons.org/licenses/by/4.0/).