Abstract
For the purpose of bioenergy production, biomass cropping on marginal land is an appropriate method. Less consideration has been given to estimating the marginal land in cities at a fine spatial resolution, especially in China. Marginal land within cities has great potential for bioenergy production. Therefore, in this research, the urban marginal land of 20 representative cities of China was estimated by using detailed land-cover and 3D building morphology information derived from Ziyuan-3 high-resolution remote sensing imagery, and ancillary geographical data, including land use, soil type, and digital elevation model data. We then classified the urban marginal land into “vacant land” and “land between buildings”, and further revealed its landscape patterns. Our results showed that: (1) the suitable marginal land area ranged from 17.78 ± 1.66 km2 to 353.48 ± 54.19 km2 among the 20 cities; (2) it was estimated that bioethanol production on marginal land could amount to 0.005–0.13 mT, corresponding to bioenergy of 2.1 × 10¹³–4.0 × 10¹⁴ J for one city; (3) from the landscape viewpoint, the marginal landscape pattern tended to be more fragmented in more developed cities. Our results will help urban planners to reclaim unused urban land and develop distributed bioenergy projects at the city scale.
1. Introduction
Energy supports global economic growth and industrialization [1,2]. Alongside the increasing energy demand, a continuous depletion of fossil energy resources has been witnessed, resulting in worldwide environmental and health risks such as global warming and air pollution [1,3]. Climate change and energy security are the major driving forces for the promotion of renewable energy [3,4]. As an important source of feedstock for renewable energy, bioenergy is now attracting great interest [5,6], and may be one of the most promising options for addressing the issues related to energy and food security, climate change, and environmental protection [2,7,8]. Global biofuel production has more than doubled over the last decade, amounting to 1.43 × 10¹¹ L in 2017 [9]. For the purpose of biofuel production, a number of lands have been reclaimed for biomass crop growth. However, the competition between biomass and food production in prime agricultural land has limited bioenergy development [10]. In this context, marginal land has been considered as a potential alternative to food-based productive land, to resolve the land-use competition between food and fuel [11].
With the wide range of definitions of “marginal land” seen in many studies, marginal land may include vacant land, bare land, or degraded land with poor physical and chemical soil properties and low crop production potential [2,12]. It can also be categorized as “land that can be used for agricultural activities but with low crop productions; has relatively poor natural conditions; possesses limited economic and varied developmental potential; and is capable of growing energy crops with minimal impact on the environment” [12,13,14,15]. Marginal land has been estimated at both national and local levels [11,16]. Depending on the different scales and resolutions, there are a number of methods that can be used for the identification of potential marginal land. At the national level, low- and medium-resolution land-use/land-cover data, as well as other ancillary data (e.g., rainfall, soil, terrain) processed with geographic information system (GIS) software, are usually used for marginal land estimation. For instance, the assessment of potential biomass resources on marginal land in the scale of countries or continents has been conducted based on 1-km resolution data of land use, rainfall, soil type, etc. [14,17,18,19,20]. Specifically, Milbrandt et al. [14] estimated that there was about 86.5 million hectares (M ha) of marginal land in the United States, representing about 11% of the U.S. mainland. Approximately 8 M ha of marginal land in China was found to be suitable for growing miscanthus by Xue et al. [17], which is one of the high biomass production energy crops, and over 40 M ha of marginal land was identified as being suitable for biomass and biofuel production by Zhuang et al. [18]. It has also been reported that 39.24 M ha of wasteland in India is available for bioenergy production [19]. In addition, at the continental scale, it has been reported that Africa, Europe, and South America have 66–481 M ha of potential marginal land for biomass cropping under different land-cover scenarios, which equates to 10–55% of the global liquid fuel consumption [20]. On the other hand, at the local level, Feng et al. [8,21] employed 30-m resolution data for estimating total bioenergy resources at the watershed and regional scales. Marginal land suitability in the Upper Mississippi River Basin for biofeedstock crops was obtained, and their results demonstrated that 60% of the marginal land was suitable for the growth of energy crops.
Since world energy consumption is mainly concentrated in urban areas [22,23], reclaiming marginal land and growing biomass crops at the city or municipal scale can alleviate the rapid increase of inhabitant energy demand, and can support energy self-reliance, to decrease the overreliance of local communities on imported energy [24]. Short-distance biofeedstock transportation routes can also reduce delivery costs, and ensure the overall sustainability of urban bioenergy generation and utilization [23,25,26]. In addition, biomass cultivation on urban marginal land can be used for road buffer establishment to address issues such as noise, pollution, and odor [27,28]. Energy crops can also be sustainably grown in vacant, blighted, or abandoned land, to generate green energy for small-scale heat or electricity production [29]. In addition, it should be noticed that a lot of cities have developed urban agriculture, which refers to the livestock production and cultivation of food and fuel crops in urbanized areas, which can be directly used for market or household purposes [30,31]. From the perspective of the definition of urban agriculture, the aforementioned distributed biomass cropping on urban marginal land could be an important part of urban agriculture. In this context, the development of urban agriculture could provide implementation conditions for urban marginal land if the possible conflicts of the competition between biomass and food production in urban land can be coordinated.
Saha and Eckelman [16,28] conducted parcel-level screening to map the urban marginal land in Boston and other 101 cities and towns in Eastern Massachusetts by the use of high-resolution land parcels and soil quality data. The results showed that 0.5–1.1 million tons (mT) of biomass could be produced on urban marginal land, which might yield up to 6.4–22 PJ and contribute a maximum of 50% to current biomass primary energy use in Massachusetts. Niblick et al. [29] found that about 3500 ha of the marginal land in the city could be sustainably cultivated for sunflowers in an urban land study of Pittsburgh, and up to 1.29 × 10⁵ L of biodiesel could be produced.
A number of studies have documented marginal land estimates for China, and the estimated area of marginal land that could be reclaimed for biofuel development has ranged from 3 to 100 M ha [2,32,33,34]. For example, a national assessment integrating coarse-resolution data (e.g., land-use and temperature data with a 1-km resolution) identified approximately 49.65 M ha of marginal land that was suitable for sweet sorghum growth [32]. At smaller scales, a regional study in Guangdong province, China, using land-use/land-cover classification data of 30-m resolution estimated that about 25,400 km2 of marginal land could be cultivated for biomass cropping [33]. However, although some relevant studies have been conducted for China, limitations still exist. Firstly, most of these studies have been based on medium- or low-resolution data [32,33,34], and less consideration has been given to estimating marginal land at a fine spatial resolution. Furthermore, the studies of marginal land identification have rarely used high-resolution land-cover/use and three-dimensional (3D) building height information. In particular, there have been very few reports on the detection of marginal land in China by the use of high-resolution data. High-resolution land-cover data have the potential to capture marginal land more precisely. The 3D urban morphology has a great impact on the growth of energy crops (e.g., illumination time, temperature) [16] and, hence, affects biomass production. Lastly, the existing studies have tended to map marginal land in a city or metropolitan area [16,27,28,29,35,36]; however, observations, results, and conclusions for a large number of cities with different natural and social conditions are still lacking. In this context, it is therefore worth investigating urban marginal land with high-resolution urban land-cover data and 3D urban morphology data. In addition, urban marginal land, as an element of the urban landscape, has different properties and functions, so that urban marginal land classification with urban land-cover and 3D building information may facilitate a better understanding of the utilization of urban marginal land.
As mentioned above, research on urban marginal land detection in China at finer scales is still lacking. Furthermore, few considerations have been given to the observations, results, and conclusions for a large number of cities with different natural and social conditions, and the general nature of the urban marginal land remains unknown. Consequently, in this study, to address the aforementioned research questions, we attempted to use Ziyuan-3 (ZY-3) satellite data for precise urban marginal land detection over 20 major cities of China. The ZY-3 satellite is China’s first civilian high-resolution stereo mapping satellite [37]. It carries one multispectral scanner (5.8 m) and three panchromatic multi-view cameras, including forward (3.5 m), backward (3.5 m), and nadir (2.1 m) modes. This unique imaging approach can provide high-resolution orthographic images and multi-view images covering large geographic areas for precise 3D urban land-cover mapping [38].
To the best of our knowledge, this is the first study to assess the potential marginal land that could be used for bioenergy production at the urban scale in representative cities of China with different natural and social conditions by the use of multi-view high-resolution remote sensing data. Moreover, it is also the first attempt to identify the categories of marginal land (i.e., vacant land and land between buildings). Therefore, the results of this study will help policy makers and city planners to develop bioenergy projects at the city scale, and will also contribute to the reasonable planning of urban vacant land and the production of green energy.
2. Materials and Methods
2.1. Study Areas
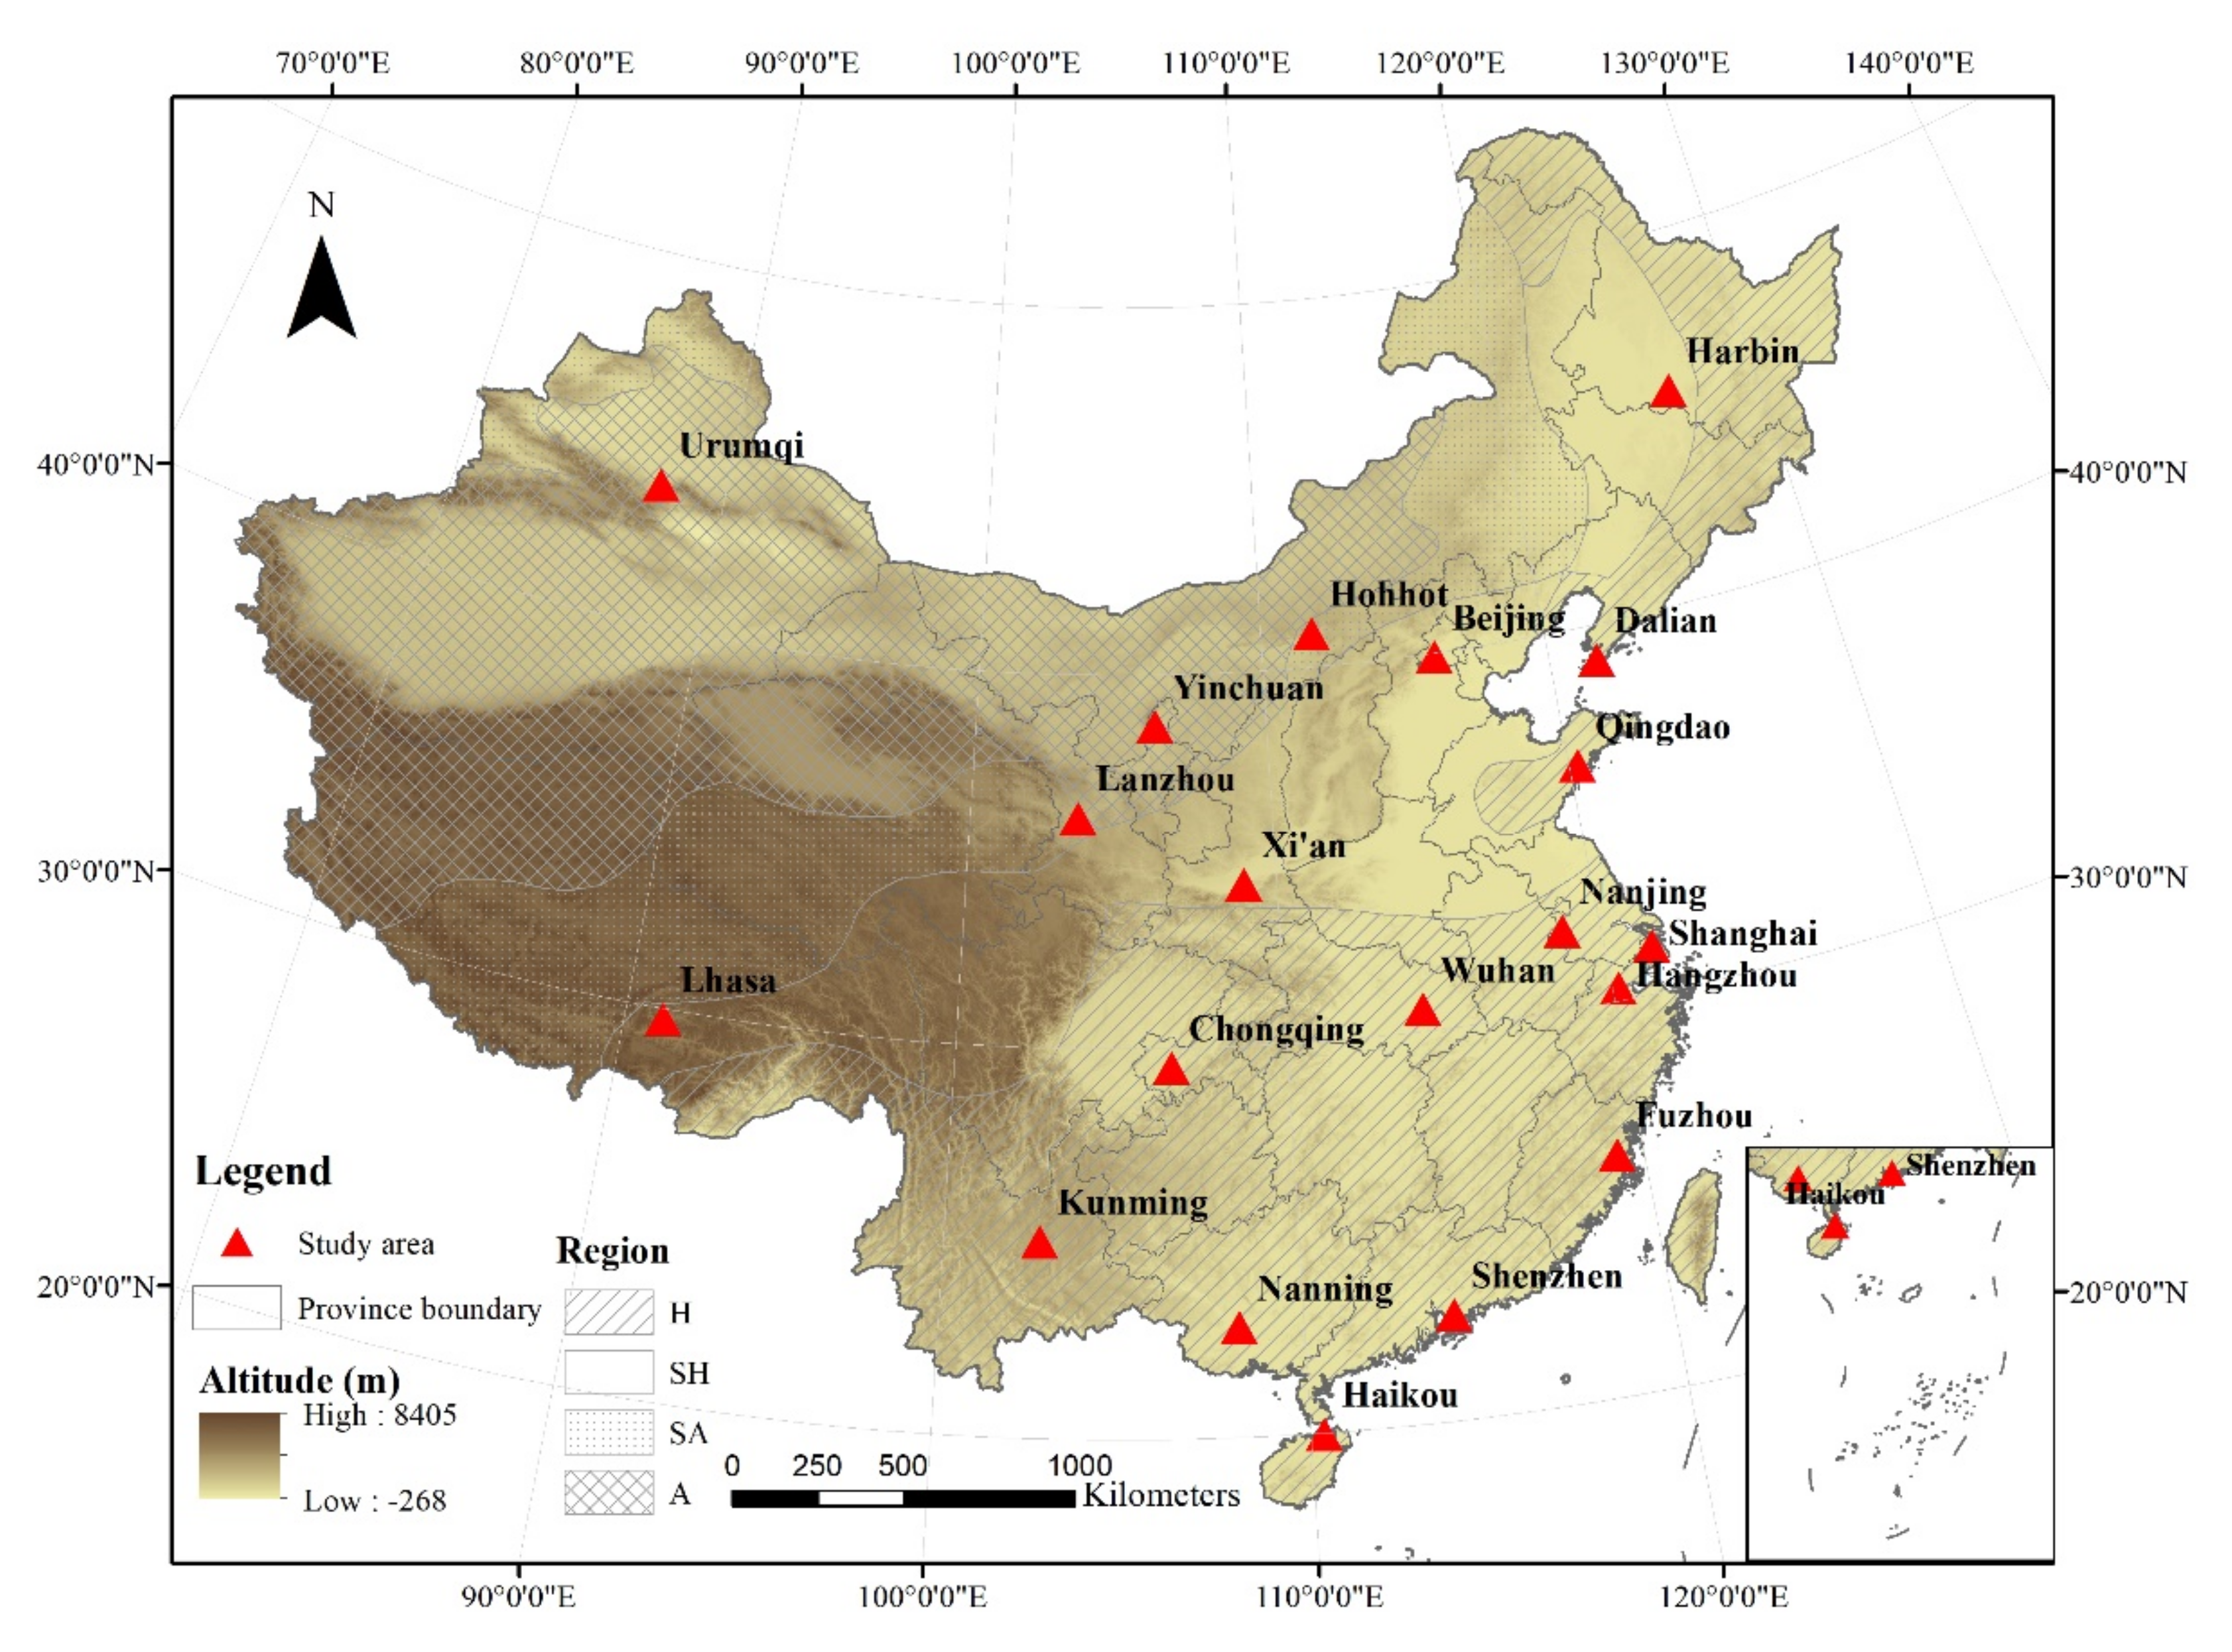
The 20 major cities of China were selected as our study areas due to their representativeness in climate, topography, and economic development (Figure 1). These cities contain 17 municipalities or provincial capitals, as well as three other major cities, most of which are the economic, trade, and industrial focal points of China’s major provinces. Moreover, the study areas represent diverse urban landscapes, including plains (e.g., Wuhan, Hangzhou), mountains (e.g., Chongqing, Urumqi), plateaus (e.g., Lanzhou, Lhasa), coastal areas (e.g., Haikou, Qingdao), and inland areas (e.g., Beijing).
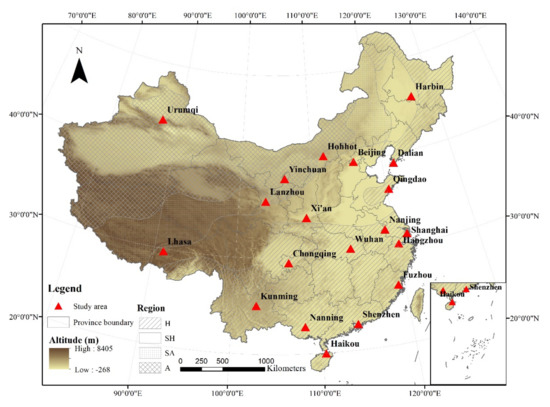
Figure 1.
Location of the 20 major cities in China, with the background map representing the topography. The four climatic zones (e.g., humid—H, semi humid—SH, semiarid—SA, and arid—A) are also indicated.
2.2. Data
ZY-3 3D land-cover products, including land-cover classification maps, ZY-3 pan-sharpened images, and building height maps, were used to identify initial potential marginal land and to screen the crop growth environment. High-resolution land-cover classification was conducted by integrating ZY-3 images and other geographical data, including A-map, Map World, and OpenStreetMap (OSM) road networks data [39]. A-map and Map World provide web map services for China, and the data can be used to extract buildings footprints, roads, and water areas. OSM provides a free, open-source, and editable map service. The land-cover maps contain seven categories: grass/shrubs, trees, bare soil, buildings, water, roads, and other impervious surface areas (OISA) (e.g., airports, squares, pavements). Four steps were adopted for the land-cover mapping: (1) buildings were extracted from the A-map and Map World data; (2) roads were identified by the use of the OSM and Map World data; (3) water was extracted from the Map World data; and (4) the normalized difference vegetation index (NDVI), normalized difference water index (NDWI), and spectral features (brightness, size, and hue) were calculated as features, which were subsequently input into a Random Forest (RF) classifier to classify the remaining areas into grass/shrubs, trees, water, soil, and OISA. An example of a land-cover map is presented in Figure 2a. More detailed information about ZY-3 land-cover classification can be found in [37,39].
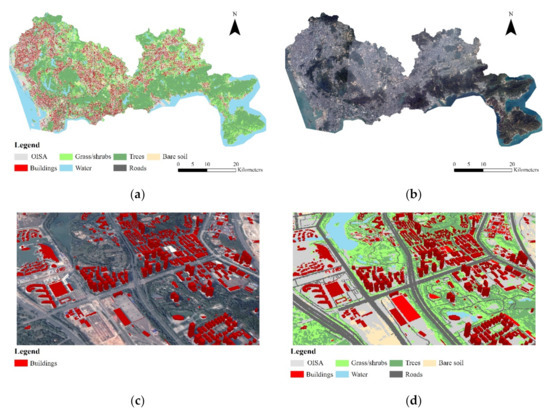
Figure 2.
Examples of ZY-3 3D land cover products: (a) land cover classification map; (b) ZY-3 pan-sharpened image; (c) building height map; (d) ZY-3 3D land cover map.
ZY-3 pan-sharpened images (Figure 2b) were used for further manual editing and accuracy assessment. The processing steps included ortho-rectification, registration, and pan-sharpening. The multi-spectral bands were registered to the panchromatic NAD (nadir-view) image. The multi-spectral images and panchromatic NAD images were then fused by Gram-Schmidt spectral sharpening to obtain the pan-sharpened images.
Building height was calculated in three steps: (1) a digital surface model (DSM) was generated by ZY-3 nadir (NAD) and forward (FWD) images by the use of semi-global matching (SGM) [40]; (2) the normalized DSM (nDSM) was computed by using morphological top-hat by reconstruction of the DSM, and can be regarded as the height of the off-terrain objects [40]; and (3) a building height map of the whole region was obtained by integrating the nDSM and building height information obtained from A-map and Map World. An example of a building height map is shown in Figure 2c.
ZY-3 3D land-cover products have a high resolution (2.1 m) and satisfactory accuracy, with the overall accuracy (OA) of the land-cover classification being 88.33%, and the root-mean-square error (RMSE) of the building height being 7.89 m.
Ancillary geographical information data were also used to facilitate the screening of urban marginal land, including land use, soil type, and DEM. Specifically, the China Land Use/Cover Datasets [41] (CLUDs, derived from Landsat TM/ETM/OLI and HJ-1A/1B imagery with a spatial resolution of 30 m) for 2015 were used to eliminate unsuitable land-use types. The CLUDs have six categories (farmland, woodland, grassland, water, urban and rural settlements, and unutilized land) and 25 subtypes (e.g., shrub land, saline). A detailed description of the CLUDs can be found in [42]. Soil type data, which record the spatial distribution of the soil types and attributes in China, can be utilized to examine the soil quality of the marginal land. Detailed information about soil type and properties can be found in the Geographical Information Monitoring Cloud Platform (GIM Cloud) [43] and the China Soil Database [44]. The Advanced Spaceborne Thermal Emission and Reflection Radiometer (ASTER) Global Digital Elevation Model (GDEM) [45] is an accurate global DEM dataset with a resolution of 30 m. It has the highest resolution among the freely accessible global DEMs [46] and can help us to examine the effects of topography for biomass cropping. In addition, the urban areas of the 20 cities in our study were delineated according to Huang et al. [47]. The data information is summarized in Table 1.

Table 1.
Data summary.
2.3. Urban Marginal Land Estimation
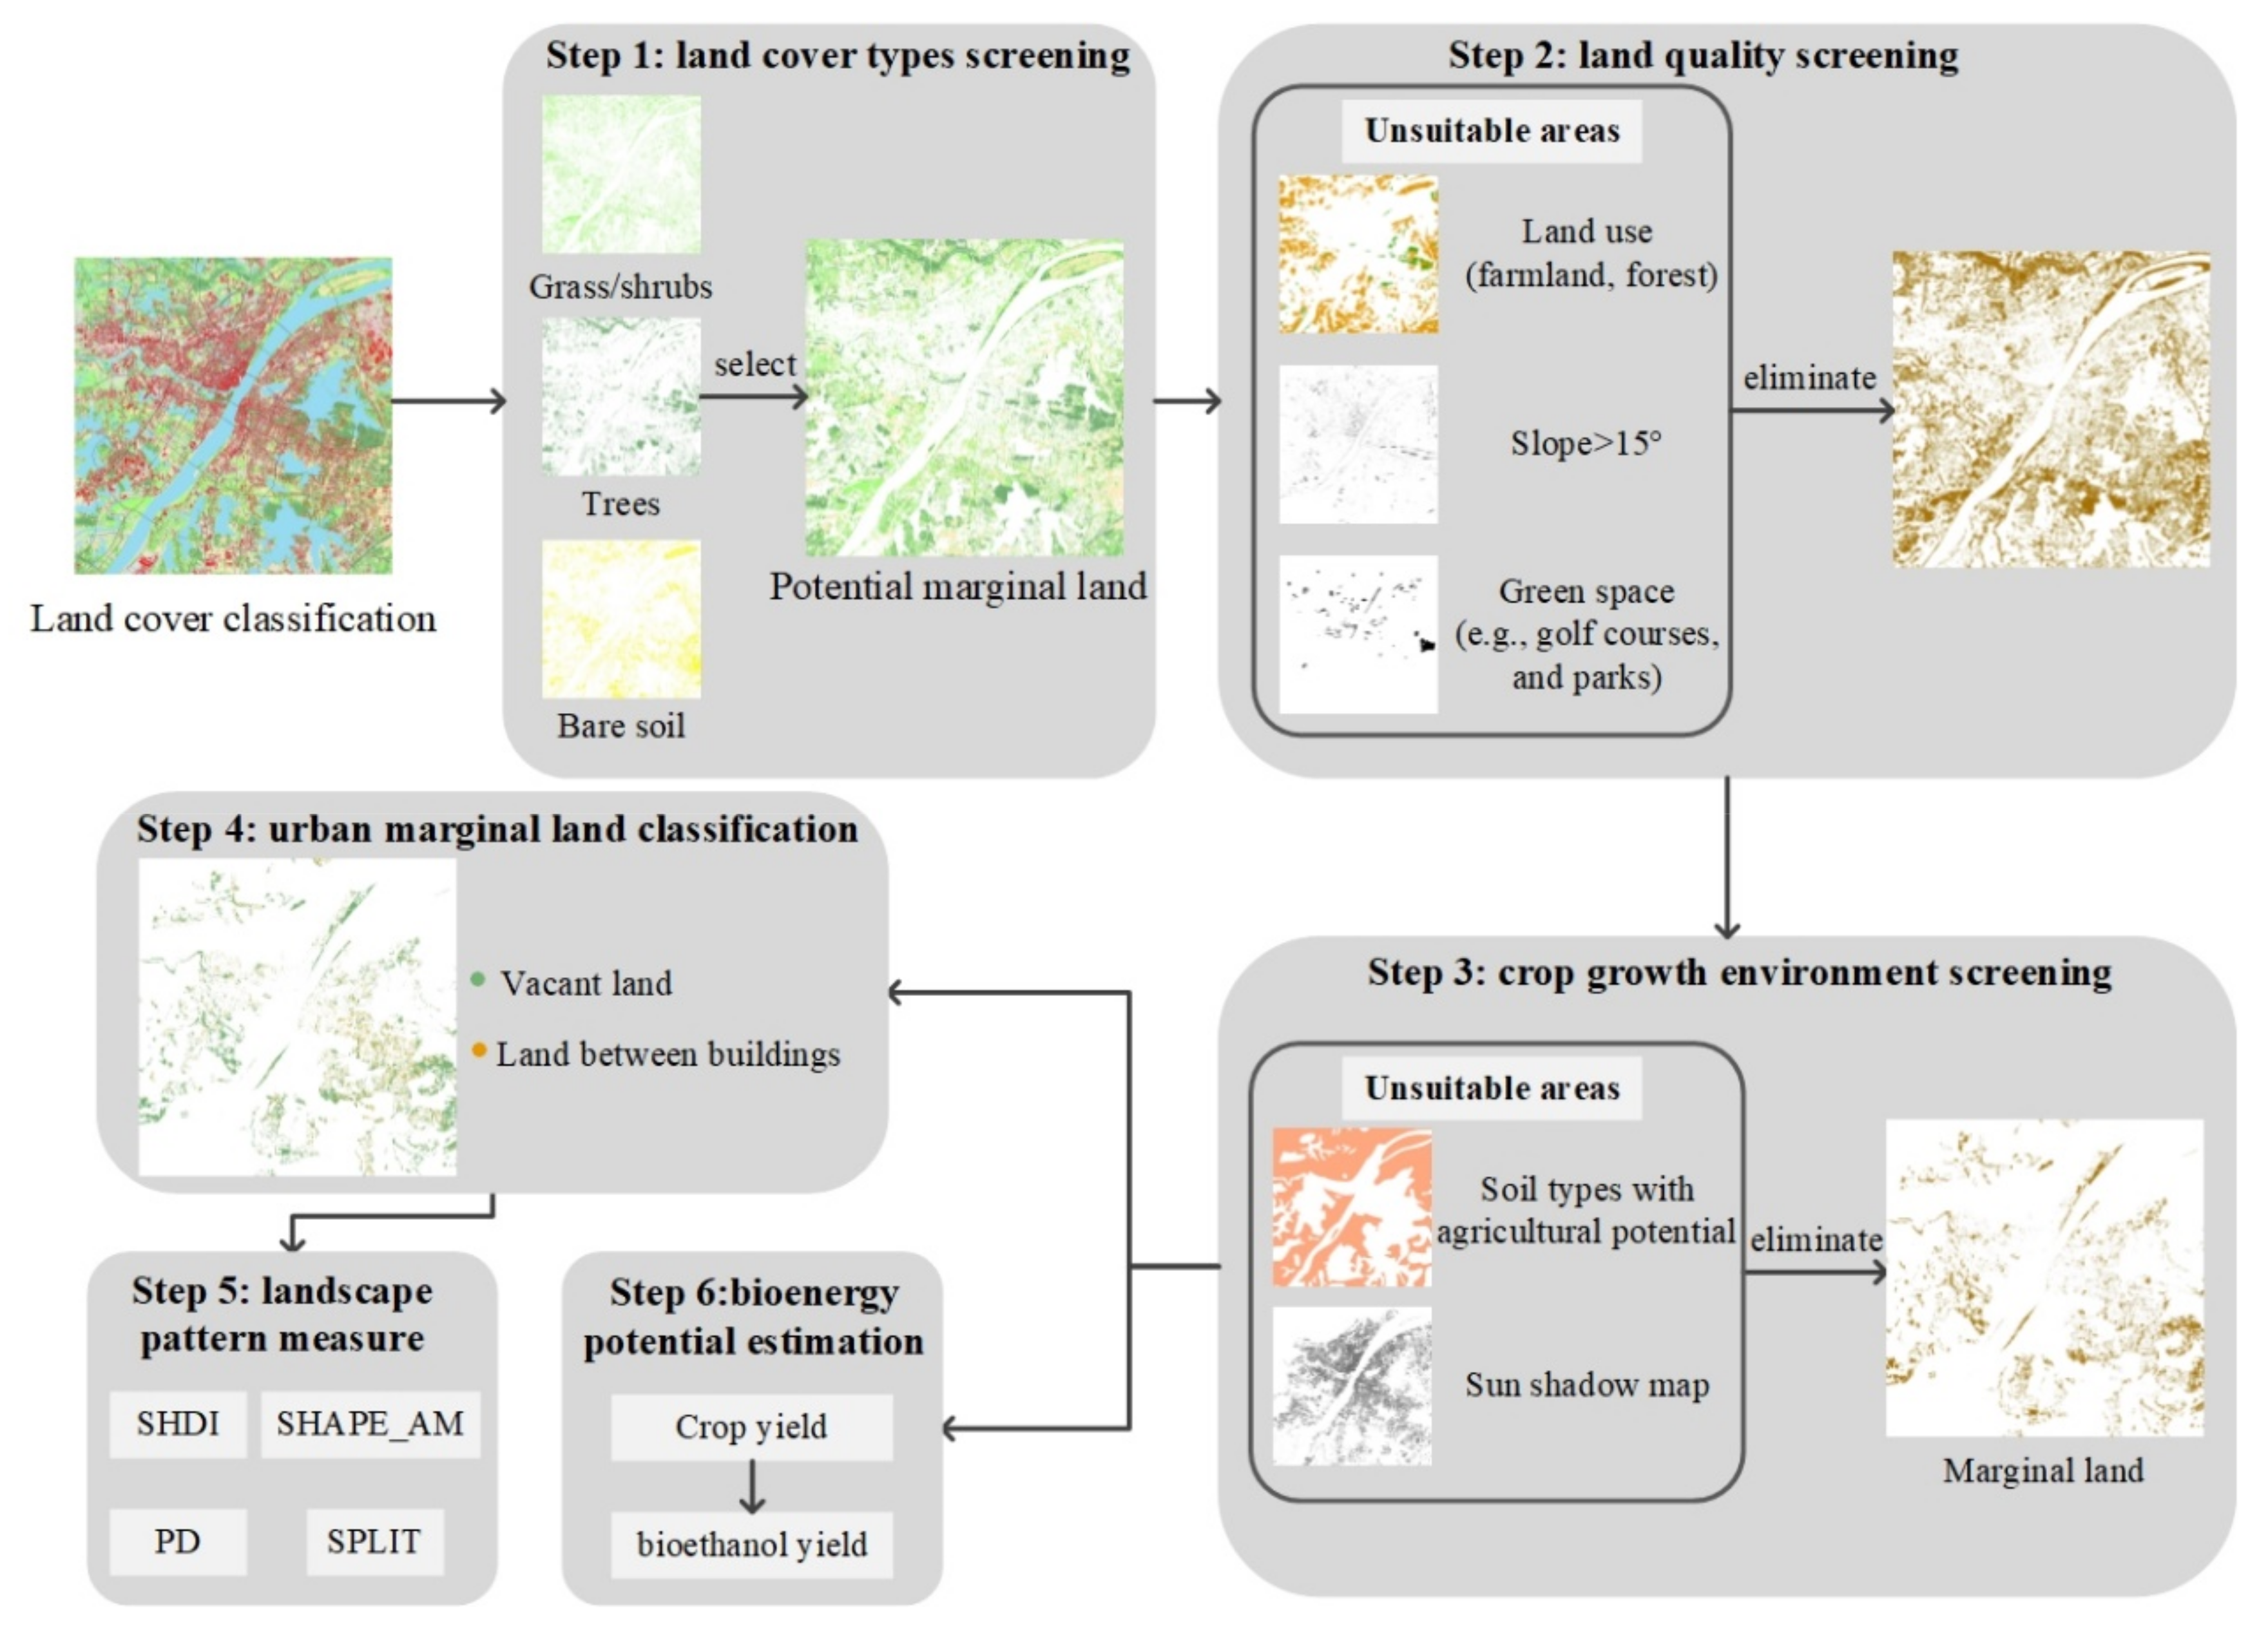
The urban marginal land estimation and analysis in this study consisted of six steps (Figure 3): (1) selection of appropriate land-cover types (e.g., grass, trees, soil) for the marginal land; (2) land quality screening for biomass cropping, in consideration of land use, slope, and green spaces; (3) crop growth environment screening, from the perspective of soil quality and sunlight conditions; (4) classification of urban marginal land; (5) landscape analysis; and (6) assessment of the bioenergy potential.

Figure 3.
Flowchart of urban marginal land estimation.
Step 1: Land-cover type screening
The land-cover map was used for identifying the initial potential marginal land. Urban marginal land should be convenient to reclaim and cultivate, so the land occupied by water, roads, buildings, and OISA should be eliminated. The potential land-cover types for the sustainable planting of biomass crops are mainly grass/shrubs, trees, and bare soil, which were extracted from the ZY-3 land-cover maps (Figure 4).

Figure 4.
Potential urban marginal land: (a) grass/shrubs; (b) trees; (c) bare soil.
Step 2: Land quality screening
The potential urban marginal land obtained from step 1 was further screened with consideration of land use, slope, and green spaces. Due to the large population and limited farmland resources in China, it is not appropriate to develop bioenergy from prime farmland (e.g., paddy fields) [3]. Moreover, with the shrinking of the forest area, it is also not reasonable to utilize forest resources for biomass production [5]. Therefore, farmland and forest should be excluded. In addition, the spatio-temporal differences between the CLUDs and the ZY-3 land-cover maps, e.g., the spatial resolution and acquisition time, could lead to uncertainties. To address this issue, manual editing was conducted after a visual inspection of the ZY-3 pan-sharpened images, to suppress the uncertainties. Please note that the ZY-3 pan-sharpened images were viewed as the baseline, since they have a higher spatial resolution and clearer ground details.
According to [29], marginal land should have a minimum parcel size of 90 m2, and a soil slope of less than 15%, in order to mitigate runoff and soil erosion. Green spaces in cities (e.g., golf courses, and parks) are of great service value for the urban environment and ecosystem. Consequently, the green spaces were identified and excluded, based on the ZY-3 pan-sharpened images.
Step 3: Crop growth environment screening
The growth environment for bioenergy crop cultivation is constrained by soil quality and sunlight conditions. The bioenergy crops should not occupy high-quality soil with the potential for agricultural production, in order to avoid the land use competition between biomass and food [19,28]. In particular, the anthrosols (e.g., paddy soils, cumulated irrigated soils, irrigated desert soils) and other high-quality soil types with great tillage performance and a high content of organic matter (e.g., fluvo-aquic soils, chernozems) were also excluded. In order to acquire more detailed soil information for the different cities, joint inspection of soil type and soil fertility using the China Soil Database [44] was employed to eliminate areas with high-quality soil.
Meanwhile, the spatial distribution of sunlight and the intensity of solar radiation over a period of time is of great importance for assessing the suitability for biomass growth [28,48]. According to Saha and Eckelman [28], shadow analysis should be performed to identify land that receives at least 6 h of sunlight each day during the crop growing season. Therefore, in this research, building height data derived from the ZY-3 multi-view satellite images were applied in the shadow analysis to calculate the shadow areas cast by buildings.
Step 4: Urban marginal land classification
The identified marginal land was further classified into “vacant land” (VL) and “land between buildings” (LBB), which can facilitate a better understanding of the planning of marginal land at the city scale. As shown in Figure 5, buildings derived from the ZY-3 satellite images were buffered and then superimposed with the identified urban marginal land map. If the marginal land was located in the buffer areas, it was classified as LBB; otherwise, it was identified as VL. Finally, accuracy assessment was performed between VL, LBB, and background.
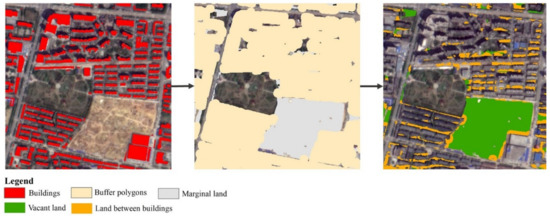
Figure 5.
Urban marginal land classification.
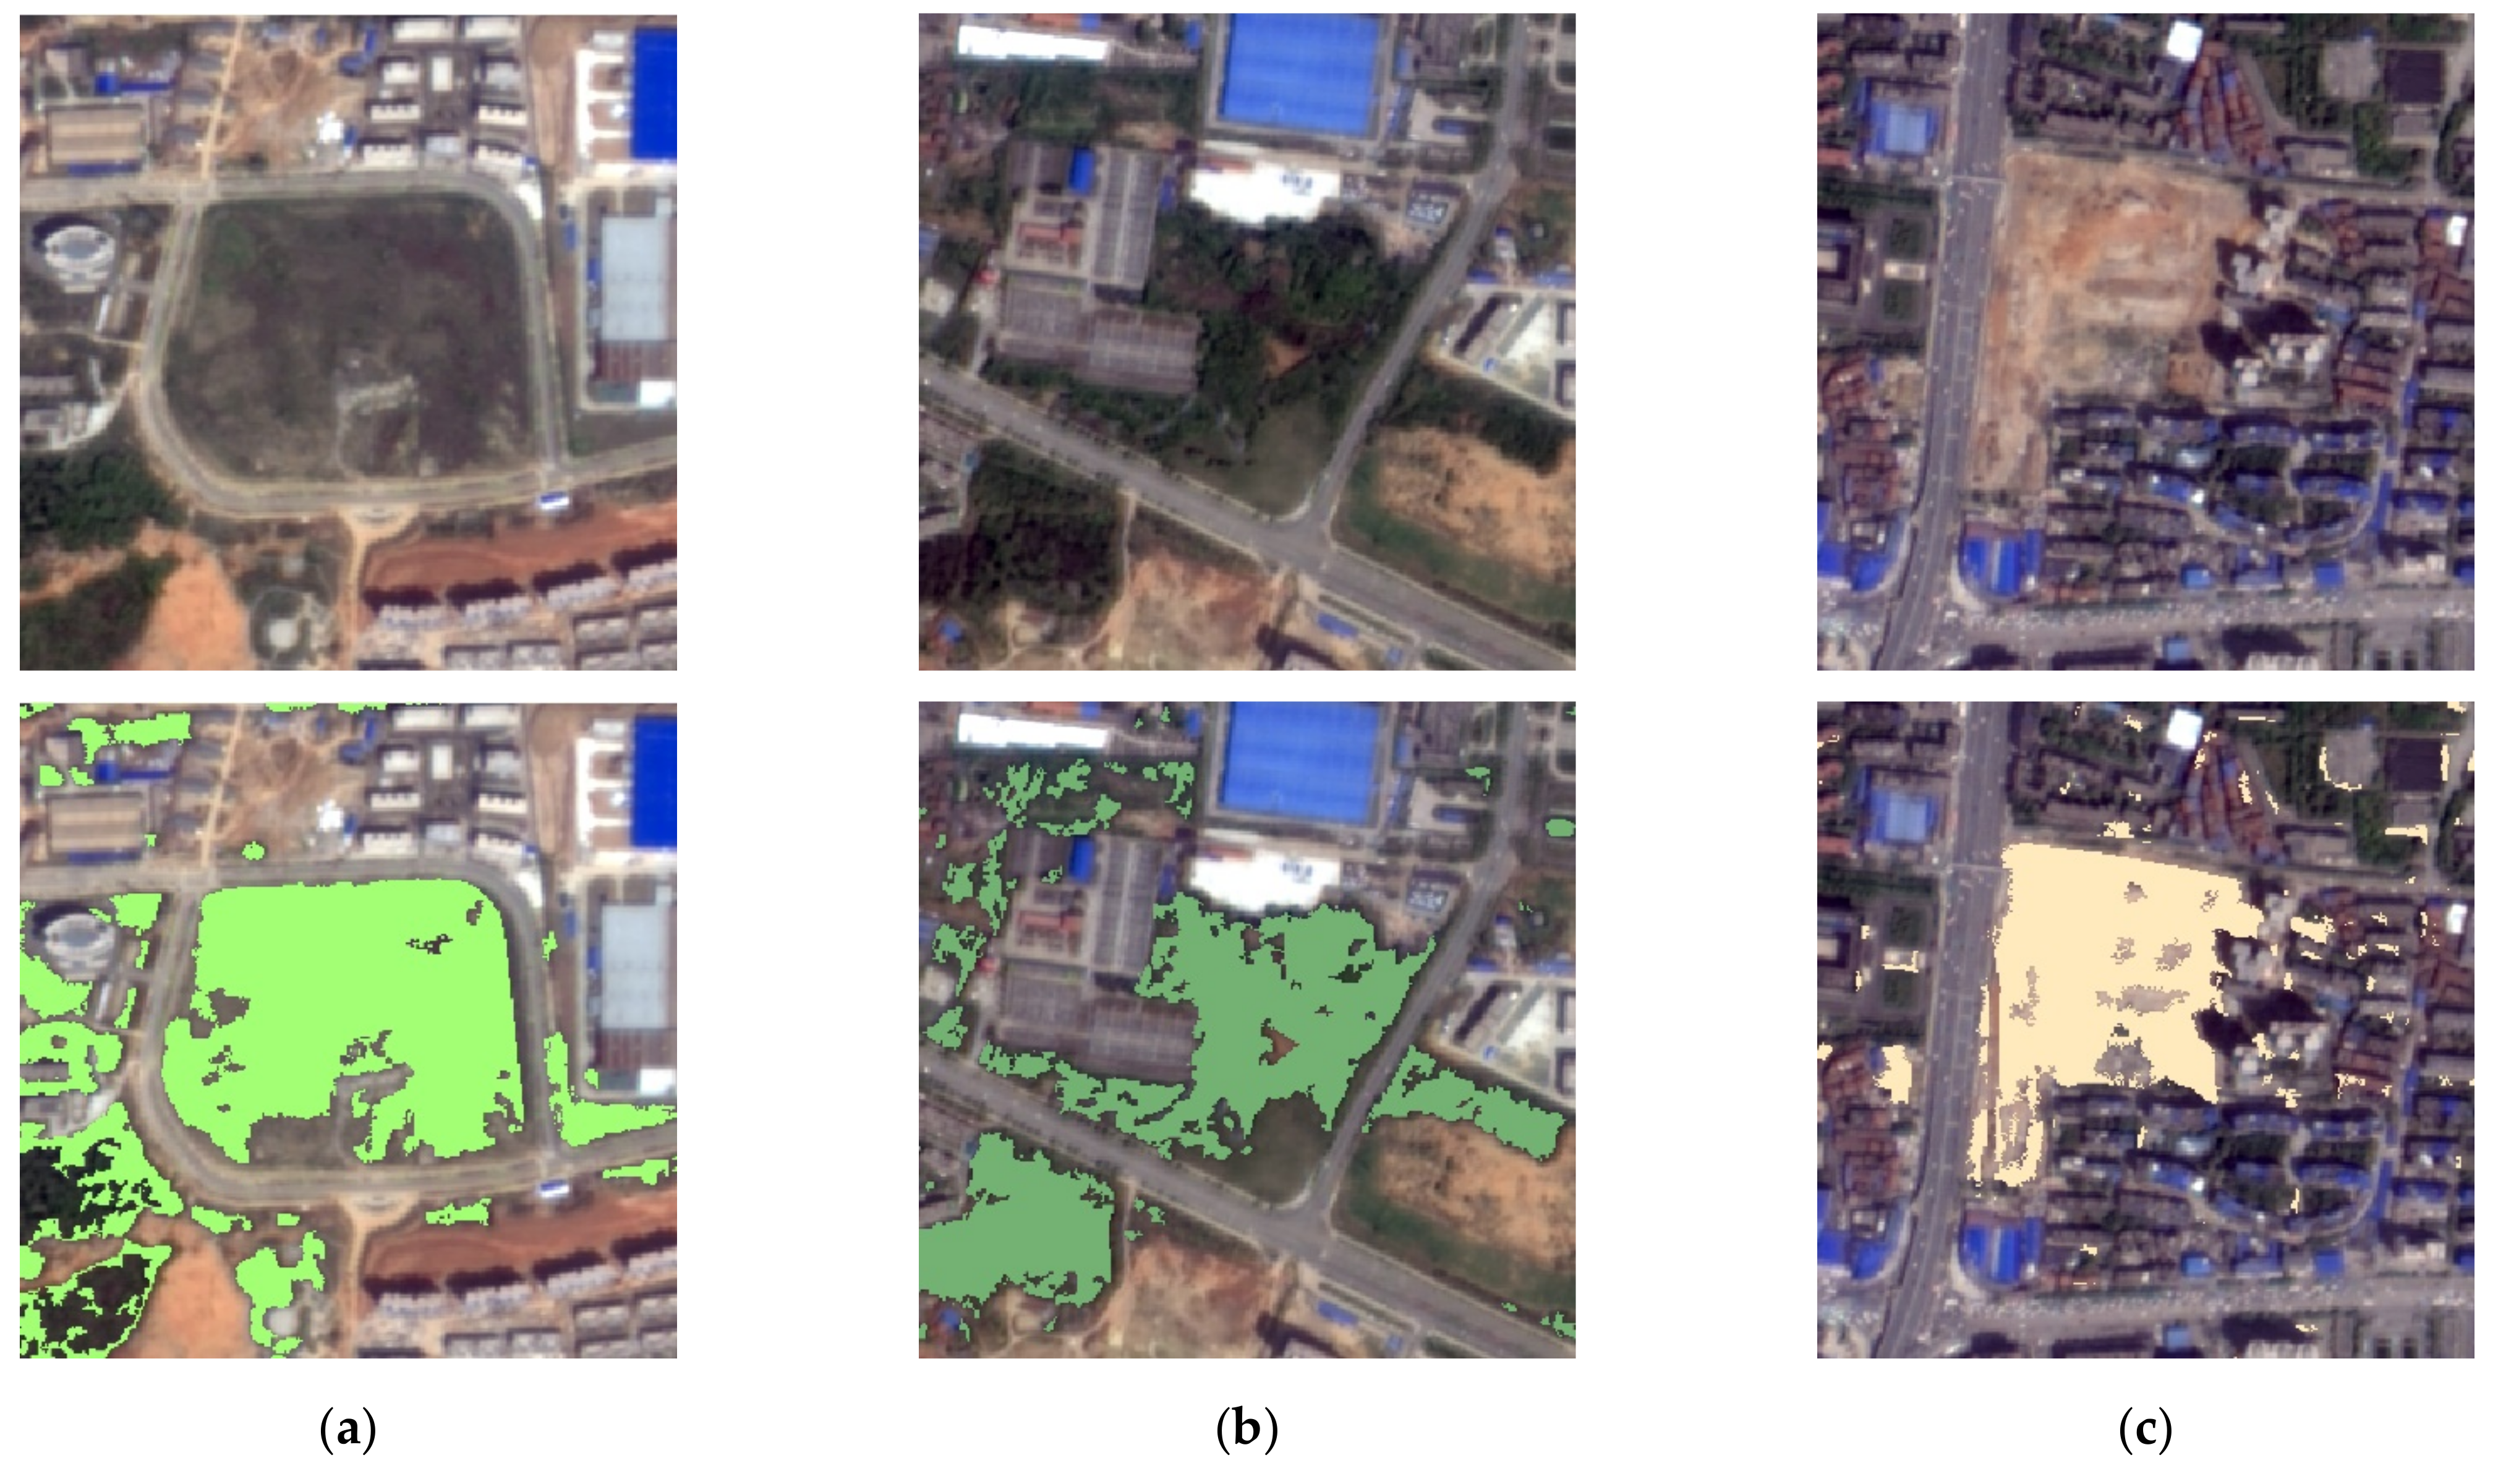
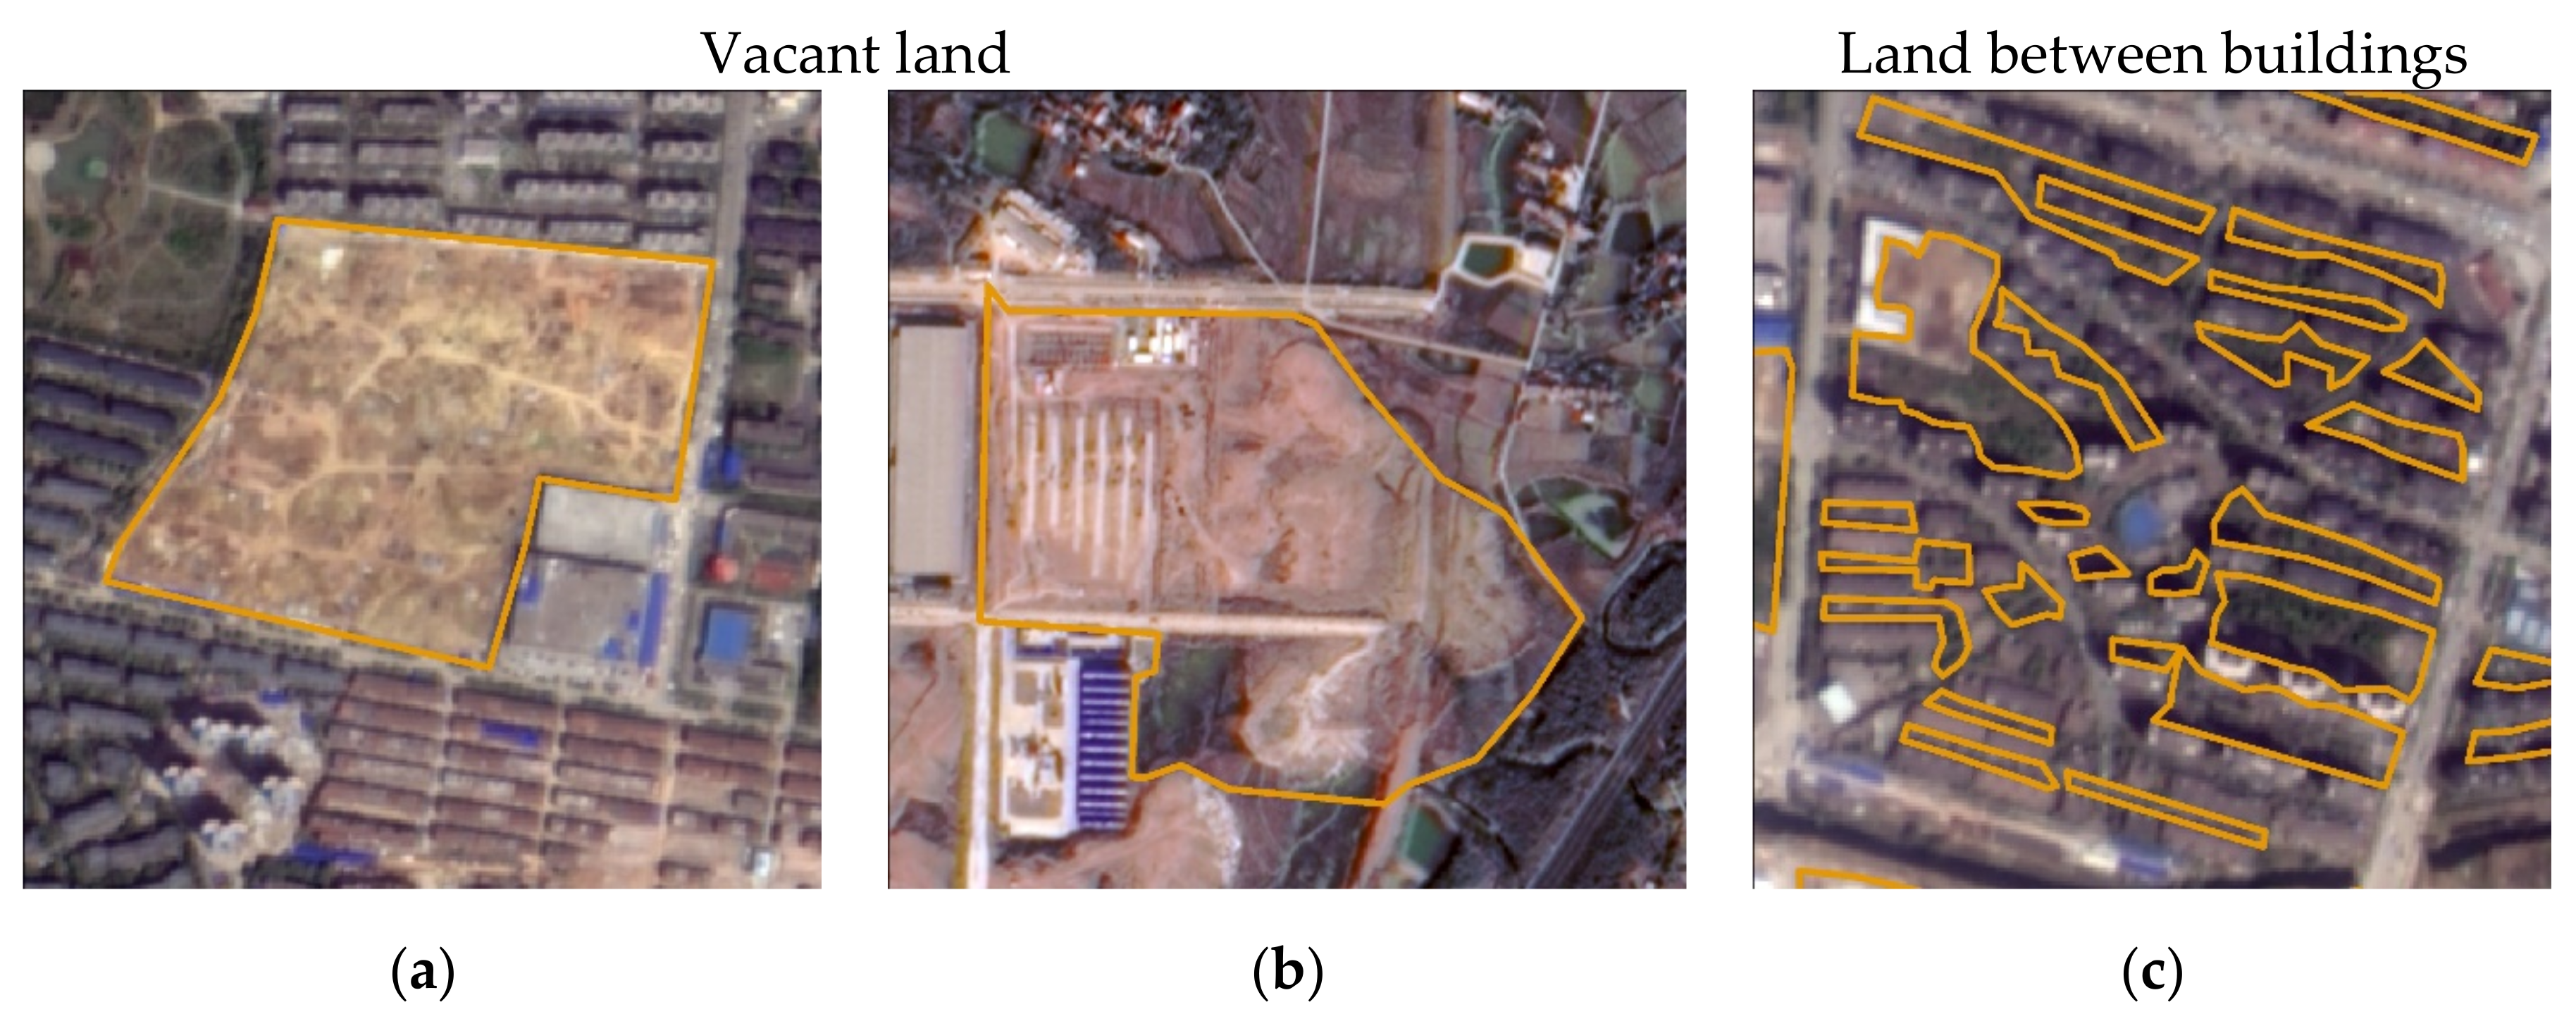
The spatial distribution of VL is relatively continuous, with a large patch size. There are four main types of VL, as shown in Figure 6: (1) under-utilized land in residential or industrial zones; (2) vacant land in suburbs; (3) grassland alongside rivers or lakes; and (4) vacant land or green spaces on the roadside. On the other hand, most LBB is located in residential, commercial, and industrial zones, and involves two categories: (1) green spaces in residential or commercial zones; and (2) vacant land in industrial zones, as presented in Figure 6.
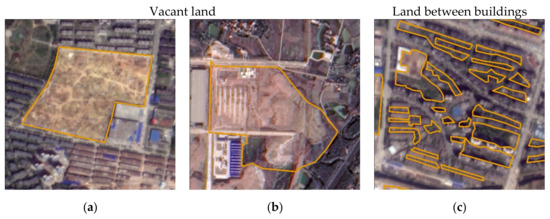
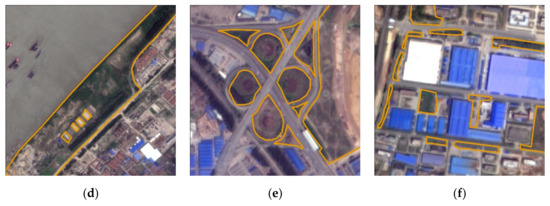
Figure 6.
Urban marginal land: (a) under-utilized land in residential or industrial zones; (b) vacant land in suburbs of the city; (c) green spaces in residential or commercial zones; (d) grassland alongside rivers or lakes; (e) vacant land or green spaces by the roadside; (f) vacant land in industrial zones.
To quantitatively validate the results of the marginal land classification, 50 samples were randomly generated in each category, i.e., VL, LBB, and background. These samples were manually interpreted by referring to the nadir ZY-3 pan-sharpened images for each test site. Confusion matrices were then generated from the sample set for the accuracy assessment. Through the confusion matrices, the overall accuracy (OA) and Kappa coefficient (Kappa) were calculated to measure the performance of the marginal land classification [49].
Step 5: Landscape pattern analysis
The spatial patterns of the urban marginal land were further examined. To this end, four landscape pattern indices were selected (Table 2): Shannon’s diversity index (SHDI), the area-weighted mean shape index (SHAPE_AM), patch density (PD), and the splitting index (SPLIT). The chosen landscape metrics were used to describe the marginal land from three aspects: landscape composition (SHDI), shape complexity (SHAPE_AM), and spatial arrangement (PD, SPLIT). SHDI measures the richness and evenness of the landscape diversity at the landscape level, and it increases as the number of different patch types increases. Notice that this index is sensitive to the rare patch types [50]. SHAPE_AM describes the complexity of the patch shape and increases as the shape of the land becomes more irregular and complex [51]. PD and SPLIT are used to quantitatively analyze the landscape fragmentation and the degree of aggregation at the landscape level [52].
Table 2.
Landscape metrics selected in this study.
Step 6: Bioenergy potential estimation
Lignocellulosic crops such as cassava, sweet potato, and sweet sorghum are potential candidates for biomass production in China [2,3]. These crops can survive under various climatic conditions, and can tolerate hostile environmental and weather conditions, such as flash floods, low temperatures, and saline or alkali conditions. All of these crops could be used for the production of bioethanol in China [2,34,53]. Specifically, cassava is suitable for planting in South China; sweet potato could be grown in North China, the middle and lower reaches of the Yangtze River, and South-west China; and sweet sorghum is suitable for cultivation in North-east China, North China, the Loess Plateau area, and the Inner Mongolia/Xinjiang region [54,55]. Therefore, these three crops were selected as representatives to evaluate the biomass and bioenergy potential of the urban marginal land in China. Information about the energy crop yield and fuel ethanol production levels is given in Table 3 [56].
Table 3.
Ethanol production information for energy crops.
3. Results
3.1. Accuracy Assessment
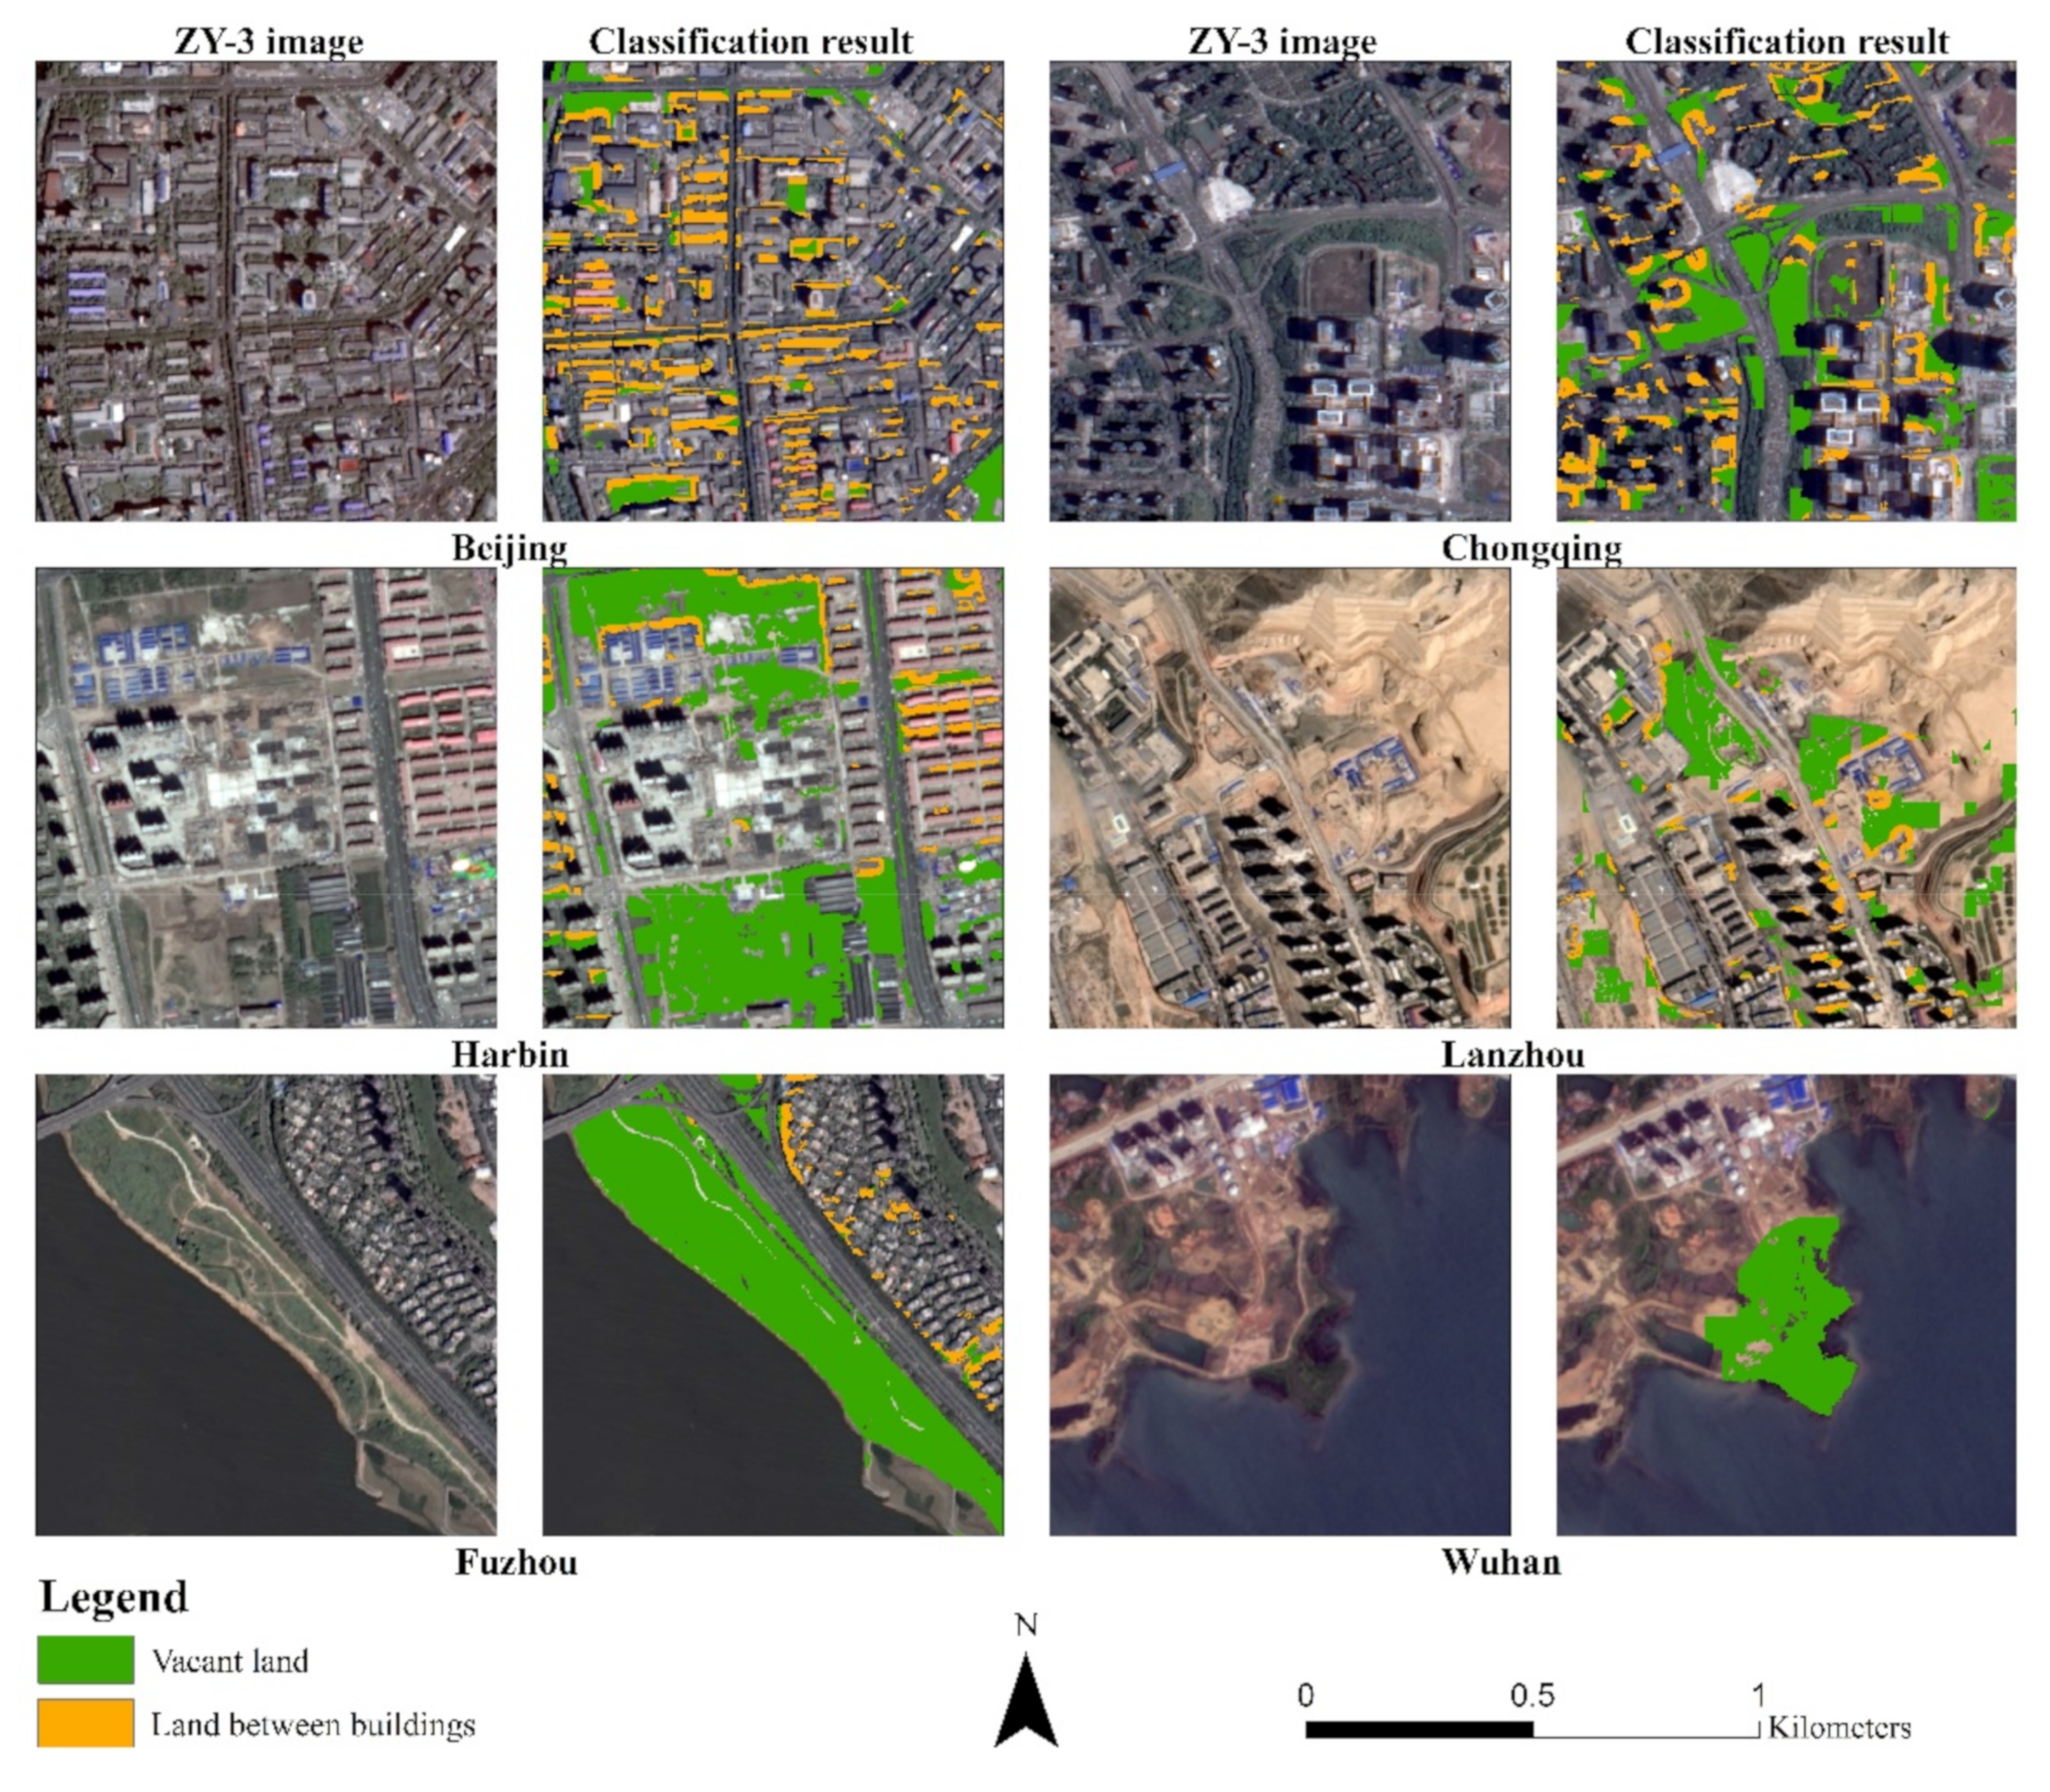
In order to show more details about the results of the urban marginal land estimation and classification, zoomed-in regions of marginal land are overlaid on ZY-3 images of some representative cities in Figure 7, including different urban marginal land scenes (e.g., urban residential areas, peri-urban areas, and water areas). In the residential areas, such as the cases in Beijing, Chongqing, and Harbin, it can be seen that the buildings have been effectively filtered out, while the unused land between buildings, roadside grass, and vegetated areas have been accurately identified as marginal land. In the peri-urban areas, e.g., the examples in Lanzhou, large amounts of bare ground have been detected. In the cases of Wuhan and Fuzhou, the lakes or rivers have been excluded, but the grassland and bare land alongside the rivers and lakes have been detected as marginal land.

Figure 7.
Examples of the urban marginal land classification results.
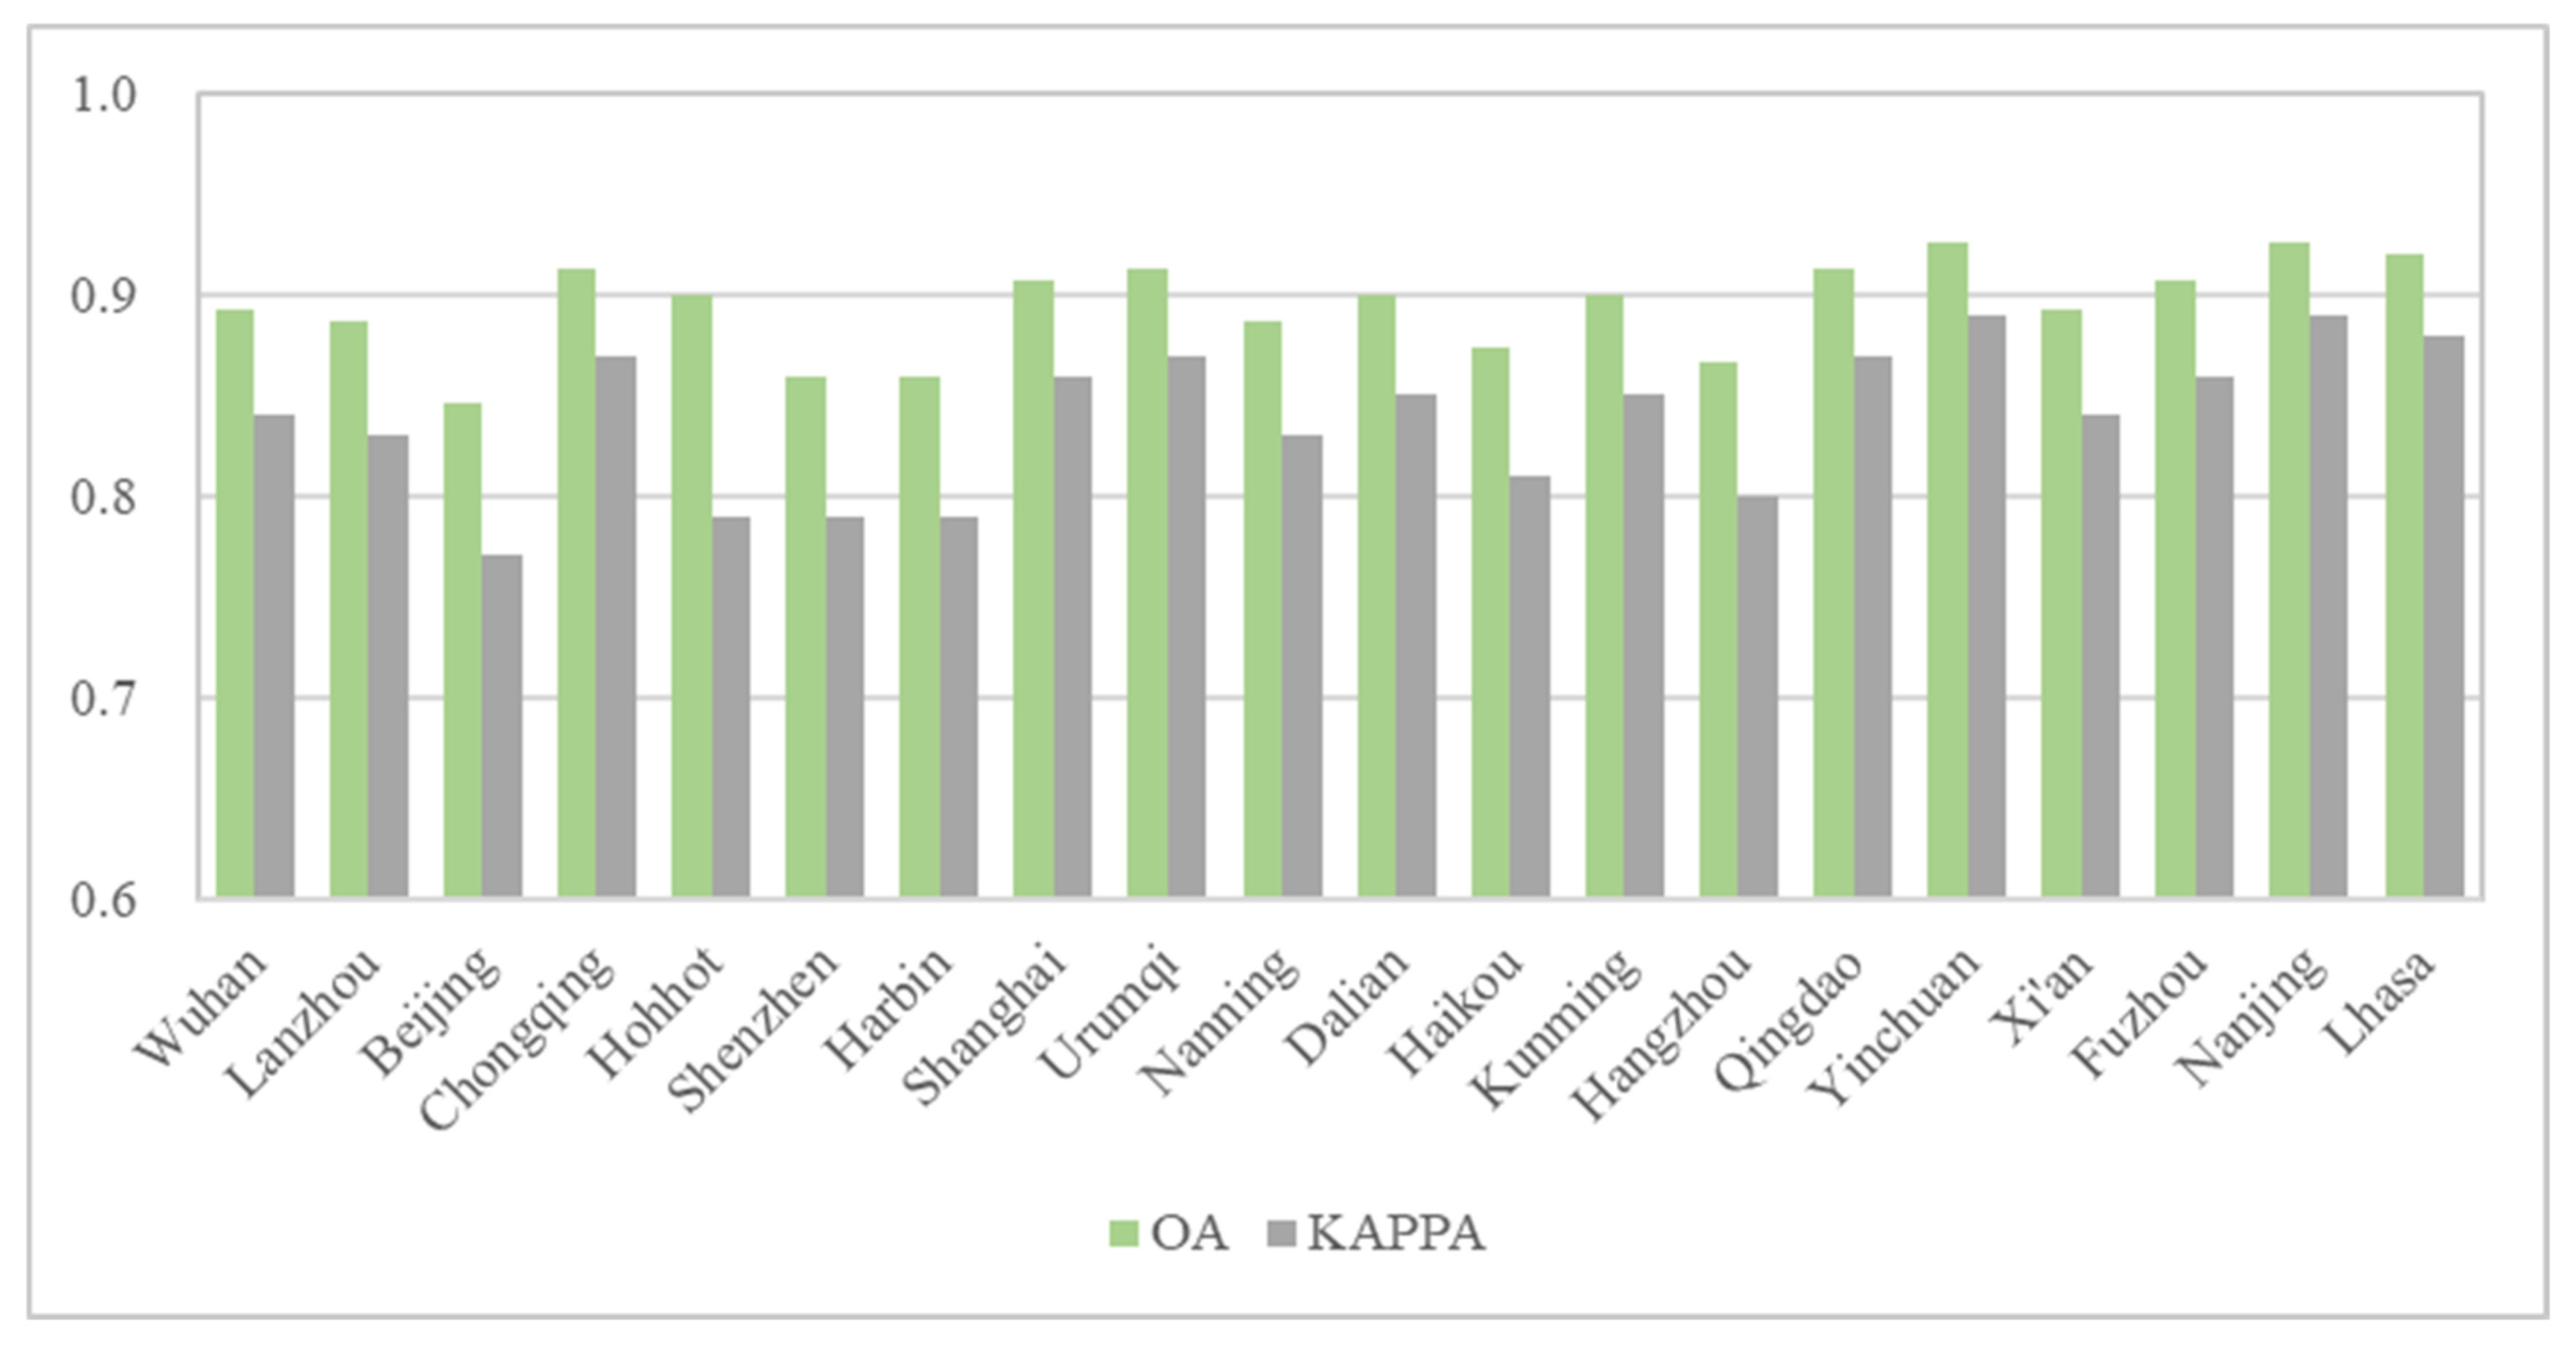
The accuracy of the marginal land classification in the 20 cities of China is shown in Figure 8. The OA values range from 84.67% to 92.67% and the Kappa values range from 0.77 to 0.89. Very satisfactory results are obtained in 11 test cities, for which the OA values are higher than 90%, which illustrates the efficacy of the proposed approach. The best results are achieved in Yinchuan and Nanjing, for which the OA and Kappa values are 92.67% and 0.89, respectively.
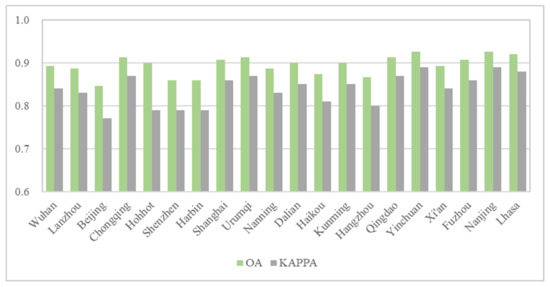
Figure 8.
Accuracy of the marginal land classification.
3.2. Marginal Land Resources in the 20 Cities of China
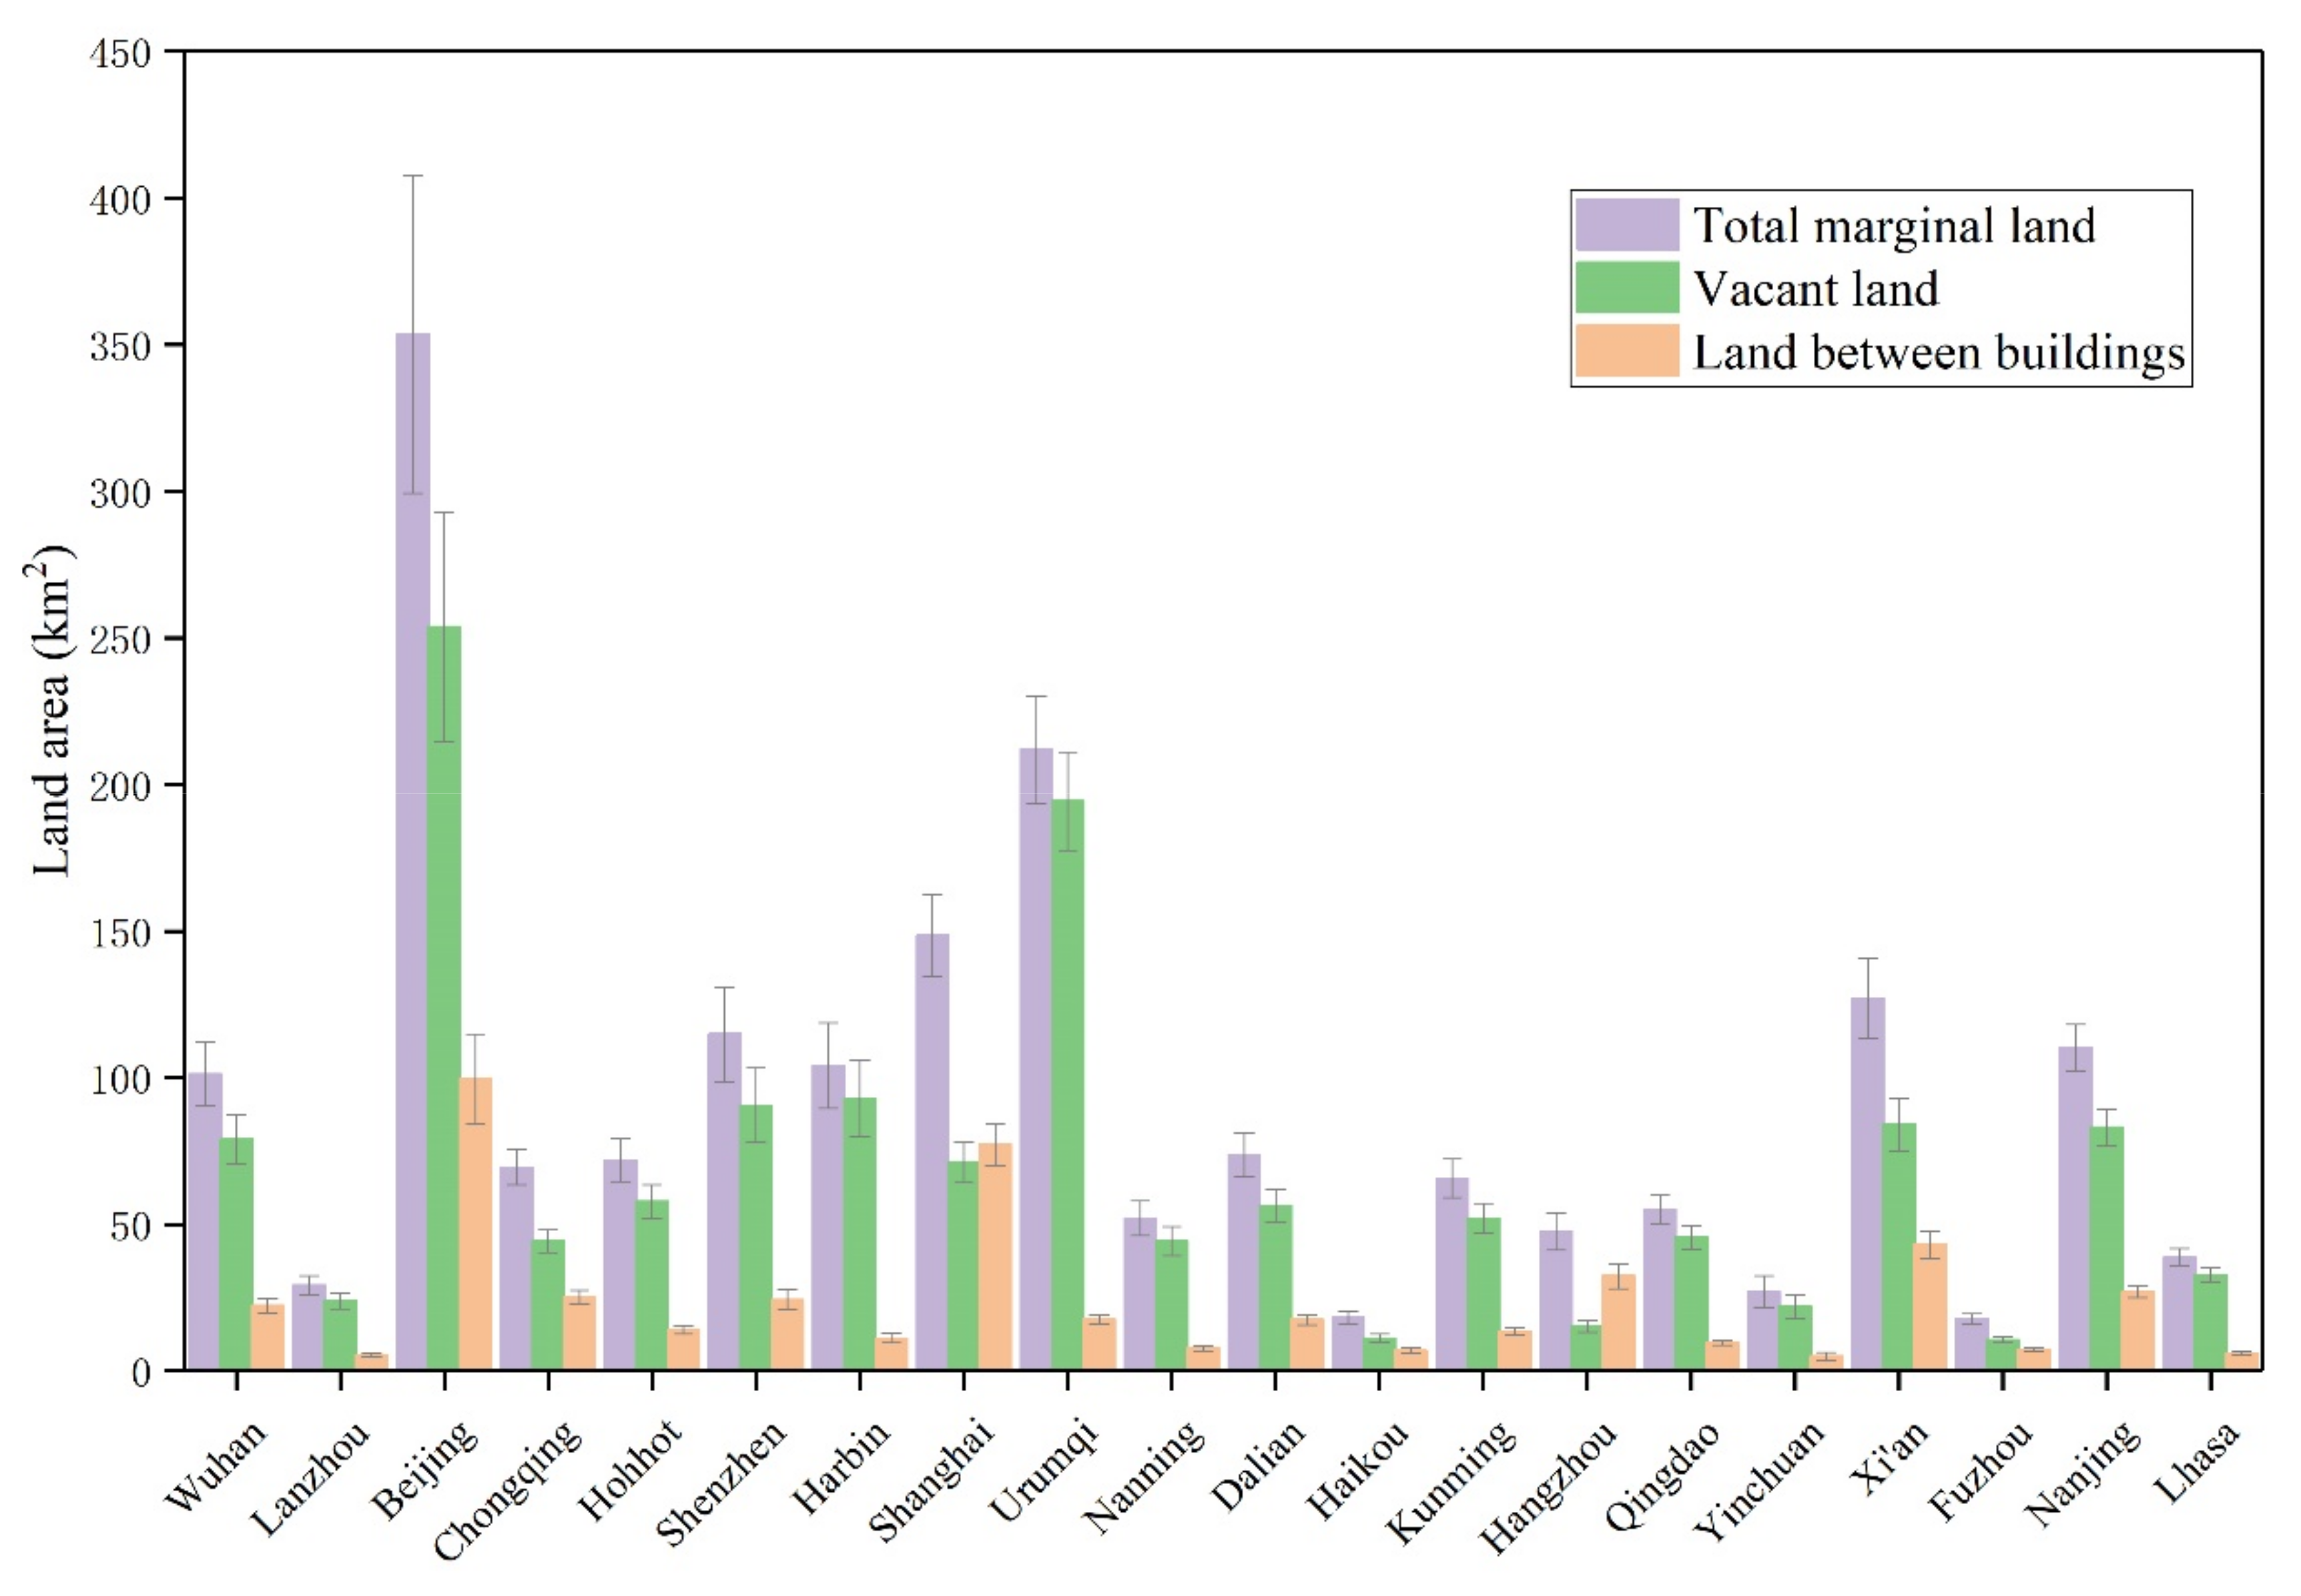
The areas of marginal land in the 20 cities of China range from 17.78 ± 1.66 km2 to 353.48 ± 54.19 km2 (Figure 9). The deviations of the marginal land area, calculated by OA and estimated area, represent the uncertainty of the marginal land estimation.
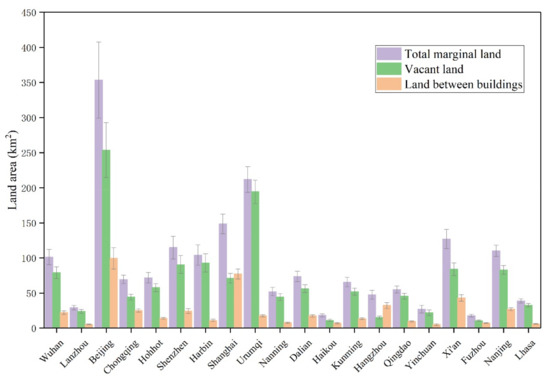
Figure 9.
Marginal land resources in the 20 cities of China. The error bars represent the uncertainty of the marginal land areas.
In order to fairly compare the different cities, the percentage of the total marginal land in the whole urban area was calculated [16]. In the 20 cities, Urumqi and Lhasa have the largest proportion of marginal land, at more than 20%, followed by Hohhot, Harbin, Xi’an, and Nanjing (10–16%). Except for Shanghai (5.71%), all the other cities have a level between 6% and 10%. The total marginal land area, as well as its percentage, is related to the development level, land-cover/land-use structure, and the quality of soil in the city. More details of the marginal land in some representative cities are presented in Figure 10. For instance, with the highest proportion of marginal land, the amount of bare land or grassland is ample in Lhasa (Figure 10a), especially in the suburbs of the city. Lhasa is located in Western China, where soil with good agricultural productivity is relatively scarce, which therefore provides more land for biomass cultivation. In another example, as an important super-city (with an urban population of more than 10 million) of China, the available marginal land in Shanghai (Figure 10b) accounts for the lowest proportion of urban area. With the rapid expansion of the built-up areas in Shanghai, the high proportion of impervious surfaces and dense buildings results in a small ratio of public vacant lands suitable for marginal land utilization.
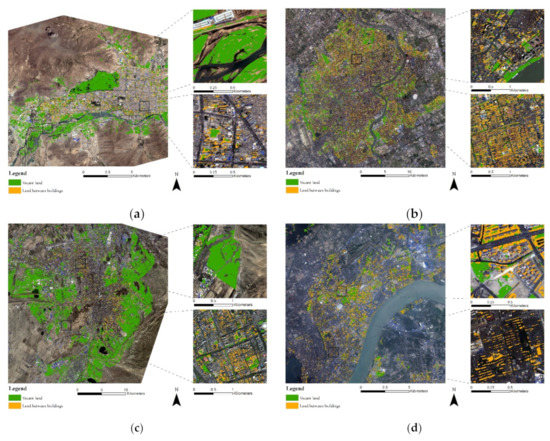
Figure 10.
Details of the marginal land in some representative cities: (a) Lhasa; (b) Shanghai; (c) Urumqi; (d) Hangzhou.
From Figure 10, it can be observed that, in most cities, the amount of VL is much higher than that of LBB. VL accounts for the largest proportion (about 90%) of total marginal land in Urumqi and Harbin, followed by Nanning and Lhasa (about 85%). Figure 10c shows the spatial distribution of marginal land in Urumqi. It can be seen that bare land, grassland, and other unused land are widely distributed in the peri-urban area of the city, and hence the area of VL is significantly larger than that of LBB. The proportion of VL in Hangzhou and Shanghai is the smallest (<50%).The possible reason is that the building density and development degree in the urban area of Shanghai are both quite high (Figure 10b). As for the situation in Hangzhou, a large amount of green land (e.g., West Lake, the Xixi National Wetland Park, and the Banshan National Forest Park) is excluded for urban environmental protection, resulting in the decrease of VL (Figure 10d). In addition, as the capital of China, Beijing is undergoing rapid urbanization and expansion of built-up areas. However, the area of VL and LBB in Beijing is the highest among the 20 cities, and particularly, the proportion of VL in Beijing is higher than in Shanghai. The possible reason is that the northern mountainous area accounts for a relatively high proportion of the total urban area, and provides more unused land for marginal land development. Except for farmland, there is a large amount of unused land in the pre-urban area of Beijing, so that its amount of VL is high compared with the other developed cities.
3.3. Bioenergy Potential in the 20 Cities of China
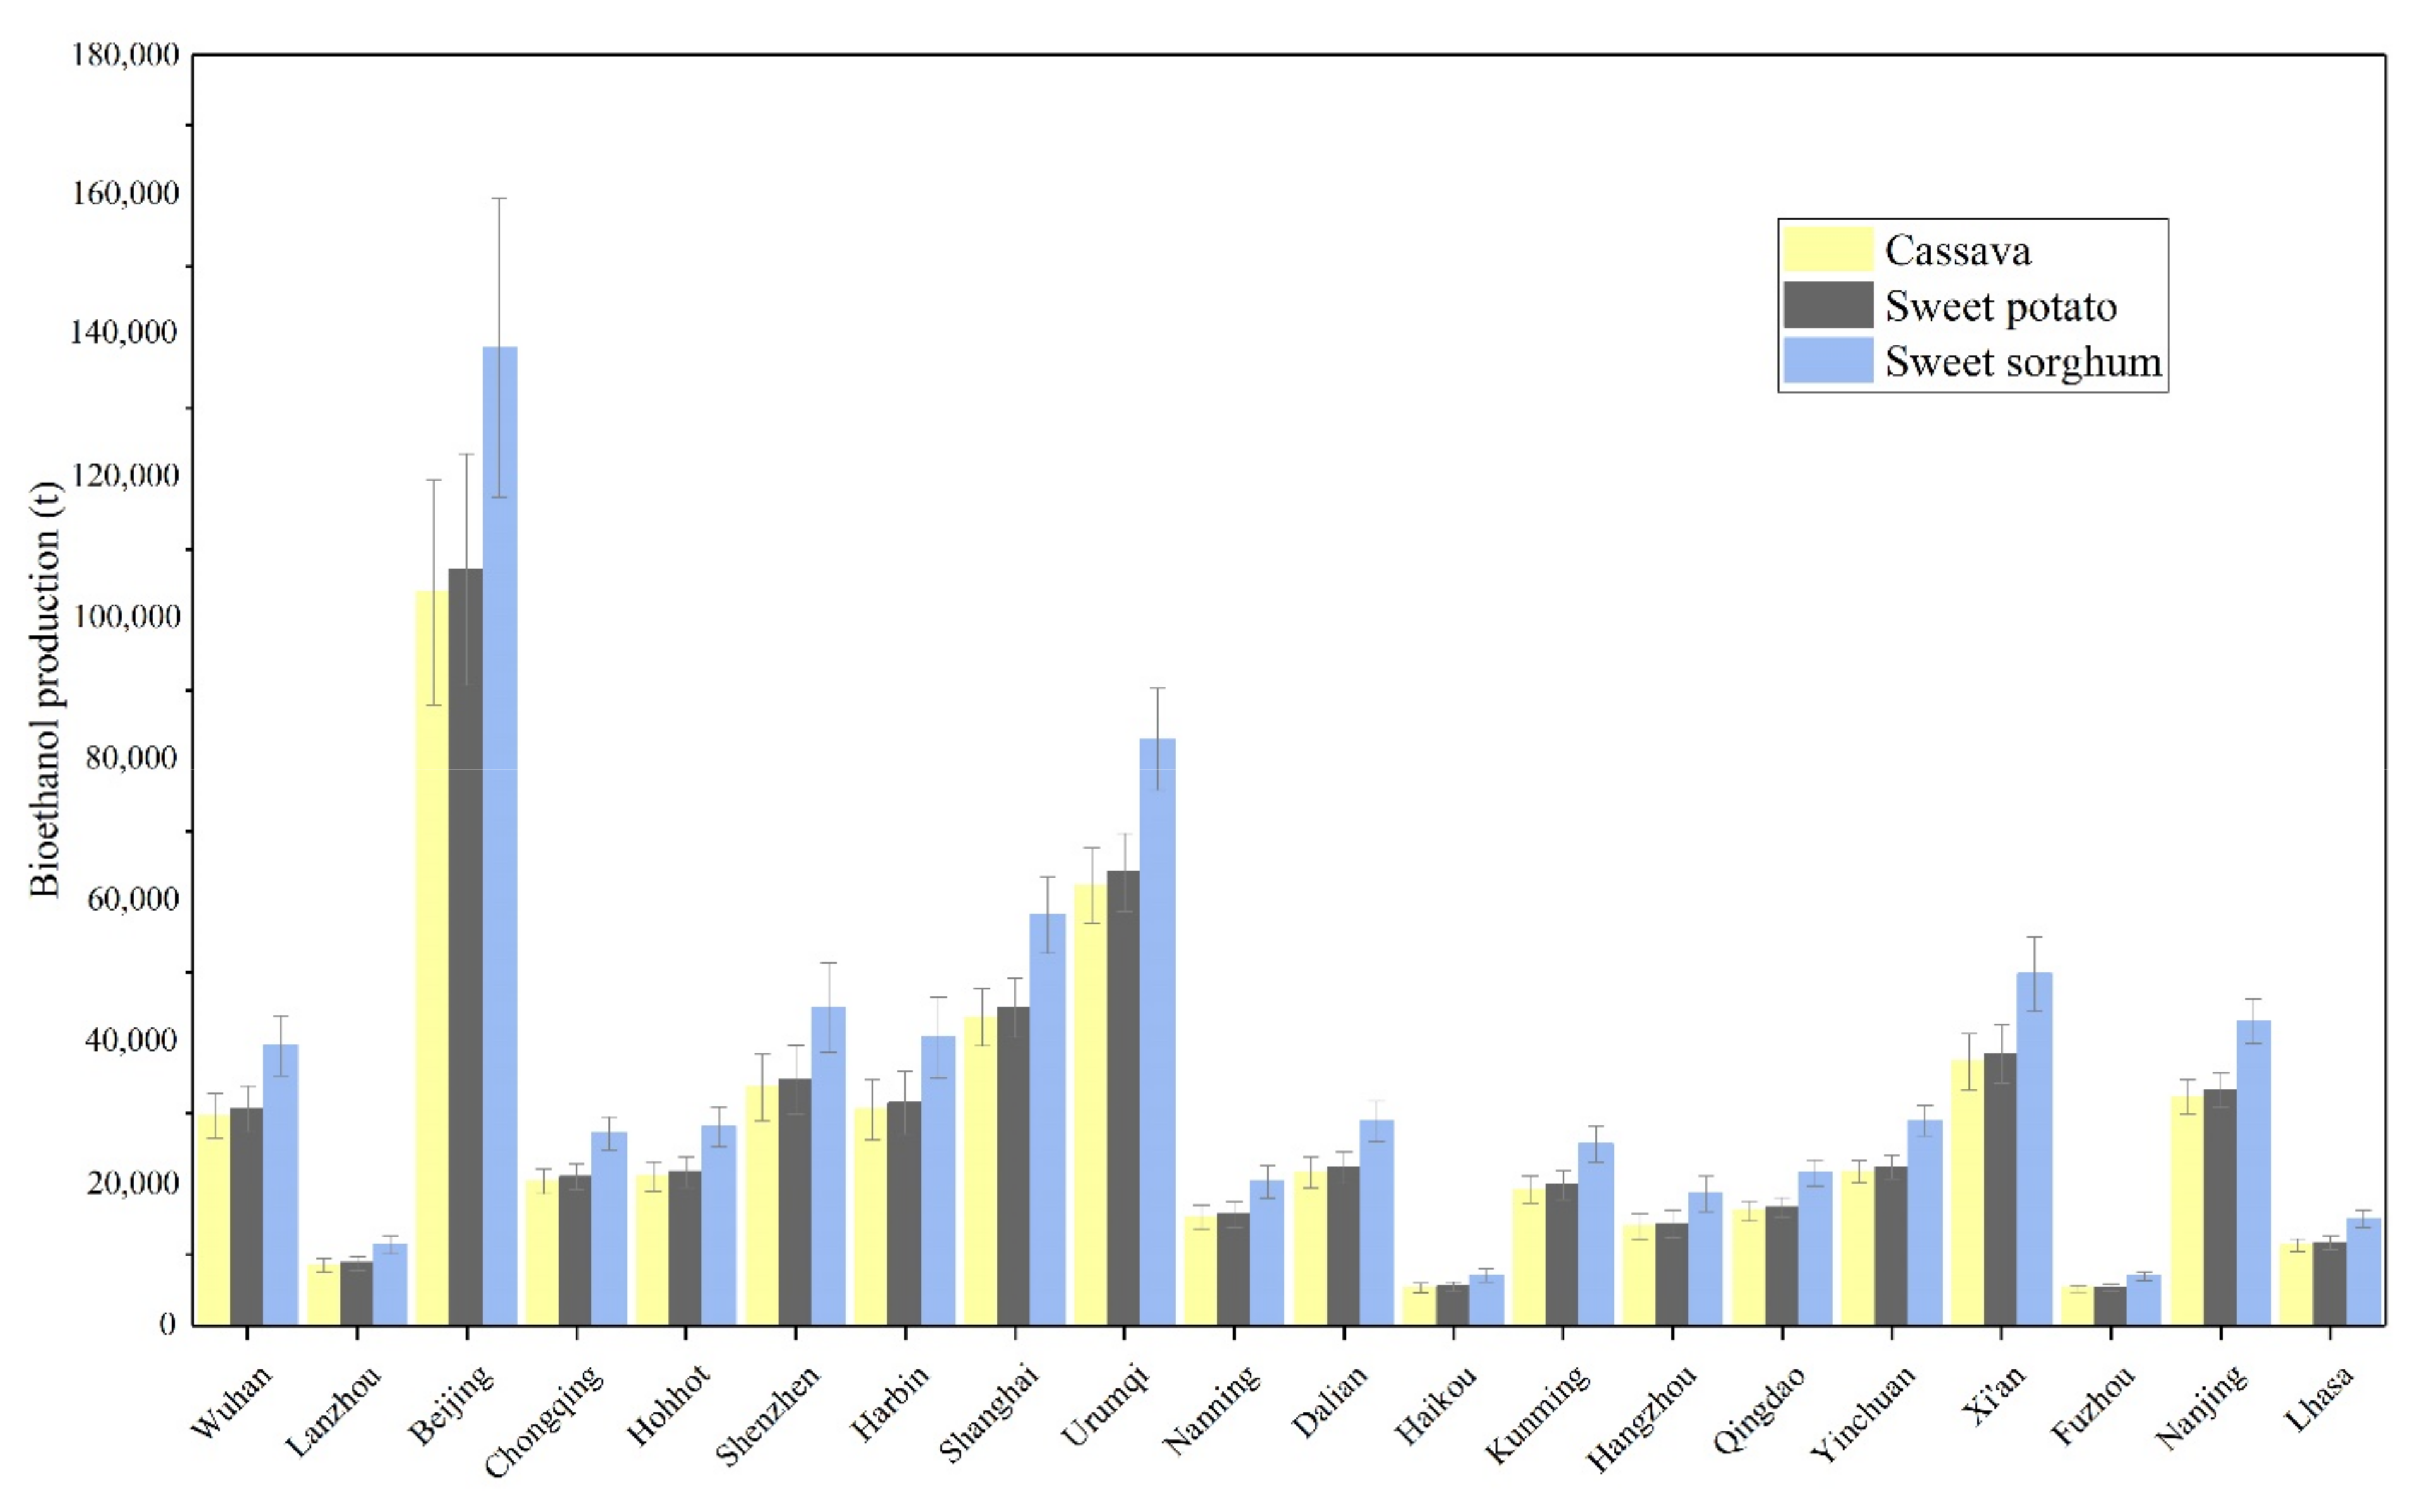
The estimation of potential bioethanol production from cassava, sweet potato, and sweet sorghum is shown in Figure 11. The marginal lands in the 20 cities could produce 0.005–0.13 mT of bioethanol in a regular growing season. Please note that, on account of the community acceptance, soil pollution, and traffic conditions, these numeral values should be seen as upper-bound estimates. The biomass-to-biofuel conversion efficiency of cassava is taken as an example (1 L of cassava ethanol can produce 2.417 × 10⁶ joules of energy [56]) of converting bioethanol production into bioenergy production, and the bioenergy of one city could be yield up to 2.1 × 10¹³–4.0 × 10¹⁴ J. This could be used directly in the city for community heat and power production. For reference, the estimated potential urban bioenergy of Yinchuan is 8.89 × 10¹³ J, which is equivalent to ~1.44% of the urban living energy consumption of the whole city in 2017 [57], including household electricity, heating, solar energy consumption, and so on.
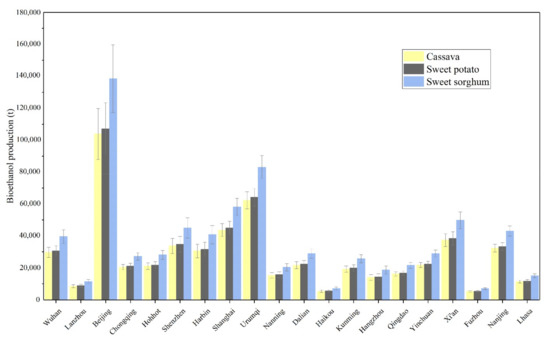
Figure 11.
Potential bioethanol production of the energy crops.
3.4. Landscape Patterns of Marginal Land
From Table 4, it can be seen that the SHDI is larger in Shanghai, Haikou, Hangzhou, and Fuzhou, indicating that the two categories of marginal land (i.e., VL and LBB) are distributed evenly. These cities have higher proportions of LBB, but the spatial distribution of the marginal land is fragmented, corresponding to high values of PD or SPLIT. From the perspective of shape complexity, the larger values of SHAPE_AM are found in the western and northern cities, e.g., Harbin, Urumqi, and Lhasa. In these cities, VL accounts for a large proportion compared with LBB and, hence, the marginal land presents a more irregular and complex shape. The PD and SPLIT values in these cities are also clearly smaller, which means that the marginal land is more aggregated and shows a high level of contiguity. In addition, the landscape fragmentation of marginal land also differs across the range of city development levels. The PD and SPLIT values are larger in the more developed cities, e.g., Beijing, Shanghai, and Hangzhou. The patches of marginal land in these cities reflect a low value of contiguity and tend to be divided into smaller units. However, the marginal land in the western and northern cities, e.g., Hohhot, Urumqi, and Lhasa, presents a low degree of fragmentation and tends to aggregate into larger units, as the PD and SPLIT values are all small compared to the developed cities. In general, the shape complexity of the marginal land becomes lower and the landscape pattern tends to be more fragmented in the more developed cities, where the amount of LBB is higher.
Table 4.
Landscape patterns of the marginal land.
4. Discussion
4.1. Development of Biofuels in China
In 2007, the National Development and Reform Commission (NDRC) of China issued the “Medium and Long-term Development Plan for China’s Renewable Energy”, which emphasizes the significance of biofuel, and encourages the development of fuel ethanol technology with feedstock such as cassava, sweet potato, and sweet sorghum [58,59]. The 12th Five-Year renewable energy strategic plan of the NDRC of China clearly defines the future direction of China’s biofuel development, i.e., to select, breed, and plant energy crops appropriately, and to establish large-scale feedstock bases and factory-scale production units [60]. Under such circumstances, a number of demonstration factories and/or production lines have been constructed in some provinces of China for sweet sorghum growth and industrial-scale ethanol production since 2007 [61]. For instance, a demonstration project has been established for sweet sorghum bioethanol production in Dongtai, Jiangsu province, which has a yield of 3000 t/year [59]. About 5 × 10⁴ acres of coastal land in Binzhou, Shandong province, has been cultivated for sweet sorghum production, and a pilot plant has been built in Inner Mongolia to produce bioethanol from sweet sorghum [62]. Cassava is mainly cultivated in Guangxi and Guangdong provinces, which account for about 90% of China’s total cassava production. Guangxi province, in particular, has cultivation land of 4 × 10⁵ ha and annual production of 8 mT [53,62,63]. Sweet potato is extensively planted in China, and it has been reported that a lot of demonstration and manufacturing factories have already been constructed in the Sichuan Basin, Yangtze River Basin, and the southeast coastal provinces to produce fuel ethanol from sweet potato [54,62]. It has been estimated that the total sweet potato harvest area in China is 4.709 M ha, yielding up to 100 mT, ranking first in the world in 2005 and accounting for over 80% of the world’s sweet potato production [54,63].
Compared to ethanol, the utilization rates of biodiesel projects are inadequate due to the shortage and instability of the feedstock supply. Despite the total production being still small and dispersed, China has also been promoting biodiesel [61,64]. Jatropha-based biodiesel industries have started to boom in Yunnan, Sichuan, and Guizhou provinces since 2006. It is also expected that about 167 M ha of jatropha will be planted on hilly and marginal land in next 10–15 years in these provinces [61].
Moreover, the NDRC 12th Five-Year strategic plan encourages the rational development of marginal land such as saline-alkali land, wild grassland, and barren hills for the production of biomass [60]. It has been estimated that the area of marginal land in China available for biofuel cropping ranges from 3 to 100 M ha, and that 5 to over 300 mT of biofuel could be produced each year from marginal land, depending on location, land area, the selected energy crops, and their productivity [2]. Feedstock in the aforementioned cases of biofuel production is mainly planted on farmland or marginal land outside the cities. However, marginal land within the cities has not been fully utilized, and has the potential to be used for bioenergy production.
In this context, our study focused on the marginal land within the cities. The implementation of bioenergy projects on urban marginal land will contribute to the development of a city’s clean energy economy and dedicated biomass processing plants, and will facilitate the establishment of biomass industry systems for the cultivation, harvesting, transportation, and storage from potentially hundreds of urban plots, to achieve distributed energy production. The NDRC 12th Five-Year strategic plan emphasizes the vigorous development of distributed energy [60], which will provide a new opportunity for the development of distributed bioenergy projects on urban marginal land. In particular, if a city can: (1) solve the challenges of the implementation of urban bioenergy projects [28]; (2) focus on energy consumption centers such as the urban core and industrial parks; (3) improve the relevant energy infrastructure; and (4) promote the application of biomass fuel heating and power generation in cities, then distributed biomass energy construction based on urban marginal land could promote the development of new energy industries and achieve the transformation of biomass energy supply methods.
4.2. Practical Considerations of Urban Marginal Land
As mentioned above, the definition of urban agriculture was the livestock production and cultivation of food and fuel crops in urbanized areas, which can be directly used for market or household purposes [30,31]. Further, the aforementioned distributed biomass cropping on urban marginal land could be an important part of urban agriculture, from the perspective of the definition of urban agriculture. In recent years, China’s urban agriculture has made great progress. For example, Shanghai, which is one of the pilot demonstration cities for modern urban agriculture in China, has practiced urban agriculture for over 30 years. This eco-intensive, small-scale agricultural system could not only improve the profit of agricultural sightseeing but could also further promote the urban economy [65]. In the circumstances, the development of urban agriculture could provide implementation conditions for distributed biomass cropping and make contributions to the establishment of urban distributed bioenergy products. Although marginal land has relatively poor physical properties and low productivity, the bioenergy crops have strong resistance to external interference and can more easily adapt to the environment when compared with the regular crops of urban agriculture [2]. In addition, marginal land yields could be improved by optimizing the planting processes and selecting climatically appropriate crops [28]. Moreover, urban agriculture has played a prominent role in urban greening as well. As an another form of urban agriculture, urban garden provides a series of ecosystems services, including improving stormwater infiltration, enhancing biodiversity, and reducing urban heat island effect, etc. [31]. Research estimated that the total potential biofuel produced by garden waste biomass in China was 260 PJ [66]. In this context, urban marginal land may be another form of urban garden if the appropriate type of vegetation planted is chosen, and it has potential to implement the functions of urban greening and energy supply.
In addition to the potential of distributed energy, the urban energy supply in the different cities should also be considered. Our results showed that Urumqi and Lhasa have the largest proportion of marginal land, while the marginal land tends to account for a smaller proportion in the more developed cities with less grassland or bare land (e.g., Beijing, Shanghai, Shenzhen). These developed cities are often densely populated with limited land resources for biomass cropping. Distributed bioenergy production may be restricted by the high land values and labor costs, which, therefore, will make the implementation of bioenergy projects on urban marginal land a challenge in these cities. To solve this issue, in a case study of Eastern Massachusetts, Saha and Eckelman [16] reported a regional approach where bioenergy is supplied from the surrounding metropolitan area. This strategy could reduce the loss related to long-distance transportation and scattered energy infrastructure. Specifically, due to the high land prices and other underlying factors, it is unlikely that a large amount of potential marginal land could be practically used for cultivation in Boston. However, bioenergy crops grown in other cities and towns surrounding Boston could be explored to fulfill its energy demands as the transportation requirements and costs are relatively low. The results of this study showed that satellite cities can supply bioenergy for the core city, so as to reduce the high transportation and labor costs. In China, the construction of urban agglomerations is becoming a trend [67]. In such a scenario, it is more appropriate and efficient that other cities in the urban agglomeration supply the biomass feedstock for the core city, to satisfy its energy demands. For example, neighboring cities could supply extra biomass for Beijing in the Beijing-Tianjin-Hebei urban agglomeration. In this context, the planting and transportation of distributed biomass in urban agglomerations may facilitate the implementation of distributed bioenergy networks, and further contribute to the district heating or power supply, with a relatively low transportation cost, labor cost, and energy infrastructure consumption. Although the potential for the development of urban marginal land at large scales such as urban agglomerations is enormous, the realization of distributed bioenergy production on the regional scale may involve urban regional planning and regulatory issues. For example, the planning of distributed sites for biomass planting and energy production in cities, the selection of transportation routes, the construction of infrastructure, as well as the impact of urban marginal land development on the lives of urban residents are all issues that planners need to consider. Furthermore, the coordination and control of bioenergy production, transportation and supply in cities, as well as the supervision of environmental problems which may arise in the process of energy production, are all the problems that policy makers need to address.
Moreover, the possible contradiction between land use and urbanization may affect the development of marginal land, especially for faster growing cities. As rapid expansion of cities, the proportion of public open space (i.e., vacant land) suitable for marginal land development gradually decreases. Additionally, with the rapid expansion of the built-up areas, impervious surfaces and building densities gradually increase, resulting in the decrease of land between buildings. For instance, the potential marginal land area in the relatively developed cities of China, Shanghai and Hangzhou, is a small proportion of the urban area. In addition, with the boom of urban economy, the development of distributed bioenergy is also affected by the production and operating costs. Land values, labor costs, and transportation and storage costs vary from city to city; for example, price levels in megacities such as Beijing and Shanghai are significantly higher than cities such as Lhasa and Harbin that are relatively suitable for marginal land development. Therefore, there are some challenges in implementing marginal land development on a large scale in various cities in China.
5. Conclusions
In this paper, the urban marginal land availability in 20 representative cities of China was estimated using multi-view high-resolution remote sensing data. To the best of our knowledge, this is the first study to assess potential bioenergy production on urban marginal land over a large number of cities in China based on high-resolution satellite images with 3D building morphology information, and it is also the first time that the different categories of marginal land have been identified. In this research, urban marginal land was classified as vacant land (VL) and land between buildings (LBB), and satisfactory performances were obtained in the 20 cities, with OA values between 84.67% and 92.67% and Kappa values between 0.77 and 0.89.
Our results showed that: (1) The suitable marginal land area for energy crop cultivation ranges from 17.78 ± 1.66 km2 to 353.48 ± 54.19 km2 among the 20 cities. Among the different cities, Urumqi and Lhasa have the largest proportion, at more than 20% of the urban area. Urban marginal land tends to account for a smaller proportion of urban land in cities with a high degree of urbanization and less grassland or bare land. For instance, Shanghai, which features a high degree of development and a large proportion of impervious surfaces and buildings, has the lowest proportion of marginal land (5.71%). (2) In terms of the energy crop yield and fuel ethanol production, it was estimated that bioethanol production on marginal land could amount to between 0.005 and 0.13 mT in each city, and the bioenergy of one city could yield up to 2.1 × 10¹³ − 4.0 × 10¹⁴ J, which could be used directly for community heat and power production. (3) In the cities with a higher proportion of LBB, e.g., Shanghai, Haikou, and Hangzhou, the landscape composition of the marginal land (i.e., VL and LBB) is more even, and the shape complexity and fragmentation degree of the marginal land is lower.
Bioenergy production on urban marginal land has the potential to facilitate the development of a city’s clean energy economy and distributed biomass cropping. Although this paper mainly classified marginal land from the perspective of natural attributes, it can also be distinguished from economic and social attributes. For example, VL cannot only be further divided into green space and open space, but also be classified into construction idle land, industrial idle land, living and residential land according to the purpose and direction of urban land use. The exploration of the attributes of urban marginal land will be more complete if the corresponding data of economic and social attributes are sufficient. The results of this study will provide useful information for the policy makers and city planners to reclaim urban unused land and develop distributed bioenergy products at the city scale in China.
Author Contributions
Conceptualization, B.Z.; Data curation, B.Z., J.Y., and Y.C.; Formal analysis, B.Z., J.Y., and Y.C.; Funding acquisition, J.Y. and Y.C.; Investigation, B.Z.; Methodology, B.Z.; Project administration, J.Y.; Resources, Y.C.; Software, B.Z.; Validation, B.Z., J.Y., and Y.C.; Writing—original draft, B.Z.; Writing—review and editing, Y.C. All authors have read and agreed to the published version of the manuscript.
Funding
This research was funded by Environmental research project in Shenzhen City (from Ecological Environment Bureau of Shenzhen), the Shenzhen Science and Technology Program under Grant JCYJ20180306170645080, and the Foundation for Innovative Research Groups of the Natural Science Foundation of Hubei Province (No. 2020CFA003).
Institutional Review Board Statement
Not applicable.
Informed Consent Statement
Not applicable.
Data Availability Statement
The data of this study can be provided at the request of the corresponding author. The data are not publicly available because the data are also used in ongoing research.
Acknowledgments
The authors would like to express their sincere thanks to the experimental group members who provided their assistance in the study.
Conflicts of Interest
The authors declare no conflict of interest.
References
- Jiang, D.; Hao, M.; Fu, J.; Zhuang, D.; Huang, Y. Spatial-temporal variation of marginal land suitable for energy plants from 1990 to 2010 in China. Sci. Rep. 2014, 4, 5816. [Google Scholar] [CrossRef] [Green Version]
- Qin, Z.; Zhuang, Q.; Cai, X.; He, Y.; Huang, Y.; Jiang, D.; Lin, E.; Liu, Y.; Tang, Y.; Wang, M.Q. Biomass and biofuels in China: Toward bioenergy resource potentials and their impacts on the environment. Renew. Sust. Energy Rev. 2018, 82, 2387–2400. [Google Scholar] [CrossRef]
- Tang, Y.; Xie, J.-S.; Geng, S. Marginal land-based biomass energy production in China. J. Int. Plant Biol. 2010, 52, 112–121. [Google Scholar] [CrossRef] [PubMed]
- Hassan, M.H.; Kalam, M.A. An Overview of Biofuel as a Renewable Energy Source: Development and Challenges. Procedia Eng. 2013, 56, 39–53. [Google Scholar] [CrossRef] [Green Version]
- Li, X.; Huang, Y.; Gong, J.; Zhang, X. A study of the development of bio-energy resources and the status of eco-society in China. Energy 2010, 35, 4451–4456. [Google Scholar] [CrossRef]
- Balat, M.; Balat, H. Recent trends in global production and utilization of bio-ethanol fuel. Appl. Energy 2009, 86, 2273–2282. [Google Scholar] [CrossRef]
- Jiang, D.; Zhuang, D.; Fu, J.; Huang, Y.; Wen, K. Bioenergy potential from crop residues in China: Availability and distribution. Renew. Sust. Energy Rev. 2012, 16, 1377–1382. [Google Scholar] [CrossRef]
- Feng, Q.; Chaubey, I.; Engel, B.; Cibin, R.; Sudheer, K.P.; Volenec, J. Marginal land suitability for switchgrass, Miscanthus and hybrid poplar in the Upper Mississippi River Basin (UMRB). Environ. Model. Softw. 2017, 93, 356–365. [Google Scholar] [CrossRef] [Green Version]
- Renewables 2018 Global Status Report. Available online: http://www.ren21.net/status-of-renewables/global-status-report/ (accessed on 13 March 2019).
- Cobuloglu, H.I.; Büyüktahtakın, İ.E. Food vs. biofuel: An optimization approach to the spatio-temporal analysis of land-use competition and environmental impacts. Appl. Energy 2015, 140, 418–434. [Google Scholar] [CrossRef]
- Liu, T.; Huffman, T.; Kulshreshtha, S.; McConkey, B.; Du, Y.; Green, M.; Liu, J.; Shang, J.; Geng, X. Bioenergy production on marginal land in Canada: Potential, economic feasibility, and greenhouse gas emissions impacts. Appl. Energy 2017, 205, 477–485. [Google Scholar] [CrossRef]
- Niblick, B.; Landis, A.E. Assessing renewable energy potential on United States marginal and contaminated sites. Renew. Sust. Energy Rev. 2016, 60, 489–497. [Google Scholar] [CrossRef] [Green Version]
- Gelfand, I.; Sahajpal, R.; Zhang, X.; Izaurralde, R.C.; Gross, K.L.; Robertson, G.P. Sustainable bioenergy production from marginal lands in the US Midwest. Nature 2013, 493, 514–517. [Google Scholar] [CrossRef]
- Milbrandt, A.R.; Heimiller, D.M.; Perry, A.D.; Field, C.B. Renewable energy potential on marginal lands in the United States. Renew. Sust. Energy Rev. 2014, 29, 473–481. [Google Scholar] [CrossRef]
- Glithero, N.J.; Wilson, P.; Ramsden, S.J. Optimal combinable and dedicated energy crop scenarios for marginal land. Appl. Energy 2015, 147, 82–91. [Google Scholar] [CrossRef]
- Saha, M.; Eckelman, M.J. Geospatial assessment of regional scale bioenergy production potential on marginal and degraded land. Resour. Conserv. Recycl. 2018, 128, 90–97. [Google Scholar] [CrossRef]
- Xue, S.; Lewandowski, I.; Wang, X.; Yi, Z. Assessment of the production potentials of Miscanthus on marginal land in China. Renew. Sust. Energy Rev. 2016, 54, 932–943. [Google Scholar] [CrossRef]
- Zhuang, D.; Jiang, D.; Liu, L.; Huang, Y. Assessment of bioenergy potential on marginal land in China. Renew. Sust. Energy Rev. 2011, 15, 1050–1056. [Google Scholar] [CrossRef]
- Edrisi, S.A.; Abhilash, P.C. Exploring marginal and degraded lands for biomass and bioenergy production: An Indian scenario. Renew. Sust. Energy Rev. 2016, 54, 1537–1551. [Google Scholar] [CrossRef]
- Cai, X.; Zhang, X.; Wang, D. Land availability for biofuel production. Environ. Sci. Technol. 2010, 45, 334–339. [Google Scholar] [CrossRef] [PubMed]
- Feng, Q.; Chaubey, I.; Cibin, R.; Engel, B.; Sudheer, K.P.; Volenec, J.; Omani, N. Perennial biomass production from marginal land in the Upper Mississippi River Basin. Land Degrad. Dev. 2018, 29, 1748–1755. [Google Scholar] [CrossRef]
- Kammen, D.M.; Sunter, D.A. City-integrated renewable energy for urban sustainability. Science 2016, 352, 922–928. [Google Scholar] [CrossRef] [Green Version]
- Kraxner, F.; Aoki, K.; Kindermann, G.; Leduc, S.; Albrecht, F.; Liu, J.; Yamagata, Y. Bioenergy and the city–What can urban forests contribute? Appl. Energy 2016, 165, 990–1003. [Google Scholar] [CrossRef]
- Grewal, P.S.; Grewal, P.S. Can cities become self-reliant in energy? A technological scenario analysis for Cleveland, Ohio. Cities 2013, 31, 404–411. [Google Scholar] [CrossRef]
- Madlener, R.; Bachhiesl, M. Socio-economic drivers of large urban biomass cogeneration: Sustainable energy supply for Austria’s capital Vienna. Energy Policy 2007, 35, 1075–1087. [Google Scholar] [CrossRef]
- Comber, A.; Dickie, J.; Jarvis, C.; Phillips, M.; Tansey, K. Locating bioenergy facilities using a modified GIS-based location–allocation-algorithm: Considering the spatial distribution of resource supply. Appl. Energy 2015, 154, 309–316. [Google Scholar] [CrossRef] [Green Version]
- Zhao, X.; Monnell, J.D.; Niblick, B.; Rovensky, C.D.; Landis, A.E. The viability of biofuel production on urban marginal land: An analysis of metal contaminants and energy balance for Pittsburgh’s Sunflower Gardens. Landsc. Urban. Plan. 2014, 124, 22–33. [Google Scholar] [CrossRef]
- Saha, M.; Eckelman, M.J. Geospatial assessment of potential bioenergy crop production on urban marginal land. Appl. Energy 2015, 159, 540–547. [Google Scholar] [CrossRef]
- Niblick, B.; Monnell, J.D.; Zhao, X.; Landis, A.E. Using geographic information systems to assess potential biofuel crop production on urban marginal lands. Appl. Energy 2013, 103, 234–242. [Google Scholar] [CrossRef]
- Yang, Z.; Cai, J.; Sliuzas, R. Agro-tourism enterprises as a form of multi-functional urban agriculture for peri-urban development in China. Habitat Int. 2010, 34, 374–385. [Google Scholar] [CrossRef]
- McClintock, N.; Mahmoudi, D.; Simpson, M.; Santos, J.P. Socio-spatial differentiation in the Sustainable City: A mixed-methods assessment of residential gardens in metropolitan Portland, Oregon, USA. Landsc. Urban. Plan. 2016, 148, 1–16. [Google Scholar] [CrossRef] [Green Version]
- Jiang, D.; Hao, M.; Fu, J.; Liu, K.; Yan, X. Potential bioethanol production from sweet sorghum on marginal land in China. J. Clean Prod. 2019, 220, 225–234. [Google Scholar] [CrossRef]
- Wang, F.; Shi, X. Geospatial analysis for utilizing the marginal land in regional biofuel industry: A case study in Guangdong Province, China. Biomass Bioenergy 2015, 83, 302–310. [Google Scholar] [CrossRef]
- Nie, Y.; Cai, W.; Wang, C.; Huang, G.; Ding, Q.; Yu, L.; Li, H.; Ji, D. Assessment of the potential and distribution of an energy crop at 1-km resolution from 2010 to 2100 in China–The case of sweet sorghum. Appl. Energy 2019, 239, 395–407. [Google Scholar] [CrossRef]
- Arodudu, O.; Ibrahim, E.; Voinov, A.; van Duren, I. Exploring bioenergy potentials of built-up areas based on NEG-EROEI indicators. Ecol. Indic. 2014, 47, 67–79. [Google Scholar] [CrossRef] [Green Version]
- Van Meerbeek, K.; Ottoy, S.; De Meyer, A.; Van Schaeybroeck, T.; Van Orshoven, J.; Muys, B.; Hermy, M. The bioenergy potential of conservation areas and roadsides for biogas in an urbanized region. Appl. Energy 2015, 154, 742–751. [Google Scholar] [CrossRef]
- Huang, X.; Wang, Y. Investigating the effects of 3D urban morphology on the surface urban heat island effect in urban functional zones by using high-resolution remote sensing data: A case study of Wuhan, Central China. ISPRS J. Photogram. Remote Sens. 2019, 152, 119–131. [Google Scholar] [CrossRef]
- Huang, X.; Wen, D.; Li, J.; Qin, R. Multi-level monitoring of subtle urban changes for the megacities of China using high-resolution multi-view satellite imagery. Remote Sens. Environ. 2017, 196, 56–75. [Google Scholar] [CrossRef]
- Huang, X.; Wang, Y.; Li, J.; Chang, X.; Cao, Y.; Xie, J.; Gong, J. High-resolution urban land-cover mapping and landscape analysis of the 42 major cities in China using ZY-3 satellite images. Sci Bull. 2020, 65, 1039–1048. [Google Scholar] [CrossRef]
- Liu, C.; Huang, X.; Wen, D.; Chen, H.; Gong, J. Assessing the quality of building height extraction from ZiYuan 3 multi view imagery. Remote Sens. Lett. 2017, 8, 907–916. [Google Scholar] [CrossRef]
- China Land Use/Cover Datasets. Available online: http://www.resdc.cn/ (accessed on 30 January 2019).
- Kuang, W.; Liu, J.; Dong, J.; Chi, W.; Zhang, C. The rapid and massive urban and industrial land expansions in China between 1990 and 2010: A CLUD-based analysis of their trajectories, patterns, and drivers. Landsc. Urban. Plan. 2016, 145, 21–33. [Google Scholar] [CrossRef]
- Geographical Information Monitoring Cloud Platform. Available online: http://www.dsac.cn/ (accessed on 5 February 2019).
- China Soil Database. Available online: http://vdb3.soil.csdb.cn/ (accessed on 20 January 2019).
- ASTER Global Digital Elevation Model. Available online: https://earthexplorer.usgs.gov/ (accessed on 1 November 2019).
- Arefi, H.; Reinartz, P. Accuracy Enhancement of ASTER Global Digital Elevation Models Using ICESat Data. Remote Sens. 2011, 3, 1323–1343. [Google Scholar] [CrossRef] [Green Version]
- Huang, X.; Cai, Y.F.; Li, J. Evidence of the mitigated urban particulate matter island (UPI) effect in China during 2000–2015. Sci. Total Environ. 2019, 660, 1327–1337. [Google Scholar] [CrossRef] [PubMed]
- Li, H.; Lian, Y.; Wang, X.; Ma, W.; Zhao, L. Solar constant values for estimating solar radiation. Energy 2011, 36, 1785–1789. [Google Scholar] [CrossRef]
- Lyons, M.B.; Keith, D.A.; Phinn, S.R.; Mason, T.J.; Elith, J. A comparison of resampling methods for remote sensing classification and accuracy assessment. Remote Sens. Environ. 2018, 208, 145–153. [Google Scholar] [CrossRef]
- McGarigal, K. FRAGSTATS HELP. Available online: http://www.umass.edu/landeco/research/fragstats/documents/fragstats.help.4.2.pdf (accessed on 14 March 2019).
- Su, S.; Hu, Y.N.; Luo, F.; Mai, G.; Wang, Y. Farmland fragmentation due to anthropogenic activity in rapidly developing region. Agric. Syst. 2014, 131, 87–93. [Google Scholar] [CrossRef]
- Liang, C.; Penghui, J.; Wei, C.; Manchun, L.; Liyan, W.; Yuan, G.; Yuzhe, P.; Nan, X.; Yuewei, D.; Qiuhao, H. Farmland protection policies and rapid urbanization in China: A case study for Changzhou City. Land Use Policy 2015, 48, 552–566. [Google Scholar] [CrossRef]
- Jansson, C.; Westerbergh, A.; Zhang, J.; Hu, X.; Sun, C. Cassava, a potential biofuel crop in (the) People’s Republic of China. Appl. Energy 2009, 86, S95–S99. [Google Scholar] [CrossRef]
- Tian, Y.; Zhao, L.; Meng, H.; Sun, L.; Yan, J. Estimation of un-used land potential for biofuels development in (the) People’s Republic of China. Appl. Energy 2009, 86, S77–S85. [Google Scholar] [CrossRef]
- Chen, W.; Wu, F.; Zhang, J. Potential production of non-food biofuels in China. Renew. Energy 2016, 85, 939–944. [Google Scholar] [CrossRef]
- Wang, Y.; Bi, Y.; Tang, J. Progress and development trend of China’s energy crop research. Forum Sci. Technol. China 2009, 3, 124–128. [Google Scholar]
- Yinchuan Statistical Yearbook—2018. Available online: http://tjj.yinchuan.gov.cn/tjsj/ndsj/201902/P020190219544999835664.pdf (accessed on 23 March 2019).
- Middle- and Long-Term Development Plan for Renewable Energy in China. Available online: http://www.sdpc.gov.cn/fzgggz/fzgh/ghwb/gjjgh/200709/P020150630514238979659.pdf (accessed on 21 May 2019).
- Peidong, Z.; Yanli, Y.; Yongsheng, T.; Xutong, Y.; Yongkai, Z.; Yonghong, Z.; Lisheng, W. Bioenergy industries development in China: Dilemma and solution. Renew. Sust. Energy Rev. 2009, 13, 2571–2579. [Google Scholar] [CrossRef]
- 12th Five-Year Renewable Energy Strategic Plan. Available online: http://www.nea.gov.cn/2013-01/28/c_132132808.htm (accessed on 26 July 2019).
- Qiu, H.; Sun, L.; Huang, J.; Rozelle, S. Liquid biofuels in China: Current status, government policies, and future opportunities and challenges. Renew. Sust. Energy Rev. 2012, 16, 3095–3104. [Google Scholar] [CrossRef]
- Zhong, C.; Cao, Y.-X.; Li, B.-Z.; Yuan, Y.-J. Biofuels in China: Past, present and future. Biofuels, Bioprod Bioref 2010, 4, 326–342. [Google Scholar] [CrossRef]
- Wang, Q. Time for commercializing non-food biofuel in China. Renew. Sust. Energy Rev. 2011, 15, 621–629. [Google Scholar] [CrossRef]
- Qiu, H.; Huang, J.; Yang, J.; Rozelle, S.; Zhang, Y.; Zhang, Y.; Zhang, Y. Bioethanol development in China and the potential impacts on its agricultural economy. Appl. Energy 2010, 87, 76–83. [Google Scholar] [CrossRef]
- Wan, N.F.; Cai, Y.M.; Shen, Y.J.; Ji, X.Y.; Wu, X.W.; Zheng, X.R.; Cheng, W.; Li, J.; Jiang, Y.P.; Chen, X.; et al. Increasing plant diversity with border crops reduces insecticide use and increases crop yield in urban agriculture. Elife 2018, 7, e35103. [Google Scholar] [CrossRef]
- Shi, Y.; Ge, Y.; Chang, J.; Shao, H.; Tang, Y. Garden waste biomass for renewable and sustainable energy production in China: Potential, challenges and development. Renew. Sust. Energy Rev. 2013, 22, 432–437. [Google Scholar] [CrossRef]
- Guiding Opinions of the National Development and Reform Commission on the Development of Modern Metropolitan Area. Available online: http://www.gov.cn/xinwen/2019-02/21/content_5367465.htm (accessed on 30 July 2019).


Publisher’s Note: MDPI stays neutral with regard to jurisdictional claims in published maps and institutional affiliations. |
© 2021 by the authors. Licensee MDPI, Basel, Switzerland. This article is an open access article distributed under the terms and conditions of the Creative Commons Attribution (CC BY) license (https://creativecommons.org/licenses/by/4.0/).