Abstract
Business school curriculums are designed to improve business skills and a student’s eventual workplace performance. In addition to these business skill sets the emerging business environment demands softer skills associated with ethical decision-making and sustainable business practices. The objective of the study is to identify the key influencers of ethical orientation and attitudes towards the environment as a first critical step for curriculum planning designed to develop both ethical decision-making and environmental sensibilities of students in business schools. Using a bivariate regression analysis (OLS) that compared the established New Ecological Paradigm (NEP) scale and the newly introduced Ethical Orientation Scale (EOS), this study assesses environmental eco-consciousness and ethical orientation over time and across varying socio-demographic variables. The study shows first, that in addition to socio-cultural variables, situational factors influence ethical decision-making. Secondly, it illuminates that ethical orientations as measured by the EOS predicts beliefs about the environment as measured by the NEP scale. It further provides evidence of the ethical underpinnings of the New Ecological Paradigm as well as provides initial validation for the new EOS. These outcomes provide additional levers to assist business educators in the creation of high impact teaching strategies to measure and encourage ethical decision-making and sustainable business practices that protect the environment.
1. Introduction
Business schools construct curriculums that support the development of business skills and knowledge to improve workplace performance [1]. However, many business schools seek additional learning outcomes. For example, the Lang School of Business & Economics’ (University of Guelph) mission “to be recognized locally and globally for our commitment to developing future leaders for a more sustainable world” focuses on developing students into value driven leaders by improving both their ethical decision- making skills and environmental sensibilities [2]. High impact teaching approaches are necessary to develop these skills. This further requires finding effective ways to measure success. While there are several proven methods to measure how successful a school has been in improving hard skills [3], it is more challenging to determine how successful a curriculum was in achieving these additional softer skills. Understanding students’ ethical orientations, their attitudes toward the environment, and key influencers for these beliefs and attitudes are critical first steps for curriculum planning and assessment identification that develop these less tangible skills.
This study assesses students’ environmental eco-consciousness and ethical orientations over-time using two scales, a pre-existing and a newly created measurement tool. Students were provided the statements from a pre-established scale, the New Ecological Paradigm [4] (NEP), to identify and compare between cohorts their beliefs regarding the relationship between humankind and nature. The NEP scale has been used extensively in quantitative research verifying it as a credible and reliable scale for measuring people’s ecological attitudes [5]. A review of the literature on ethical orientation reveals numerous gaps leading to a new scale creation that measures how students intend to make ethical decisions when faced with an ethical dilemma in a workplace setting. The Ethical Orientation Score (EOS) scale identifies students as either more deontological or more teleological (Utilitarian or egoistic) depending on their responses. Additionally, it measures the shift in the subject’s responses when additional situational factors are revealed surrounding the dilemma. We investigate the relationship between both these scales to better understand the theory underpinning the NEP scale and to help validate the EOS as an emergent measurement tool. Furthermore, we test the influences of demographic and socio-cultural markers, including religious affiliation on both scale scores.
To understand the basis of the NEP scale, we conduct a scoping literature review to determine the underpinning belief systems/theories that potentially informed the statements used to form the NEP, as the creators of the scale [6] did not clearly provide an adequate conceptualization of their respective constructs in their original articles [7]. Many scholars since, including the author of the scale, provide hindsight conjecture on the theoretical foundations for this scale with no definitive consensus. The most convincing of explanations anchor the scale in ethical philosophies/orientations [7,8,9,10].
A Confirmatory factor analysis (CFA) verified the factor structure of the 12- observed responses that informed the new EOS scale allowing us to investigate whether there is a co-relation between the NEP and the new EOS by matching the respective scale responses. A positive and significant relationship between the two scales would provide further evidence of the NEP scale’s ethical theory underpinnings and strengthen the validity for the EOS as an emergent measurement tool. Understanding the ethical values represented by the NEP and EOS student responses and their correlation could help identify high impact teaching practises necessary to ensure alignment with a business school’s pro-ethical and pro-environmental value development goals.
2. The Literature
2.1. Measuring Environmental Attitudes
Over the years there have been a large and diverse number of scales designed to measure environmental attitudes [11,12,13] (p. 483). One reason for the many scales in existence today is connected to opposing conceptual understanding of attitude systems in general. Specifically, there is debate on how values connect to attitude systems and how attitudes and beliefs connect to intentions and behaviours [14,15]. As such, some studies seek to unpack the belief systems and underpinning theories of many of the scales that measure environmental attitudes post implementation [12].
The most broadly used scale in the literature is The New Environmental Paradigm initially developed in 1978 by Dunlap and Van Liere and later revised in 1992 and again in 2000 into the New Ecological Paradigm (NEP) [11]. The NEP scale has been implemented, discussed, and cited in over 8000 journal articles between 1978–2020 (JSTOR, Google scholar, Web of Science, Taylor & Francis). The scale has been used extensively in quantitative research [11]. Studies show significant associations between the NEP scale and different behavioural intentions and observed behaviours [16,17,18,19,20] indicating that the NEP scale possesses predictive validity for both intention and behaviour. Based on these findings we chose to use this scale allowing us to compare with other studies to test the robustness of our results.
A social paradigm represents the collective understanding by a society on how the world functions around them [21]. The basic tenets of this belief structure are supported by the teachings in our churches, schools, and homes. Milbrath [22] defines the dominant social paradigm (DSP) as “the values, beliefs, institutions, habits etc., that collectively provide social lenses through which individuals and groups interpret their social world (p. 7)”.
The DSP spawning from the industrial revolution positioned humans as dominant to nature [23]. Humans should use science and technology to dominate nature and extract from its material goods that are presumed to lead to a higher quality of life. The New Ecological Paradigm (NEP) challenges the DSP and explores society’s beliefs about the ideal relationship between humans and nature. This NEP scale measures a person’s pro-ecological world view, and captures the differences in attitudes toward the environment between individuals and groups [24].
2.2. Measuring Ethical Orientations
A common theme of all ethical decision-making models in the literature is that decision making in the business ethics environment is complicated. Observed ethical behaviour is dependent on both individual and organizational level factors and their interplay [25]. Additionally, “ethical perceptions by an individual go through a series of cognitive processing steps, which are then influenced by a variety of organizational or other situational factors and moral intensity” of the situation [26] (p. 197). There are several beliefs and value dimensions cited in literature that assist in explaining why people may differ in their ethical behaviour.
In past studies, deontological and teleological philosophical theories have been presented as the most significant influences on ethical decision making [27,28]. Deontological ethical theories involve rule-based thinking and are grounded firmly in the idea of duty. When making ethical decisions one should stick to the pre-determined rule regardless of the consequences. These theories state that ethical dilemmas should be resolved by applying the universal standard or code of justice that everyone must follow.
Teleological theories involve end-based thinking often referred to as consequentialism. Classical Utilitarianism falls within this theory and states that ethical decisions should result in the greatest benefit for the largest number of people [29]. The Egoistic Utilitarians (Machiavelli; Weber) on the other hand, use a utilitarian calculation to have the greatest amount of good accrue to themselves. The teleological approach to ethical decisions can be highly fluid and is dependent on the frameworks used to identify what is right and what is wrong [30].
In other research, positivism versus negativism has been found to influence people’s ethical behaviour. People who are positive oriented tend to be optimistic about the future versus negative people who are pessimistic about the future [31]. Shainess [32] found that individuals associated with positivism develop an ethical sense that recognizes the role of conscience in decision making. On the other hand, Love & Simmons [33] found that negative personal attitudes are associated with malfeasance [34].
Craft [30] cited findings from across several studies that explore the relationship of deontological and teleological, positivism versus negativism and idealism (universality of moral rules) versus relativism (morality as a relative issue). In most cases, studies found that an orientation of positivism/deontological and idealism combined is less prone to ethical lapses in decision making than the orientation of negativism and relativism. The explanation for this, centers on the objective versus subjective nature of the former versus the latter orientations.
Many researchers have developed scales that combine a series of questions/statements in an attempt to measure an individual’s ethical orientation using many of the ethical theories highlighted above. Forsyth [35] constructed the Ethics Positions Scale measuring two dimensions of morality, relativism and idealism. Deontology and teleology are similar to the concepts of relativism and idealism. In this scale, Forsyth [35] demonstrates the orthogonality of the idealistic and relativistic variables and introduces four dimensions of ethical orientation (absolutists, situationists, exceptionists and subjectivists) based on the degree of idealism and relativism in subject responses. Trevino [36] introduced a “person-situation interactionist model of ethical decision making in organizations that combines individual variables (moral development, ego strength, field dependence, and locus of control) with situational variables (the immediate job context, organizational culture, and characteristics of the work) to explain and predict the ethical decision-making behavior of individuals in organizations (p. 601)”. The Multi-dimensional Scale for Business Ethics created by Reidenbach & Robin [37] and revised by Hansen [38], measures three dimensions: 1. Moral equity dimension; 2. Relative dimension; 3. Contractual dimension. Five theories underpin this scale: justice theory, relativism, deontology, teleology-egotism (individual versus society) and teleology-utilitarianism. Swartz [39], introduced the Swartz value scale rating individuals as more hedonistic or Universalistic.
The Moral Foundations Questionnaire [40] based on moral foundations theory, measures five universal moral foundations: 1. Harm/care; 2. Fairness/Reciprocity; 3. Ingroup/loyalty; 4. Authority/respect; 5. Purity/sanctity. Most recently, Kahane et al. [41] introduced the Oxford Utilitarian Scale examining ‘sacrificial’ moral dilemmas (i.e., trolley dilemma [42]). The scale measures the degree that a person’s moral thinking leans more toward utilitarianism. The greater the unqualified impartiality and the less space and weight given to the moral rules constraining the promotion of wellbeing, the closer the person would be to the views of a classical utilitarian.
Despite the development of multiple scales found in the literature, there is an overall lack of consensus on an appropriate measurement technique for ethical orientation. Several researchers found that individuals often use multiple decision rules when making ethical judgements, and that the decision rule applied depended on the problem as well as the context in which the decision was made [41]. A few of these researchers use the dual cognition process model [43] to explain why different philosophies may be used by the same individual. Specifically, the decision made would vary depending on whether the automatic, quick and intuitive processes guided the response or whether the subject slowed their thinking process resulting in a more controlled response [44,45]. Deontological judgements would be a result of immediate intuitive and emotional gut-reactions, and utilitarian, for example, would involve effortful reasoning [46].
The observation that different rules apply based on situational context may explain the most recent trends in the literature, specifically, the exploration of the intrinsic and extrinsic moderators that influence ethical decision making [47]. Despite the plethora of studies that investigate the many processes and situational factors involved in ethical decision making, several gaps remain [28,30,47].
2.3. NEP and Ethical Orientations
Both theoretical and empirical studies have confirmed the importance of an individual’s values in forming specific beliefs and behaviours [48]. As such, individual values could potentially predict both attitudes and behaviour intentions of these same individuals.
To understand this relationship, a scoping review was conducted to investigate literature that discussed the formation and theoretical underpinnings of the dominant social paradigm (DSP) and subsequent development of the New Ecological Paradigm (NEP). Data was obtained from five databases of inclusive of JSTOR, Web of Science, Taylor & Francis, Omni and Google Scholar. The search query used was an exact match for “dominant social paradigm” and “dsp”. Searching for both the acronym and the term ensured that the term was used multiple times in the literature. The Boolean search operator AND was used to ensure that both terms were present in the literature. NEP was added to the search but was not required to be a term present in the literature. JSTOR found 45 relevant search results. Google scholar found 1020 results excluding patents and citations. Web of Science yielded seven relevant articles and Taylor & Francis, 85. The literature search did not restrict languages or date of publication. A total of 69 articles where identified as relevant which discuss or use the idea of the current social paradigms (both DSP and NEP) between years 1983 to 2020. The authors of the DSP [23] and the NEP [6] did not clearly provide an adequate conceptualization of their respective constructs in their original articles [7]. There exists extensive literature on the NEP with tremendous diversity in the use and interpretation and a myriad of uses and interpretations emerge from the data gathered from the NEP instrument [49]. Within this subset of articles, 11 investigated and directly discussed the underpinning belief systems/theories that potentially informed the statements used to form the NEP Scale.
In an article written by one of the original authors of the NEP, Dunlap [50] admits that the widespread use of the scale globally and its proven predictive validity was unexpected. In hindsight, he posits that the scale measures primitive beliefs about humankind’s relationship with nature and gets at the rules that govern this relationship. In this article Dunlap implicates the DSP that placed human needs above all other, as being supportive of an egoist utilitarian orientation. Whereas the NEP suggests that there are rules in place that disable this utilitarian type of argument and support the equal value of nature with its human inhabitants, stating for example that ‘it is immoral to drive an animal species to extinction’.
La Trobe and Acott [51] identify that there is a moral duty of humans to the rest of nature and therefore, the shift from the DSP to NEP involves a recognition of the intrinsic value of nature. These authors describe the DSP and NEP as two opposing ends of an environmental attitude continuum, where the DSP’s prefers utilitarian values centered on economic calculations and the NEP, a recognition of the value of nature. Kilbourne et al. [7] identified that individuals who are more aligned with DSP are less likely to adopt an ecological worldview. Given this finding, these same individuals would also score low on the NEP scale. A summary of these articles suggests lower NEP scores lean closer to DSP post industrialization and involve utilitarian decision rules (teleological), whereas the higher NEP score is based off a clear set of rules governing the relationship between people and nature, representing a more deontological approach.
In an article entitled “Value Orientations to Explain Beliefs Related to Environmental Significant Behavior”, de Groot [9] introduces three value orientations that may be relevant for understanding what motivates the beliefs toward the environment: egoistic, altruistic and biospheric. The egoist value orientation result is of most interest for this study. The egoist is most interested in the costs and benefits for them personally. The logic is that the egoist with their selfish values would be less likely to behave in an environmentally friendly manner than people whose values were more community oriented [52]. A key finding from this study shows those that identify with Egoist perspective have a statistically significant, negative correlation to pro-environmental beliefs intentions and behaviour [53,54].
“The new ecological paradigm revisited: anchoring the NEP scale in environmental ethics” by Lundmark [10] uses environmental ethics to investigate the underpinning theory of the NEP scale. Specifically, it attempts to determine which ethical orientations are aligned with the scale’s components. Anthropocentrism and ecocentrism were appropriately used to structure the analysis, as these two theories capture most of the discussions surrounding the relationships between human beings and nature.
Anthropocentrism purports that humans exist separately from nature and are more worthy than other organisms. Nature’s value is instrumental and therefore natural resources are to be used for human purposes. It empowers humans to use natural resources solely for the purpose of improving their wealth and well-being (utilitarian). Anthropocentrism therefore aligns with a more teleological orientation. In contrast to this theory, ecocentrism suggests that humans and nature are interdependent with neither being superior to the other and decisions should focus on the maximizing of welfare for nature and humans simultaneously. Given nature’s intrinsic value versus extrinsic value position [10] the ethical positions of anthropocentrism and ecocentrism exist at opposite ends of a spectrum, based on this status given to non-human beings. The NEP corrects for the imbalance established by anthropocentrism view from the former DSP and is closely aligned with ecocentrism, a point of view that attributes equal rights to all nature. As such, Lundmark [10] finds a plausible match between the DSP and anthropocentric beliefs, and a clear fit between ecocentrism and the NEP. Kopnina et al. further supported this connection stating that anthropocentrism is aligned with a utilitarian argument [55].
2.4. Evironmental and Ethical Orientations Gaps in the Literature
To address the gaps in the literature on ethical orientation, we introduce the Ethical Orientation Score scale. Many researchers have developed scales for ethical orientation contained in ethical theories, however, there is a lack of consensus on an appropriate measurement technique given a shared observation that different rules apply based on situational context. To this end, the EOS measures both the intended actions of subjects in a hypothetical business workplace, while also exploring how those same decisions change dependent on the situational context. Specifically, what happens to the subject’s intended responses when it comes to moral dilemmas where deontological rules (i.e., rules having to do with moral integrity and honesty), are in conflict with prosocial concerns (i.e., loyalty) in the context of interpersonal relationships within the workplace. The questions that comprise the scale are scaffolded allowing the observation of the situational factors that may or may not lead to a shift in subject responses.
Further, the new EOS results are used to test whether deontological and teleological ethical theories anchor the NEP scale development. Despite, the NEP scales widescale use worldwide, there is no conclusive evidence to verify the ideological beliefs underpinning the scales construct. A significant finding indicating that the EOS has predictive power for NEP scores, would suggest that influences on a student’s moral formation and development may affect their environmental attitudes. Hence, a business school’s ability to enhance pro-ethical and pro-environmental attitudes and values should at the very least consider this co-relation within its curriculum design.
3. Materials and Methods
3.1. Participants
The target population was undergraduate business school students. The sample for this study, consisted of 2410 first year introductory business and 603 fourth year strategy capstone business students from a public Canadian university (representing 98% of the selected framing sample). The students completed a questionnaire designed to measure the students’ attitudes and attitudinal changes over-time as it pertains to the environment and workplace ethical dilemmas. This questionnaire is part of a longitudinal study to be completed in late 2020 that tracks student responses both in their first and fourth year of study in order to measure change in same student attitudes. This fall and winter mark the first cohort of fourth year students who will complete the same survey in both their first and fourth year (2020/2021).
3.2. The Questionnaire
The questionnaire consisted of forty-two questions including ten demographic questions, five learning preference questions, fifteen questions used to establish their New Ecological Paradigm (NEP) score and twelve question to establish an Ethical Orientation Scale (EOS) score for each student The Research Ethics Board approved a grade allocation for students completing the study. Students in first year were awarded a two percent grade allocation for survey completion and fourth year students were awarded a one percent grade allocation. Students had an option to complete a simple alternative assignment in lieu of the survey should they have chosen not to participate.
The electronic questionnaire took approximately 30 min to complete. Participants were presented with text informing them that their responses would be associated with their name and ID. The students could complete portions of the questionnaire and return at any-time to complete it later as long as it was completed during the seven-day window. A scenario methodology (providing short scenarios to describe a situation) for establishing each student’s EOS was necessary to give the subjects context for the decisions they are asked to make within the survey.
3.3. The Analysis
In total we collected usable data from 2891 student survey observations. In addition to typical demographic information, a New Ecological Paradigm (NEP) score and an Ethical Orientation Scale (EOS) score were calculated for each student based on their responses to the corresponding questions needed to calculate these scores. A bivariate (OLS) statistical model was implemented. The bivariate OLS model is a best fit1 given the theory and the research design for this study.
To understand the causes of the observed NEP score, we ran two Ordinary Least Squares regressions (OLS) ensuring our data met the assumptions necessary for a linear regression to give a valid result2. The dependent variable is a continuous NEP score ranging from 1–5. There are two types of explanatory variables, categorical (i.e., country of birth, religious affiliation, major within the business school and gender) and continuous (i.e., years residing in Canada, Ethical Orientation Score).We ran two additional regressions with EOS as the dependent variable using the same categorical variables and continuous variables but substituted the continuous EOS variable for the continuous NEP to observe and compare how the explanatory variables influence each scale. (The research flow diagram is found in Appendix C).
3.4. The Hypothesis
3.4.1. Dependent Variable
The New Ecological Paradigm scale. A NEP scaled from 1 to 5 was assigned to each student based on their responses to a series of fifteen statements used to assess a person’s ecological view of the world, with a high NEP score (5) representing the most pro-ecological world view. “The fifteen questions from the NEP scale can be broken down into five categories to reflect varying aspects of ecological orientation” [4] (p. 432). The 5 categories, or facets, are as follows (Figure 1).
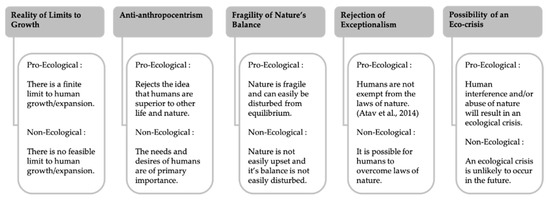
Figure 1.
5 Categories of statements used to form the NEP scale to determine ecological orientation.
3.4.2. Explanatory Variables
The Ethical Orientation score (EOS). An EOS scaled from 1 to 5 was assigned to each student based on their responses to the twelve ethical questions posed after reading a workplace case study to establish context. Similar questions were originally used in a study by Davis and Welton [56] designed to test the differences in responses to the ethical questions between undergraduate and graduate accounting students. However, in their study, the students were provided with no context or scenario in which to better understand the nature of the questions being asked. In the Davis and Welton study [56] it seems unlikely that first year students would fully understand what was being asked without an accompanying story. Therefore, a case study was written (see Appendix A) where the students were asked to apply the statements to a specific case to better contextualize what they were being asked. After reading the short workplace scenario, students were asked to respond to a general statement about the situation using a 5-point Likert scale ranging from strongly disagree to strongly agree; different from the 3-point Likert scale used by Davis. The students are then provided with additional information and asked the same question again, only this time with more context, again using a 5-point Likert scale.
The aforementioned twelve statements were broken into five categories, four of which reflect R. M. Kidders’ framework of ‘right versus right’ paradigms of ethical dilemmas from his book “How Good People Make Tough Choices” [57]. The statements that fall into these four categories include situations where one must agree or disagree to an action, where agreeing or disagreeing to the statement could both be right and therefore the situation poses an ethical dilemma. The five categories are as following: (1) Telling the truth vs. remaining loyal to family, friend or colleague. There are certain situations where being loyal to a friend or telling the truth both have equally as many consequences as they have rewards. (2) Executing justice or providing mercy. Both justice and mercy are evident in the law and in religiosity and create powerful opposing dilemmas. (3) Provide short term versus longer term benefits. Many current business dilemmas revolve around short term vs. long term dilemmas. (4) Provide greater benefit for the Individual versus the community. It is an important and inherently human activity to look after the individual while at the same time not meeting the needs of the community can affect everybody. The fifth category of statements is classified as legal versus illegal action choices. Kidder argues that this is not a ‘right versus right’ dilemma because there is a clear line between what is right and what is wrong, and these situations are only caused by a lapse in moral judgement or a moment of moral temptation. However, it should be noted that an illegal activity is not always immoral, and a legal activity is not always moral [58]. Within each of the five categories, the selected action choices are either aligned with a more deontological/idealistic or more teleological/relativistic ethical orientations (see Figure 2).
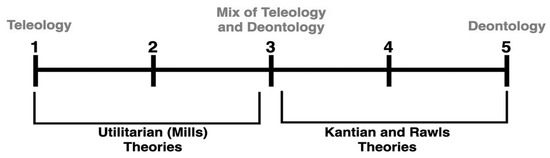
Figure 2.
The Ethical Orientation Scale (EOS) & the ethical theories accompanying the 1–5 ranking.
In addition to providing context for the students, this design tests whether telling a back story surrounding the statement would result in a change in the student responses. This change would suggest that ethical decision intentions are dependent on the situational context. For example, students were first provided with minimal context:
“Your buyer wishes to order several cases of product, but for reasons that you understand, missed the end date of the deal. That is, they wish to place the order on December 26 and still get the $2.00 discount. You place the order and although it is technically December 26, you specify the date on the order form (an internal company document) as December 24th.”
They are then asked to agree or disagree to this statement:
“Adjustments to accounting records that are used internally (i.e., change the date of the order to fall within the deal dates specified) are acceptable”.
Then they are provided with a more detailed background story:
“You make the changes to the dates even though the company policy states that you should not adjust accounting records that are used internally or externally, however, over the years you have become excellent friends with your buyer. You know that the buyer accidently missed the deadline to place his order because of a family trauma and that he will probably get in trouble from his boss for not meeting the deal date deadline (as this means money lost to the grocery store). You know that this would cause additional stress on your friend who is already experiencing personal stress at home”.
Students are then asked to agree or disagree with the following statement:
“Loyalty to a friend should outweigh company rules.”
This layering of the questions within the questionnaire is designed to test the following hypothesis:
Hypothesis 1 (H1).
Participant responses to ethical dilemmas will be different when a statement of situational context is provided.
A summary of the scores for all 12 questions from these categories were used to form an ethical orientation score by student, a number ranging from 1–5, where 1 reflects a pro-teleology/realistic orientation when making decisions and 5 reflects a pro-deontological/idealistic perspective when making decisions (see Figure 3). The EOS dependent variable is continuous and represents the moral intention not moral action of the participant.
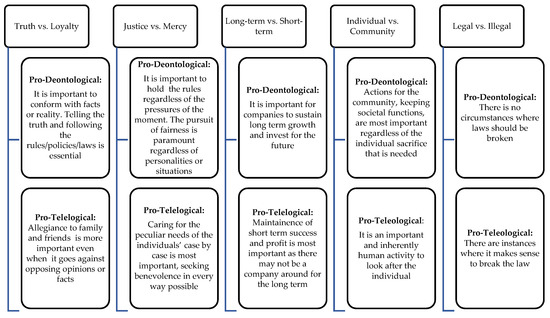
Figure 3.
Categories of statements used to form the EOS score to determine ethical orientation (Moral Dilemmas adapted from Kidder K.M. [57]).
A Confirmatory factor analysis (CFA) was conducted to verify the factor structure of the 12-observed responses that informed the EOS scale to increase the confidence of its further application within the regression analyses that follow. The CFA tested the hypothesis that a relationship exists between these observed responses and their underlying latent constructs; specifically, the change in ethical orientations employed by same subjects to responses given additional situational context. R statistical programming language, and the lavaan package were used to perform the CFA. A maximum likelihood estimation was chosen given normally distributed data. A covariance matrix explored the psychometric properties of the 12-item Ethical Orientation questionnaire. The covariance covarinace table with means and standard deviations is shown in Appendix B.
Responses that hung together were connected to the situational context. That is, after a hypothetical story was told the set of responses that followed the story moved in the same direction (correlation > 0.3), and when additional information was provided the next set of responses also moved together (correlation > 0.3).
The covariance matrix informed an uncorrelated 6 factor model, where the covariance among the items within each factor was due to one common single factor; responses to same additional information surrounding a workplace scenario. The CFA was conducted using the latent variables (on the left) comprised of the indicators (observed variables on the right) found in Table 1.

Table 1.
Uncorrelated 6 factor model.
The results for the CFA can be found in Table 2. The comparative fit index (CFI) = 0.98, the Tucker-Lewis fit index (TLI) = 0.97, and the RMSEA = 0.03. These values indicate an excellent fit between the model constructs and the observed data.
Table 2.
Standardized Coefficients for CFA.
Given the CFA excellent fit model results, we further explore the relationship between the NEP scale and the new EOS (established by this study), which measures a subject’s attitude toward ethical dilemmas in the workplace, could strengthen our understanding of the potential ethical orientations if any, that underpin the NEP scale statements.
Hypothesis 2 (H2).
The EOS index scores will be correlated to the NEP scale scores.
Culture. Crane et al., suggested that “… nationality can have a significant effect on ethical beliefs, and on the views of what is deemed as an acceptable approach to certain business issues” [59] (p. 146) including the environmental issues. Given the growing diversity of the population in North America, cultural markers could provide insights into environmental values and ethical orientations. Students are asked to state their country of birth as well as the length of time they have resided in Canada if born outside of the country. Sidiropoulos [5] found that country of origin affected NEP scores. While subjects from Australia, New Zealand, the UK, USA, and Canada were found to be the most pro-ecological (highest average NEP scores), participants from Asian regions were found to have the lowest average NEP scores.
Hypothesis 3A (H3A).
NEP scores will be different depending on individual country of birth, and the duration of living in that country.
A study by Ge and Thomas [60] found that people from less developed countries tend to be less ethical than people from highly developed countries. They also found that people in collectivistic countries tend to be more unethical than people from individualistic countries, specifically if the decision impacts community well-being.
Hypothesis 3B (H3B).
EOS scores will be different depending on individual country of birth and the duration of living in that country.
Religious Affiliation. Religious identification by students was used also as a cultural identity marker to further test the influence of culture on their decisions making. Casey & Scott [61] found that Catholic and Anglican/Uniting participants had significantly lower NEP scores than the participants who identified as not belonging to any religious denomination.
Hypothesis 4A (H4A).
NEP scores will be different based on religious affiliation.
Religious traditions often are the basis of our moral formation [62]. Conroy and Emerson [63] found that religiosity has a significant effect on ethical judgement. Parboteeah et al. [64] conducted a study with a large sample size (N = 63,087) and found that belief in religion was not correlated to the justification of unethical behaviour. Several studies found that religious people resolve ethical dilemmas consistent with deontological but not utilitarian philosophy, compared to less religious people [46,65,66,67]
Hypothesis 4B (H4B).
EOS scores will be different based on religious affiliation.
Areas of Specialization. Several studies exist that compare business students relative to students in other majors/programs and often find that business students have both a lower NEP score and are more lenient in their ethical orientations [68]. Participants in this study self-identified at the beginning of their program their area of specialization within the business school.
Sidiropoulos [5] found that NEP scores, on average, were highest in arts, followed by sciences, education, architecture and engineering, and that the lower NEP scores were associated with accounting, business management, and the IT discipline. Environmental science students were found to have the highest NEP scores, while Economics majors had the lowest NEP scores [69]. Thapa [70] found that Recreation and Park Management students placed the highest value on environmental issues, followed by Science and Technology students with Hotel, Restaurant and Institutional Management students having the lowest NEP scores of the three groups.
Hypothesis 5A (H5A).
There is a difference in NEP scores for students depending on their self-selected program of study in business.
Hypothesis 5B (H5B).
There is a difference in EOS scores for students depending on their self-selected programs in business.
There are some studies that investigate the inter-disciplinary differences in ethical orientations. For example, Cohen et al. [71] found differences in ethical perceptions for accounting students versus other business majors. Lopez et al. [72] also reported differences in ethical perceptions between different areas of specialization within business.
Gender. Many studies find that females have higher NEP scores and are more pro-ecological on average than males [73,74,75]. Evidence from a meta-analysis found that even before adulthood, females have more pro-environmental attitudes than males [76].
Hypothesis 6A (H6A).
Male and females will have different NEP scores.
Studies on the effect of gender on ethical judgement are mixed. Some studies have found that gender has a significant effect on ethical judgement [63,70,76,77,78,79,80]. Wang and Calvano [81] found significant gender differences between men and women where both groups had not experienced business ethics education. Many studies found women were more inclined to judge situations more ethically [82,83,84,85] than men although a few of these studies [77,86] found men to behave more ethically than women. Borkowski and Ugras [87] found women to have more definite standpoints toward hypothetical ethical decisions and males to be less definite and more utilitarian leaning in their responses. Valentine and Rittenburg [88] found no differences between male and female ethical judgements.
Hypothesis 6B (H6B).
Male and females will have different EOS scores.
Level of Education. Pro-environmental behaviors were found to significantly increase with age and level of education [61,89]. In an additional study, Sidiropoulos [5] found evidence of an “early-adult dip” in which students aged 18–25 had less prevalent pro-ecological views (i.e., lower average NEP) and were more anthropocentric (p. 545).
Hypothesis 7A (H7A).
First- and fourth-year NEP scores will be different.
Level of education has been identified over a broad time horizon as having a significant effect on ethical judgements [70,90]. Lopez et al. [72] found that students in their final year of their undergraduate degree in business are less approving of the unethical behavior regarding issues concerning deceit, fraud, and coercion than were students in their first year. Students from the first-year introductory course as well as students from the fourth-year business capstone course completed this questionnaire. A comparison is made between the surveys based on age and level of education.
Hypothesis 7B (H7B).
First- and fourth-year EOS scores will be different.
4. Results
The descriptive statistics including means and standard deviations of NEP and EOS can be found in Table 3. Not all questions needed to be answered to qualify as a valid survey which accounts for the variance in the descriptive statistics totals. The majority of students were first year students (80%), born in Canada (79%) and identified as Christian (52.1%) with a mean age of 19. First year students and males represented 80% and 58% of the sample, respectively. Most of the participants were of North American origin (81%) and the majority of participants came from Marketing (26.5%), Accounting (22.1%) and MEF (18.9%).
Table 3.
Summary Descriptive Statistics: Mean New Ecological Paradigm (NEP) and Ethical Orientation Scale (EOS).
Hypothesis 1 explored whether there was a difference in responses (ethical perspectives) for students when a background story was further provided (providing more context). The average percentage of students who had a different response when context was provided was 69.3%. The average EOS score from responses to questions with context to justify actions (M = 3.34, SD = 0.70) were compared to the average EOS score where little to no background was presented (M = 3.64, SD = 0.60). There was a statistically significant decrease in EOS scores between the two groups, when contextual information was provided, ß = 0.18, t (3012) = −14.99, p < 0.0005. Thus hypothesis 1 was supported. We can conclude that when a back story was provided, students moved more toward teleological decision choices (represented by a lower EOS score), indicating that situational factors do influence decision choices.
Table 4 compares the significant results of the OLS regression with no interaction terms (Equation (1)) and with interaction terms (Equation (2)), with the continuous NEP Score as the dependent variable, to test hypotheses 3A, 4A, 5A, 6A and 7A. Results of a multiple linear regression showed a collective significant effect of all the independent variables, F (41, 2849) = 11.04, p = 0.0000, R2 = 0.14. Specifically, 13.7% of the variance was explained by the model. EOS score (ß = 0.20), gender (ß = 0.18), Accounting (ß = 0.11) Hotel Food and Tourism Management (HFTM) (β = 0.18), Marketing (β = 0.14) and No Faith (β = 0.22) were positive and significant in the model. Management Economics and Finance (β = 0.10), Organizational leadership (β = 0.11) and Public Management (PM) (β = 0.15) were marginally significant. However, in all cases, except for PM, they had confidence intervals crossing over zero, suggesting these results as not significant. Food & Agriculture Business (ß = −0.16) and Class level (ß = −0.05) were negative and significant.
Table 4.
OLS Regressions Equation (1) (no interaction) and Equation (2) (with interactions).
Table 5 compares the significant results of the OLS regression with no interaction terms (Equation (3)) and with interaction terms (Equation (4)), with the continuous Ethical Orientation Scores as the dependent variable, testing the hypotheses 3B, 4B, 5B, 6B, and 7B. Results of a multiple linear regression showed a collective significant effect of all the independent variables, F (41, 2849) = 10.78, p = 0.0000, R2 = 0.13. Specifically, 13.4% of the variance was explained by the model. NEP score (ß = 0.25), gender (ß = 0.15), class level and Accounting (ß = 0.21) and Food & Agriculture Business (ß = 0.26) area of specialization were positive and significant in the model. HFTM (ß = −0.14), no faith (ß = −0.07) and class level (ß = −0.12) were negative and significant.
Table 5.
OLS Regressions Equation (3) (no interaction) and Equation (4) (with interaction).
Hypothesis 2A and 2B compared participant scores on the NEP with their scores on EOS. The average NEP score for all participants was 3.54 (SD = 0.52). Approximately, fifty-nine percent (58.7%) of first year student responses fell within the somewhat ecological and ecological category versus 67.3% for these same categories for fourth-year students. The average Ethical Orientation Scale score overall was 3.60 (SD = 0.59). Approximately, sixty percent (60.3%) of first year student responses fell within the somewhat deontological and deontological category versus 68% for these same categories for fourth-year students.
The data from Table 4 confirms that a subject’s EOS score is positively correlated with their NEP score, ß = 0.20, t (2890) = 12.39, p = 0.000. Therefore, subjects with a higher EOS score toward a more deontological orientation, would also have a higher NEP score toward a more ecological world view. Conversely, subjects with a lower EOS score toward a more teleological orientation would have a lower NEP score toward a less ecological world view. Similarly, the data from Table 5 confirms that a subject’s NEP score is positively correlated with their EOS score, ß = 0.25, t (2890) = 12.39, p = 0.000. The NEP scale score is correlated to EOS index scores which supported hypothesis 2A and 2B.
Hypothesis 3A and 3B suggested that individual country of birth and the duration of living in that country, respectively, influenced both NEP and EOS scores. The data found that country of birth, and the duration of living in their country of origin, were unrelated to both the NEP and the EOS scores. Table 4 and Table 5 highlight the combined non-significant statistics of countries of birth by continent by subject. Subjects born in Africa (ß = 0.01, t (2890) = 0.08, p = 0.93), Asia (ß = −0.03, t (2890) = −0.93, p = 0.60), Europe (ß = −0.03, t (2890) = −0.83, p = 0.41), Oceania (ß = 0.06, t (2890) = 0.23, p = 0.82) and South America (ß = −0.06, t (2890) = −0.73, p = 0.47) did not have an NEP score significantly different than subjects born in North America. Similarly, subjects born in Africa (ß = −0.12, t (2890) = −0.86, p = 0.39), Asia (ß = −0.04, t (2890) = −0.89, p = 0.37), Europe (ß = −0.02, t (2890) = −0.86, p = 0.81), Oceania (ß = 0.72, t (2890) = 1.14, p = 0.254) and South America (ß = 0.17, t (2890) = 1.1, p = 0.27) did not have an EOS score significantly different than subjects born in North America. Thus, hypothesis 3A and 3B were not supported. The country of origin, and how long they lived in their country of birth did not affect EOS or NEP scores.
Hypothesis 4A and 4B suggested that religious affiliation would affect NEP and EOS scores respectively. Identifying with no religious affiliation was positive and significantly related to NEP scores, ß = 0.22, t (2890) = 12.39, p = 0.00. Those identifying with no religious faith (M = 3.70, SD = 0.54) had a higher NEP score versus those who identified with Christian faith affiliation (M = 3.50, SD = 0.51). Conversely, no faith affiliation was negatively and significantly related to EOS scores, ß = −0.07, t (2890) = −2.25, p = 0.03. Those identifying with no religious faith (M = 3.59, SD = 0.60) had a lower EOS score that is more in the teleological end of the spectrum versus those who identified with a religious affiliation (M = 3.60, SD = 0.59). Thus, hypothesis 4A and 4B were supported. Having no faith affiliation is associated with NEP and EOS scores, specifically with a higher (toward pro-ecological) NEP scores and a lower (teleological) EOS scores.
Hypothesis 5A and 5B compared the NEP and EOS scores for students depending on their self-selected program. Being in Accounting, Hotel Tourism and Food Management (HFTM), Marketing, or Public Management (PM) were positively related to the NEP scores; ß = 0.11, 0.18, 0.14, 0.16; t (2891) = 2.28, 3.29, 2.99, 2.10; p = 0.02, 0.00, 0.00, 0.036; respectively. Being in Food and Agricultural Business (FAB) was negatively related to the NEP scores, ß = −0.16, t (2891) = −2.30, p = 0.02.
Being in Accounting or FAB were positively and significantly related to EOS scores, ß = 0.21, t (2891) = 3.92, p = 0.00 and ß = 0.26, t (2890) = 3.20, p = 0.00, respectively. However, being in HFTM was negatively and significantly related to EOS scores, ß = −0.132, t (2890) = −2.13, p = 0.03. Thus, hypothesis 5A and 5B are supported. NEP and EOS scores vary depending on self-selected specialty. Students choosing Accounting, HFTM, Marketing, and PM are associated with higher (toward pro-ecological) NEP scores, whereas FAB students are associated with lower NEP scores. Accounting and FAB students associated with higher EOS scores (deontological) and those choosing HFTM associated with lower EOS scores (teleological).
Hypothesis 6A and 6B evaluated the effects of gender on NEP and EOS scores. Gender had a significant positive effect on NEP scores, ß = 0.18, t (2890) = 8.9, p = 0.000. Females (M = 3.66, SD = 0.50) scored higher than male participants (M = 3.45, SD = 0.52). Similarly, gender had a significant and positive effect on EOS scores, ß = 0.15, t (2890) = 6.64, p = 0.000. Females (M = 3.61, SD = 0.59) scored higher than male participants (M = 3.59, SD = 0.59). Thus, hypothesis 6A and 6B were supported. Gender was associated with NEP and EOS scores, and specifically women on average scored higher on the NEP (more pro-ecological) and EOS (deontological) than men.
Hypothesis 7A and 7B compared the NEP and EOS scores of first year and fourth year students. Being a first-year student was negatively and significantly related to NEP scores, ß = −0.05, t (2890) = −2.32, p = 0.00. First year students had lower NEP scores (M = 3.52, SD = 0.51) than fourth year students (M = 3.60, SD = 0.53). Being a first-year student was negatively and significantly related to EOS scores, ß = −0.12, t (2890) = −4.72, p = 0.00. First year students had lower EOS scores (M = 3.54, SD = 0.56) than fourth year students (M = 3.69, SD = 0.63) Thus hypothesis 7A and 7B are supported. First year students had lower NEP and EOS scores, on the less pro-ecological and teleological side of the scales and fourth year students had higher NEP and EOS scores, toward the pro-ecological deontological end of the scale.
Interaction plots were created comparing the mean NEP and EOS scores for three sets of categorical variables (male and female, first- and fourth year (class level) students and faith and no-faith identification by subjects) to determine whether the NEP and EOS scores by subjects are potentially dependent on the value of a second categorical factor. The interaction plots for both first- and fourth-year students (class level) and for Faith and no-faith suggested that there may be a two-way interaction term that could better explain the data. (see Table 4, Equations (1), (2) and (5), Equations (3) and (4)).
Two-way interactions were tested using No Faith and Class Level categorical variables with program specialization, and NEP and EOS score variables, respectively. Table 4 (Equation (2)) includes the significant result from class levels interaction with program selection and the EOS scores interaction with no faith given EOS’s positive correlation with the dependent variable. There was a significant negative interaction between accounting and class level, ß = −0.12, t (2890) = −2.25, p = 0.02 with fourth year students in Accounting specialty having higher NEP scores than first year Accounting students. No other programs showed significance between first and fourth year. The EOS and No Faith interaction term was not significant, ß = −0.02, t (2890) = −0.46, p = 0.64. Similarly, Table 5 (Equation (4)), includes the significant result from class levels interaction with program selection and the NEP scores interaction with no faith given NEP’s positive correlation with the dependent variable. There was a significant negative interaction between accounting and class level, ß = −0.14, t (2890) = −2.32, p = 0.02 with fourth year students in Accounting specialty having higher EOS scores than first year Accounting students. No other programs showed significance between first and fourth year. The NEP and No Faith interaction term was not significant, ß = −0.07, t (2890) = −1.45, p = 0.15.
5. Discussion
This study introduces the new EOS measurement tool which tests the ethical orientation intentions and shifts in these intentions of subjects, when faced with workplace ethical dilemmas. It was concluded that scores on EOS vary significantly when participants are given additional contextual background information on the ethical situation that they have previously evaluated, resulting in lower (more teleological) EOS scores. A Confirmatory Factor Analysis (CFA) verified the EOS model construct to be an excellent fit strengthening its validity as a measurement tool. The EOS is introduced as an explanatory variable to test the ideological beliefs underpinning the NEP scales construct. Outcomes on the EOS and those on the NEP were found to be correlated, with higher EOS scores being associated with higher NEP scores. This finding suggests that pro-ecological attitudes are more closely aligned with rights ethics and less pro-ecological attitudes with utilitarian theory. These results corroborate previous literature that support the theoretical underpinning of the NEP scale as rooted in environmental ethics [10].
The demographic factors that had a positive and significant influence on both the NEP and EOS scores were gender, area of specialty, and class level (4th vs. 1st year). The outcome that females across all ages score higher than males on the NEP scale is consistent with several previous studies [5,61,73,74,75,89]. The outcome that females scored higher on their EOS scores than males and that they are therefore more inclined to a deontological orientation is consistent with some of the literature ([63,76,77,78,79,80] However, Roxas and Stoneback [78], found females in China less likely to behave ethically. Some studies also found that gender does not have a significant effect on ethical judgement [81,90,91]. The literature on gender and ethical orientation shows mixed results.
Previous studies have identified that the chosen major at post-secondary has a significant effect on NEP scores. Shetzer, Stackman and Moore [92] found business students to express strong pro-environmental attitudes primarily related to the balance of nature. Reciprocally, Ewert and Baker [89] found that Business administration had lower pro-environmental scores and higher levels of anthropocentric (human-oriented) values. They also found, similar to this study, that students in recreation and tourism to have higher NEP scores. The Accounting, Hotel Food and Tourism Management, Marketing, Management Economics and Finance, Organizational Leadership and Public Management disciplines had significantly higher NEP scores whereas, the Food and Agricultural Business major had a significantly lower score. Previous research suggested that we should not be surprised that a student’s chosen discipline matters as incoming students to University “choose majors that are consistent with their worldviews” [74] (p. 1).
Previous studies have further identified that the chosen major at post-secondary does not have a significant effect on ethical orientation. Shepard and Hartenian [76] found no difference between preferences for ethical orientations in work-related decisions between business and non-business majors. Doyle and O’Flaherty [90] found no significant impact of specialization on moral judgement when comparing arts, science, and business and commerce degree holders. On the other hand, Merrit [68] found that business students’ scores in ethical judgement were lower than other specializations. Our study found a difference in EOS scores for students depending on their self-selected programs in business. In particular, Food and Agricultural students as well as Accounting students have higher EOS scores toward a more deontological orientation and those in Hotel, Food & Tourism had lower (teleological) scores. That students identifying as accounting majors in this current study score higher (deontological) on the EOS index, may seem both logical and intuitive. Math is a major element of an accounting students’ curriculum and inherent in math is ‘rules-based thinking’, additionally the discipline itself is subject to strict guidelines as defined by Generally Accepted Accounting Practices [93]. A student selecting accounting as their major could then possibly, lean towards a more deontological viewpoint. Hotel Food and Tourism Management (HFTM) students have lower EOS scores toward a teleological orientation. This discipline is customer centric and relies less on a standard set of rules and more on customer satisfaction principles. A student in this discipline may see the bending of rules as a means to achieve the greater good for the client.
In our study, fourth-year students were more likely to have a higher NEP score (more pro-ecological) than first-year students. Environmental behaviors increased significantly with age and level of education and this has been supported in other studies [5,13,61].
Outcomes from this study show that fourth-year students’ EOS scores are higher than first-year students toward a deontological/idealistic orientation. Lehnert et al. [47] found three studies in support of this finding. One study found that as years of education increased, ethical judgement decreased [86]. A few studies found that the Level of education does not significantly affect ethical judgement [90,94]. However, further analysis revealed that the additional self-selected program variable, specifically Accounting Major, influenced this result. The higher EOS score after four years of accounting study could be attributed to students gaining a better understanding of the explicit and well documented rules guiding the accounting profession.
Fourth year versus first year outcomes may be related to maturation and aging. Studies have found that age has a significant effect on ethical judgement [63,95]. Loe et al., [27] found eight studies where age differences mattered and six studies where age did not matter. For the studies that identified significant differences the majority (88%) found that older people were more ethical than younger people. O’Fallen and Butterfield [28] found six studies with a positive relationship between age and ethical decision making and five studies with a negative relationship. Other studies found that ethical judgement increases positively as age increases [63,79,95]. Lehnert et al. [47] in their review found that the effect of age on ethical decision making was unclear.
The causal association between EOS and NEP scale is made stronger by the found relationship between the two scales and the subjects who identified as having ‘no faith’ affiliation. Relative to those who identified as ‘Christian’, these subjects had a positive and significant correlation with the NEP scale, and a negative and significant correlation with the EOS. That is, subjects identifying with no religious affiliation had a higher (pro-ecological) NEP score and a lower EOS score leaning toward the teleological end of the spectrum than subjects identifying with a Christian faith. The ‘no faith’ reverse association with the two scales assists in verifying that ethical ideologies underpin the NEP scale. Acknowledgement that the scale is reflective of the environmental ethical orientations of anthropocentrism (low score) and ecocentrism (high end) helps explain the lower NEP scores associated with Christian faith. Both the hypothesis of creation from Genesis [96] as well as the doctrine of Christian incarnation, specifically that God became a man in the form of Jesus Christ, strongly supports a belief in humanity’s special position within nature [55,97]. This belief system implies an anthropocentric view of world, placing humans as the central most important element of existence, and other aspects of nature with less special status. Subjects who had no religious formation are relatively less anthropocentric in their worldview, in support of a higher NEP score. Past studies have shown both Catholic and Anglican/United subjects to have significantly lower NEP scores than individuals who did not identify themselves as belonging to any religious denomination [61].
The significantly higher EOS score toward deontological orientation for those identifying with the Christian faith relative to no faith is also not surprising. There is a wide body of research that associates religion with deontological responses when facing a moral or ethical dilemma [66,67]. Shariff [97] found that non-consequentialist approaches (Deontological) were closely linked with Judeo-Christian philosophy. McPhetres et al., [46] in addition to confirming this result, applied the dual processing model [43] and found increased deontological responses even after reflective processing for religious people relative to non-religious people.
The EOS positive and statistically significant association with the NEP scale and, the no faith association with both scales (specifically the positive significant association with NEP and negative significant association with the EOS scale) provide further evidence of ethical philosophies/theories underpinning the NEP responses. This finding suggests that the environmental ethics ideologies that underpin the scale of anthropocentrism and ecocentrism connect with teleological and deontological responses to ethical dilemmas, respectively.
5.1. Teaching Strategies
Identifying current attitudes toward the environment, the ethical orientations that inform ethical decision making and the interrelationship between these two variables are critical first steps toward selecting high impact teaching strategies that could assist in developing ethical decision-making skills and environmental sensibilities of students.
For example, the findings from this study suggest that students’ pre-established ideologies impact NEP scores, their attitudes and behaviours toward the environment. More than 50% of students identified as Christian. Christian faith, with support from research, may emphasize anthropocentric values, suggesting that students arrive to campus less pro-ecological than their non-religious colleagues. Requiring students to reflect on questions taken for granted, i.e., the privileged position of humans relative to nature, could assist students in achieving a deeper understanding of the intrinsic value of nature [98]. This encouragement to move from anthropocentrism towards ecocentrism “seeks to effect change at the levels of human beliefs, values, ethics, attitudes, behaviours and lifestyles” [99] (p. 176).
The lower EOS score associated with No Faith relative to those who identified with Christian faith, coupled with the expected growth in secularization in Canada [100], suggest a need for new teaching approaches. The result indicates a projected push along the ethical orientation continuum toward a more teleological orientation. Past studies have consistently shown positive and significant effects of idealism/deontology on the ethical decision-making process, whereas the effect of the realism/teleological position were negative [47]. The implication is that teleological philosophical thoughts are more subjective and hence there is an inclination toward less ethical decision making or ethical lapses [30,47]. This projected shift in ethical orientations of the students could be problematic to ethical decision-making in the future for the business community. Providing students with principles and processes for solving ethical dilemmas that encourage the use of various ethical lens and stakeholder points of view is therefore, important. “Do what is best for the greatest number of people” (teleological principle), “Follow your highest sense of principle” (deontological) or “Do what you want others to do to you” (care base thinking) are all appropriate responses but distinctly different principles that may lead to completely different outcomes when applied to resolve ethical dilemmas [57]. Kidder [57] additionally offers nine checkpoints for ethical decision making providing students with a tool that will enhance “intelligence functioning at intuitional velocity” [57] (p. 178).
5.2. Limitations and Future Enhancements to the Research
There are limitations to this study. First, there is a difference between moral intention and moral action. The questions are situational, and students are asked to respond with their intention for action. We are unable measure what they would actually do in this context. Additionally, in some instances (i.e., some religious affiliations) there was not a relevant sample size. Furthermore, within each self-identified religious affiliation there is a broad spectrum of religious involvement and beliefs. Understanding the extent of their religious affiliation i.e., going to church (extrinsic) versus degree of religious spirituality (intrinsic) and how these factors impact ethical decision making would enhance the predictive power of the model. It is also important to note is that those who practice their faith beyond their country of origin may exhibit unique and variable responses and behaviours.
The testing of same student responses in their first year and fourth year of study would provide further insight into changing attitudes and intentional behaviours toward ethical decision making and the environment over time.
5.3. Conclusions
The EOS introduced in this study, unlike other ethical indexes, is constructed using an individual’s response to workplace ethical dilemmas as opposed to asking subjects to choose between a moral right or wrong (e.g., the Moral Foundations Questionnaire, [40]). The EOS identifies subjects as more Idealistic/deontological or more realistic/teleological depending on their responses. The survey used to construct the score adds various situational factors to the ethical dilemma to determine whether individuals apply different rules to same ethical dilemmas depending on the circumstance. A confirmatory factor analysis confirmed the construct of the scale to be a good fit. The EOS scale addresses some of the gaps in previous scales designed for the same purpose. Furthermore, the EOS scale was shown as a key influencer to beliefs towards how humans relate to nature as defined by the NEP scale.
The study confirms that in addition to socio-cultural variables, situational factors influenced decision choices surrounding an ethical dilemma. Specifically, subjects in this study are guided by various ideologies/philosophies, as opposed to one philosophy and this indicates that the decisions change based on situational factors. Additionally, a student’s beliefs toward the environment as measured by the NEP scale are a strong predictor of the EOS and vice versa; the more pro-ecological the world view, the higher EOS score toward a deontological (rules-based) orientation. The NEP scale, a valid construct model that has been used in statistical analysis for four decades, strengthens the validity for the EOS as an emergent measurement tool. The EOS and NEP student scores and their interrelationship provide additional levers to assist business educators identify high impact teaching strategies that could enhance skills for resolving ethical dilemmas and sustainable business practices that protect the environment.
Author Contributions
Conceptualization, K.R. and K.M.; Data curation, K.R. and K.M.; Funding acquisition, K.R.; Investigation, K.R.; Methodology, K.R. and K.M.; Project administration, K.R.; Validation, K.M.; Visualization, K.R.; Writing—original draft, K.R.; Writing—review & editing, K.M. All authors have read and agreed to the published version of the manuscript.
Funding
This research received no external funding.
Institutional Review Board Statement
The members of the University of Guelph, Ontario, Canada Research Ethics Board have examined the protocol which describes the participation of the human participants in the above-named research project and considers the procedures, as described by the applicant, to conform to the University’s ethical standards and the Tri-Council Policy Statement, 2nd Edition. REB number 16-12-673.
Informed Consent Statement
Informed consent was obtained from all subjects involved in the study.
Data Availability Statement
The data presented in this study are available on request from the corresponding author. The data are not publicly available due to personal identifiers used in order to track same participant responses overtime.
Acknowledgments
I would like to acknowledge my Undergraduate Research Assistants (URAs), Christopher Kimmerer, Danielle Roy, Juliana Quan.
Conflicts of Interest
The authors declare no conflict of interest.
Appendix A
Ethical Orientation Scale Survey Questions
The questions apply to the hypothetical case study highlighted below.
You are currently employed as a sales representative for a company called “Fabulous Soups” that sells canned soup products to grocery stores. Your sales territory includes all grocery store chains that are located in the South Western Ontario market. In this sales representative role, you have the following responsibilities: Build valuable relationships with the buyers at the head offices for the grocery stores. These buyers are centrally located in a head office and are responsible for buying the canned food products for all their grocery store branches. The soup purchases are centrally stored in warehouse and are later distributed to individual grocery store branches based on consumer demand. Sell both the features and the benefits of your products to this buyer. Why should the buyer list your products and instruct the individual branches to stock the soup on their shelves? Take the order from the buyer, that is, the buyer tells you how many cases of products (each case contains 24 cans) he/she wishes to buy, you ensure that your company has fulfilled the order request. You are often given deals in terms of a price reduction on each case sold from your head office at Fabulous soups that you must communicate to your central buyer. These deals (price reductions) have specific dates in which they are valid. The objective of the deal is to increase purchasing by the central grocery store buyer. An example of a deal would be as follows: Purchase a case of soup (which contains 24 cans of soup) between December 1 & December 24 and receive $2.00 off the price of the case. These deals are important to buyers because they represent additional profits for the grocery store. This may occur in two ways:1. By having a deal on each case of soup, the individual grocery store branches can discount the price of each can of soup to the final the consumer, this would hopefully result in increased sales for the branch (i.e., the lower price would result in consumers buying more cans of soup), or 2. The price remains the same on the shelf for the consumer, however, the grocery store head office can now keep the $2.00 deal per case and add it to their profits. As a fabulous Soup Sales representative you encourage your buyer to pass these deals on to the final consumer as this means more soup sales for your company in the end. As a sales representative for Fabulous Soups, you have sales quota that is set for you on a quarterly basis (Jan-Mar, April-June, July-Sept, Oct-Dec.). An example of a sales quota could be “January-March, you are required to sell 10,000 cases of product to the buyers that you are responsible for in your territory”. If you achieve this target, then your salary remains flat- for example $80,000 per year. If you underachieve this quota you will be paid less. For example, for each 1000 case below target, you will lose 1% or $800 dollars. However, if you exceed this quota you will be paid more. For example, for each 1000 cases sold over your quota you will earn an additional 2% or an additional $1600. The Fabulous Soup Management team hopes that this will incent the sales team to find create ways to promote and sell more products at the grocery store branch level. Examples of tools used to accomplish this goal are: in-store flyers, direct mail campaigns, and/or end isle displays with discounted prices prominently displayed. Please answer the following questions in your hypothetical role as Sales Representative in SW Ontario for Fabulous Soup Company.
Q1.Your buyer wishes to order several cases of product, but for reasons that you understand, missed the end date of the deal. That is, they wish to place the order on December 26 and still get the $2.00 discount. You place the order and although it is technically December 26, you specify the date on the order form (an internal company document) as December 24th. Adjustments to accounting records that are used internally (i.e., change the date of the order to fall within the deal dates specified) are acceptable.
Q2.You then contact your order department and ask them to adjust the date on the customer’s invoice to also reflect the deal period. Adjustment to accounting records that are used externally (i.e., changing the actual invoice date on the bill sent to the customer) are acceptable.
Q3.You make the changes to the dates even though the company policy states that you should not adjust accounting records that are used internally or externally, however, over the years you have become excellent friends with your buyer. You know that the buyer accidently missed the deadline to place his order because of a family trauma and that he will probably get in trouble from his boss for not meeting the deal date deadline (as this means money lost to the grocery store). You know that this would cause additional stress on your friend who is already experiencing personal stress at home. Loyalty to a friend should outweigh company policies.
Q4.It is unethical to allow personal situations to influence business decisions.
Q5.Your boss, the sales manager, is calling you ever day, asking you if there are any more orders that you could possibly put through the system at the end of the quarter (The year is broken into four quarters). You have already surpassed your quota for the quarter and therefore will stand to earn a large bonus. Your boss however, is asking you to see if your client will purchase more soup and hold it in their central warehouse as the rest of the province is under quota. If your customer is willing to do so, then some of the sales in the next quarter will be compromised, because your buyer will need to sell what is in the warehouse first prior to purchasing more product from you. Your boss guarantees you (which you know is true as this has happened before), that your bonus in the next quarter will not be compromised. In fact, he informs you that he will reduce your quota next quarter. Activities that “improve a company’s short-term performance without hindering long-term performance are not ethical issues (Davis & Welton, 1991, p. 457).
Q6. Changing the “quarterly sales figures to meet a budget is acceptable if no difference is expected in annual sales (Davis & Welton, 1991, p. 457)” or bonuses paid at the end of the year.
Q7.Changing “quarterly sales figures to meet a budget (thus ensuring a larger quarterly bonus) is acceptable if no difference is expected in annual sales (Davis & Welton, 1991, p. 457)”.
Q8.Given, the example above, let us assume that your boss asking you load your customer with extra product in their warehouse in order to achieve quota is against company policy.“If corporate management sets policies and your boss is part of corporate management, you should do what/he she says even if it (Davis & Welton, 1991, p. 457)” violated company policy.
Q9. Each year you host a golf tournament where you entertain your buyers. You are encouraged to host these types of events as a way of building relationships that hopefully one day translate into more sales to the company. You find this part of your job very exhausting as it takes away valuable time from your own family and often cuts into what you deem as ‘personal time’. To compensate for this infringement on your personal time, you often include your wife and kids at the dinner that precedes the event. You also, book your spouse into the spa at the golf club. You feel that this is a good way to balance work and home. Furthermore, the golf-club only presents you with one invoice for all expenses incurred during that day and these extra charges are minimal relative to the entire cost of hosting the golf tournament. There is no written policy that you can see that would say this is not okay. Purchasing personal items with company funds while on business trips because the company is inconveniencing your personal life is okay.
Q10. Using the event that is described above, let us now assume that there is a very strict policy regarding personal expenses on business trips, but because your boss is a close personal friend, he allows you, but no other colleagues, to expense a dinner or a spa for their spouse. It is acceptable for companies to apply policies differently for different employees in the same set of circumstances.
Q11.Your boss who reviews/approves the “expense reports have more responsibility for following company policy than someone merely recording the accounting records (Davis & Welton, 1991, p. 458)”.
Q12.“Company policies/procedures should always be followed unless illegal (Davis & Welton, 1991, p. 458)”.
Appendix B
Table A1.
12-question Ethical Orientation covariance matrix.
Table A1.
12-question Ethical Orientation covariance matrix.
| Q1 | Q2 | Q3 | Q4 | Q5 | Q6 | Q7 | Q8 | Q9 | Q10 | Q11 | Q12 | |
|---|---|---|---|---|---|---|---|---|---|---|---|---|
| Q1 | 1.00 | |||||||||||
| Q2 | 0.63 | 1.00 | ||||||||||
| Q3 | 0.25 | 0.23 | 1.00 | |||||||||
| Q4 | 0.20 | 0.22 | 0.34 | 1.00 | ||||||||
| Q5 | 0.06 | 0.02 | 0.04 | 0.02 | 1.00 | |||||||
| Q6 | 0.17 | 0.16 | 0.04 | 0.05 | 0.27 | 1.00 | ||||||
| Q7 | 0.23 | 0.17 | 0.08 | 0.11 | 0.26 | 0.70 | 1.00 | |||||
| Q8 | 0.21 | 0.20 | 0.10 | 0.17 | 0.14 | 0.24 | 0.30 | 1.00 | ||||
| Q9 | 0.13 | 0.12 | 0.18 | 0.17 | 0.09 | 0.21 | 0.24 | 0.32 | 1.00 | |||
| Q10 | 0.22 | 0.21 | 0.17 | 0.10 | 0.11 | 0.20 | 0.27 | 0.32 | 0.41 | 1.00 | ||
| Q11 | 0.07 | 0.10 | 0.10 | 0.11 | 0.15 | 0.18 | 0.17 | 0.24 | 0.24 | 0.24 | 1.00 | |
| Q12 | 0.14 | 0.11 | 0.20 | 0.22 | 0.06 | 0.06 | 0.08 | 0.10 | 0.16 | 0.11 | 0.00 | 1.00 |
The variables were standardized to have a mean of 0 and a standard deviation of 1, CFA = confirmatory factor analysis. N = 986; M = 0; SD = 1.
Appendix C

Figure A1.
Research Flow diagram.
References
- Ritter, B.A.; Small, E.E.; Mortimer, J.W.; Doll, J.L. Designing Management Curriculum for Workplace Readiness: Developing Students’ Soft Skills. J. Manag. Educ. 2018, 42, 80–103. [Google Scholar] [CrossRef]
- Our Mission and Vision. 2016. Available online: http://www.uoguelph.ca/lang/mission-vision (accessed on 21 March 2021).
- Farashahi, M.; Tajeddin, M. Effectiveness of teaching methods in business education: A comparison study on the learning outcomes of lectures, case studies and simulations. Int. J. Manag. Educ. 2018, 16, 131–142. [Google Scholar] [CrossRef]
- Dunlap, R.E.; Van Liere, K.D.; Mertig, A.G.; Jones, R.E. New Trends in Measuring Environmental Attitudes: Measuring Endorsement of the New Ecological Paradigm: A Revised NEP Scale. J. Soc. Issues 2000, 56, 425–442. [Google Scholar] [CrossRef]
- Sidiropoulos, E. The personal context of student learning for sustainability: Results of a multi-university research study. J. Clean. Prod. 2018, 181, 537–554. [Google Scholar] [CrossRef]
- Dunlap, R.E.; Van Liere, K.D. The “New Environmental Paradigm”. J. Environ. Educ. 1978, 9, 10–19. [Google Scholar] [CrossRef]
- Kilbourne, W.E.; Beckmann, S.C.; Thelen, E. The role of the dominant social paradigm in environmental attitudes: A multinational examination. J. Bus. Res. 2002, 55, 193–204. [Google Scholar] [CrossRef]
- Milbrath, L.W. Stumbling blocks to a sustainable society. Futures 1994, 26, 117–124. [Google Scholar] [CrossRef]
- De Groot, J.I.M.; Steg, L. Value Orientations to Explain Beliefs Related to Environmental Significant Behavior. Environ. Behav. 2007, 40, 330–354. [Google Scholar] [CrossRef]
- Lundmark, C. The new ecological paradigm revisited: Anchoring the NEP scale in environmental ethics. Environ. Educ. Res. 2007, 13, 329–347. [Google Scholar] [CrossRef]
- Cruz, S.M.; Manata, B. Measurement of Environmental Concern: A Review and Analysis. Front. Psychol. 2020, 11, 363. [Google Scholar] [CrossRef]
- Franzen, A.; Vogl, D. Two decades of measuring environmental attitudes: A comparative analysis of 33 countries. Glob. Environ. Chang. 2013, 23, 1001–1008. [Google Scholar] [CrossRef]
- Dunlap, R.E.; Jones, R.E. Environmental Concern: Conceptual and Measurement Issues. In Handbook of Environmental Sociology; Dunlap, R.E., Michelson, W., Eds.; Greenwood Press: Westport, CT, USA, 2002; pp. 482–524. [Google Scholar]
- Chwialkowska, A.; Bhatti, W.A.; Glowik, M. The influence of cultural values on pro-environmental behavior. J. Clean. Prod. 2020, 268, 122305. [Google Scholar] [CrossRef]
- Derdowski, L.; Grahn, Å.; Hansen, H.; Skeiseid, H. The New Ecological Paradigm, Pro-Environmental Behaviour, and the Moderating Effects of Locus of Control and Self-Construal. Sustainability 2020, 12, 7728. [Google Scholar] [CrossRef]
- Mackay, C.M.; Schmitt, M.T. Do people who feel connected to nature do more to protect it? A meta-analysis. J. Environ. Psychol. 2019, 65. [Google Scholar] [CrossRef]
- Kim, M.S.; Hunter, J.E. Attitude–Behavior Relations: A Meta-Analysis of Attitudinal Relevance and Topic. J. Commun. 1993, 43, 101–142. [Google Scholar] [CrossRef]
- Kim, M.S.; Hunter, J.E. Relationships Among Attitudes, Behavioral Intentions, and Behavior. Commun. Res. 1993, 20, 331–364. [Google Scholar] [CrossRef]
- Morrison, D.M.; Baker, S.A.; Gillmore, M.R. Condom use among high-risk heterosexual teens: A longitudinal analysis using the theory of reasoned action. Psychol. Health 1998, 13, 207–222. [Google Scholar] [CrossRef]
- Vincent, P.C.; Peplau, L.A.; Hill, C.T. A Longitudinal Application of the Theory of Reasoned Action to Women’s Career Behavior1. J. Appl. Soc. Psychol. 1998, 28, 761–778. [Google Scholar] [CrossRef]
- Kuhn, T.S.; Section, V. The Structure of Scientific Revolutions, 2nd ed.; University of Chicago Press: Chicago, IL, USA, 1970; pp. 43–51. [Google Scholar]
- Milbrath, L.W. A proposed value structure for a sustainable society. Environmentalist 1984, 4, 113–124. [Google Scholar] [CrossRef]
- Pirages, D.C.; Ehrlich, P.R. Ark II. In Social Response to Environmental Imperatives; Pirages, D.C., Ehrlich, P.R., Eds.; Viking Press: New York, NY, USA, 1974. [Google Scholar]
- Anderson, A. Climate Change Education for Mitigation and Adaptation. J. Educ. Sustain. Dev. 2012, 6, 191–206. [Google Scholar] [CrossRef]
- Rest, J.R. Moral Development: Advances in Research and Theory; Praeger: Westport, CT, USA, 1986; ISBN-13: 978-0275922542. [Google Scholar]
- Tenbrunsel, A.E.; Smith-Crowe, K. 13 Ethical Decision Making: Where We’ve Been and Where We’re Going. Acad. Manag. Ann. 2008, 2, 545–607. [Google Scholar] [CrossRef]
- Loe, T.W.; Ferrell, L.; Mansfield, P. A Review of Empirical Studies Assessing Ethical Decision Making in Business. J. Bus. Ethics 2000, 25, 185–204. [Google Scholar] [CrossRef]
- O’Fallon, M.J.; Butterfield, K.D. A Review of the Empirical Ethical Decision-Making Literature: 1996–2003. J. Bus. Ethics 2013, 59, 213–263. [Google Scholar] [CrossRef]
- Mill, J.S.; Bentham, J. Utilitarianism and Other Essays; Penguin Classics: London, UK, 1987. [Google Scholar]
- Craft, J.L. A Review of the Empirical Ethical Decision-Making Literature: 2004–2011. J. Bus. Ethics 2013, 117, 221–259. [Google Scholar] [CrossRef]
- Hecht, D. The Neural Basis of Optimism and Pessimism. Exp. Neurobiol. 2013, 22, 173–199. [Google Scholar] [CrossRef]
- Shainess, N. Ruminations on Chivalry. Contemp. Psychoanal. 1993, 29, 144–152. [Google Scholar] [CrossRef]
- Jereb, E.; Perc, M.; Lämmlein, B.; Jerebic, J.; Urh, M.; Podbregar, I.; Šprajc, P. Factors influencing plagiarism in higher education: A comparison of German and Slovene students. PLoS ONE 2018, 13, e0202252. [Google Scholar] [CrossRef] [PubMed]
- Rawwas, M.Y.A.; Swaidan, Z.; Al-Khatib, J. Does Religion Matter? A Comparison Study of the Ethical Beliefs of Marketing Students of Religious and Secular Universities in Japan. J. Bus. Ethics 2006, 65, 69–86. [Google Scholar] [CrossRef]
- Forsyth, D.R. A taxonomy of ethical ideologies. J. Pers. Soc. Psychol. 1980, 39, 175–184. [Google Scholar] [CrossRef]
- Trevino, L.K. Ethical Decision Making in Organizations: A Person-Situation Interactionist Model. Acad. Manag. Rev. 1986, 11, 601–617. [Google Scholar] [CrossRef]
- Reidenbach, R.E.; Robin, D.P. Toward the development of a multidimensional scale for improving evaluations of Business Ethics. J. Bus. Ethics 1990, 9, 639–653. [Google Scholar] [CrossRef]
- Hansen, R.S. A multidimensional scale for measuring business ethics: A purification and refinement. J. Bus. Ethics 1992, 11, 523–534. [Google Scholar] [CrossRef]
- Schwartz, S.H. Universalism Values and the Inclusiveness of Our Moral Universe. J. Cross-Cultural Psychol. 2007, 38, 711–728. [Google Scholar] [CrossRef]
- Graham, J.; Haidt, J. Beyond Beliefs: Religions Bind Individuals into Moral Communities. Pers. Soc. Psychol. Rev. 2009, 14, 140–150. [Google Scholar] [CrossRef]
- Kahane, G.; Everett, J.A.C.; Earp, B.D.; Caviola, L.; Faber, N.S.; Crockett, M.J.; Savulescu, J. Beyond sacrificial harm: A two-dimensional model of utilitarian psychology. Psychol. Rev. 2018, 125, 131–164. [Google Scholar] [CrossRef]
- Foot, P. The Problem of Abortion and the Doctrine of the Double Effect; Oxford University Press: Oxford, UK, 2002; pp. 19–32. [Google Scholar]
- Conway, P.; Weiss, A.; Burgmer, P.; Mussweiler, T. Distrusting Your Moral Compass: The Impact of Distrust Mindsets on Moral Dilemma Processing and Judgments. Soc. Cogn. 2018, 36, 345–380. [Google Scholar] [CrossRef]
- Bargh, J.A.; Chartrand, T.L. The unbearable automaticity of being. Am. Psychol. 1999, 54, 462–479. [Google Scholar] [CrossRef]
- Chaiken, S.; Trope, Y. Dual-Process Theories in Social Psychology; Guilford Press: New York, NY, USA, 1999. [Google Scholar]
- McPhetres, J.; Zuckerman, M. Religiosity predicts negative attitudes towards science and lower levels of science literacy. PLoS ONE 2018, 13, e0207125. [Google Scholar] [CrossRef]
- Lehnert, K.; Park, Y.H.; Singh, N. Research Note and Review of the Empirical Ethical Decision-Making Literature: Boundary Conditions and Extensions. J. Bus. Ethics 2014, 129, 195–219. [Google Scholar] [CrossRef]
- Stern, P.C. New Environmental Theories: Toward a Coherent Theory of Environmentally Significant Behavior. J. Soc. Issues 2000, 56, 407–424. [Google Scholar] [CrossRef]
- Hawcroft, L.J.; Milfont, T.L. The use (and abuse) of the new environmental paradigm scale over the last 30 years: A meta-analysis. J. Environ. Psychol. 2010, 30, 143–158. [Google Scholar] [CrossRef]
- Dunlap, R.E. The New Environmental Paradigm Scale: From Marginality to Worldwide Use. J. Environ. Educ. 2008, 40, 3–18. [Google Scholar] [CrossRef]
- La Trobe, H.L.; Acott, T.G. A Modified NEP/DSP Environmental Attitudes Scale. J. Environ. Educ. 2000, 32, 12–20. [Google Scholar] [CrossRef]
- Pletzer, J.L.; Balliet, D.; Joireman, J.; Kuhlman, D.M.; Voelpel, S.C.; Van Lange, P.A.; Back, M. Social Value Orientation, Expectations, and Cooperation in Social Dilemmas: A Meta-Analysis. Eur. J. Pers. 2018, 32, 62–83. [Google Scholar] [CrossRef]
- Stern, P.C.; Dietz, T. The Value Basis of Environmental Concern. J. Soc. Issues 1994, 50, 65–84. [Google Scholar] [CrossRef]
- Stern, P.C.; Dietz, T.; Guagnano, G.A. A Brief Inventory of Values. Educ. Psychol. Meas. 1998, 58, 984–1001. [Google Scholar] [CrossRef]
- Kopnina, H.; Washington, H.; Taylor, B.; Piccolo, J.J. Anthropocentrism: More than Just a Misunderstood Problem. J. Agric. Environ. Ethics 2018, 31, 109–127. [Google Scholar] [CrossRef]
- Davis, J.R.; Welton, R.E. Professional ethics: Business students’ perceptions. J. Bus. Ethics 1991, 10, 451–463. [Google Scholar] [CrossRef]
- Kidder, R.M. How Good People Make Tough Choices: Resolving the Dilemmas of Ethical Living; Harper Collins: New York, NY, USA, 2009. [Google Scholar]
- O’Sullivan, S.; Pecorino, P.A. Ethics an Online Textbook. Open Resource Text. 2002. Available online: https://www.qcc.cuny.edu/socialsciences/ppecorino/ethics_text/default.htm (accessed on 21 March 2021).
- Crane, A.; Matten, D.; Glozer, S.; Spence, L. Business Ethics: Managing Corporate Citizenship and Sustainability in the Age of Globalization; Oxford University Press: Oxford, UK, 2019. [Google Scholar]
- Ge, L.; Thomas, S. A Cross-Cultural Comparison of the Deliberative Reasoning of Canadian and Chinese Accounting Students. J. Bus. Ethics 2007, 82, 189–211. [Google Scholar] [CrossRef]
- Casey, P.J.; Scott, K. Environmental concern and behaviour in an Australian sample within an ecocentric-anthropocentric framework. Aust. J. Psychol. 2006, 58, 57–67. [Google Scholar] [CrossRef]
- McKay, R.; Whitehouse, H. Religion and morality. Psychol. Bull. 2015, 141, 447–473. [Google Scholar] [CrossRef] [PubMed]
- Conroy, S.J.; Emerson, T.L.N. Business Ethics and Religion: Religiosity as a Predictor of Ethical Awareness Among Students. J. Bus. Ethics 2004, 50, 383–396. [Google Scholar] [CrossRef]
- Parboteeah, K.P.; Hoegl, M.; Cullen, J.B. Ethics and Religion: An Empirical Test of a Multidimensional Model. J. Bus. Ethics 2007, 80, 387–398. [Google Scholar] [CrossRef]
- McPhetres, J.; Conway, P.; Hughes, J.S.; Zuckerman, M. Reflecting on God’s will: Reflective processing contributes to religious peoples’ deontological dilemma responses. J. Exp. Soc. Psychol. 2018, 79, 301–314. [Google Scholar] [CrossRef]
- Piazza, J.; Sousa, P. Religiosity, Political Orientation, and Consequentialist Moral Thinking. Soc. Psychol. Pers. Sci. 2014, 5, 334–342. [Google Scholar] [CrossRef]
- Piazza, J.; Landy, J. Lean not on your own understanding: Belief that morality is founded on divine authority and non-utilitarian moral thinking. Judgm. Decis. Mak. 2013, 8, 639–661. [Google Scholar]
- Merritt, S. Marketing ethics and education: Some empirical findings. J. Bus. Ethics 1991, 10, 625–632. [Google Scholar] [CrossRef]
- Sherburn, M.; Devlin, A.S. Academic Major, Environmental Concern, and Arboretum Use. J. Environ. Educ. 2004, 35, 23–36. [Google Scholar] [CrossRef]
- Thapa, B. Environmental Concern: A comparative analysis between students in Recreation and Park Management and other departments. Environ. Educ. Res. 2001, 7, 39–53. [Google Scholar] [CrossRef]
- Cohen, J.R.; Pant, L.W.; Sharp, D.J. A methodological note on cross-cultural accounting ethics research. Int. J. Account. 1996, 31, 55–66. [Google Scholar] [CrossRef]
- Lopez, Y.P.; Rechner, P.L.; Olson-Buchanan, J.B. Shaping Ethical Perceptions: An Empirical Assessment of the Influence of Business Education, Culture, and Demographic Factors. J. Bus. Ethics 2005, 60, 341–358. [Google Scholar] [CrossRef]
- Harraway, J.; Broughton-Ansin, F.; Deaker, L.; Jowett, T.; Shephard, K. Exploring the Use of the Revised New Ecological Paradigm Scale (NEP) to Monitor the Development of Students’ Ecological Worldviews. J. Environ. Educ. 2012, 43, 177–191. [Google Scholar] [CrossRef]
- Lang, K.B. The Relationship Between Academic Major and Environmentalism Among College Students: Is it Mediated by the Effects of Gender, Political Ideology and Financial Security? J. Environ. Educ. 2011, 42, 203–215. [Google Scholar] [CrossRef]
- Zelezny, L.C.; Chua, P.-P.; Aldrich, C. Elaborating on Gender Differences in Environmentalism. J. Soc. Issues 2000, 56, 443–457. [Google Scholar] [CrossRef]
- Shepard, J.M.; Hartenian, L.S. Egoistic and ethical orientations of university students toward work-related decisions. J. Bus. Ethics 1991, 10, 303–310. [Google Scholar] [CrossRef]
- Peterson, D.; Rhoads, A.; Vaught, B.C. Ethical Beliefs of Business Professionals: A Study of Gender, Age and External Factors. J. Bus. Ethics 2001, 31, 225–232. [Google Scholar] [CrossRef]
- Roxas, M.L.; Stoneback, J.Y. The Importance of gender Across Cultures in Ethical Decision-making. J. Bus. Ethics 2004, 50, 149–165. [Google Scholar] [CrossRef]
- Eweje, G.; Brunton, M. Ethical perceptions of business students in a New Zealand university: Do gender, age and work experience matter? Bus. Ethics Eur. Rev. 2010, 19, 95–111. [Google Scholar] [CrossRef]
- Selvalakshmi, M.; Mutharasi, P. Ethical Perceptions of Business Management Students and the Role of Gender and Educational Background. Int. J. Bus. Ethics Dev. Econ. 2017, 6, 10–21. [Google Scholar] [CrossRef]
- Wang, L.C.; Calvano, L. Is Business Ethics Education Effective? An Analysis of Gender, Personal Ethical Perspectives, and Moral Judgment. J. Bus. Ethics 2013, 126, 591–602. [Google Scholar] [CrossRef]
- Kray, L.J.; Haselhuhn, M.P. Male pragmatism in negotiators’ ethical reasoning. J. Exp. Soc. Psychol. 2012, 48, 1124–1131. [Google Scholar] [CrossRef]
- Albaum, G.; Peterson, R.A. Ethical Attitudes of Future Business Leaders. Bus. Soc. 2006, 45, 300–321. [Google Scholar] [CrossRef]
- Skoe, E.E.A.; Cumberland, A.; Eisenberg, N.; Hansen, K.; Perry, J. The Influences of Sex and Gender-Role Identity on Moral Cognition and Prosocial Personality Traits. Sex Roles 2002, 46, 295–309. [Google Scholar] [CrossRef]
- Arlow, P. Personal characteristics in college students’ evaluations of business ethics and corporate social responsibility. J. Bus. Ethics 1991, 10, 63–69. [Google Scholar] [CrossRef]
- Thorne, L. Refocusing ethics education in accounting: An examination of accounting students’ tendency to use their cognitive moral capability. J. Account. Educ. 2001, 19, 103–117. [Google Scholar] [CrossRef]
- Borkowski, S.C.; Ugras, Y.J. Business Students and Ethics: A Meta-Analysis. J. Bus. Ethics 1998, 17, 1117–1127. [Google Scholar] [CrossRef]
- Valentine, S.R.; Rittenburg, T.L. The Ethical Decision Making of Men and Women Executives in International Business Situations. J. Bus. Ethics 2006, 71, 125–134. [Google Scholar] [CrossRef]
- Ewert, A.; Baker, D. Standing for Where You Sit: An exploratory analysis of the relationship between academic major and environment beliefs. Environ. Behav. 2001, 33, 687–707. [Google Scholar] [CrossRef]
- Doyle, E.; O’Flaherty, J. The impact of education level and type on moral reasoning. Ir. Educ. Stud. 2013, 32, 377–393. [Google Scholar] [CrossRef]
- Ballantine, J.; McCourt, P. The Impact of Ethical Orientation and Gender on Final Year Undergraduate Auditing Students’ Ethical Judgments. Account. Educ. 2011, 20, 187–201. [Google Scholar] [CrossRef]
- Shetzer, L.; Stackman, R.W.; Moore, L.F. Business-Environment Attitudes and the New Environmental Paradigm. J. Environ. Educ. 1991, 22, 14–21. [Google Scholar] [CrossRef]
- Ruppel, W. Wiley GAAP for Governments 2017—Interpretation and Application of Generally Accepted Accounting Principles for State and Local Governments; John Wiley & Sons: Hoboken, NJ, USA, 2017. [Google Scholar]
- De Matos, C.A.; Ituassu, C.T.; Rossi, C.A.V. Consumer attitudes toward counterfeits: A review and extension. J. Consum. Mark. 2007, 24, 36–47. [Google Scholar] [CrossRef]
- Haski-Leventhal, D.; Pournader, M.; McKinnon, A. The Role of Gender and Age in Business Students’ Values, CSR Attitudes, and Responsible Management Education: Learnings from the PRME International Survey. J. Bus. Ethics 2017, 146, 219–239. [Google Scholar] [CrossRef]
- Kim, J. Christian Anthropology in an Age of Science: Between Anthropocentrism and Non-Anthropocentrism. Expo. Times 2018, 129, 547–553. [Google Scholar] [CrossRef]
- Shariff, A.F. Does religion increase moral behavior? Curr. Opin. Psychol. 2015, 6, 108–113. [Google Scholar] [CrossRef]
- Allen, S.; Cunliffe, A.L.; Easterby-Smith, M. Understanding Sustainability Through the Lens of Ecocentric Radical-Reflexivity: Implications for Management Education. J. Bus. Ethics 2019, 154, 781–795. [Google Scholar] [CrossRef]
- Borland, H.; Lindgreen, A. Sustainability, Epistemology, Ecocentric Business, and Marketing Strategy: Ideology, Reality, and Vision. J. Bus. Ethics 2013, 117, 173–187. [Google Scholar] [CrossRef]
- Statistics Canada. Available online: Statcan.gc.ca (accessed on 12 July 2018).
Publisher’s Note: MDPI stays neutral with regard to jurisdictional claims in published maps and institutional affiliations. |
© 2021 by the authors. Licensee MDPI, Basel, Switzerland. This article is an open access article distributed under the terms and conditions of the Creative Commons Attribution (CC BY) license (https://creativecommons.org/licenses/by/4.0/).