Abstract
Flat-plate solar collectors are one of the cleanest and most efficient heating systems available. Studies on the presence of covalently functionalized graphene (Gr) suspended in distilled water as operating fluids inside an indoor flat-plate solar collector (FPSC) were experimentally and theoretically performed. These examinations were conducted under different testing conditions namely 0.025 wt.%, 0.05 wt.%, 0.075 wt.%, and 0.1 wt.%, 0.5, 1, and 1.5 kg/min, 30, 40, and 50 °C, and 500, 750, and 1000 W/m2. Various techniques were used to characterize the functionalized nanofluids’ stability and morphological properties namely UV/Vis spectrophotometry, EDX analysis with a Scanning Electron Microscope (SEM), zeta potential, and nanoparticle size. The results showed that the collected heat improved as the percentage of GrNPs and the fluid mass flow rates increased, although it decreased as the reduced temperature coefficient increased, whereas the maximum increase in collector efficiency at higher concentration was 13% and 12.5% compared with distilled water at 0.025 kg/s. Finally, a new correlation was developed for the base fluid and nanofluids’ thermal efficiency as a function of dropped temperature parameter and weight concentration with 2.758% and 4.232% maximum deviations.
1. Introduction
Flat-plate solar collectors (FPSCs) are the most basic and studied systems for solar-powered hot water technologies in domestic water. The usage of FPSC is widespread for low-and medium-heat applications. Hence, many advancements and continuous improvements have been undertaken to reduce the size of FPSCs and increase their performance. A black surface absorber, riser, and header pipes with coolant, a glazing cover, coolant, and thermal insulation are the essential components of flat plate collectors. The investigations of Hottel and Woertz in 1942 [1] and Hottel and Whiller in 1958 [2], were among the first studies on FPSC. In 1955, Tabor [3] used selected black surfaces to enhance the heat collected performance. His optical absorption studies showed an optical concentration capability to generate high-pressure steam. As a consequence, numerous experiments were conducted to analyze and enhance collector-thermal efficiency [4]. However, these collectors suffer from low performance and low output fluid temperature [5].
Several investigators have recently made significant attempts to improve the effectiveness and performance of the FPSCs with different methods. One of the techniques used here is nanofluid usage in solar collectors instead of traditional fluids [6]. Nanofluids are coolants made of (1–100 nm) nanoparticles suspended in different hosted liquids (DW and EG). Such types of heat transfer fluids were shown to display higher thermal properties concerning the base fluids [7]. Several research groups have been working on nanostructured carbon materials (SWCNTs, MWCNTs, GNPs, Gr, GO) due to their excellent properties such as superior mechanical properties, remarkable electronic properties, and high thermal conductivity [8]. Graphene is considered as a one-atom-thick planar sheet of sp2-conjugated honeycomb carbon network [9]. Thus, graphene is regarded as an excellent material due to the balance between its properties and production costs. However, carbon nanostructure faces a significant challenge to disperse in a solution where it tends to aggregate due to robust Van der Waals forces [10]. Various strategies have reported successful chemical functionalization (covalent and non-covalent methods) of the carbon structure and can overcome this limitation.
A transient simulation model was used to solve a hybrid, transparent-opaque façade with Regulated Solar-Thermal Collector and Storage [11]. In comparison to a façade without thermal storage, an assessment of four European cities showed that annual heating demand can be decreased by more than 4.2% and cooling demand by at least 6.6%. The effects of selected geometrical features on the thermal efficiency of liquid solar collectors were investigated numerically and experimentally [12]. By simultaneously increasing the number of working pipes and decreasing the pipe diameter, a higher thermal efficiency in the full range of (Tm*) can be achieved. Using the developed computer software, the effects of fin design and transparent cover design on Vanadium-Titanium Black Ceramic (VTBC) solar collectors were investigated individually [13]. The most efficient optimization approach was found to be increasing the transparent cover’s transmittance. This study created an optimized VTBC solar collector theoretical model (η = 0.92 − 2.20 Tm*) by increasing the transmittance from 0.93 to 0.96. In July and August, the solar collector’s average monthly energy efficiencies were 45.3% and 32.9%, respectively, while the average monthly exergy efficiencies were 2.62% and 2.15%. Increasing the wind speed to 0.86 m/s decreased the energy and the exergy efficiencies by 67% and 41%, respectively [14]. Recent years have seen a rise in the number of carbon-based nanofluids in FPSCs. Heat transfer enhancements, pressure loss, and entropy generation were theoretically and experimentally examined using SWCNTs-DW [15,16]. The use of 0.3 wt.% SWCNT nanofluid with 0.5 kg/min increased the base fluid’s energetic and exergetic efficiencies from 42% and 8.77% to 95% and 26.25%, respectively. Experiments by Yousefi et al. [17] using 0.2 wt.%-MWCNTs-H2O nanofluid and 2 kg/min recorded an increase of 28.6%. Furthermore, Yousefi and his co-authors [6] stated a 30% improvement in the overall thermal efficiency-FPSC by raising the MWCNTs-weight percentage from 0.2 to 0.4 wt.% at 3 kg/min. Meanwhile, 11.5% and 7.3% improvements in the heat transfer coefficient and efficiency were described by Vincely and Natarajan [18] using 0.02 wt.%-GO/DI-water nanofluid at 1.002 kg/min. In 2016, Vakili et al. [19] conducted experimentation using 0.005%-, 0.001%-, and 0.0005%-GNPs-H2O as operating fluids inside FPSC at 0.9 kg/min. The FPSC-thermal efficiency reported an increase of 23.2%, 19.7%, and 13.5%, respectively. Ahmadi and his team [20] observed an 18.9% increase in the collector efficiency at 0.02 wt.%-Gr-H2O and 0.9 kg/min through experimental and theoretical research. In 2017, Verma et al. [21] performed an FPSC-performance comparison using MWCNTs, Gr, CuO, Al2O3, TiO2, and SiO2. Through MWCNTs and Gr nanofluids, the maximum increase in thermal efficiency was 23.47% and 16.97%, respectively. At the same time, graphene nanofluid showed that the pumping power was minimally lost. Akram et al. [22], with 0.1 wt.%-CGNPs-H2O and 0.0260 kg/s.m2, showed the maximum energy output measured was 78%, giving an improvement of 18.2% compared to DW. Recently, under different experimental conditions, study [23] was conducted to address pentaethylene glycol (PEG) behavior decorated GNPs-H2O nanofluids inside an indoor flat plate solar collector. Improvements in collector performance were recorded at around 10.7%, 11.1%, and 13.3%, respectively, at 0.00833, 0.01667, and 0.025 kg/s. The most thermal-efficient solar collector improved up to 85% with (CF-MWCNTs + CF-GNPs + h-BN) hybrid nanofluid as the absorption medium at 4 L/min flow rate [24]. A comparison of 0.1 wt.% water-based nanofluids can be sequenced f-GNPs > ZnO > SiO2 because of a percentage improvement of thermal efficiency of the flat-plate solar collector obtained at a mass flow rate of 1.6 kg/min with values of 17.45 > 13.05 > 12.36%, respectively in comparison to water [25]. The maximum enhancement in LFPSC efficiency was 24.09% for 0.1 wt.% GGNPs and flow rate of 1.5 L/min more than distilled water. Meanwhile, exergy efficiency was maximum for 0.1% GGNP concentration and flow rate of 0.8 L/min [26].
It can be seen from the above literature review that the enhancement of FPSC research using graphene nanofluids is still in progress, and needs to be thoroughly investigated. Monolayer graphene is a carbon-based material with thermal conductivity in the range of 2000–4000 W/m K. In comparison to other nanoparticles, this value is very high. As a result, the current research focuses on evaluating collector performance both experimentally and theoretically. Graphene nanomaterials were synthesized and characterized with different techniques, namely spectrophotometry, Electron Microscope, zeta potential, and nanoparticle sizing. Four samples of based-DW were tested with different testing parameters, namely mass flow rates, input temperatures, and heating fluxes. Besides this, new empirical correlations were developed for predicting the thermal efficiency of DW and Gr-nanofluids as a function of dropped temperature parameter and weight concentration with three coefficients at different flow rates.
2. Experimental Approach
In this section, the nanomaterials and chemicals for covalent functionalization are introduced. Moreover, the procedure used to prepare the graphene-based water nanofluid is discussed. Then, the experimental indoor setup is presented. In addition, characterization and thermophysical properties are specified.
2.1. Synthesis of Gr-Nanofluids
Monolayer Graphene (Gr) was purchased abroad from VCN-Materials Co., Ltd., Bushehr, Iran. While the chemical reaction approach was carried out using different reagents and materials were locally obtained from Sigma-Aldrich: Pentaethylene glycol (PEG), strong medium (AlCl3:HCl), tetrahydrofuran (THF), and N, N-dimethylformamide (DMF). The adding of (AlCl3:HCl) to the GrNPs introduced specific groups like (–OH) and (–COOH) on the surface affinity; the details can be found in [27] (see Figure 1). To prepare the experimental samples of GrNPs-DW, Pioneer Precision Electronic Balance (OHAUS PX163, Parsippany, NJ, USA) with Std. Dev. of 0.1 mg and a probe (Vibra-Cell, Sonics, VC 750, Newtown, CT, USA) were used.
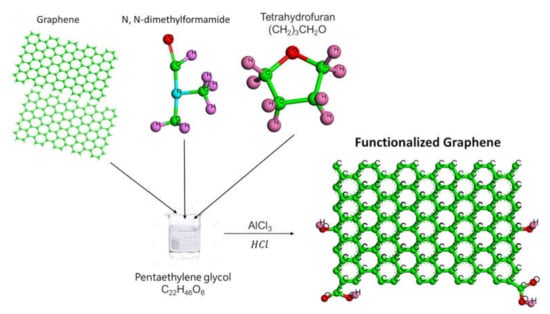
Figure 1.
Schematic illustration of the covalent functionalization of graphene.
2.2. Experimental Setup
The setup configuration of an indoor-FPSC was used here to study the behavior of using graphene nanocoolants rather than conventional fluids (see Figure 2). The testing system consists of an absorber plate, controlling and measuring tools, an electrical centrifugal pump, a water-cooling chiller bath (WiseCircu WCR-P22, Seoul, Korea), a flow piping loop, and a digital data recorder (EC18, paperless Ecolog 18-channel recorder, Japan). The absorbing copper sheet was completely soldered over the contact length of the copper riser pipes. An isowool ceramic fiber blanket was installed with a thickness of 50 mm (back), 30 mm (sides), and thermal conductivity of 0.07 W/m-K at 400 °C to minimize the heat loss surroundings. A configuration of the flexible adhesive heater/adjustable voltage transformer (KH-1012/(2.5)-P, from Omega, Norwalk, CT, USA) was used to control the input power (heat flux intensity). Digital-sense T-thermocouple self-adhesive surface probes (model; SA1XL-T-72, Omega, USA) were installed at twelve locations to estimate the riser’s surface temperatures of pipes and flat plate. Furthermore, the bulk temperature was measure by inserting two RTDs (PT100-type, Omega, USA) at the fluid in/out.
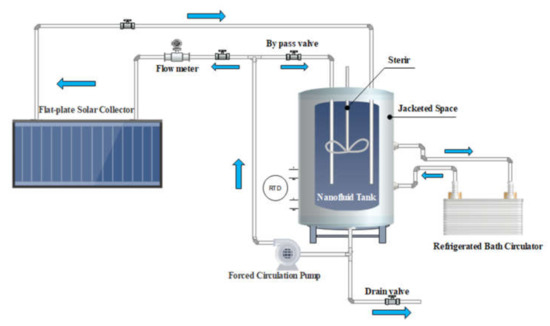
Figure 2.
The schematic diagram and the specifications of the flat plate solar collector setup.
2.3. Characterization and Thermophysical Properties
The measurements of ultraviolet-visible spectroscopy (UV/Vis) and nanoparticle sizing were carried out to verify the stability of the graphene dispersions. UV/Vis spectroscopy analysis of light absorbance for a suspension can be used to provide a quantifiable stability characterization. Perkin Elmer (Lambda 750, Waltham, MA, USA) was used for measuring the UV/Vis within the range of (190–3300) nm. The Anton Paar instrument (Litesizer 500, Graz, Austria) was used with the Electrophoretic Light Scattering (ELS) concept for calculating zeta potential and nanoparticle size measurements. For zeta-potential analysis [28], the degree of aversion between near-nanoparticles shows the same nanofluid dispersal effect. The Tescan VEGA3 (Brno, Czech Republic) tool was used to examine the morphology and elemental properties of GrNPs.
In this work, to prepare the GrNPs-nanofluids with the desired concentration, nanoparticles were equivalently dispersed into DW [29]. The viscosity, thermal conductivity, specific heat capacity, and density properties of H2O and GrNPs-H2O nanofluids were estimated with different instrumentations such as (Physica, MCR 302, Anton Paar, Graz, Austria), (Decagon Devices, Inc., Pullman, WA, USA), (DSC 8000, Perkin Elmer, Waltham, Massachusetts, USA) and (Mettler Toledo, model: DE-40, Greifensee, Switzerland), respectively.
2.4. Data Collection and Error Analysis
The useful heat gain of the FPSC-fluid (Qu) was calculated using the following Equations (1) and (2) [30,31,32]:
In this case, is the mass flow rate, (Cp) indicates the fluid-specific heat. (Tout and Tin) are the output and input fluid temperatures. (FR) refers to the heat removal coefficient, (Ac) indicates the gross area of the collector, (GT) states the heat flow intensity, (τα) specifies the effective absorptance–transmittance product, (UL) shows the overall heat loss coefficient. (Tamb) is the ambient temperature. (η) denotes the FPSC-efficiency as the ratio of the usable energy gain to the solar energy incident over a given time [30,31,32]:
Experimental uncertainty assessment deals with assessing the uncertainty in a measurement. The uncertainty for FPSC-efficiency is an equation of five factors, namely mass flow rate, specific heat capacity, the intensity of solar radiation, collector area, and the difference between output/input fluid temperatures. Equation (5) shows the combination formula of the uncertainty for FPSC-efficiency [20]:
Table 1 demonstrates the ranges and accuracies of the instruments, equipment, and working fluid properties; after the measurement procedure, the overall uncertainty of the FPSC-efficiency is around 2.92%.

Table 1.
Ranges and accuracies of tools and fluid properties.
3. Theoretical Approach
This section addresses the geometrical specifications of the solar collector. The different parameters are discussed extensively, such as Collector Heat Loss, Collector Efficiency Factor, Heat Removal and Flow Factors, Mean Fluid and Flat Plate Temperatures. Finally, the Solar Collector Efficiency is calculated.
3.1. The Solar Collector Geometry
The essential elements of the FPSC are the glazing frame with one/more glass sheets, heat-absorbing backplate, heat-absorbing riser tubes with lower manifold collections tubes, sides, and bottom insulation. For the best design, various materials for all these components need to be measured for their properties and configurations. It is also necessary to study the processes and techniques to increase its efficiency further. Some assumptions for modelling solar collectors on the flat plate are as follows [33,34]:
- (1)
- The FPSC works under stable state conditions.
- (2)
- The covered area of header pipes can be ignored.
- (3)
- The fluid from headers to riser tubing flows uniformly.
- (4)
- The input heat flows in one-dimension through the system.
- (5)
- The temperature drop through the cover is insignificant.
- (6)
- The temperature gradients around the pipes may be unnoticed.
- (7)
- Temperature gradients can be viewed separately in the flow direction and between the pipes.
- (8)
- The losses from the front and bottom are at the same ambient temperature.
3.2. The Collector Heat Loss
As the collector absorbs heat and heat is lost to the atmosphere by convection and radiation, the FPSC-surface temperature becomes higher than that of the ambient. The heat loss rate (Qloss) depends on the overall heat transfer coefficient (UL) and the flat plate mean temperature (Tpm) [33,34]:
where, (t, b, and e) denote the subscripts for top, back, and edge, respectively.
An empirical equation for estimating the maximum collector-to-environment loss coefficient (Ut) for both manual and computer measurements is given by [34]:
In this case, (ff) = (1− 0.089 hwind + 0.1166 h2windεap) (1 + 0.078661N), (CC) = 520(1 − 0.000051 φ2), (ee) = 0.430(1 − 100/Tpm).
The formulas below used to estimate the back and edge heat loss ( and ) [33,34]:
where (Lb and kb) refer to the thickness and thermal conductivity of back-insulation, respectively. (ke, Le, and Ae) indicate the thermal conductivity, thickness, and area of the collector edge-insulation.
3.3. Collector Efficiency Factor
Collector Efficiency Factor () signifies the temperature distributions in an absorbing sheet at a right angle to the fluid flow. The configuration of the plate-tube collector absorber is exhibited in Figure 3. Through solving the problem of the standard fin, () can be obtained by assuming an insignificant temperature tendency in the flow direction. The plate’s temperature is believed to be (Tb), and the centerline between two riser tubes is (W- D)/2. The fin formula can be solved by adding the energy balance in the direction of flow into an elementary area of (dx) width and unit length [33,34]:
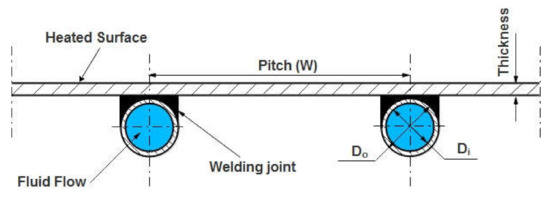
Figure 3.
The geometric configuration of the absorber plate tube.
Here, () is the total loss coefficient by the aperture size. To simplify this 2nd-order differential equation, the following necessary boundary conditions must be symmetry at the centerline as well as the plate’s temperature.
The energy transmitted by conduction through the flow-direction of the fin-base can be evaluated by:
where (F) is the rectangular fin efficiency and given by Equation (14):
Here, (m) is the variable arrangement of fin-air and defined as .
The collector, useful energy gain, covers the heat collected above the pipe area:
The useful gain in the flow-direction for the pipe and fin-per-unit is the summation of ( and ):
The useful gain is transported to the operating liquid. The heat-flow resistance to the absorbent medium combines the absorbing medium’s bond and tube resistance. The useful energy gain per unit of length can be seen in the flow-direction:
where, (Tb and Tf) are the base and fluid temperatures, (hfi) is the internal heat transfer coefficient, (Di) is the inner diameter of the riser pipe, (Cb) is the bond thermal conductance. The useful gain in the flow direction for the tube-fin per unit of length is the summation of Equations (16) and (17):
where () refers to the collector efficiency factor:
The consequence of Equation (19) for the experiment is a physical description of the collector performance factor. The local fluid temperature () represents the relation of the actual energy gain to the useful energy gain in a specific area.
3.4. Heat Removal and Flow Factors
The FPSC-heat removal factor (FR) is a quantity that relates to the actual beneficial energy gain of a collector to the useful gain if the whole collector surfaces were at the fluid inlet temperature [33,34]:
Meanwhile, the flow factor refers to the relation between the heat removal factor and the FPSC-efficiency factor:
3.5. Mean Fluid and Flat Plate Temperatures
Knowing that the energy loss coefficient (UL) and the internal heat transfer coefficient (hfi) are essential for calculating the heat collecting efficiency, the mean fluid temperature can be described as [33,34]:
One of the critical properties of the absorbing medium is the evaluation of an appropriate temperature. Owing to the heat transfer resistance between the collector and the working medium, the mean fluid temperature (Tfm) is lower than the mean plate temperature (Tpm). (Tpm) and can be measured with Equation (24):
3.6. The Solar Collector Efficiency
Instantaneous efficiency is a useful metric to characterize the heat collected performance. Instantaneous solar collector efficiency represents the ratio of solar energy collected divided by the solar energy available [33,34]:
where ΙΤ is the incident solar radiation intensity, the instantaneous efficiency becomes:
where the absorbed energy Sc is changed to according to the gross absorbed area. MATLAB package was applied to develop the mathematical model algorithm for the FPSC. The algorithm flowchart is shown in Figure 4.
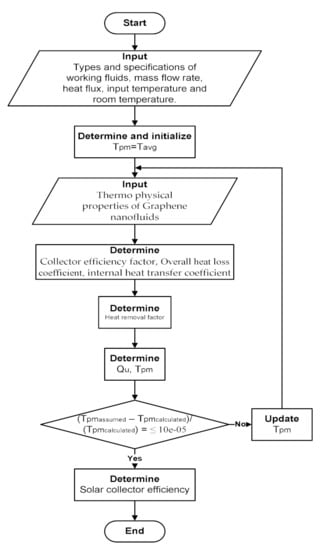
Figure 4.
Flowchart of the program developed in MATLAB.
4. Results and Discussion
4.1. GrNPs Characterization and Thermophysical Properties
Figure 5 displays the Ultraviolet–Visible spectroscopy for covalently functionalized GrNPs suspended in a base fluid (distilled water). It can be shown that in the wavelength range of 260–270 nm, the peak absorption is produced by the existence of GrNPs in all of the synthesized nanoparticles. The maximum absorption peak indicated at ~264 nm is possibly due to the π→π* transition of C=C bonding for the graphene [35,36]. Following this peak and within the spectrum of wavelengths revealed in Figure 5, a reduction in absorbance was noticed in all tests at a minimum peak of ~974 nm [37].
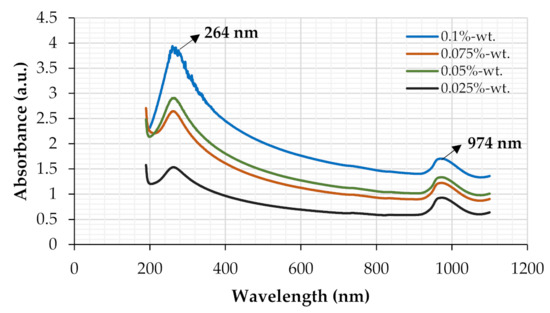
Figure 5.
UV–Vis spectra of Gr-H2O nanofluids at different particle concentrations.
Zeta potential measurement (surface charge analysis) is a technique used for determining the surface charge of GrNPs in a colloidal solution. Charged particles may exhibit various electrokinetic effects under the influence of an electrical field, including electrophoresis, electroosmosis, streaming potential, or settlement potential [38,39]. The electrophoretic performance and additional details were performed by zeta potential evaluation to consider the water based GrNPs nanofluids’ dispersion behavior. Zeta-potential is one of the standard approaches for determining the long-term stability of dispersions; the solution is considered stable if the zeta-potential value exceeds (−30 mV) or exceeds (+30 mV) [40]. Figure 6 and Figure 7 demonstrate the examination of zeta potential and nanoparticle size distributions for the GrNPs-H2O nanofluids. At pH = 7, Figure 6 shows the zeta-potential and the polydispersity index (PDI) for GrNPs-H2O nanofluid. To create a natural repulsive force between the nanoparticles, the zeta potential must be as high as possible (+/−) to form a traditional repulsive force between the GrNPs. It can be seen that GrNPs show a negative charge of about (−39.6 mV) in the test condition of 25 °C and one hour sonication. To calculate the average size of the synthesized GrNPs, a nanoparticle size-distribution analysis was performed via the principle of dynamic light scattering (DLS) in aqueous colloidal dispersions. The average particle size of GrNPs was 289.6 nm, as illustrated in Figure 7. DLS results showed that the scale ranged from 71.4–953.7 nm with a low polydispersity index of 0.248. This implies that the solution had the most consistent and uniform distribution of particle size.
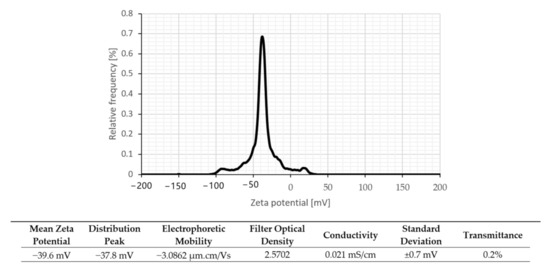
Figure 6.
Zeta potential distribution for graphene nanofluid at 25 °C.
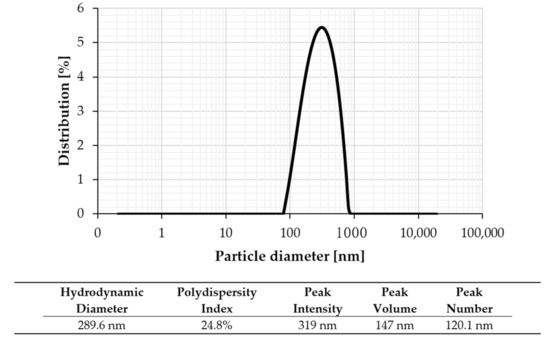
Figure 7.
Particle size distributions for graphene nanofluid at 25 °C.
Figure 8 depicts the representative scanning electron microscope (SEM) micrographs of GrNPs. SEM is a valuable method for distinguishing the size-scale, distribution, and shape of nanomaterials. SEM micrographs visualize the dispersion and stabilization effect of GrNPs-H2O nanofluid. Ultra-Flat Silicon Wafers is an excellent substrate for imaging, experiments, and microfabrication applications to obtain SEM characterization. Figure 8 shows that nanoparticles do not accumulate, so they appear in an aggregation mechanism and are well distributed. SEM micrographs also reveal that the covalent synthesizing of Gr actively allows wrinkled structures. Figure 8 shows the spectral study of GrNPs with energy-dispersive X-ray (EDX). The EDX measurements show a carbon content of 94.03% and an atomic oxygen content of 5.86%. While the atomic content of Si and S is 0.10% and 0.01%, respectively. The findings presented demonstrate the high quality of the shaped nanomaterial and agree well with other reported data [41,42,43].
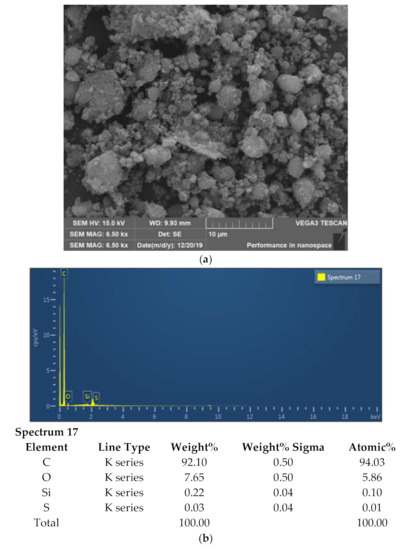
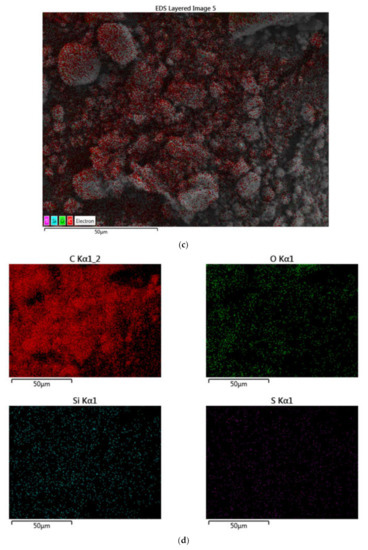
Figure 8.
Scanning electron microscope and energy-dispersive X-ray (EDX) mapping analysis of the GrNPs; (a) SEM microimage, (b) EDX mapping and elemental analysis, (c) EDS layered image, (d) Carbon mapping, Oxygen mapping, Silicon mapping, Sulfur mapping.
The measurements of thermo-physical properties for H2O and GrNPs-H2O nanofluids are shown in Table 2. Four samples (0.025 wt.%, 0.05 wt.%, 0.075 wt.%, and 0.1 wt.%) GrNPs-H2O nanofluids were tested at three different fluid temperatures (30 °C, 40 °C, and 50 °C) [27,29]. The dynamic viscosity, thermal conductivity, and density were directly proportional to the percentage increase in GrNPs, while the specific heat capacity demonstrated different characteristics. Relative to the base fluid (DW) data, the average thermal conductivity changes were 20.70%, 25.87%, and 30.40% for 30 °C, 40 °C, and 50 °C, respectively, at 0.1 wt.% The corresponding highest dynamic viscosity rises were 38.30%, 36.01%, and 42.44% for 30 °C, 40 °C, and 50 °C, respectively, at 0.1 wt.% Slight changes in the density were observed at 0.14%, 0.10% and 0.11% for 30 °C, 40 °C, and 50 °C, respectively, at 0.1 wt.% While the specific heat capacity results show decreases of 1.47%, 1.50% and 1.56% for 30 °C, 40 °C, and 50 °C, respectively, at 0.1 wt.%
Table 2.
Thermophysical properties of Gr-nanofluids at various mass fractions and temperatures [23,27].
4.2. Thermal Behavior of FPSC-Based Water
Distilled water was tested first inside the indoor-FPSC experimentations to validate the collected data. The setup and MATLAB package data were compared throughout the current study. The maximum and average errors were 4.56% and 1.95%, respectively, between the MATLAB and experimental data. The heat collected efficiency is experimentally and theoretically displayed in Figure 9 against the dropped temperature coefficient ((Tin−Tamb)/GT) at multiple mass flow rates. As the water flow rate increased from 1 to 1.5 kg/min experimentally and theoretically, the heat collected energy increased between (1.81% to 2.42%) and (1.8% to 2.41%). Therefore, it was also apparent that the rise in water mass flow rates resulted in the FPSC-efficiency improvement and decreased the absorber’s surface temperature. The overarching explanation was impacted by the collector’s reduced heat loss, thus increasing efficiency.
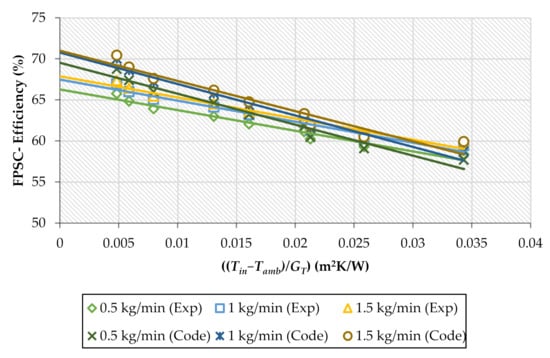
Figure 9.
The experimental and theoretical values for FPSC-efficiency against reduced temperature variable under different fluid mass flow rates during the water run.
FR(τα) and FRUL are also calculated by drawing the collected data with curve fittings to present the thermal behavior of the FPSC. Table 3 gives the values of FR(τα) and FRUL for numerous water mass flow rates. Once the water flow rate had risen from 1 to 1.5 kg/min, the value of FR(τα) increased by about 2.4% and 2.1% for the experimental and theoretical approaches. Simultaneously, the experimental and theoretical decrements for the value of FRUL were 21.44% and 15.14%, respectively.
Table 3.
Heat gain and heat loss coefficients under different flow rates for graphene nanofluids.
4.3. Thermal Behavior of FPSC-Based Nanofluids
Owing to the high ratio of surface area to volume, suspending solid nanoparticles in distilled water will not result in a simple mixture. The nanoparticles will tend to accumulate over time due to high surface tension between them. The nanoparticles will settle and block the flow channels, and the thermal conductivity will be reduced as a result of this agglomeration. To synthesize a nanofluid with high thermal conductivity and a high heat transfer coefficient, the lowest possible concentration of nanoparticles with relatively high thermal conductivity should be used. This method is critical because nanofluids with lower concentrations of dispersed nanoparticles are known to be more stable. Viscosity would be higher in nanofluids with higher nanoparticle concentrations. The higher the viscosity of the nanofluid compared to the base fluid, the higher the pressure drop, which is directly proportional to the pumping power needed.
Figure 10a–c shows the experimental and theoretical data for base fluid and nanofluids at different percentages to describe the heat collected efficiency against ((Tin−Tamb)/GT) for multiple GrNPs-H2O flow rates. The energy performance increased when the GrNPs nanomaterials were suspended in the distilled water at different nanoparticle percentages. Relative to DW, the experimental data of the FPSC-efficiency increased by 10.4%, 10.9%, and 13% for 0.5, 1, and 1.5 kg/min, respectively. Furthermore, the theoretical efficiency improved by 9.9%, 10.4%, and 12.5% for the case of 0.5, 1, and 1.5 kg/min. The maximum and average errors between the theoretical and experimental results were 4.03% and 1.74%, respectively.
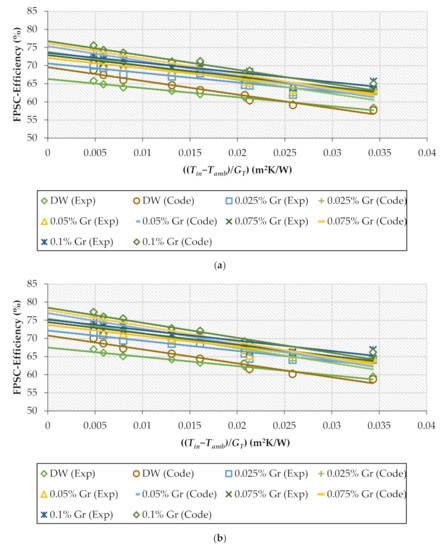
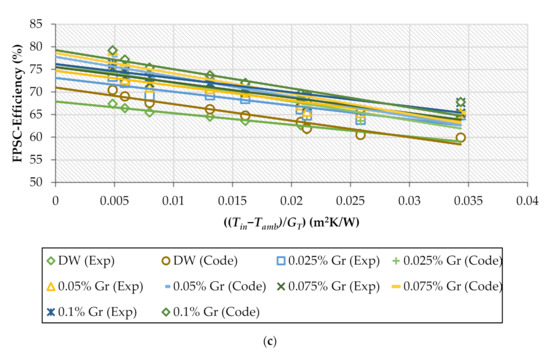
Figure 10.
Experimental and theoretical values for collector’s efficiency for H2O and Gr-H2O nanofluids with different weight concentrations; (a) 0.5 kg/min, (b) 1 kg/min, (c) 1.5 kg/min.
The current findings are consistent with the previous reports of Karami et al. [44,45,46]. The rise in the weight percentages of Gr-H2O increased the input energy absorption, resulting in a higher efficiency enhancement. The heat supplied was absorbed uniformly over the nanofluid layers for the lower mass fraction of Gr-H2O. Consequently, the amount of thermal loss at the boundaries was smaller than the maximum heat absorption in the top layer of the nanofluid for the high mass fraction of GrNPs. This resulted in a region of higher temperatures near the top wall, which reduced the heat gained efficiency due to increased heat losses [47]. Table 4 provides a comparative summary of the earlier investigations of FPSC performance using nanofluids with carbon nanostructures and the outcomes of the present results.
Table 4.
A comparison of the results for the present study with studies carried out in the recent past.
Table 3 displays (FR(τα)) and (FRUL) for Gr-H2O nanofluids. At the test conditions of 0.5 kg/min and 0.1 wt.%, (FR(τα)) were experimentally and theoretically enhanced by 10.89% and 10.38%, respectively. The heat loss coefficient (FRUL) values experimentally and theoretically increased by 10.97% and 6.09%, respectively. In the same order for 1 kg/min, the experimental increases in the (FR(τα)) and (FRUL) were 11.39% and 8.06%, respectively. Besides, the theoretical increments in the (FR(τα)) and (FRUL) were 10.86% and 2.77%, respectively. Further, Table 3 indicates the experimental increases in the values of (FR(τα)) and (FRUL) which were 12.2% and 7.28%, respectively, at 1.5 kg/min. The MATLAB data enhancements for the heat gain and the heat loss coefficients were 11.67% and 7.58% for the same condition.
4.4. New Correlations of Thermal Efficiency
A new thermal efficiency correlation was developed as a function of the dropped temperature coefficient ((Tin−Tamb)/GT) and various mass percentages at multiple flow rates, as shown in Equations (27) and (28). A linear model with 95% confidence bounds using MATLAB package was generated to predict the coefficients of FPSC-based H2O and Gr-H2O nanofluids. As shown in Figure 11a,b, the average and maximum deviations between the predicted and experimental data were (±2.653% and ±3.353%) and (±2.758% and ±4.232%) for H2O and Gr-H2O nanofluids, respectively. The coefficients of the new correlation and regression statistics are presented in Table 5.
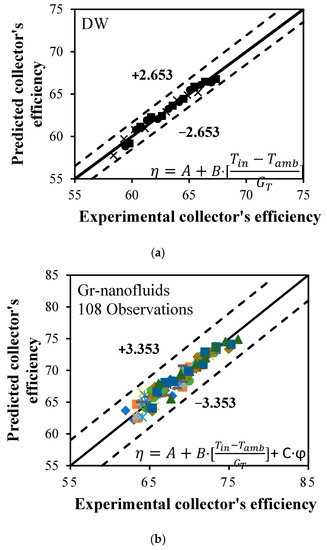
Figure 11.
Proposed correlations of thermal efficiency for: (a) DW, and (b) Gr-nanofluids.
Table 5.
The coefficients of the proposed correlations for DW and Gr-nanofluids at different flow rates.
5. Conclusions
In conclusion, experimental and theoretical methods were performed to report the heat collected performance of the indoor configuration of the FPSC-system using GrNPs- H2O nanofluid. This work was carried out under different testing conditions, namely different weight concentrations, various inlet fluid temperatures, multiple flow rates, and changing heat flux intensities. Ultraviolet–Visible spectroscopy, zeta potential, nanoparticle size distribution, and SEM-EDX were used as characterization instruments to analyze covalent-functionalized graphene nanomaterials. The analysis led to the following conclusions:
- (1)
- The maximum absorption peak was indicated at ~264 nm, a reduction in the absorbance was noticed in all tests at a minimum peak of ~974 nm. GrNPs showed a negative charge of about (−39.6 mV) in the test condition of 25 °C and one hour sonication.
- (2)
- The EDX measurements showed a carbon content of 94.03% and an atomic oxygen content of 5.86%, while the atomic contents of Si and S were 0.10% and 0.01%, respectively.
- (3)
- The maximum experimental and theoretical heat collected efficiency was achieved at 76.13% and 79.2% at 0.1 wt.% and 1.5 kg/min, which was 13% and 12.5% more than DW at the same conditions.
- (4)
- The overall and average errors between the theoretical and experimental values were 4.03% and 1.74%, respectively.
- (5)
- The maximum experimental and theoretical rise in the (FR(τα)) was 12.2% and 11.67%, respectively, for 1.5 kg/min and 0.1 wt.%, while the corresponding experimental and theoretical values of (FRUL) increased by 10.97% and 7.58% at 0.5 and 1.5 kg/min, respectively, at 0.1 wt.%.
- (6)
- A new correlation was developed for the base fluid and nanofluids’ thermal efficiency as a function of dropped temperature parameter and weight concentration (±2.758% and ±4.232%) maximum deviations.
Author Contributions
Conceptualization, O.A.A.; Formal analysis, O.A.A.; Funding acquisition, H.M.K.; Investigation, O.A.A., A.R.M.; Methodology, O.A.A., H.A.M.; Project administration, H.M.K., M.A.S.S., K.M.S.N.; Super-vision, H.M.K., K.M.S.N.; Writing—original draft, O.A.A., H.A.M., G.N.; Writing—review and editing, H.A.M., Z.M.Y. All authors have read and agreed to the published version of the manuscript.
Funding
This research was funded by Universiti Teknologi Malaysia (UTM), operated by Research Management Center (RMC), under the Research University Grant number (04E76).
Institutional Review Board Statement
Not applicable.
Informed Consent Statement
Not applicable.
Data Availability Statement
Data available on request due to restrictions e.g., privacy or ethical. The data presented in this study are available on request from the corresponding author. The data are not publicly available due to the need for further research.
Conflicts of Interest
The authors declare no conflict of interest.
Nomenclature
| Ac | Absorber area [m2] | GT | Radiation intensity [W/m2] |
| Al2O3 | Aluminium oxide | HCl | Hydrochloric acid |
| AlCl3 | Aluminium chloride | K | Thermal conductivity [W/m. K] |
| Cb | Bond conductance [W/m. K] | L | Characteristic length [m] |
| CGNPs | Clove-treated graphene nanoplatelets | m | Fin-air arrangement parameter |
| CNTs | Carbon nanotubes | Fluid flow rate [kg/min] | |
| Cp | Fluid specific heat capacity [kJ/kg K] | MWCNTs | Multi-Walled Carbon Nanotubes |
| CuO | Copper oxide | PEG | Pentaethylene Glycol |
| D | Tube diameter [m] | Qloss | Overall heat loss [W] |
| DMF | Dimethylformamide | Qu | Useful energy rate [W] |
| EDX | Energy-dispersive X-ray | RTD | Resistance Temperature Detectors |
| ELS | Electrophoretic Light Scattering | SEM | Scanning Electron Microscope |
| F | Standard fin efficiency | SiO2 | Silica |
| Collector efficiency factor | SWCNTs | Single-Wall Carbon Nanotubes | |
| Collector flow factor | T | Temperature [K] | |
| FPSC | Flat plate solar collector | THF | Tetrahydrofuran |
| FR | Heat removal factor | TiO2 | Titanium oxide |
| FR(τα) | Heat gain factor | UL | Overall heat loss coefficient [W/m2K] |
| FRUL | Heat loss factor | Ut | Top cover loss coefficient [W/m2K] |
| GNPs | Graphene Nanoplatelets | UV/Vis | Ultraviolet–Visible spectrophotometry |
| GO | Graphene oxide | W | Width between riser pipes [m] |
| Gr | Graphene | ||
| Greek symbols | |||
| µ | Fluid viscosity [mPa s] | τα | Absorptance-transmittance product |
| η | Collector efficiency | φ | Mass fraction [ wt.%] |
| ρ | The fluid density [kg/m3] | ||
| Subscripts | |||
| amb | Ambient | in | Input fluid |
| b | Back-side of the collector | L | Overall loss coefficient |
| c | Solar collector | out | Outlet fluid |
| e | Edge side of the collector | pm | Mean absorber plate |
| fm | Mean fluid | t | Top-side of the collector |
| i | Instantaneous | u | Useful energy gain |
References
- Hottel, H.C.; Woertz, B.B. The performance of flat-plate solar-heat collectors. Trans. ASME 1942, 64, 91. [Google Scholar]
- Hottel, H.C.; Whillier, A. Evaluation of Flat-Plate Solar Collector Performance. Transcr. Conf. Use Solar Energy Sci. Basis A 1955, 3, 74–104. [Google Scholar]
- Tabor, H. Solar energy collector design. Bull. Res. Counc. Isr. Sect. C 1955, 5, 5–27. [Google Scholar]
- Pandey, K.M.; Chaurasiya, R. A review on analysis and development of solar flat plate collector. Renew. Sustain. Energy Rev. 2017, 67, 641–650. [Google Scholar] [CrossRef]
- Li, S.; Wang, H.; Meng, X.; Wei, X. Comparative study on the performance of a new solar air collector with different surface shapes. Appl. Therm. Eng. 2017, 114, 639–644. [Google Scholar] [CrossRef]
- Yousefi, T.; Veisy, F.; Shojaeizadeh, E.; Zinadini, S. An experimental investigation on the effect of MWCNT-H2O nanofluid on the efficiency of flat-plate solar collectors. Exp. Therm. Fluid Sci. 2012, 39, 207–212. [Google Scholar] [CrossRef]
- Noghrehabadi, A.; Hajidavaloo, E.; Moravej, M. Experimental investigation of efficiency of square flat-plate solar collector using SiO2/water nanofluid. Case Stud. Therm. Eng. 2016, 8, 378–386. [Google Scholar] [CrossRef]
- Shazali, S.S.; Rozali, S.; Amiri, A.; Zubir, M.N.M.; Sabri, M.F.M.; Zabri, M.Z. Evaluation on stability and thermophysical performances of covalently functionalized graphene nanoplatelets with xylitol and citric acid. Mater. Chem. Phys. 2018, 212, 363–371. [Google Scholar] [CrossRef]
- Esmaeilzadeh, A.; Silakhori, M.; Nik Ghazali, N.N.; Metselaar, H.S.C.; Bin Mamat, A.; Naghavi Sanjani, M.S.; Iranmanesh, S. Thermal Performance and Numerical Simulation of the 1-Pyrene Carboxylic-Acid Functionalized Graphene Nanofluids in a Sintered Wick Heat Pipe. Energies 2020, 13, 6542. [Google Scholar] [CrossRef]
- Shazali, S.S.; Amiri, A.; Mohd Zubir, M.N.; Rozali, S.; Zabri, M.Z.; Mohd Sabri, M.F.; Soleymaniha, M. Investigation of the thermophysical properties and stability performance of non-covalently functionalized graphene nanoplatelets with Pluronic P-123 in different solvents. Mater. Chem. Phys. 2018, 206, 94–102. [Google Scholar] [CrossRef]
- Wüest, T.; Grobe, L.O.; Luible, A. An Innovative Façade Element with Controlled Solar-Thermal Collector and Storage. Sustainability 2020, 12, 5281. [Google Scholar] [CrossRef]
- Kuczynski, W.; Kaminski, K.; Znaczko, P.; Chamier-Gliszczynski, N.; Piatkowski, P. On the Correlation between the Geometrical Features and Thermal Efficiency of Flat-Plate Solar Collectors. Energies 2021, 14, 261. [Google Scholar] [CrossRef]
- Ding, D.; He, W.; Liu, C. Mathematical Modeling and Optimization of Vanadium-Titanium Black Ceramic Solar Collectors. Energies 2021, 14, 618. [Google Scholar] [CrossRef]
- Siuta-Olcha, A.; Cholewa, T.; Dopieralska-Howoruszko, K. Experimental studies of thermal performance of an evacuated tube heat pipe solar collector in Polish climatic conditions. Environ. Sci. Pollut. Res. 2020, 28, 14319–14328. [Google Scholar] [CrossRef] [PubMed]
- Said, Z.; Saidur, R.; Sabiha, M.A.; Rahim, N.A.; Anisur, M.R. Thermophysical properties of Single Wall Carbon Nanotubes and its effect on exergy efficiency of a flat plate solar collector. Solar Energy 2015, 115, 757–769. [Google Scholar] [CrossRef]
- Said, Z.; Saidur, R.; Rahim, N.A.; Alim, M.A. Analyses of exergy efficiency and pumping power for a conventional flat plate solar collector using SWCNTs based nanofluid. Energy Build. 2014, 78, 1–9. [Google Scholar] [CrossRef]
- Yousefi, T.; Shojaeizadeh, E.; Veysi, F.; Zinadini, S. An experimental investigation on the effect of pH variation of MWCNT-H2O nanofluid on the efficiency of a flat-plate solar collector. Solar Energy 2012, 86, 771–779. [Google Scholar] [CrossRef]
- Vincely, D.A.; Natarajan, E. Experimental investigation of the solar FPC performance using graphene oxide nanofluid under forced circulation. Energy Convers. Manag. 2016, 117, 1–11. [Google Scholar] [CrossRef]
- Vakili, M.; Hosseinalipour, S.M.; Delfani, S.; Khosrojerdi, S.; Karami, M. Experimental investigation of graphene nanoplatelets nanofluid-based volumetric solar collector for domestic hot water systems. Solar Energy 2016, 131, 119–130. [Google Scholar] [CrossRef]
- Ahmadi, A.; Ganji, D.D.; Jafarkazemi, F. Analysis of utilizing Graphene nanoplatelets to enhance thermal performance of flat plate solar collectors. Energy Convers. Manag. 2016, 126, 1–11. [Google Scholar] [CrossRef]
- Verma, S.K.; Tiwari, A.K.; Chauhan, D.S. Experimental evaluation of flat plate solar collector using nanofluids. Energy Convers. Manag. 2017, 134, 103–115. [Google Scholar] [CrossRef]
- Akram, N.; Sadri, R.; Kazi, S.N.; Ahmed, S.M.; Zubir MN, M.; Ridha, M.; Soudagar, M.; Ahmed, W.; Arzpeyma, M.; Tong, G.B. An experimental investigation on the performance of a flat-plate solar collector using eco-friendly treated graphene nanoplatelets–water nanofluids. J. Therm. Anal. Calorim. 2019, 138, 609–621. [Google Scholar] [CrossRef]
- Alawi, O.A.; Mohamed Kamar, H.; Mallah, A.R.; Kazi, S.N.; Sidik, N.A.C. Thermal efficiency of a flat-plate solar collector filled with Pentaethylene Glycol-Treated Graphene Nanoplatelets: An experimental analysis. Solar Energy 2019, 191, 360–370. [Google Scholar] [CrossRef]
- Hussein, O.A.; Habib, K.; Muhsan, A.S.; Saidur, R.; Alawi, O.A.; Ibrahim, T.K. Thermal performance enhancement of a flat plate solar collector using hybrid nanofluid. Solar Energy 2020, 204, 208–222. [Google Scholar] [CrossRef]
- Akram, N.; Montazer, E.; Kazi, S.N.; Soudagar, M.E.M.; Ahmed, W.; Zubir, M.N.M.; Afzal, A.; Muhammad, M.R.; Ali, H.M.; Márquez, F.P.G. Experimental investigations of the performance of a flat-plate solar collector using carbon and metal oxides based nanofluids. Energy 2021, 227, 120452. [Google Scholar] [CrossRef]
- Kumar, L.H.; Kazi, S.N.; Masjuki, H.H.; Zubir, M.N.M.; Jahan, A.; Bhinitha, C. Energy, Exergy and Economic analysis of Liquid Flat-Plate Solar Collector using Green covalent functionalized Graphene Nanoplatelets. Appl. Therm. Eng. 2021, 192, 116916. [Google Scholar] [CrossRef]
- Alawi, O.A.; Sidik, N.A.C.; Kazi, S.N.; Najafi, G. Graphene nanoplatelets and few-layer graphene studies in thermo-physical properties and particle characterization. J. Therm. Anal. Calorim. 2019, 135, 1081–1093. [Google Scholar] [CrossRef]
- Hussein, O.A.; Habib, K.; Saidur, R.; Muhsan, A.S.; Shahabuddin, S.; Alawi, O.A. The influence of covalent and non-covalent functionalization of GNP based nanofluids on its thermophysical, rheological and suspension stability properties. RSC Adv. 2019, 9, 38576–38589. [Google Scholar] [CrossRef]
- Alawi, O.A.; Mallah, A.R.; Kazi, S.N.; Sidik, N.A.C.; Najafi, G. Thermophysical properties and stability of carbon nanostructures and metallic oxides nanofluids: Experimental approach. J. Therm. Anal. Calorim. 2018, 135, 1545–1562. [Google Scholar] [CrossRef]
- Hawwash, A.A.; Abdel Rahman, A.K.; Nada, S.A.; Ookawara, S. Numerical Investigation and Experimental Verification of Performance Enhancement of Flat Plate Solar Collector Using Nanofluids. Appl. Therm. Eng. 2018, 130, 363–374. [Google Scholar] [CrossRef]
- He, Q.; Zeng, S.; Wang, S. Experimental investigation on the efficiency of flat-plate solar collectors with nanofluids. Appl. Therm. Eng. 2014, 88, 165–171. [Google Scholar] [CrossRef]
- García, A.; Martin, R.H.; Pérez-García, J. Experimental study of heat transfer enhancement in a flat-plate solar water collector with wire-coil inserts. Appl. Therm. Eng. 2013, 61, 461–468. [Google Scholar] [CrossRef]
- Kalogirou, S.A. Solar Energy Engineering: Processes and Systems; Academic Press: Cambridge, MA, USA, 2013; ISBN 0123972566. [Google Scholar]
- Duffie, J.A.; Beckman, W.A. Solar Engineering of Thermal Processes; John Wiley & Sons: Hoboken, NJ, USA, 2013. [Google Scholar]
- Pan, D.; Zhang, J.; Li, Z.; Wu, M. Hydrothermal route for cutting graphene sheets into blue-luminescent graphene quantum dots. Adv. Mater. 2010, 22, 734–738. [Google Scholar] [CrossRef] [PubMed]
- Shazali, S.S.; Amiri, A.; Zubir, M.N.M.; Rozali, S.; Zabri, M.Z.; Sabri, M.F.M. Colloidal stability measurements of graphene nanoplatelets covalently functionalized with tetrahydrofurfuryl polyethylene glycol in different organic solvents. Curr. Appl. Phys. 2018, 18, 209–219. [Google Scholar] [CrossRef]
- Amiri, A.; Kazi, S.N.; Shanbedi, M.; Mohd Zubir, M.N.; Yarmand, H.; Chew, B.T. Transformer oil based multi-walled carbon nanotube-hexylamine coolant with optimized electrical, thermal and rheological enhancements. RSC Adv. 2015, 5, 107222–107236. [Google Scholar] [CrossRef]
- Amrollahi, A.; Rashidi, A.M.; Emami Meibodi, M.; Kashefi, K. Conduction heat transfer characteristics and dispersion behaviour of carbon nanofluids as a function of different parameters. J. Exp. Nanosci. 2009, 4, 347–363. [Google Scholar] [CrossRef]
- Zhu, H.; Zhang, C.; Tang, Y.; Wang, J.; Ren, B.; Yin, Y. Preparation and thermal conductivity of suspensions of graphite nanoparticles. Carbon 2007, 45, 226–228. [Google Scholar] [CrossRef]
- Yu, W.; Xie, H. A review on nanofluids: Preparation, stability mechanisms, and applications. J. Nanomater. 2012, 2012, 435873. [Google Scholar] [CrossRef]
- Georgakilas, V.; Otyepka, M.; Bourlinos, A.B.; Chandra, V.; Kim, N.; Kemp, K.C.; Hobza, P.; Zboril, R.; Kim, K.S. Functionalization of graphene: Covalent and non-covalent approaches, derivatives and applications. Chem. Rev. 2012, 112, 6156–6214. [Google Scholar] [CrossRef]
- Derry, C.; Wu, Y.; Gardner, S.; Zhu, S. Graphene nanoplatelets prepared by electric heating acid-treated graphite in a vacuum chamber and their use as additives in organic semiconductors. ACS Appl. Mater. Interfaces 2014, 6, 20269–20275. [Google Scholar] [CrossRef]
- Dimiev, A.M.; Ceriotti, G.; Metzger, A.; Kim, N.D.; Tour, J.M. Chemical mass production of graphene nanoplatelets in ∼100% yield. ACS Nano 2016, 10, 274–279. [Google Scholar] [CrossRef]
- Karami, M.; Akhavan Bahabadi, M.A.; Delfani, S.; Ghozatloo, A. A new application of carbon nanotubes nanofluid as working fluid of low-temperature direct absorption solar collector. Solar Energy Mater. Solar Cells 2014, 121, 114–118. [Google Scholar] [CrossRef]
- Karami, M.; Akhavan-Bahabadi, M.A.; Delfani, S.; Raisee, M. Experimental investigation of CuO nanofluid-based direct absorption solar collector for residential applications. Renew. Sustain. Energy Rev. 2015, 52, 793–801. [Google Scholar] [CrossRef]
- Karami, M.; Akhavan-Behabadi, M.A.; Dehkordi, M.R.; Delfani, S. Thermo-optical properties of copper oxide nanofluids for direct absorption of solar radiation. Solar Energy Mater. Solar Cells 2016, 144, 136–142. [Google Scholar] [CrossRef]
- Eltaweel, M.; Abdel-Rehim, A.A. Energy and exergy analysis of a thermosiphon and forced-circulation flat-plate solar collector using MWCNT/Water nanofluid. Case Stud. Therm. Eng. 2019, 14, 100416. [Google Scholar] [CrossRef]
Publisher’s Note: MDPI stays neutral with regard to jurisdictional claims in published maps and institutional affiliations. |
© 2021 by the authors. Licensee MDPI, Basel, Switzerland. This article is an open access article distributed under the terms and conditions of the Creative Commons Attribution (CC BY) license (https://creativecommons.org/licenses/by/4.0/).