Article

Evaluation of Environmental Information Disclosure of Listed Companies in China’s Heavy Pollution Industries: A Text Mining-Based Methodology

1
School of Management, China University of Mining and Technology, Xuzhou 221116, China
2
School of Economics and Management, Ningbo University of Technology, Ningbo 315211, China
*
Author to whom correspondence should be addressed.
Sustainability 2021, 13(10), 5415; https://doi.org/10.3390/su13105415
Submission received: 8 February 2021 / Revised: 16 April 2021 / Accepted: 6 May 2021 / Published: 12 May 2021
(This article belongs to the Special Issue Artificial Intelligence (AI) For Sustainability)

Abstract

:
Environmental information disclosure (EID) of listed companies is a significant and essential reference for assessing their environmental protection commitment. However, the content and form of EID are complex, and previous assessment studies involved manual scoring mainly by the experts in this field. It is subjective and has low timeliness. Therefore, this paper proposes an automatic evaluation framework of EID quality based on text mining (TM), including the EID index system’s construction, automatic scoring of environmental information disclosure quality, and EID index calculation. Furthermore, based on the EID of 801 listed companies in China’s heavy pollution industry from 2013 to 2017, case studies are conducted. The case study results show that the overall quality of the EID of listed companies in China’s heavily polluting industries is low, and there is a gap differentiation between the 16 industries. Compared with the subjective manual scoring method, TM evaluation can evaluate the quality of EID more effectively and accurately. It has great potential and can become an essential tool for the sustainable development of society and listed companies.

1. Introduction

Sustainable development is a balance between economic growth, environmental issues, and social conditions [1]. Mainly promoted by enterprises and the local government [2]. With the rapid development of the global economy, environmental information disclosure (EID) has aroused widespread concern and promoted the environment’s sustainable development [3].
According to the industry-driven growth model, the continuous energy consumption of manufacturing and infrastructure investment negatively impacts the environment [4]. Environmental information disclosure (EID) is an efficient method for promoting the standardization of corporate ecological behavior and a fundamental approach for all social sectors to understand and evaluate corporate environmental behavior [5]. To our knowledge, EID is the third environmental regulatory mode, excluding command and control and market-based environmental regulation [6]. The role of EID in environmental protection has received increased attention across several disciplines in recent years [7]. Therefore, corporate EID quality significantly affects government policymaking and public behavior [8].
Additionally, the quality of corporate EID can affect enterprises’ performance in the capital market and their value by changing their social image [9]. EID from enterprises is an efficient and vital method of informing the public. It can allow more people to understand the environmental behavior and sustainable development of enterprises [10]. By reviewing the environmental information from enterprises, the governmental environmental protection departments can better understand the overall situation of their environmental performance and assess their environmental contribution [11]. Evaluating the quality of environmental information disclosure can also allow the public and investors to determine which enterprises should be invested [12].
There are many methods for evaluating the quality of EID. Previous studies explored content analysis, expert opinion [13], qualitative disclosure [14], and quantitative disclosure methods [15]. The index proposed by Clarkson et al., has been used as an evaluation benchmark in assessing the quality of corporate EID [16]. However, the recent increase in the number of listed companies has increased the amount of information they have disclosed, leading to an upsurge in the EID evaluating workload [17]. The rationality and reliability of traditional analysis methods are continuously challenged due to their working time and cost. Therefore, it is difficult for the results to objectively reflect the quality of corporate EID and disclosure motivation [18]. Evaluating the quality of EID from a listed company is objectively and efficiently challenging [19].
With the rapid development of artificial intelligence, text information mining has successfully been applied in text analysis, improving the measurement accuracy of existing indicators and measuring the disclosure of text content more accurately and comprehensively [20]. To our best knowledge, few previous studies have used text mining (TM) to obtain relevant enterprise EID quality assessment and comprehensive evaluation information based on reports from listed companies. This study proposes an automatic EID quality evaluation framework based on the TM technique, and a flow chart of the analysis procedure is provided in Figure 1.
The proposed framework involves constructing an EID index system, automatically scoring the quality of EID, calculating the EID index. We collected EID Report text information from 801 listed companies in China’s heavily polluting industries from 2013 to 2017. We are using the K-means clustering based on the LDA topic model to mine helpful text information to enrich the EID quality evaluation method.
This paper’s remainder is structured as follows: Section 2 provides an overview of related research. Section 3 constructs the evaluation index system for the enterprise EID. The quality scoring of the EID, based on the TM technique, is conducted. In Section 4, we present an empirical case study of 801 listed companies in heavily polluting industries, whose environmental data were taken from, among others, the Shanghai and Shenzhen stock markets from 2013 to 2017. Finally, Section 5 presents the research conclusions and proposes future work.

2. Literature Review
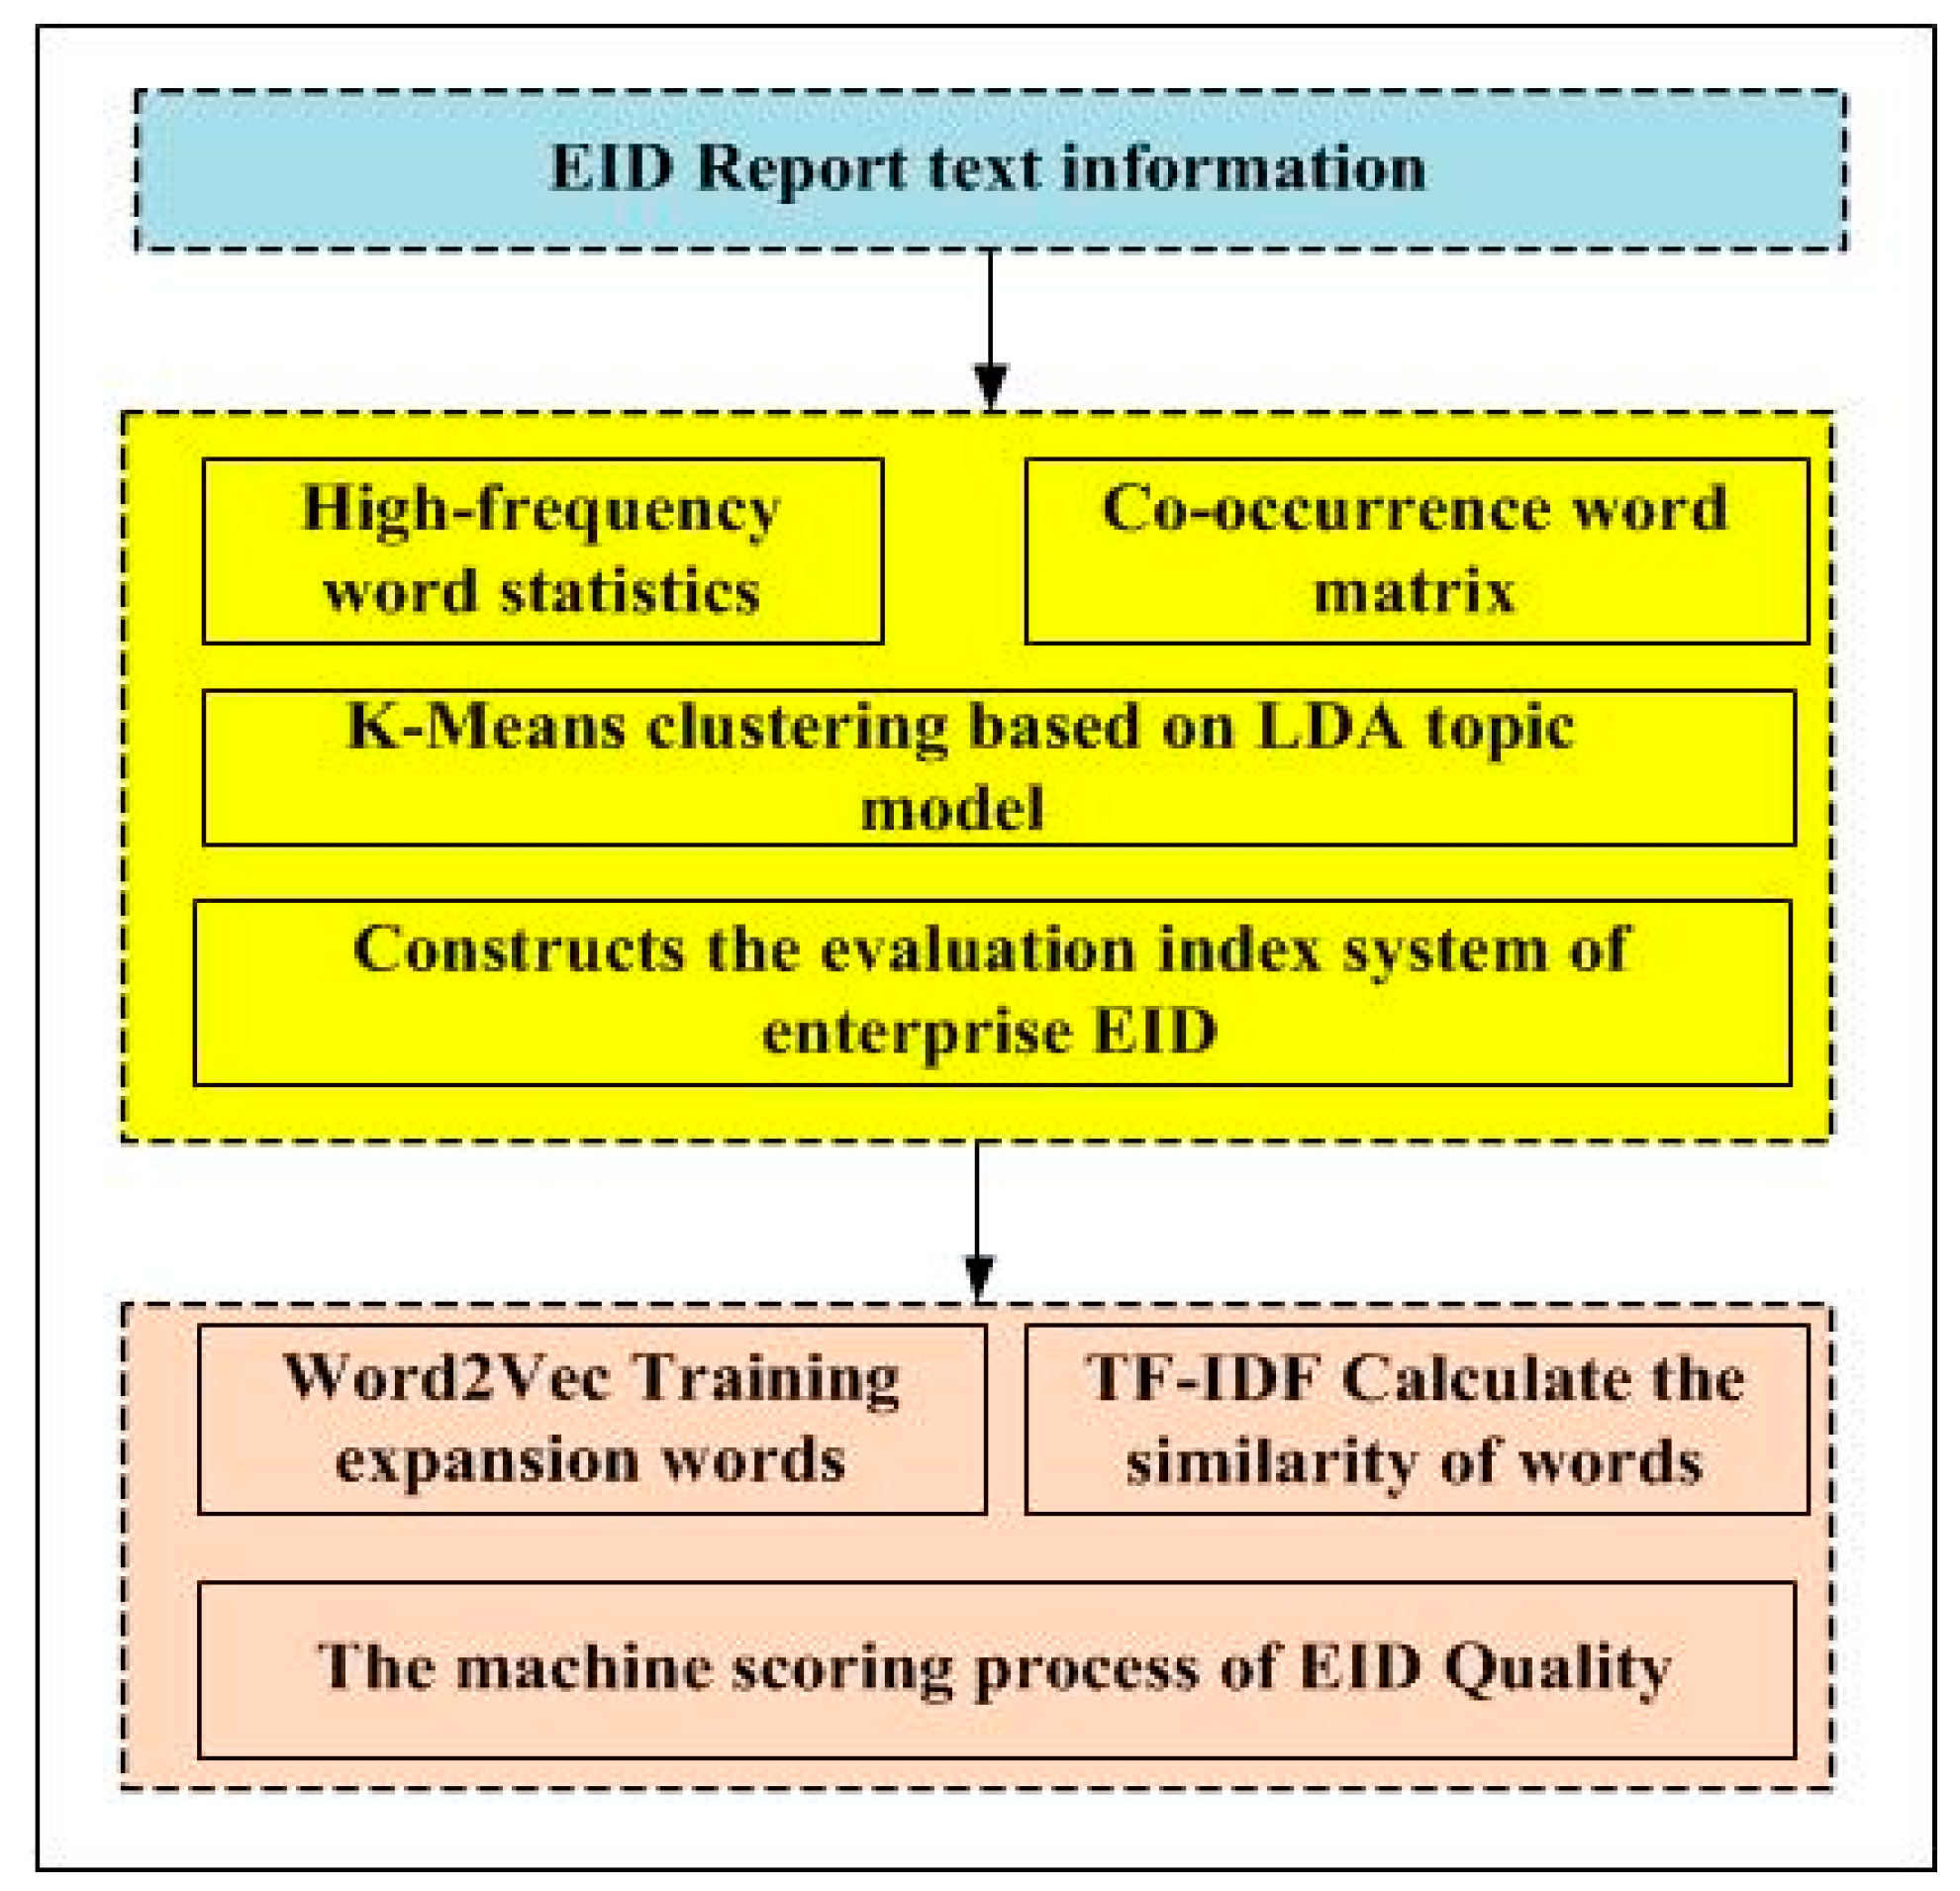
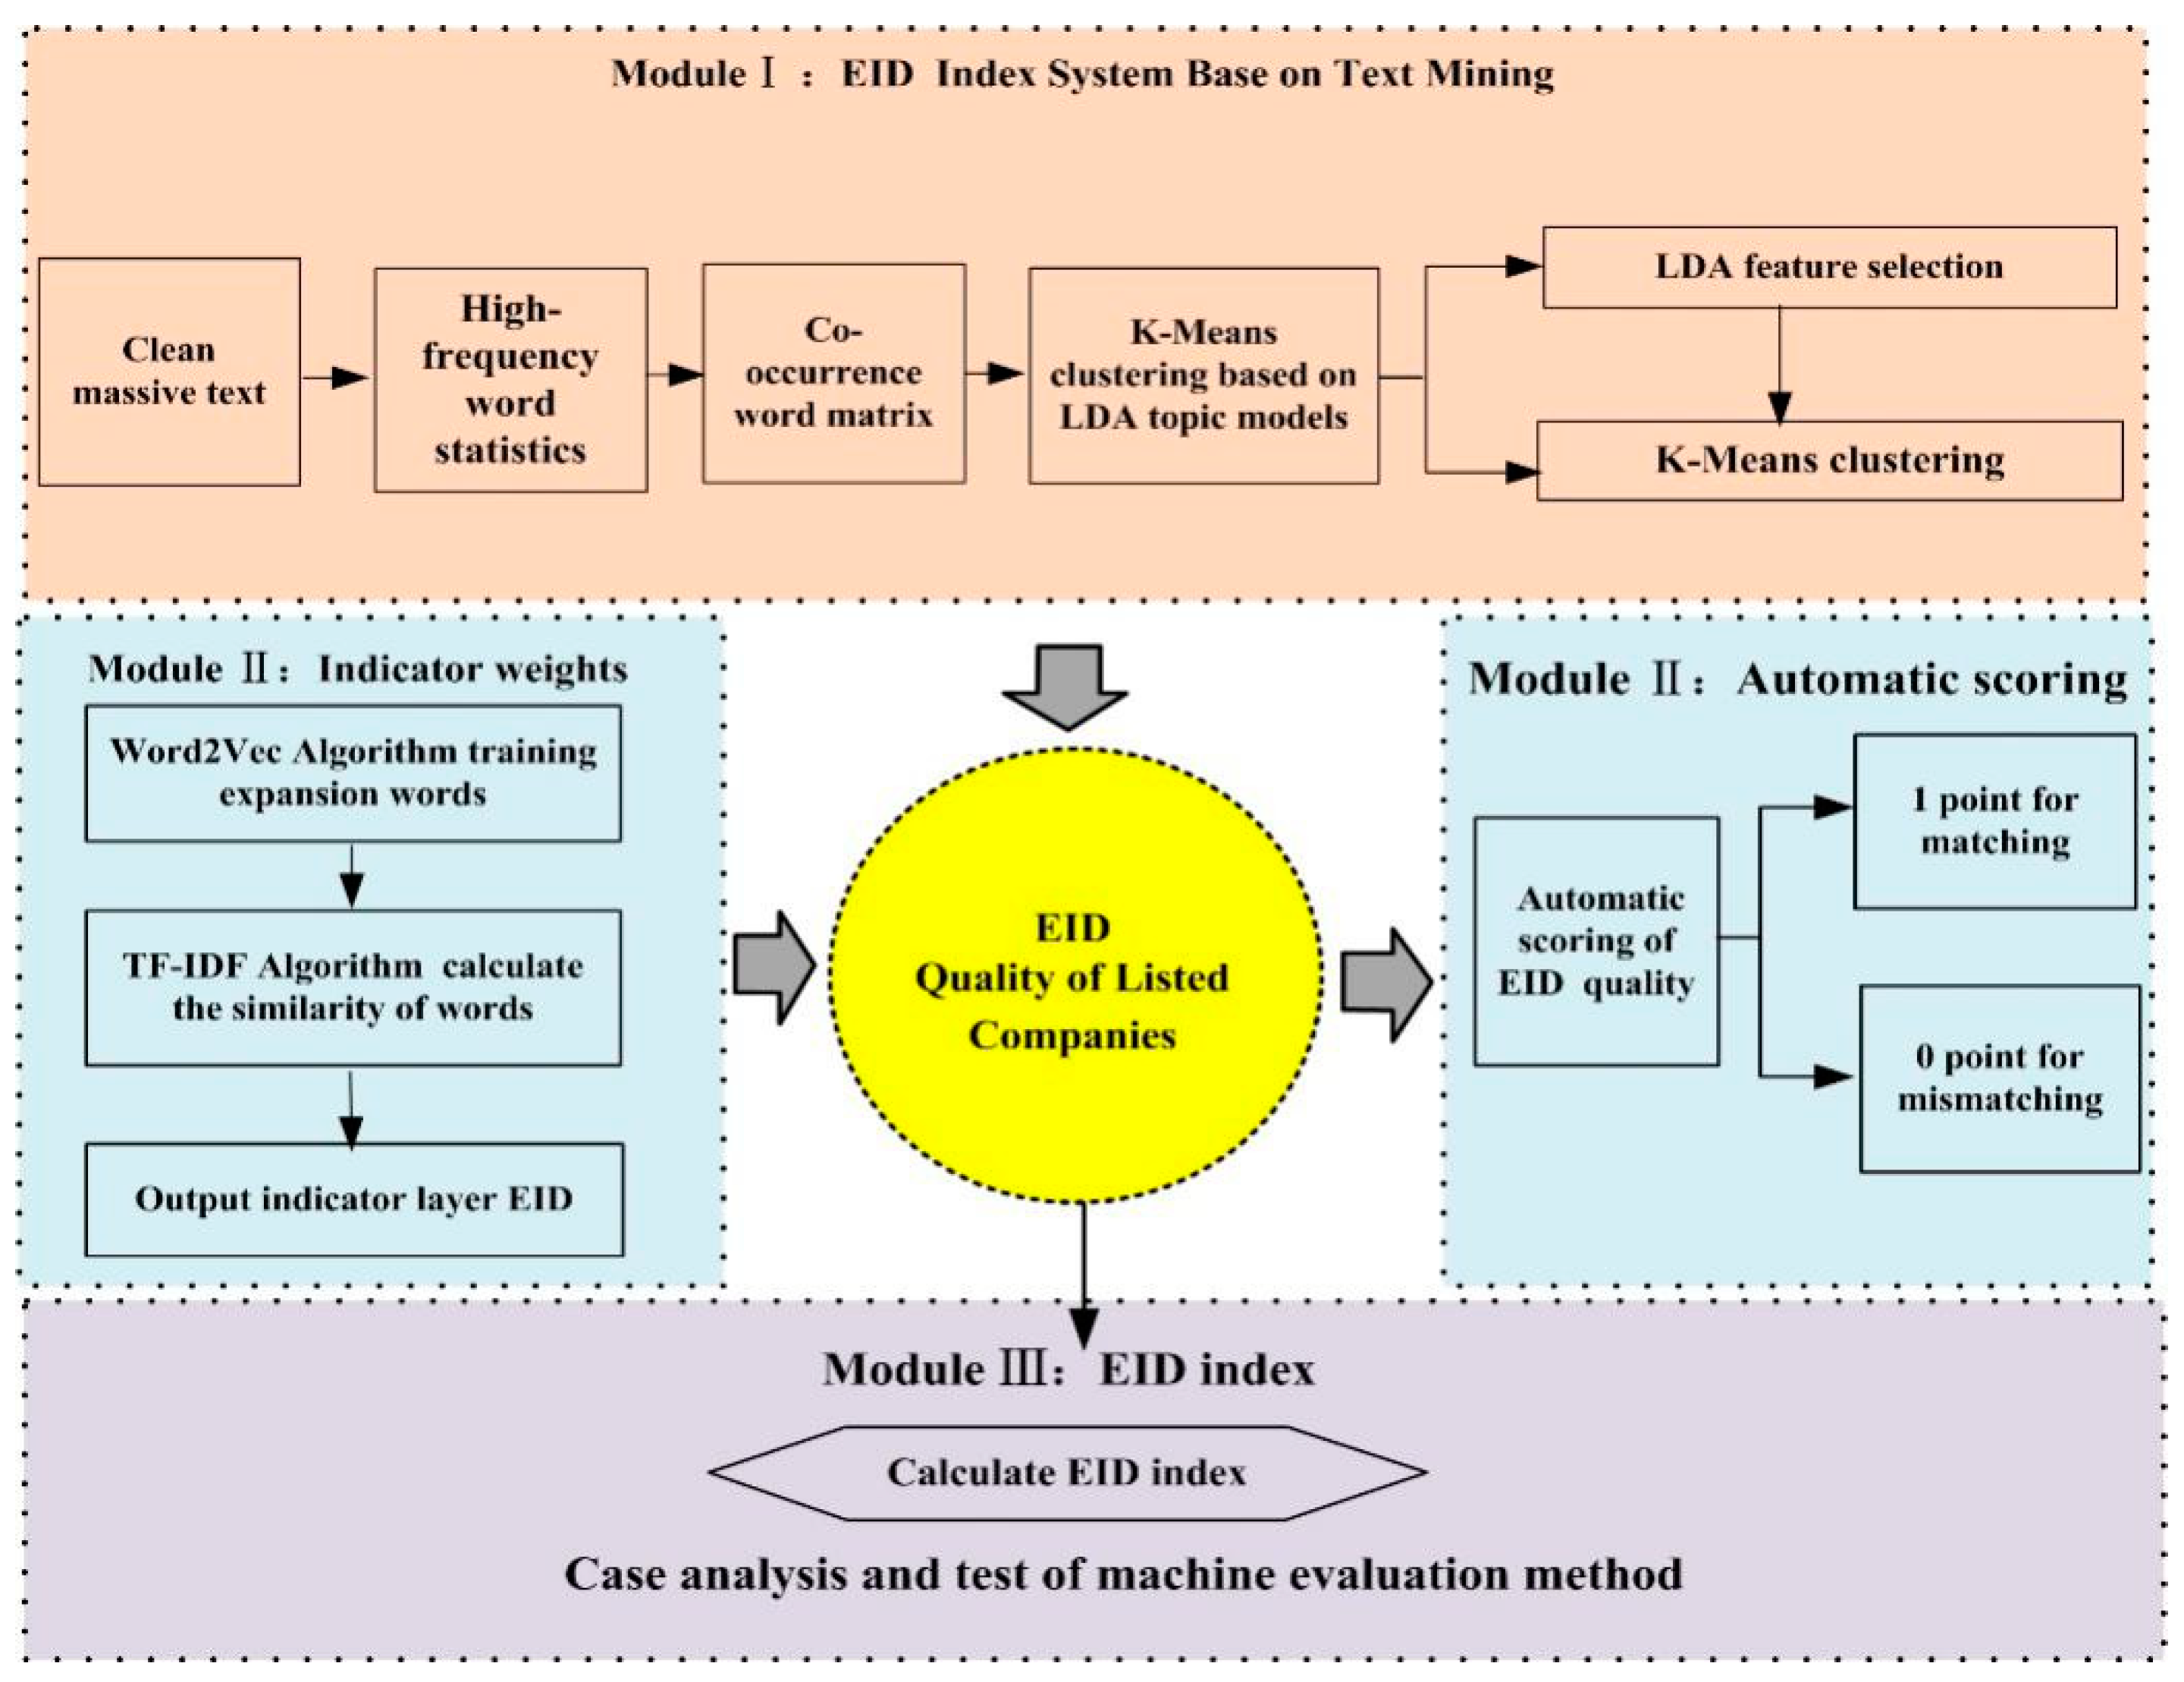
Sustainability is emerging as an important issue for firms in recent years. EID from listed companies is an essential reference for assessing their environmental protection commitment. Content analysis is the most common methodology used in EID index system studies to analyze economic, social, and environmental details. In 1982, Wiseman et al., added financial indicators of the environmental accounting content to the EDI index system. Many scholars have accepted this index since its development used the economic quantitative information method to develop the EID index system as a supplement to the previous procedure [21]. As global environmental issues have attracted more attention, AI-Tuwaijri et al., introduced environmental regulatory factors to the EID index system [22,23]. According to the literature, scholars have shifted focus on environmental improvement. In this stage, the EID index was mainly divided into qualitative and quantitative. Villiers and Staden added qualitative content to the index [24], and Cho and Patten divided the EID indicators into financial and non-financial indicators for analysis [25].
With the promulgation of the “Sustainable Development Report” (GRI), the quality and quantity of corporate EID must be comprehensively measured. Thus, the EID index system has become more comprehensive and has been adopted by scholars. Halme and Huse used an index of 0–1 to assign the corporate EID status. Neu et al., and Patten used words, sentences, and EID length to calculate the index and quantitative index scoring [26,27]. Aerts assigned different weights and scores to other information items based on their quality in the Corporate Environmental Disclosure Report [28]. Hasseldine combined the quality and quantity index scores to study corporate EID and environmental reputation [29]. Beck et al. proposed measuring the environmental disclosure index consisting of coverage, quality, and quantity [30]. Rupley et al. used a more complex index scoring approach to evaluate the relationship between corporate governance, media, and EID [31].
However, the existing absence of a regulatory framework for the EID’s substance has culminated in a largely subjective disclosure, and the standard has been inconsistent. At present, there is no formal documentation on the quality assessment of EID, and there is no standard on the establishment and selection of evaluation indicators and methods. The EID was used as a variable to analyze its influence factors to find a way to enhance EID quality [32]. However, their liability of EID output significantly affects the outcomes of the studies mentioned above. Reinforce oversight and improve the efficiency of EIDs or provide a research base for further research. It is essential to develop a framework of science and realistic evaluations.
However, as Grey and Milne suggested, there is no superior research approach, method, or technique [33]. The most common technique using analyze economic, social, and environmental information is content analysis within business studies. Neuman stated that content analysis is “a technique for gathering and analyzing the content of the text. The content refers to words, meanings, pictures, symbols, ideas, themes or any message that can be communicated” [34]. Content is coded into various categories or concepts depending on selected criteria, and coding can be performed manually or using computer-aided technologies.
Therefore, TM has been widely used in the field of information analysis. Text mining is a computer-assisted technique equipped with the capability to extract information and trends from large amounts of textual data. Feldman and Sanger are giving an overview of the main issues discussed in the reports [35]. It is based on data mining techniques, machine learning, and natural language processing applied to the text. It strongly relies on computer programs and algorithms; thus, it is supposed to overcome the problems associated with content analysis’s reliability [36].
Recently, TM has also been used to analyze trends and patterns in sustainability reports [37] and determine which aspects are the most public in company reports [38].
Yang and Lee proposed a TM method based on organization mapping to extract image semantics from an environmental text [39]. Modapothala and Issac used Bayesian estimation to assess the relationships between ecological and social performance indicators and listed companies [40]. Huang et al., used TM to analyze financial disclosure in analysts’ earnings forecasts [41]. Riffe et al., investigated the negative externalities of corporate emergencies’ widespread media coverage using text analysis [42]. Bonzanini and Marco used Python to capture data from new blogs to analyze public environmental services [43]. Lee et al. studied spatial environmental information environmental trends using quantitative analysis and TM techniques [44], and Maeda et al. used TM to determine which managerial regulations could serve as incentives to motivate enterprises to consider the environment [45]. Irina et al., used text analysis to quantitatively analyze research trends in the environmental field [46]. Park and Kremer studied the classification of ecological sustainability indicators based on a TM approach [47]. Rabiei used TM to elucidate knowledge gaps and priorities in Iranian environmental science [48], while Villeneuve et al. explored indoor environmental quality based on Airbnb customer reviews using TM [49]. Wang et al. assessed the environmental performance in tourist areas and used TM of online news to explore the influencing factors [50].
Although text mining technology is widely used, the current EID index system and research perspective are limited to artificial subjective judgment. Machine learning-related content is rarely used, and there is a lack of research that has used text similarity, text clustering, and semantic text analysis to evaluate EID. Therefore, it is difficult for the study results on corporate EID to fully reflect quality and disclosure motivation. Although some researchers have used TM techniques for environmental information quality assessment, there is much room for refinement. Therefore, in this study, we attempted to construct a comprehensive EID evaluation system based on TM techniques and employed machine scoring to improve the listed companies’ EID quality.

3. Methodology

The methodology for this study involved three stages. The first stage consisted of the automatic EID quality evaluation framework, including constructing the EID index system. The second stage consisted of the putout indicator weight and automated scoring of EID quality. Finally, the calculation of the EID index is conducted; the framework is presented in Figure 2.

3.1. Chinese Text Mining Preprocessing Primary Steps

3.1.1. Data Collection

Before text mining, we need to obtain the text data of listed companies’ environmental information disclosure in the heavy pollution industry. The Chinese text data acquisition method uses crawler code to crawl the environmental information disclosure text data.

3.1.2. Handling Chinese Encoding Issues

Python does not support Unicode processing. We need to follow Python’s principle for Chinese text preprocessing to use utf-8 to store data and use Chinese encoding such as GBK.

3.1.3. Chinese Word Separation

There are many commonly used Chinese word splitting software. This study uses JIEBA word splitting. For example, “pip install Jieba” based on Python can be completed.

3.1.4. Introduction of Stop Words

There are many invalid words in Chinese text, and some punctuation marks that we do not want to introduce in Chinese text analysis need to be removed; therefore, these words are deactivated.

3.2. EID Quality System Construction

The purpose of assessing EID quality is to determine the listed companies’ reliability, comprehensiveness, and legal and regulatory compliance. This study used the K-means clustering based on the LDA topic model algorithm to construct the EID index system for mining objective evaluation information through EID topic clustering analysis.
A flowchart of the construction of the EID index system is presented in Figure 3.
We accessed the EID text data through crawling and keyword searching. Following the text preprocessing stage, text preprocessing methods, including manual screening, text segmentation, and removing “stop word,” were used. The co-occurrence word matrix was then obtained based on the high-frequency words. Finally, we used the K-means clustering based on the LDA topic model algorithm to cluster the EID topics based on the co-occurrence word matrix and processing steps.
Prihatini et al. used K-means clustering through LDA based on this similarity matrix and finally found good clustering results for this method [51]. Alhawarat et al., clustered the Arabic collection by combining the LDA topic model and K-means clustering [52]. The results confirmed that this method could significantly improve the quality of clustering. Bui et al., found that combining the LDA topic model and K-means clustering worked well for clustering [53]. In summary, there have been numerous studies showing that K-means clustering based on LDA topic models is better than traditional K-means clustering methods. Therefore, this paper uses the K-means clustering method based on the LDA topic model to improve the text mining of samples and obtain a more accurate topic hierarchical classification.
The LDA topic model is used to obtain a complete analysis of text collections and achieves better text mining results; the more significant the amount of text collection is, the larger the topics. LDA-based topic evolution analysis involves evaluating the model’s generalization ability to measure the model’s predictive power for unobserved data. We use the accepted metric of perplexity to measure the generalization ability of the model. Therefore, the smaller the perplexity is, the better the model generalization ability. Therefore, when the number of topics varies, the perplexity of the model also varies. The optimal number of topics can be determined by calculating the model’s perplexity with different topics. The formula is shown in Equation (1) as follows:
perplexity ( D ) = exp d = 1 D log 2 p ( w d ) d = 1 D N d
where Nd denotes the number of feature words of the D, and p(wd) is the probability of generating a document, which is calculated in Equation (2) as follows:
p ( w d ) = i k p ( z i | d ) p ( w | z i )
where P(zi|d) denotes the i topic’s probability in the d text, and P(w|zi) denotes the probability of distributing the word of the distribution probability of the sink w.

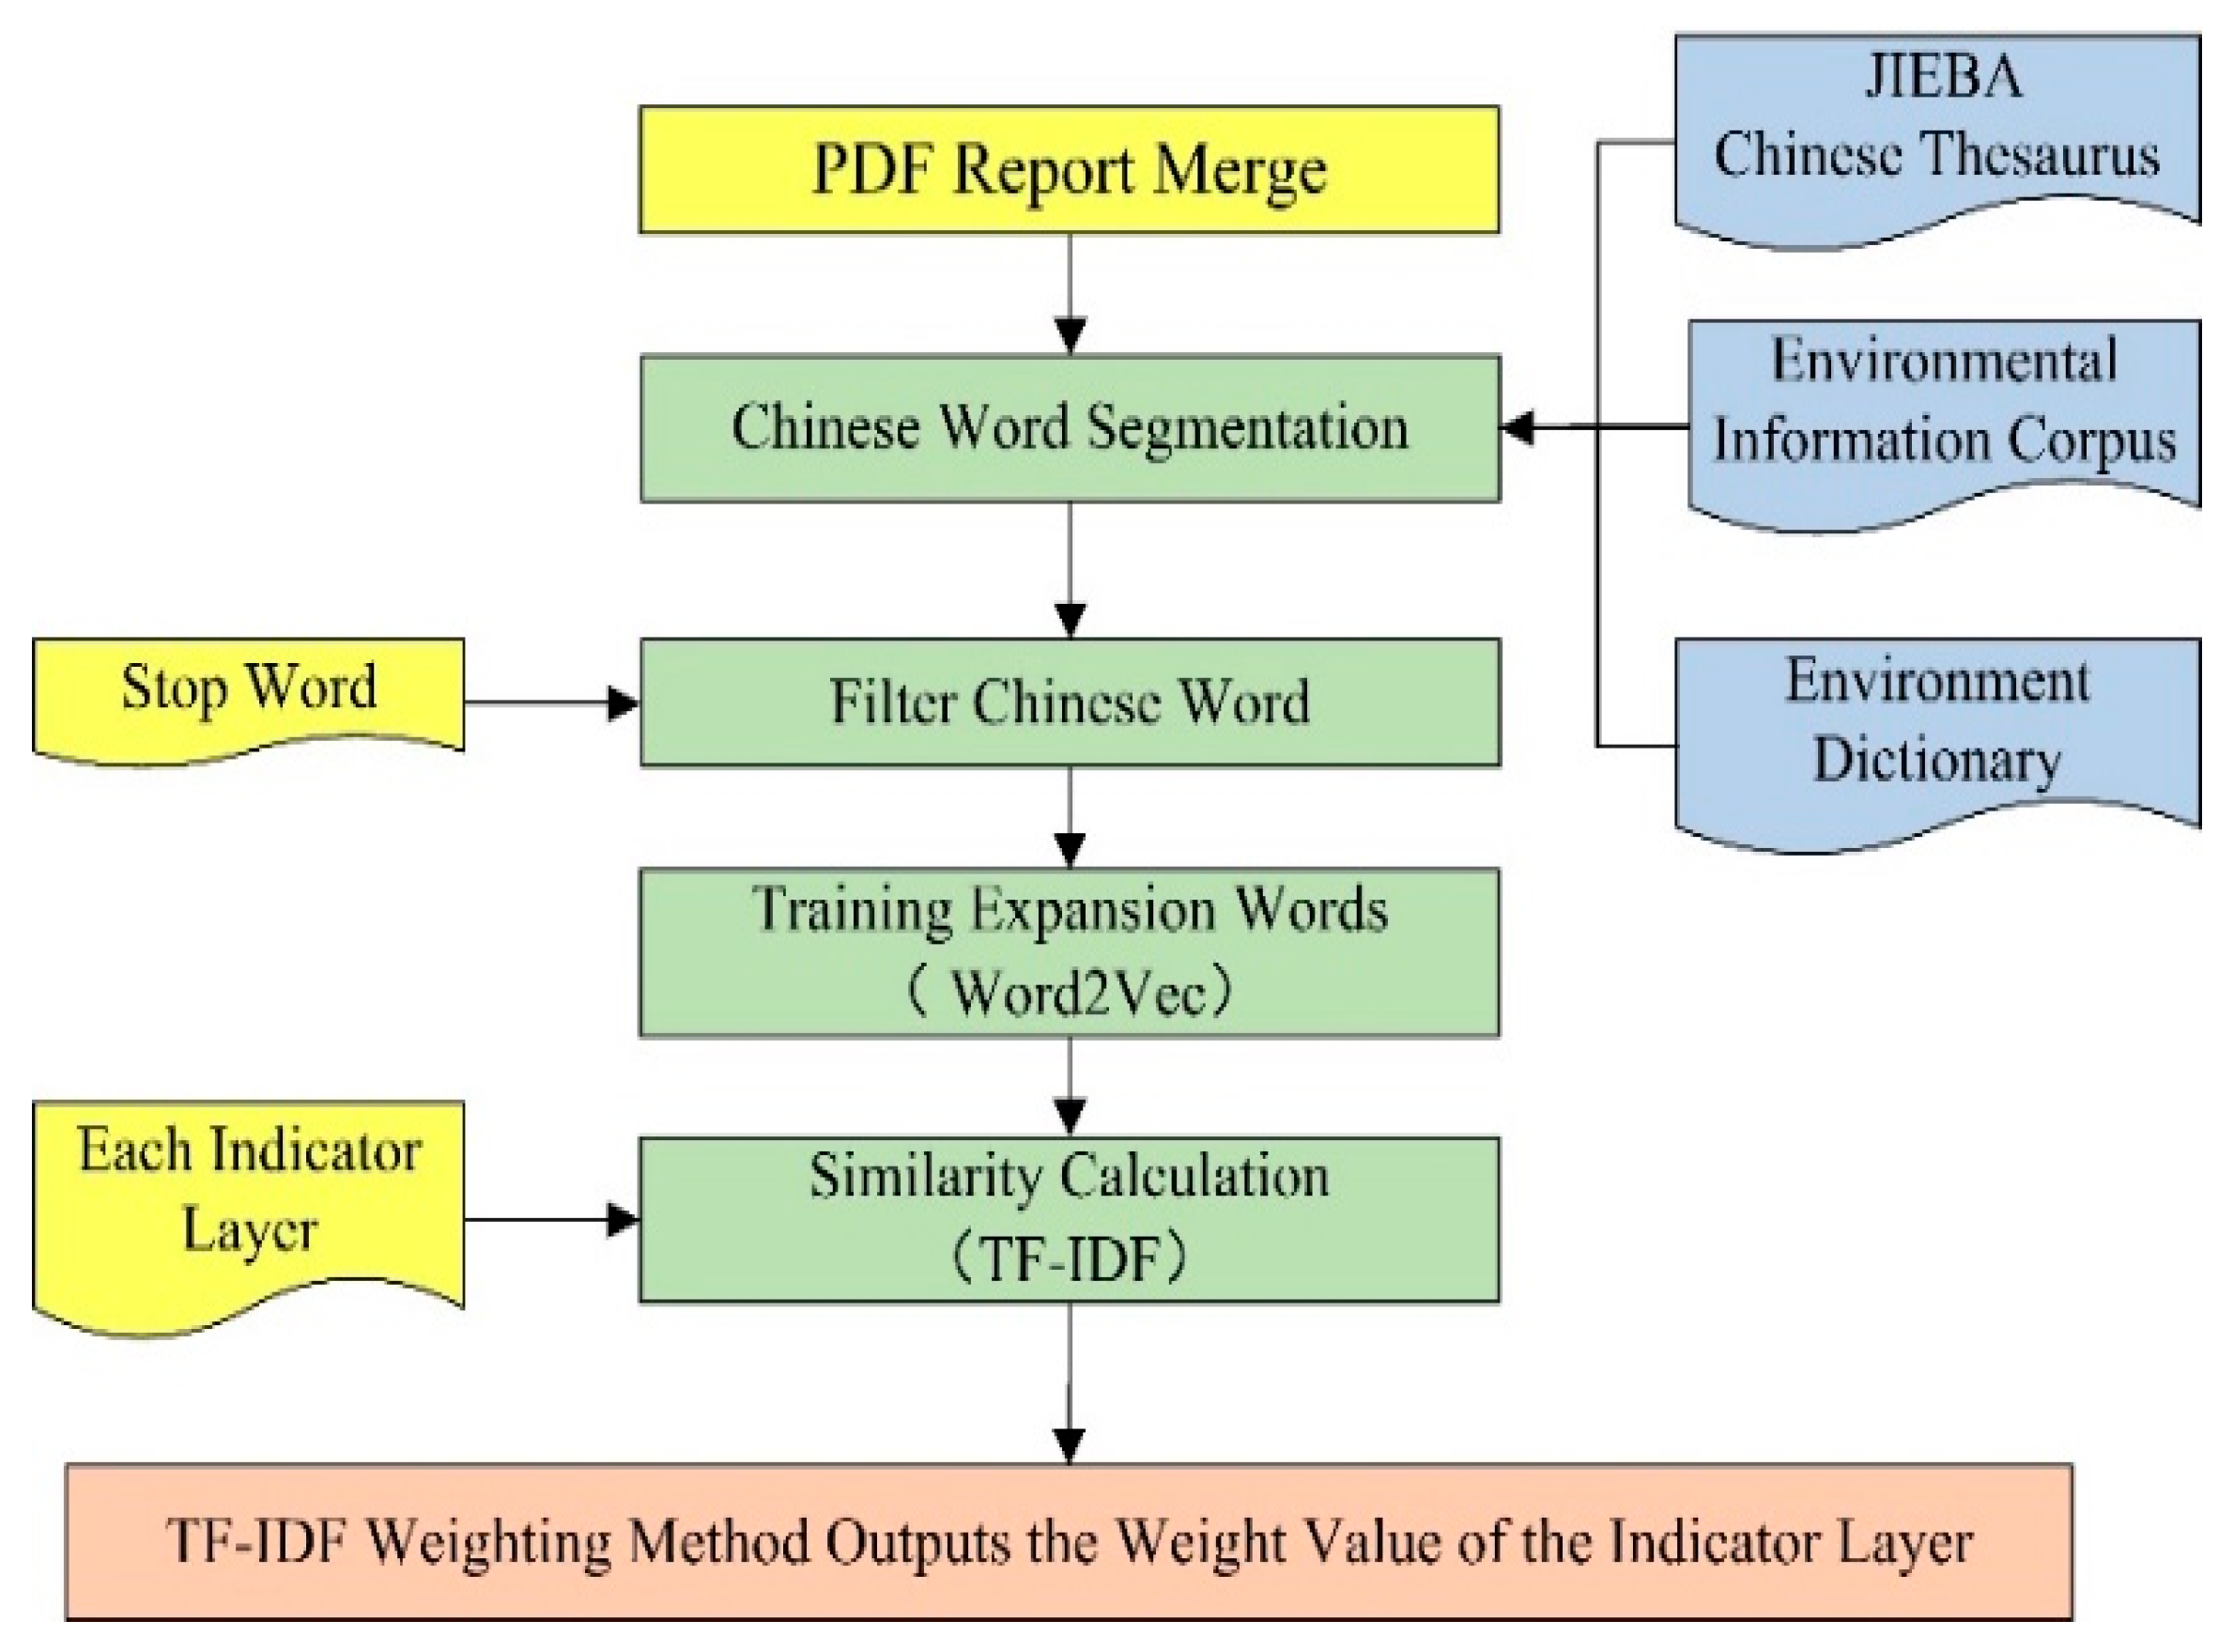
3.3. EID Index Layer Weight Calculation

The EID index calculation was based on the EID index system and consisted of keyword expansion and word similarity calculation. We first used the EID system (essential seed word list) and EID corpus to obtain an extended word table based on the Word2Vec model. The text similarity of symbolic words was then calculated using the term frequency-inverse document frequency. The TF–IDF weight method is the most widely used weight calculation method in text processing [54]. TF–IDF model and the computed text similarity gave the weight of each EID index layer.

3.3.1. Keyword Expansion

We obtained the critical seed word list for keyword expansion based on the EID evaluation index system. We combined it with the EID corpus to obtain a hybrid corpus. We then used the Word2Vec model to train extended words and obtained a comprehensive wordlist based on the hybrid corpus. The Word2Vec model was prepared as follows:
First, we converted the training data into the format of the Word2Vec model. In our work, we first input large-scale text corpus to Word2Vec to produce word vectors. Using the structure of the Word2Vec, we can train and expand more exclusive vocabulary in the field of environmental information.
Second, the skip-gram algorithm expanded crucial seed words based on the complete corpus’ environmental information. Through feeding the text corpus into one learning model, Word2Vec finally generates the word vectors. Word2Vec is not a single algorithm, but it includes two learning models—the continuous bag of words (CBOW) and skip-gram [55]. The skip-gram model’s training objective is to find word representations helpful in predicting the surrounding words in a sentence or a document. Skip-gram indicates the context given the word [56]. The vectors of all expanded words were obtained as the output after completing the training. Finally, the first 15 expanded words in each index layer and closest key seed word vector were selected according to the EID index system to form an expanded vocabulary.

3.3.2. Extended Word Similarity Calculation Based on the TF–IDF Model

The TF–IDF model is a keyword extraction method based on the word bag algorithm, widely used in TM to evaluate the word’s importance to the text (Figure 4).
TF–IDF is used to choose an optimum indexing vocabulary for a collection of documents. Typical evaluation results are shown demonstrating the usefulness of the model [57]. The TF–IDF model is a keyword extraction method based on the word bag algorithm. It is widely used in TM to evaluate its importance to the text [58]. This study used the TF–IDF model to extract keywords from the studied text [59]. The similarity of expansion words was then calculated according to the TF–IDF model and the weight of each index layer was obtained [60].

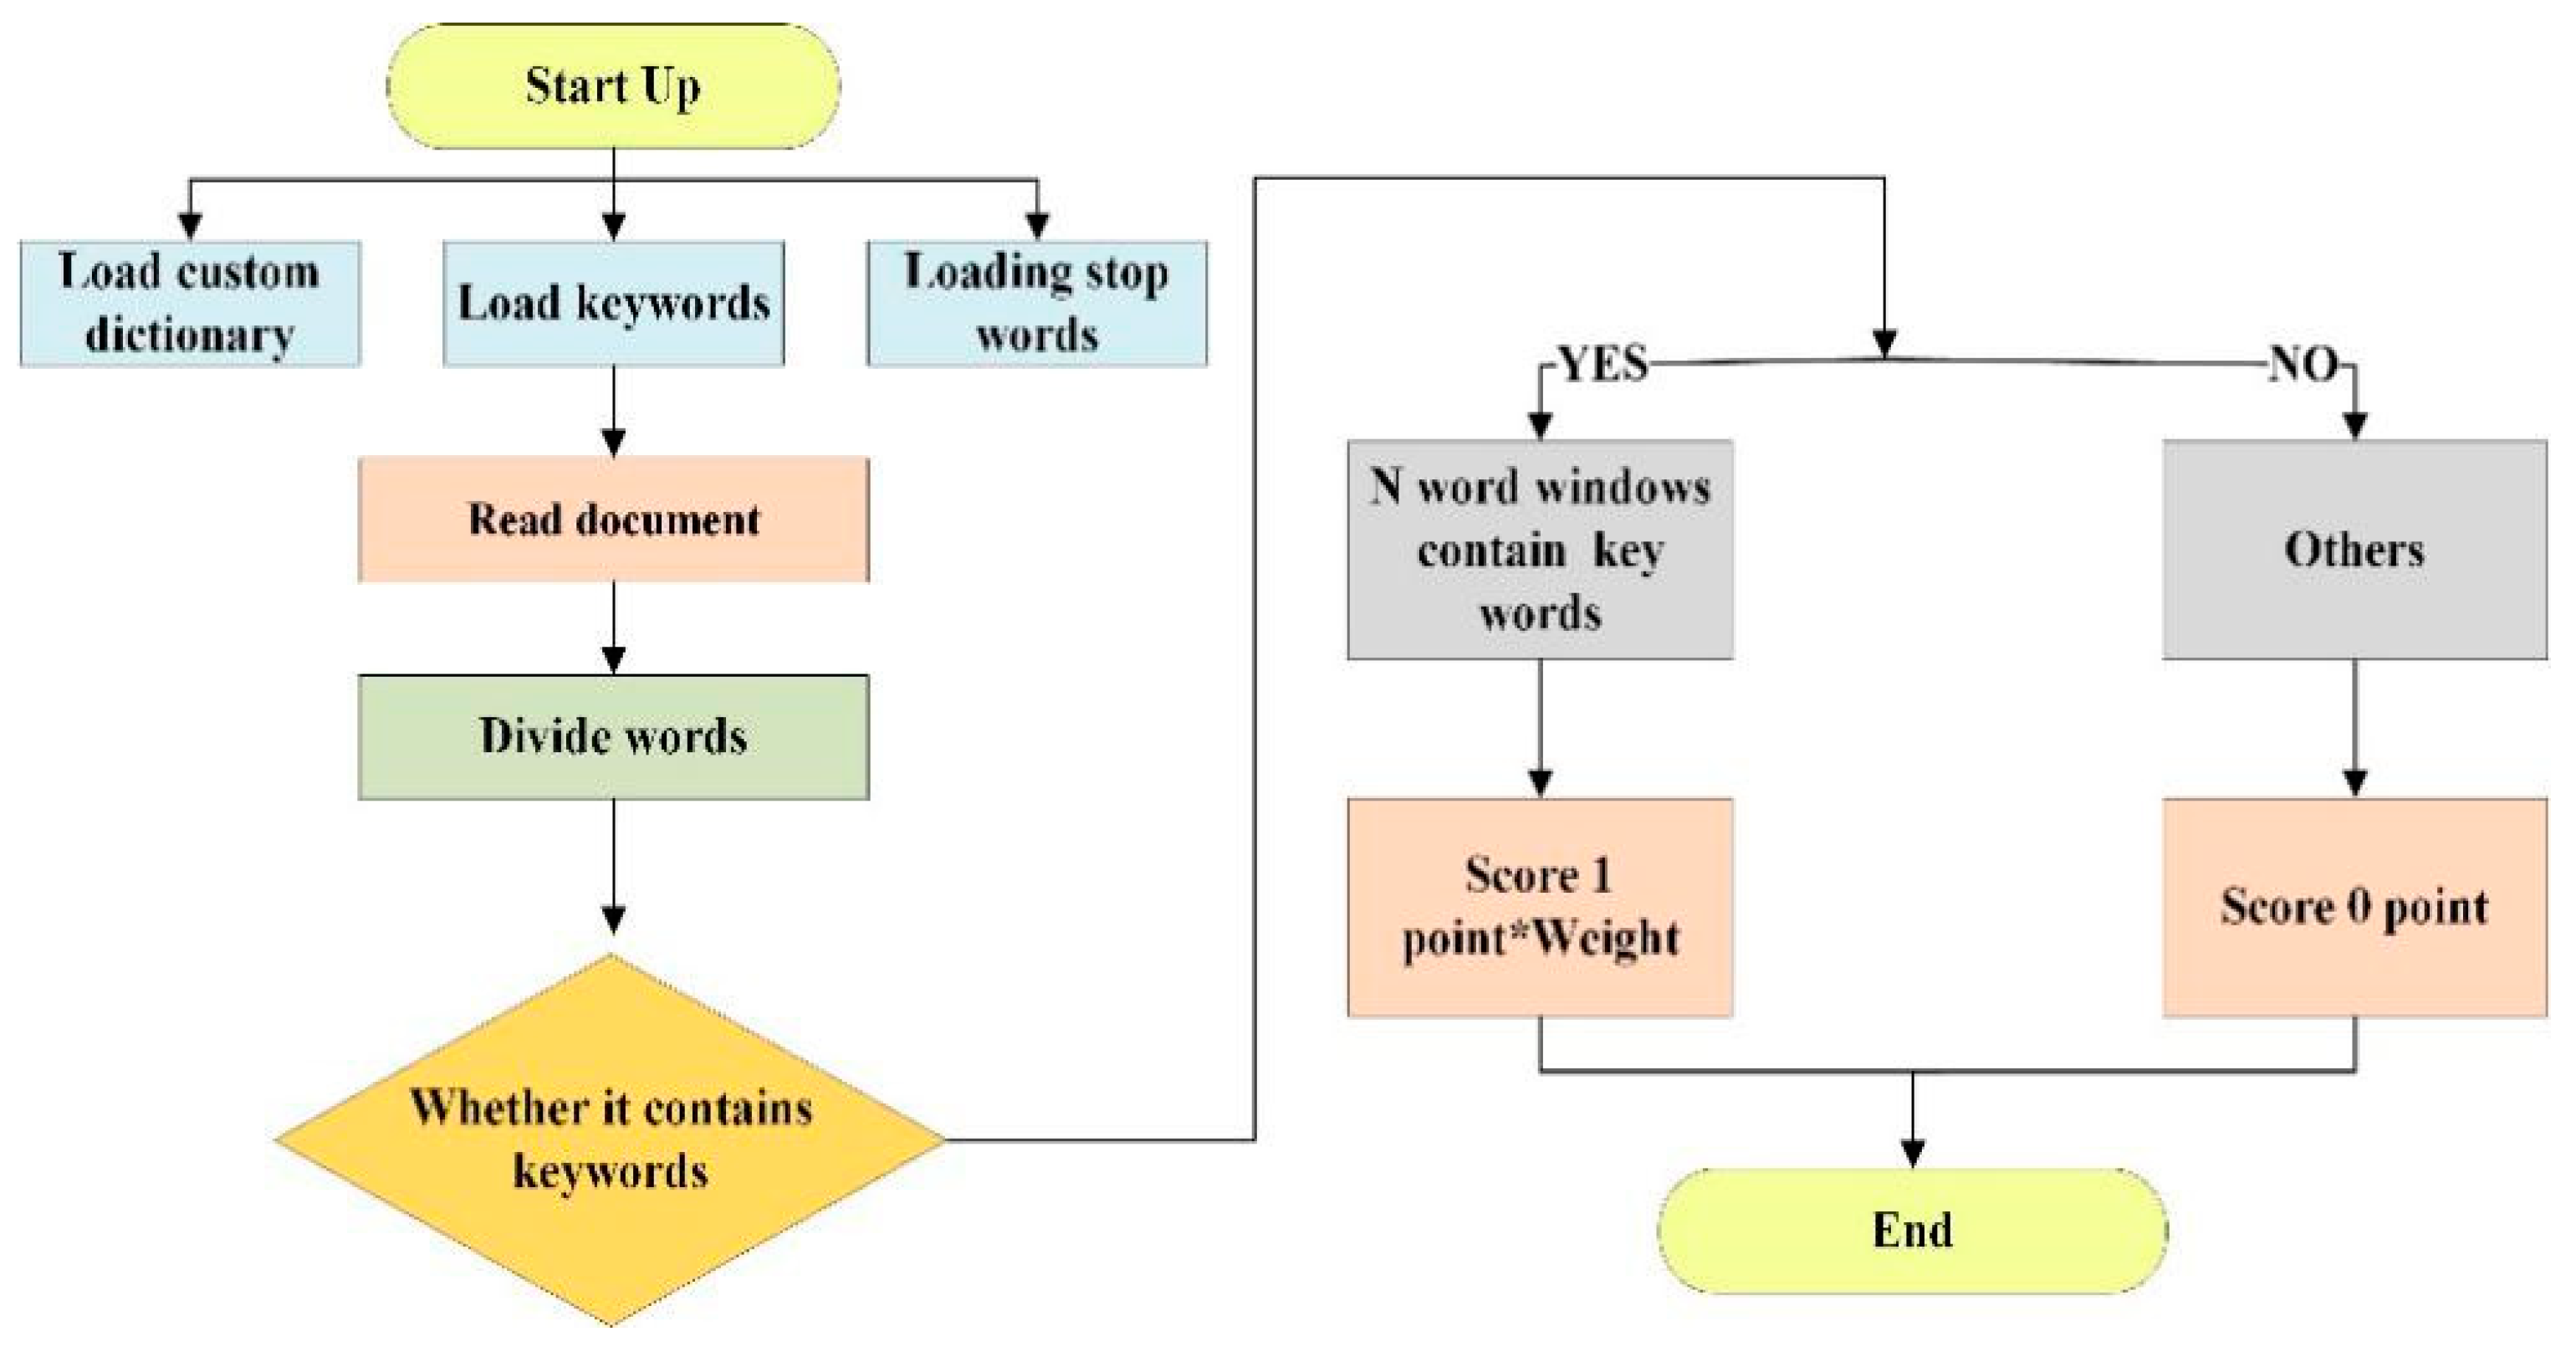
3.4. Automatic Scoring of EID Quality

In this study, Python was used to read the text. The companies EID index system evaluation criteria were loaded into the operating system. Therefore, the model was read, and the corresponding string input in the system was obtained. Platform plurality was also used to train the word vectors and obtain an expanded corpus of EID. We used Python packages in the text mining process, e.g., Wordcount, Jieba, and Gensim collections, to clean and filter these reports, extract content related to environmental information, and form sample files after multiple rounds of compounding. Further, we performed text preprocessing, word segmentation, word frequency statistics operations on the sample files and used Gensim of the word2vec model to train word vectors.
Interactive technology was used to observe the expansion of the keyword language.
There have been various previous works on keyword extraction, primarily on different text domains. The TF–IDF-based selection has been widely used. It is computationally efficient and performs reasonably well [61]. Keyword extraction has also been treated as a supervised learning problem. A classifier is used to classify candidate words into positive or negative instances using a set of features [62]. The Word2Vec model was used to improve the corpus’ ability regarding semantics and semantic recognition for context.
Finally, the core process of the EID quality scoring system was discussed. It searched for keywords or keyword combinations in the company’s environmental information disclosure report. Additionally, calculated the window in variety with the weight value of the EID index system and then evaluated and scored the EID quality of the listed companies during the scoring process, as shown in Figure 5.
The EID quality index was calculated based on the variable setting method and EID index system. The parameter values were binary and set to 0 or 1 [63]. We supposed a keyword with a corresponding meaning appeared in the vocabulary window of the text of EID. Specifically, if there were content consistent with the sub variable in the text for environmental information, this sub variable parameter would be “1”; otherwise, it would be “0.” An EID scoring was constructed, as shown in Equations (3)–(6).
Firstly, we put the main variables and sub-variables into the EID index system table.
Secondly, we tabulated the sub-variable sub-variable from the same main variable through text mining and Equations (3) and (4).
X N [ 0 , 1 ]
X =   X R : 0 1
Thirdly, calculating the EDI score of the environmental information disclosure quality to be evaluated by Equations (5) and (6), equal to the sum of all main variables.
X i j = 1 n X i j T ( X i j )   ( i = 1 , 2 , 3 , 4 , 5 m )
EID = [ X 1 ( j = 1 7 x 1 j 7 ) + X 2 ( j = 1 1 x 2 j ) + X 3 ( j = 1 5 x 3 j 5 ) + X 4 ( j = 1 2 x 4 j 2 ) + X 5 ( j = 1 3 x 5 j 3 ) + X 6 ( j = 1 1 x 6 j 1 ) + X 7 ( j = 1 1 x 7 j ) + X 8 ( j = 1 1 x 8 j ) + X 9 ( j = 1 3 x 9 j 3 ) ]
The EID quality was calculated based on the variable setting method and the EID index system, where “i” is the main variable, i = 1,2,3,⋯,m; and j is the sub variable, j = 1, 2,⋯,n. The number of sub-variables in each main variable is unlimited.
Therefore, the value of the EID score reflects different levels of environmental information disclosure quality consistency. To give the same weight to all sub-variables, it is necessary to use a binary system. The binary system (0,1) helps to maintain a balance among all variables [64]. We supposed a keyword with a corresponding meaning appeared in the vocabulary window of the EID text and verified that the content is consistent with the sub variable in the text.

4. Case Study

4.1. Sample and Data Source

The study focuses on listed firms in heavy pollution industries in China. The government requires mandatory disclosure of environmental information in China’s heavy pollution industries. The study included 801 valid samples from 846 heavy polluting companies in China. The environmental information disclosure text data come from Shanghai Stock Exchange (http://www.sse.com.cn/, accessed on 8 March 2019) and Shenzhen Stock Exchange (http://www.szse.cn/, accessed on 14 June 2019) Juchao Consulting Network (http://www.cninfo.com.cn/new/index, accessed on 18 August 2019), Business Consulting Network (http://www.sytao.com/, accessed on 8 March 2019), RIX (http://www.rkraings.cn/, accessed on 4 November 2019), WIND (https://www.wind.com.cn/, accessed on 4 November 2019), and CSMR (http://www.gtarsc.com, accessed on 4 November 2019). According to the environmental industry classification management list (circular letter 2008 No. 373) issued by China in 2008, the 16 types of heavily polluting industry codes were determined. A-share-listed heavy pollution industry companies from 2013 to 2017 were selected as research subjects. This study text information focused on the environmental information section, including the listed companies’ annual, social responsibility, sustainable development, and environmental protection reports. It contained 4005 annual reports, 1954 corporate social responsibility reports, 282 environmental protection reports, and 204 sustainable reports—a total of 6445 documents.

4.2. EID Index System Construction

4.2.1. Keyword Extraction

In this study, Python and Jieba third-party databases were used for word segmentation and frequency statistics and building a corpus in EID. First, the sample report dataset was cleaned, screened, related to the environmental information content, and extracted as the sample file. It is complete information from the environmental perspective.
Text segmentation, stop word deletion, and word frequency statistics were then conducted on the sample files, and 18,691 high-frequency words in the field of environmental information were obtained. According to the literature [65], the collected glossary was sent to five experts in relevant fields, who judged and scored whether the environmental information was appropriate. After three rounds of screening, the exclusive vocabularies for the area of environmental information were obtained. Finally, using the words were sorted from large to trim based on their frequency, and the top 60 keywords were selected, as shown in Table 1.

4.2.2. Co-occurrence Word Matrix Construction

From the high-frequency words identified above, co-occurrence analysis was conducted to form a co-occurrence word matrix. Only the first 10 high-frequency words are presented in Table 2. The lower-ranked words appear less frequently.

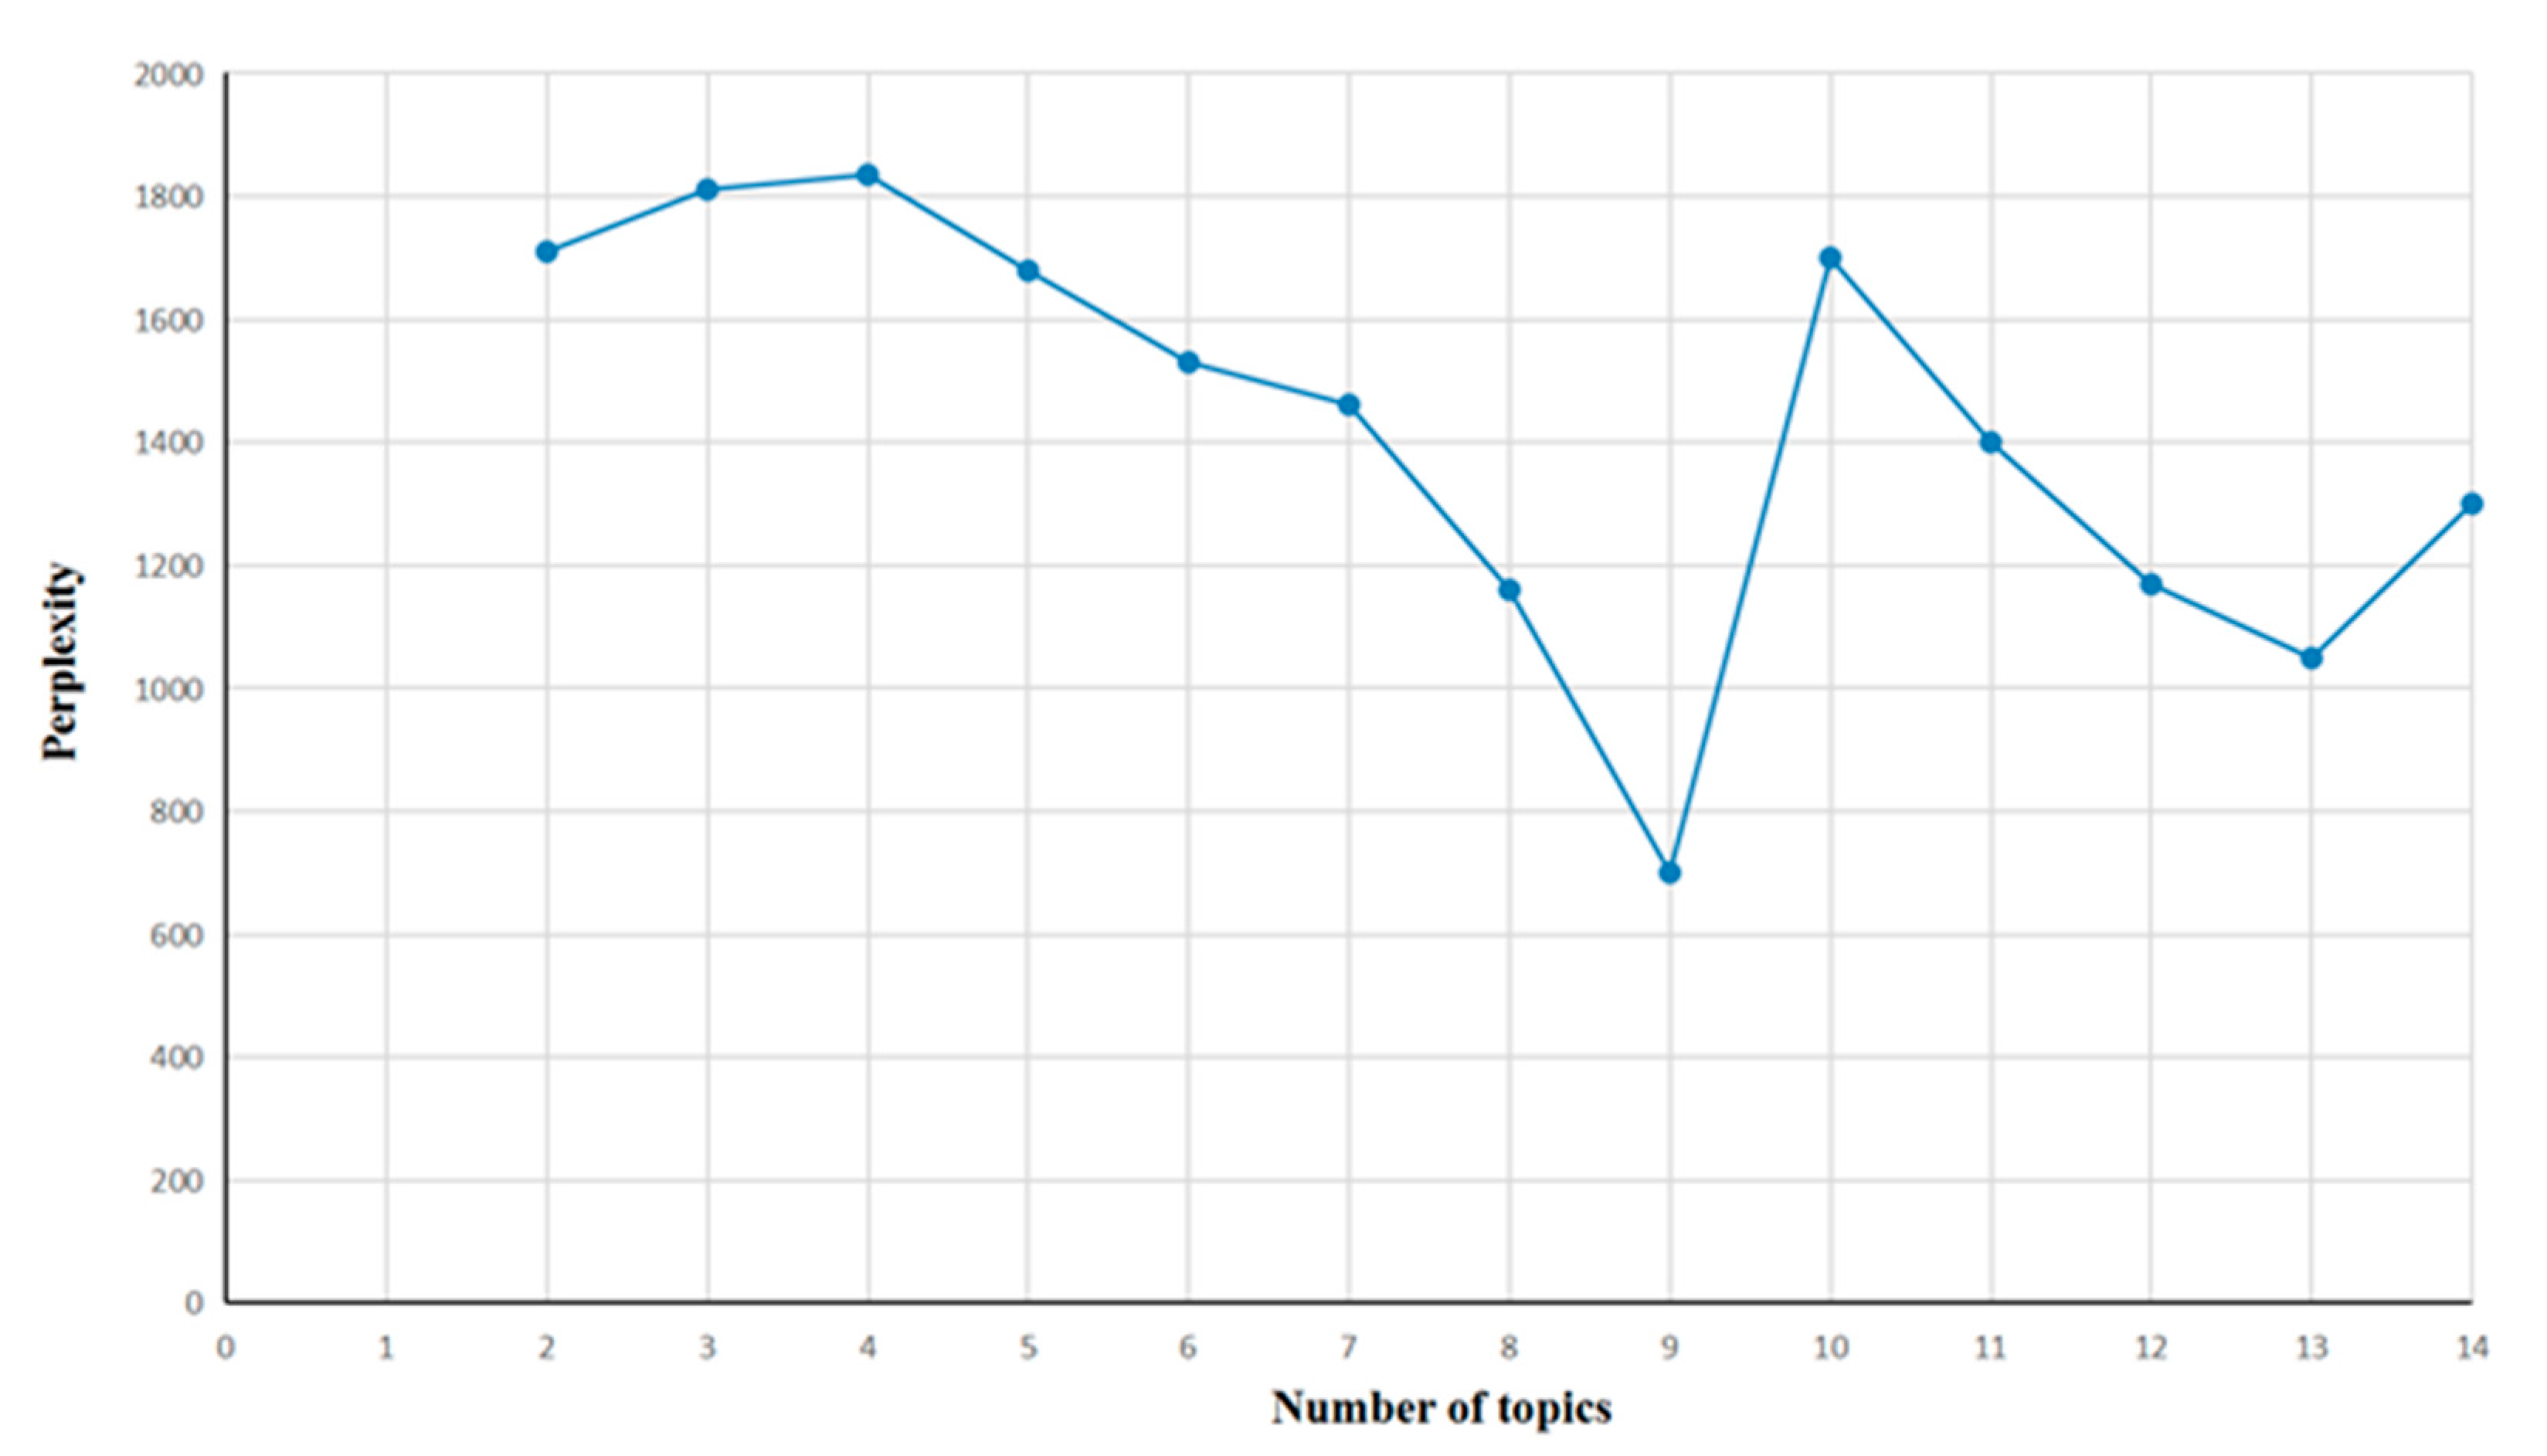
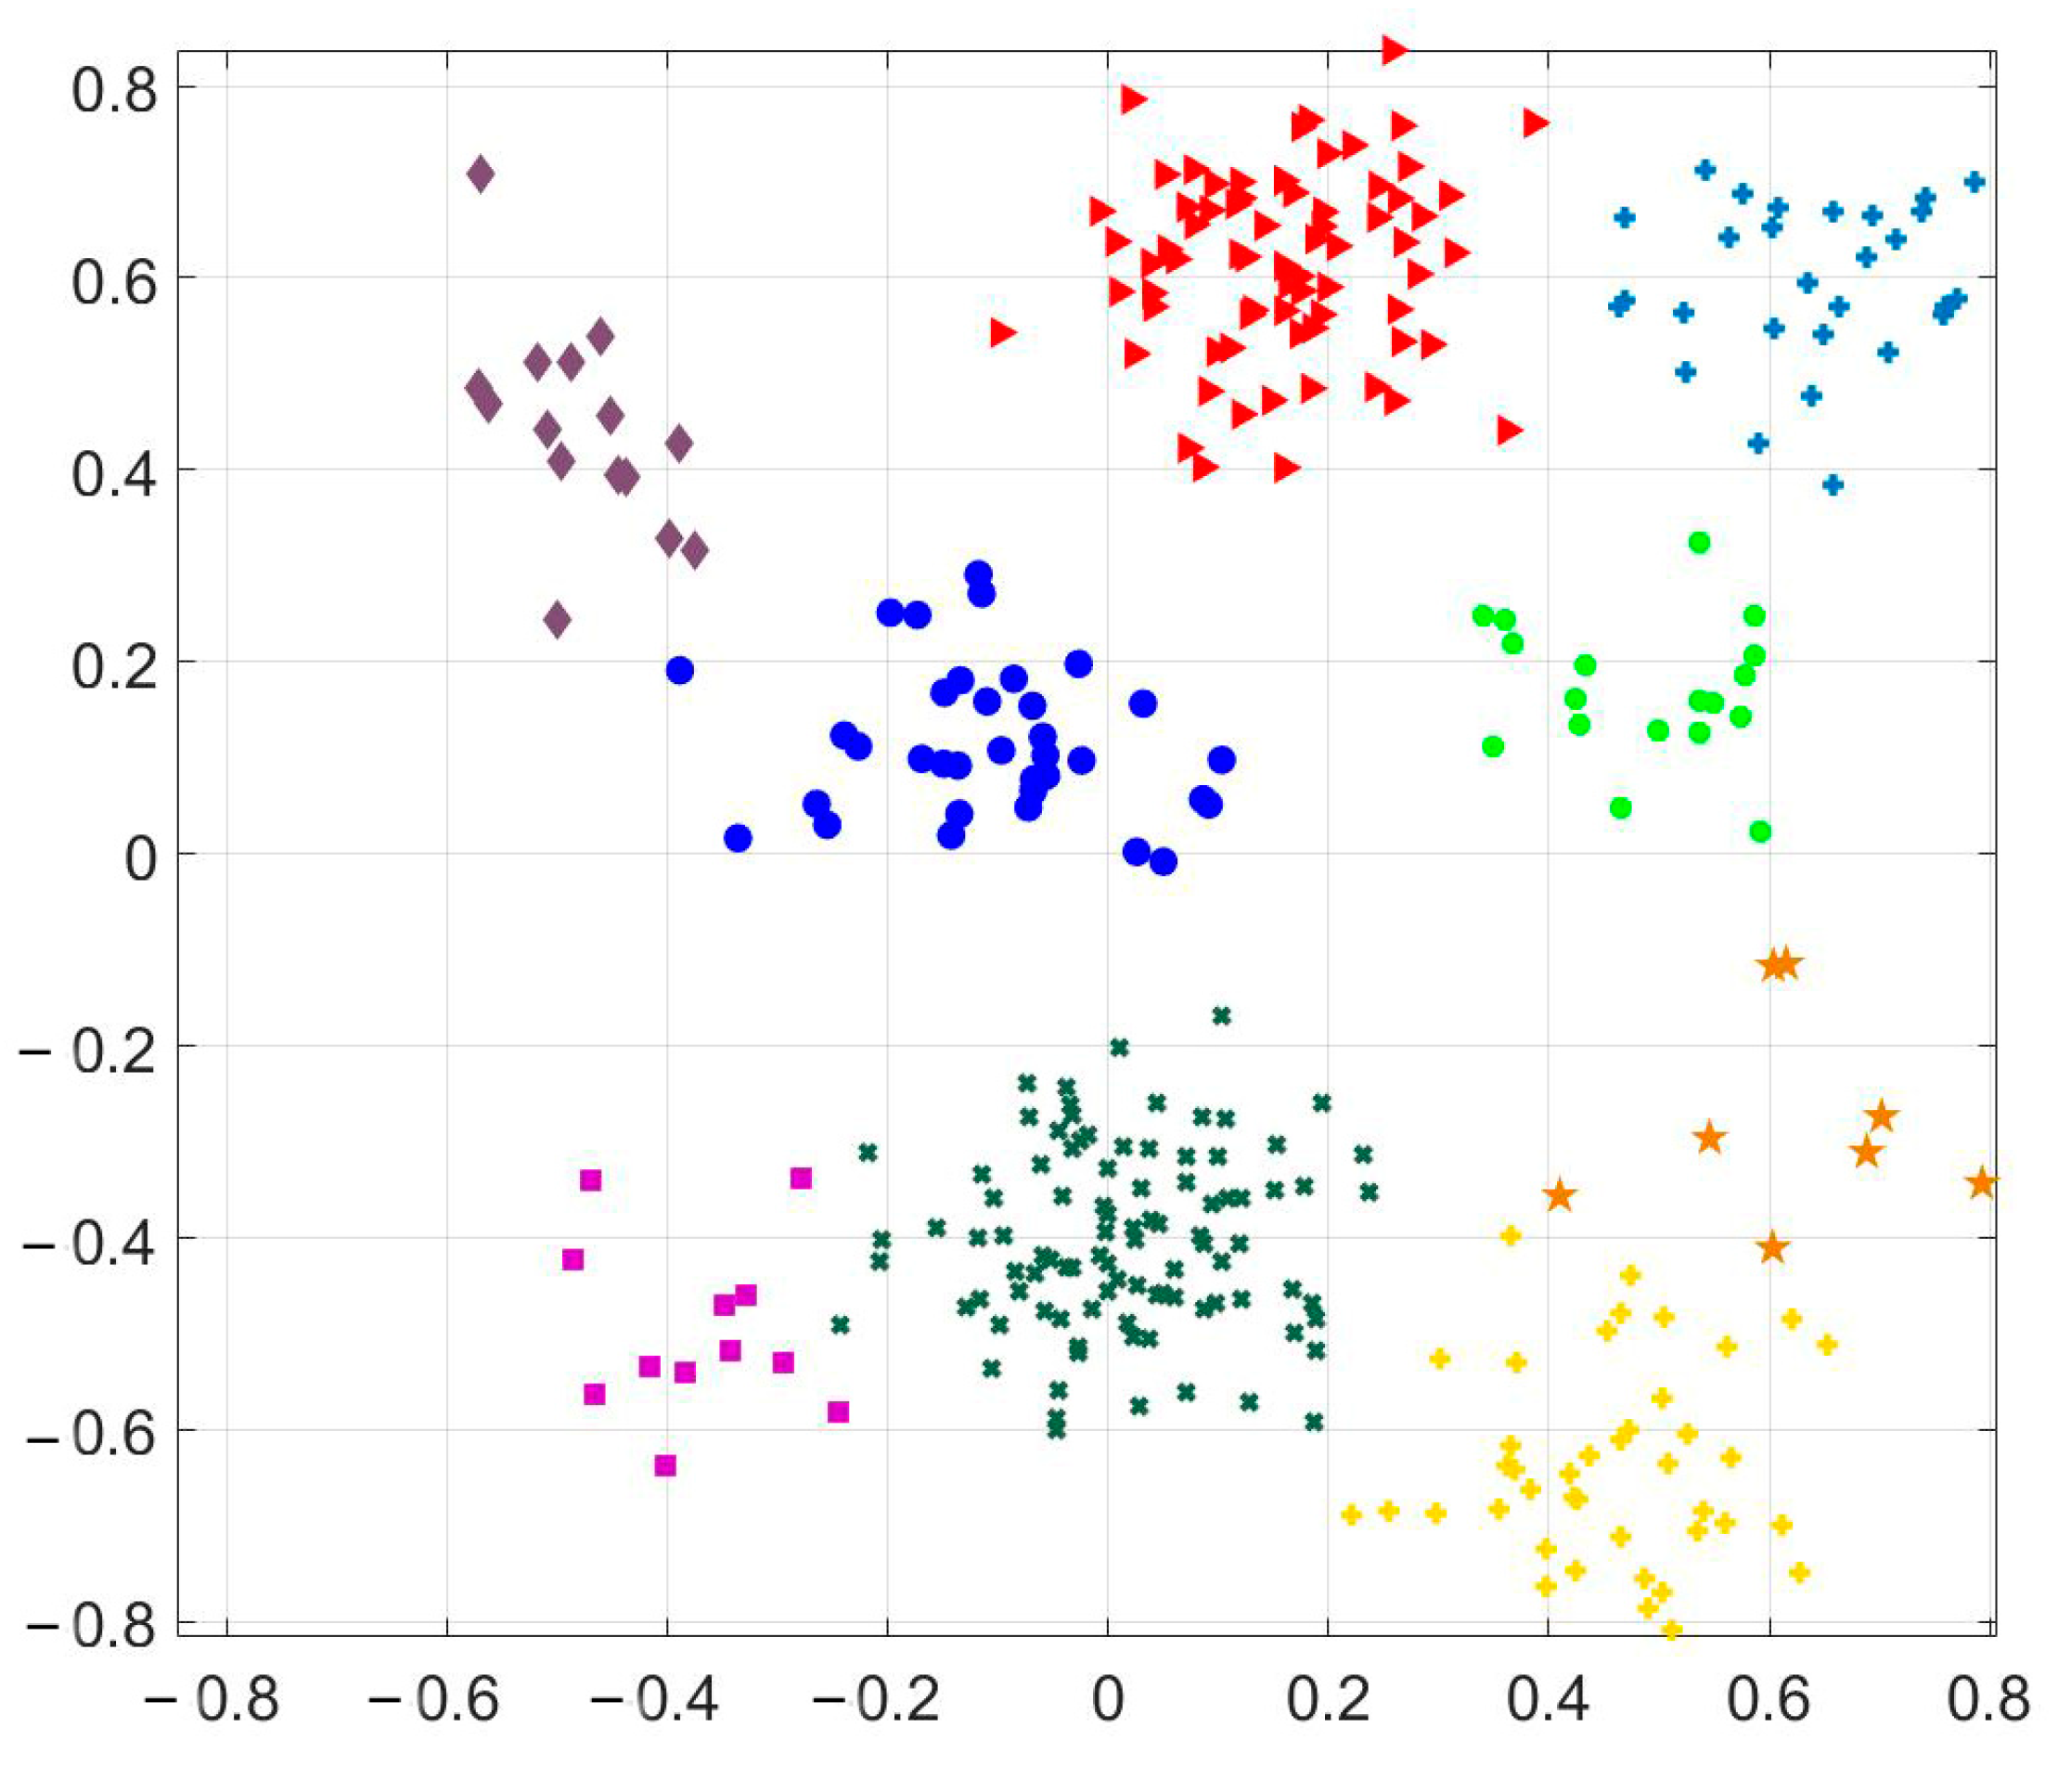
4.2.3. Topic clustering based on K-means clustering based on LDA topic model

According to the keyword co-occurrence matrix, the keywords were divided into different categories. Whether the high-frequency keyword threshold is reasonable or not will significantly impact the co-word analysis results. This article adopts Pareto’s law selection method to set the point. In Table 3. Based on the 60 high-frequency words, a threshold value of 20 was established, and the keywords in the co-word matrix were clustered using the K-means clustering based on the LDA topic model algorithm; the threshold was correctly defined.
We calculated the model’s perplexity under each number of topics and plotted the line graph in Figure 6. There is a clear inflection point in the confusion curve from the graph when the number of topics is nine. Additionally, the curve flattens out, indicating that increasing the number of topics again does not significantly reduce the confusion. Therefore, the optimal number of topics is determined to be nine.
The document-potential-topic model output by the LDA topic model is used as samples, and the category is set to nine. In turn, K-means clustering is performed, and the effect of clustering K-means based on the LDA topic model is shown in Figure 6. As shown in Figure 7, the samples are better divided into nine categories, and each category has a clear demarcation line.
Table 4 shows the text topic clustering results based on the K-means clustering based on the LDA topic model algorithm. Cluster1 contained keywords such as policies, regulations, and departments; therefore, it could be summarized as “corporate governance structure”; Cluster2 included consumption and energy; thus, this category was classified as “energy consumption environmental liability information”; Cluster3 contained wastewater and discharge, and was classified as “environmental pollution discharge information”; Cluster4 had waste, and was classified as “waste disposal”; Cluster5 included R&D and environmental protection, and was classified as “environmental governance expenditure”; Cluster6 included ecological protection and fines, and was classified as “environmental penalty expenses”; Cluster7 contained sewage discharge and greening as keywords, and was classified as “environmental greening and sewage discharge expenditure information”; Cluster8 included tax and relief, and was classified as “environmental tax relief”; finally, Cluster9 included awards and revenue as keywords, and the category was summarized as “income from environmental incentives.”
Table 5 presents the K-means clustering based on the LDA topic model-based EID index system. According to the clustering results, a similar EID index system hierarchy was constructed from the EID index system with 9 subject-level structures and 24 index levels. The companies’ environmental disclosure index was measured based on this system, which could be used to assess whether the enterprise EID quality was consistent with regulatory agencies’ requirements.

4.3. EID Index Layer Weight Calculation

Based on the Word2Vec model, we used the skip-gram algorithm to train extended words and obtain a comprehensive word list. The text-similarity of the broad terms was calculated by the TF–IDF model for the EID index system, as shown in Table 6.

4.4. Automatic Scoring of EID Quality

Python was used to read the samples’ enterprise environmental information content, and machine scoring was conducted according to the experimental process. The massive pollution industry’s EID index listed its distribution across industries, as shown in Table 7 and Figure 8.

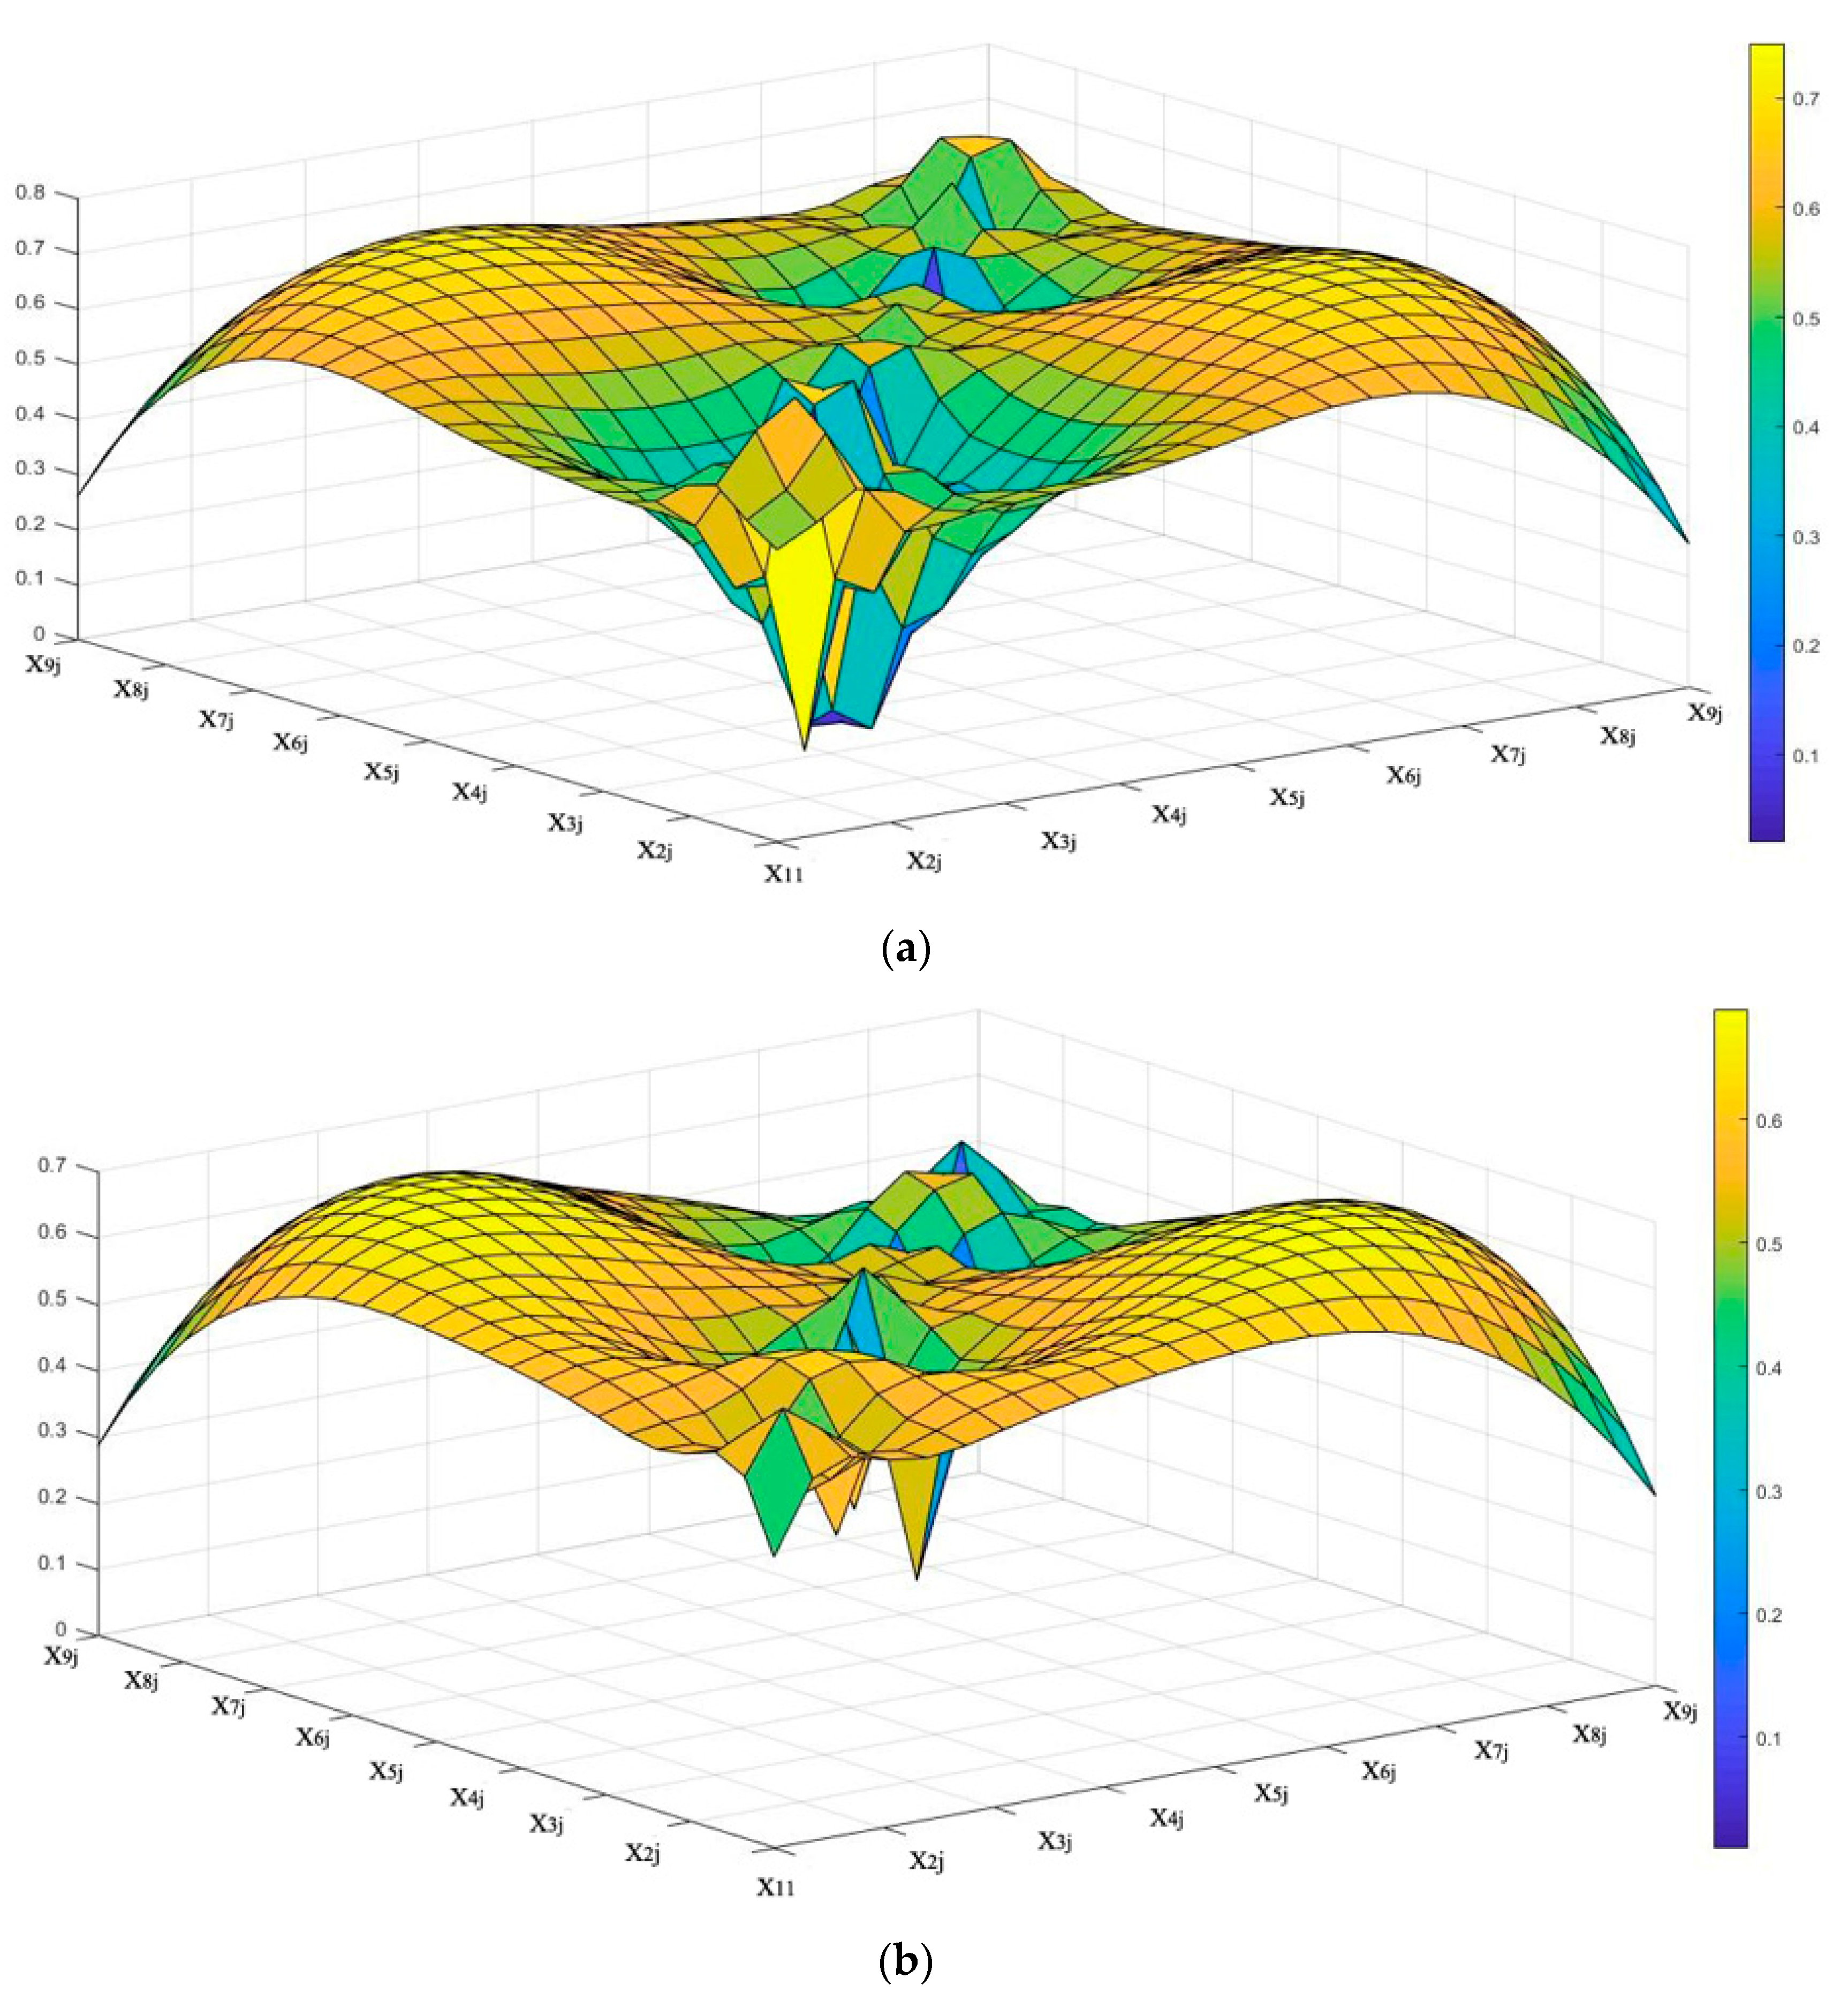
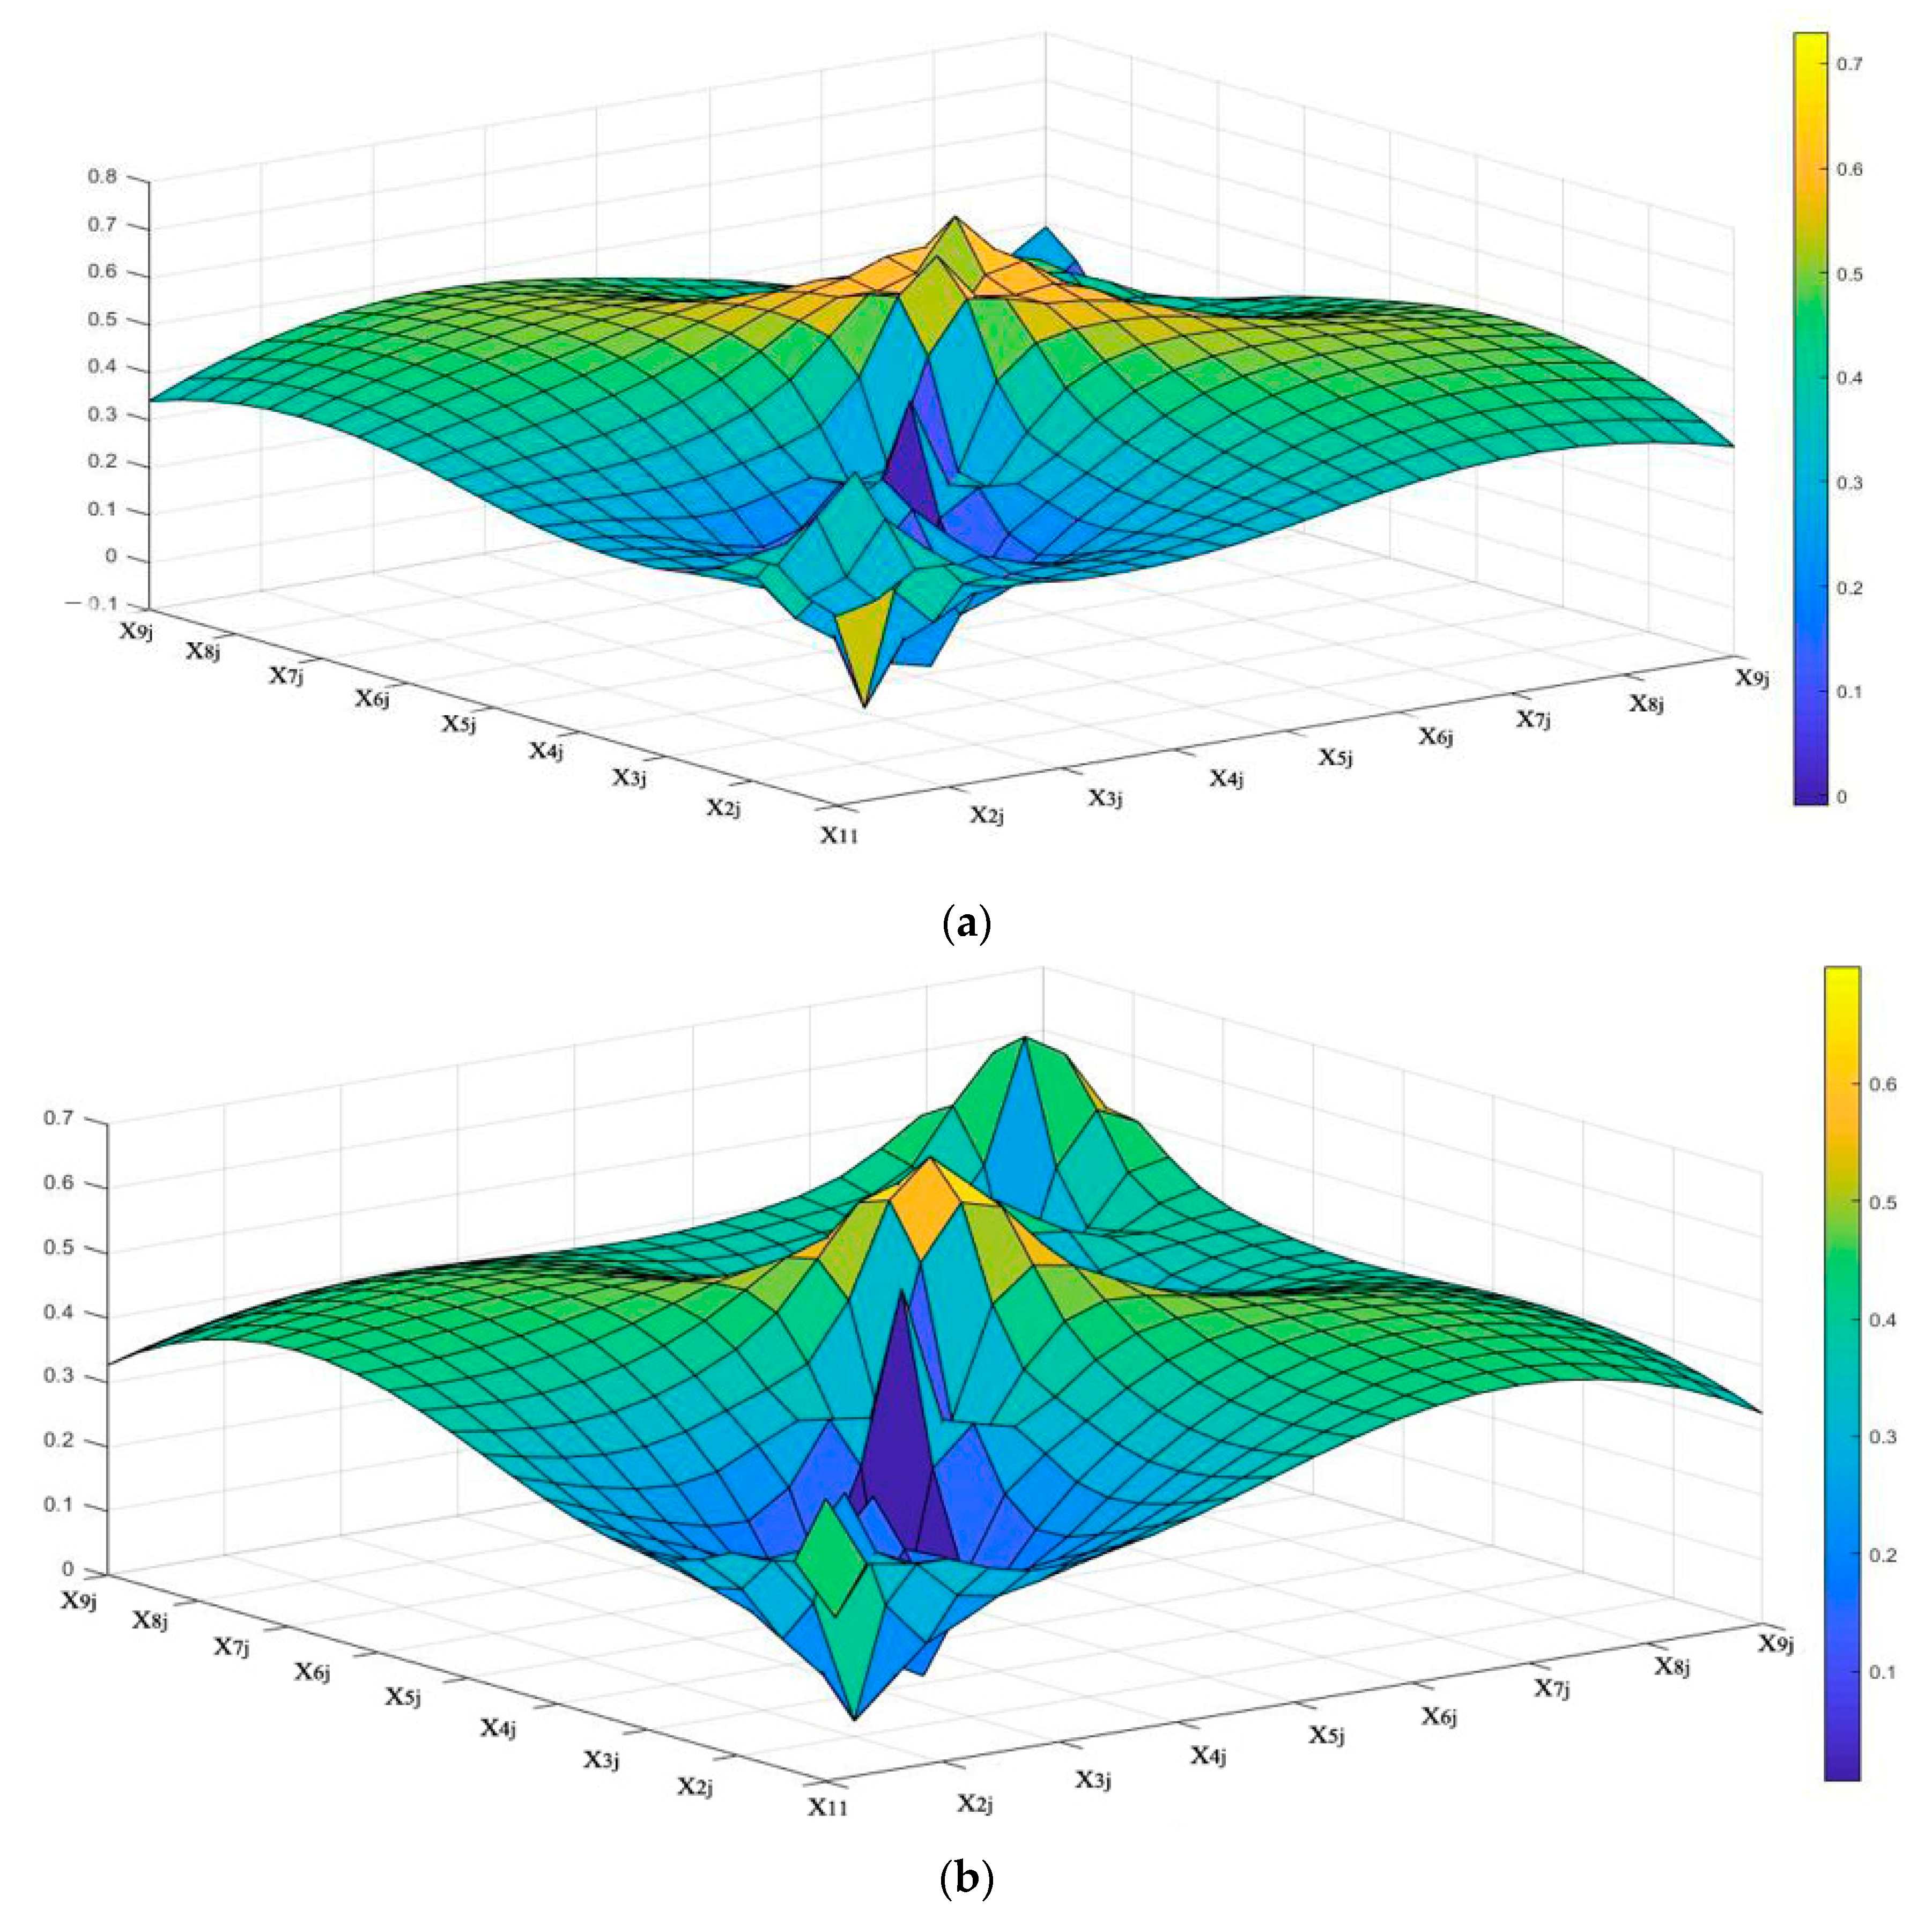
4.5. Constructing the EID-Surface

The purpose of constructing the EID-Surface is to represent all results in the EID–Matrix graphically. The EID-Surface vertical axes show the strengths and weaknesses within EID scores (in Appendix A, Table A1) on a multidimensional coordinate space. Horizontal axes in the EID-Surface representative involve 24 sub-variables distributed in 9 main variables. The construction of the EID-Surface is based on the EID–Matrix results. The EID–Matrix is a three-by-three matrix containing the individual results of all 9 main variables and 24 sub-variables.
EID exponent’s visual processing exponent by EID surface form shows the result of parallelism intuitively through matrix transformation of nine main variables designed in this paper. Considering the matrix’s symmetry and the EID surface’s balance, form a matrix of order three by three. The area of the EID area is calculated by using Equation (7).
  EID-Surface = X 1 j X 2 j X 3 j X 4 j X 5 j X 6 j X 7 j X 8 j X 9 j
This study only presents the EID surface charts for the industries with the top and bottom two EID scores. From the surface graph, it is more intuitive to see the scores on each indicator layer of industry (in Appendix A, Table A1). Figure 9a,b represents C31, the ferrous metal smelting, and rolling processing industry EID-Surface, and B07 oil and gas extraction industry EID-Surface. These two industries have the highest scores. Figure 10a,b represents C17 textile industry EID-Surface and C27 pharmaceutical manufacturing industry EID-Surface. These two industries have the lowest scores.
It can be seen that the environmental disclosure information of the ferrous metal smelting and rolling processing and oil and gas extraction industry was very comprehensive and detailed, and the relevant environmental information was disclosed in the annual and social responsibility reports. The textile, pharmaceutical, paper, leather, fur, feather industries accounted for the low EID quality score for their most proportion.
Under the nine leading indicators, 98% of companies disclosed the corporate governance structure of “environmental policies, guidelines, and concepts,” which is the highest disclosure rate. The construction, investment, and operation costs of environmental protection facilities and the “three wastes” treatment approach were second only to the indicators, which all exceeded 80%. The disclosure rate of environmental responsibility information indicators, such as “emissions and emission reductions” and “emission reduction targets,” was below 30%. Generally, the sample enterprises’ disclosure of environmental information needs to be improved since many vital indicators have not been sufficiently disclosed.

4.6. The Calculation of the EID Index

To compare the degree of environmental information disclosure of 16 in heavy pollution industries better, we calculated the maximum possible score for each sample company’s environmental information disclosure as 24, evaluated by Equation (8) (corporate governance structure scored 7, environmental responsibility scored 1, environmental pollution discharge scored 5, waste disposal scored 2, environmental governance expenditure scored 3, acceptable environmental expenditure scored 1, environmental protection expenditure scored 1, environmental protection tax relief scored 1, environmental rewards scored 3). EID quality evaluation indices for China’s heavily polluting industries in 2013–2017 are listed in Table 8.
EID-Index = EID / 24 × 100 %
As shown in Table 8, the listed companies’ average EID quality evaluation index in China’s heavily polluting industries indicated that the overall EID quality of the listed companies is insufficient. There were also differences in the EID quality evaluation index between the 16 heavily polluting industries. Listed companies in the non-ferrous metal smelting industry, oil and gas extraction industry reported the highest quality corporate environmental information, which was significantly higher than that of other industries. As the focus of environmental protection, these enterprises are facing significant pressure from the government and public. Therefore, they tend to focus on improving the EID quality.
Additionally, most of these enterprises have a large production scale, environmental solid management capabilities, and excellent EID aids in strengthening their market competitiveness. Some listed companies in less-polluting industries, such as pharmaceutical manufacturing, exhibited poor EID performance. Additionally, most listed companies in high-polluting industries are gradually improving the quality of their environmental information. The EID index is related to the enterprises’ commitments, capacity building, business performance, and external environmental regulation changes.
The disclosure score ratio of the “corporate governance structure” indicator was highest. This information was disclosed the most. The ratio of “environmental responsibility information” was lowest, significantly lower than those of the other indicators. The listed companies in China’s heavily polluting industries were more active and comprehensive in disclosing their environmental protection requirements, environmental protection concepts, and additional relevant information. They tended to respond proactively to China’s rising enthusiasm toward environmental protection in recent years, formulate environmental protection policies, and have been committed to establishing the company’s environmental protection image. Listed companies in China’s heavily polluting industries rarely disclose their environmental requirements due to a lack of environmental constraints. It should be noted that the “environmental pollution emissions” indicator score was very high because listed companies in China’s heavily polluting industries have actively responded to the latest EID policy requirements announced by the China Securities Regulatory Commission and promoted various “three wastes.” The pollutant discharge data have also been actively disclosed.

4.7. Testing the Evaluation

Researchers have recently conducted manual surveys and evaluations of the EID of listed companies in China. In 2016 and 2017, 172 listed Shanghai Stock Exchange companies were selected by the Environmental and Economic Research Center of Fudan University. The quality and quality of their EID and public disclosure information was analyzed from the 2015 and 2016 annual, corporate social responsibility, sustainable development, and environmental reports, and the index scores were ranked. Thus, this report was authoritative in the industry.
The evaluation results were further compared based on machine evaluation and artificial subjective evaluation to verify the results’ reliability. The automatic scoring approach was used to reassess the enterprise EID scores for the same sample of 172 listed companies in 2015 and 2016. Given the difference between the respective index system’s construction and the score, the scores cannot be directly compared.
Therefore, rank and nonparametric tests were conducted to compare the same sample of companies’ rankings [70]. The rank-sum test is only used to reach particular values in a given parameter distribution.
Sort the scoring results according to the company’s stock code to obtain two sets of random sequences and use the correlation coefficient between the two sets of sequences to measure the consistency of the two scoring methods. The correlation coefficient is,
γ = i = 1 n x i x ¯ y i y ¯ i = 1 n ( x i x ¯ ) 2 i = 1 n ( y i y ¯ ) 2
where Xi, x i ,   y i is manual and machine scoring, and x ¯ , y ¯  Are the sample mean. The new method of evaluating the quality of EID based on machine scoring provided reliable results of the quality of corporate EID. The corresponding results of the rank and rank test are shown in Table 9.
For a significance of 0.01, the respective values corresponding to the annual P-statistics were always more significant than the critical importance of 0.05.
Therefore, there was no significant difference between the two approaches’ evaluation results, and the new method of EID quality evaluation based on machine scoring is accurate. Additionally, the original form can save more time and achieve better accuracy than the traditional subjective evaluation method.

5. Conclusions

In conclusion, key findings suggest that it helps investigate firms’ strategic sustainability intentions based on the critical issues identified in their EID quality. This paper aims to propose a new method to evaluate the subjectivity and objectivity of environmental information disclosure based on text mining tools, enrich the research content, and open up more text data sources. The research content and information sources of text big data in environmental management can be further refined and enriched.
First, the TM method was used to improve the current EID index system. The EID index system’s content was adjusted dynamically, and complete corpora and scoring systems of the EID quality were also constructed. The EID quality scoring system could generate indices at all levels and corresponding indicator-layer weights under various classification dimensions according to different scoring standards required. The accuracy of the index scoring standard was significantly improved through the proposed method. This analysis no longer requires simple manual counting and judging or the simplified mathematical conversion method. The EID index scoring value extraction was convenient and quick, and the accuracy was significantly improved.
Second, calculating the comprehensive evaluation index of enterprise EID was enriched based on the K-means clustering based on the LDA topic model algorithm and Word2Vec model. The more comprehensive exploration and application of the EID index calculation via the proposed method than the current artificial subjective index calculation model ensures comprehensive, objective, and valuable information disclosure and overcomes the limitations of the previous synthetic personal calculation method. The combination of multiangle measurements based on TM could more accurately and objectively reflect the content and extent of environmental information disclosed in enterprise reports. The resulting EID index was more representative and convincing. The proposed method could comprehensively represent an enterprise’s EID status.
Third, machine scoring resolves the inefficiency and limitation of human subjective judgment regarding corporate EID quality. According to the machine scoring results, China’s listed companies in heavily polluting industries exhibited moderate EID performance. Although most companies are striving to improve, only some high energy-consuming industries achieved a relatively high EID score. The environmental protection requirements of listed companies in China’s heavily polluting industries are rarely disclosed, and the Chinese government lacks sufficient constraints regarding corporate environmental liability requirements.
Our work’s main limitation is mining the quantity and quality of company environment information disclosure from text content. Future research should try to apply more advanced text mining instruments closer to LSA, LDA, and other implicit topic models. Human language leads to more similar results to those obtained from the content analysis.
This study offers several possibilities for further work. Machine learning technology can be improved to better mine and assess EID performance and explore the internal and external mechanisms. Additionally, the environmental information disclosure corpus can be further improved and be better applied to evaluation methods. This study only conducted empirical research based on heavy pollution industry-related enterprises. Therefore, to analyze the accuracy and reliability of the way, we should further expand the practical research samples’ scope. Finally, the quality of enterprises’ environmental information disclosure will significantly affect the government’s formulation of relevant policies and public behavior. Therefore, it is also necessary to study EID quality measurement’s economic impacts on enterprises and policy choices.
In 2020, the Securities and Futures Commission of China revised the Guidelines on Investor Relations Management for Listed Companies, including communication on “information on environmental protection, social responsibility, and corporate governance of companies.” Our team will continue to follow the development of this ESG practice in China. ESG related research will also become the future research direction of our team.

Author Contributions

Conceptualization, R.C. and T.L.; methodology, R.C.; software, X.D.; validation, R.C., T.L., and X.D.; formal analysis, R.C.; investigation, R.C.; resources, R.C.; data curation, R.C.; writing—original draft preparation, R.C.; writing—review and editing, T.L.; visualization, R.C.; supervision, R.C.; project administration, T.L.; funding acquisition, T.L. All authors have read and agreed to the published version of the manuscript.

Funding

This research was funded by the National Natural Science Foundation of China [Grant No. 72074212] and the fundamental research funds for the proposed cultivation project for Ningbo Small Business Growth Research Base [No.2020XQY006].

Institutional Review Board Statement

Not applicable.

Informed Consent Statement

Not applicable.

Data Availability Statement

All data generated or analyzed during this study are included in this article.

Conflicts of Interest

The authors declare no conflict of interest.

Appendix A

Table A1. The average score for each indicator level of China’s 16 heavily polluting industries.
Thematic LayerIndex LayerChina’s 16 Heavily Polluting Industries
B06 B07 B80 B09 C17 C19 C22C25C26C27C28C30C31C32C33 D44
(X1)(X11)0.39 0.44 0.44 0.49 0.44 0.44 0.36 0.44 0.43 0.30 0.52 0.44 0.53 0.40 0.38 0.45
(X12)0.48 0.64 0.12 0.34 0.23 0.46 0.40 0.41 0.46 0.35 0.49 0.23 0.61 0.43 0.24 0.24
(X13)0.55 0.54 0.67 0.64 0.40 0.64 0.50 0.62 0.62 0.54 0.75 0.46 0.75 0.54 0.36 0.54
(X14)0.46 0.46 0.01 0.12 0.02 0.12 0.03 0.46 0.46 0.01 0.04 0.06 0.08 0.06 0.46 0.46
(X15)0.56 0.61 0.24 0.40 0.16 0.16 0.01 0.48 0.41 0.30 0.43 0.33 0.68 0.38 0.18 0.40
(X16)0.66 0.63 0.50 0.60 0.32 0.60 0.32 0.59 0.54 0.43 0.59 0.36 0.68 0.48 0.48 0.43
(X17)0.58 0.58 0.01 0.12 0.04 0.01 0.67 0.55 0.07 0.01 0.10 0.67 0.07 0.14 0.67 0.14
(X2)(X21)0.49 0.30 0.01 0.68 0.01 0.17 0.01 0.69 0.51 0.01 0.01 0.56 0.02 0.69 0.58 0.68
(X3)(X31)0.58 0.60 0.68 0.60 0.57 0.59 0.50 0.61 0.55 0.50 0.55 0.52 0.58 0.62 0.55 0.57
(X32)0.32 0.29 0.38 0.20 0.13 0.04 0.10 0.24 0.15 0.11 0.11 0.18 0.24 0.18 0.19 0.11
(X33)0.57 0.63 0.52 0.55 0.56 0.57 0.55 0.56 0.54 0.53 0.52 0.57 0.58 0.57 0.54 0.54
(X34)0.40 0.49 0.59 0.52 0.70 0.49 0.54 0.59 0.57 0.71 0.72 0.66 0.60 0.62 0.68 0.53
(X35)0.60 0.57 0.48 0.52 0.57 0.48 0.55 0.48 0.50 0.52 0.56 0.51 0.51 0.53 0.53 0.53
(X4)(X41)0.37 0.51 0.71 0.44 0.18 0.60 0.51 0.66 0.72 0.73 0.69 0.68 0.61 0.76 0.70 0.62
(X42)0.34 0.54 0.54 0.54 0.54 0.54 0.54 0.54 0.55 0.55 0.54 0.54 0.54 0.55 0.54 0.55
(X5)(X51)0.57 0.53 0.53 0.53 0.39 0.48 0.53 0.56 0.51 0.39 0.53 0.53 0.59 0.54 0.45 0.56
(X52)0.13 0.01 0.01 0.24 0.01 0.04 0.02 0.06 0.01 0.01 0.01 0.24 0.10 0.03 0.03 0.08
(X53)0.52 0.42 0.32 0.48 0.36 0.29 0.59 0.50 0.50 0.43 0.47 0.48 0.60 0.49 0.45 0.49
(X6)(X61)0.38 0.55 0.28 0.34 0.46 0.46 0.53 0.47 0.40 0.49 0.46 0.49 0.51 0.48 0.50 0.31
(X7)(X71)0.46 0.55 0.44 0.42 0.37 0.25 0.44 0.63 0.50 0.44 0.40 0.43 0.66 0.50 0.30 0.48
(X8)(X81)0.19 0.15 0.22 0.57 0.26 0.57 0.26 0.26 0.24 0.30 0.50 0.26 0.37 0.20 0.27 0.20
(X9)(X91)0.64 0.55 0.77 0.69 0.64 0.70 0.60 0.01 0.61 0.01 0.61 0.58 0.65 0.65 0.54 0.65
(X92)0.43 0.41 0.41 0.73 0.54 0.73 0.41 0.23 0.55 0.27 0.56 0.50 0.66 0.40 0.36 0.48
(X93)0.53 0.38 0.50 0.50 0.36 0.29 0.28 0.54 0.46 0.39 0.48 0.38 0.39 0.65 0.21 0.54
11.20 11.38 9.38 11.26 8.26 9.72 9.25 11.18 10.86 8.33 10.64 10.66 11.61 10.89 10.19 10.58

References

  1. Chen, H.; An, M.; Wang, Q.; Ruan, W.; Xiang, E. Military executives, and corporate environmental information disclosure: Evidence from China. J. Clean Prod. 2021, 278, 123404. [Google Scholar] [CrossRef]
  2. Lu, J.; Li, H. The impact of government environmental information disclosure on enterprise location choices: Heterogeneity and threshold effect test. J. Clean Prod. 2020, 277, 124055. [Google Scholar] [CrossRef]
  3. Graafland, J.; Gerlach, R.J.E. Economic freedom, internal motivation, and corporate environmental responsibility of SMEs. Environ. Resour. Econ. 2019, 74, 1101–1123. [Google Scholar] [CrossRef] [Green Version]
  4. Omer, A.M. Energy, environment and sustainable development. Renew. Sustain. Energy Rev. 2008, 12, 2265–2300. [Google Scholar] [CrossRef]
  5. Kouloukoui, D.; de Oliveira Marinho, M.M.; da Silva Gomes, S.M.; Kiperstok, A.; Torres, E.A. Corporate climate risk management and the implementation of climate projects by the world’s largest emitters. J. Clean Prod. 2019, 238, 117935. [Google Scholar] [CrossRef]
  6. da Silva, P.C.; de Oliveira Neto, G.C.; Correia, J.M.F.; Tucci, H.N.P. Evaluation of economic, environmental and operational performance of the adoption of cleaner production: Survey in large textile industries. J. Clean Prod. 2020, 278, 123855. [Google Scholar] [CrossRef]
  7. Yang, R.; Wong, C.W.Y.; Miao, X. Analysis of the trend in the knowledge of environmental responsibility research. J. Clean Prod. 2021, 278, 123402. [Google Scholar] [CrossRef]
  8. Antons, D.; Grünwald, E.; Cichy, P.; Salge, T.O.J.R. The application of text mining methods in innovation research: Current state, evolution patterns, and development priorities. R&D Manag. 2020, 50, 329–351. [Google Scholar]
  9. Tadros, H.; Magnan, M.J.S.A. How does environmental performance map into environmental disclosure? Sustain. Account. Manag. Policy J. 2019. [Google Scholar] [CrossRef]
  10. Chen, W.Y.; Cho, F.H.T. Environmental information disclosure and societal preferences for urban river restoration: Latent class modeling of a discrete-choice experiment. J. Clean Prod. 2019, 231, 1294–1306. [Google Scholar] [CrossRef]
  11. Ahmad, N.; Li, H.-Z.; Tian, X.-L. Increased firm profitability under a nationwide environmental information disclosure program? Evidence from China. J. Clean Prod. 2019, 230, 1176–1187. [Google Scholar] [CrossRef]
  12. Rivière-Giordano, G.; Giordano-Spring, S.; Cho, C.H. Does the level of assurance statement on environmental disclosure affect investor assessment? Sustain. Account. Manag. Policy J. 2018. [Google Scholar] [CrossRef]
  13. Beattie, V.; McInnes, B.; Fearnley, S. A methodology for analyzing and evaluating narratives in annual reports: A comprehensive descriptive profile and metrics for disclosure quality attributes. Account. Forum 2004, 28, 205–236. [Google Scholar] [CrossRef] [Green Version]
  14. Michelon, G.; Pilonato, S.; Ricceri, F. CSR reporting practices and the quality of disclosure: An empirical analysis. Crit. Perspect. Account. 2015, 33, 59–78. [Google Scholar] [CrossRef] [Green Version]
  15. Qin, Y.; Harrison, J.; Chen, L. A framework for the practice of corporate environmental responsibility in China. J. Clean Prod. 2019, 235, 426–452. [Google Scholar] [CrossRef]
  16. Clarkson, P.M.; Fang, X.; Li, Y.; Richardson, G. The relevance of environmental disclosures: Are such disclosures incrementally informative? J. Account. Public Policy 2013, 32, 410–431. [Google Scholar] [CrossRef]
  17. Fan, L.; Yang, K.; Liu, L. New media environment, environmental information disclosure, and firm valuation: Evidence from high-polluting enterprises in China. J. Clean Prod. 2020, 277, 123253. [Google Scholar] [CrossRef]
  18. Lu, Y.; Abeysekera, I. Stakeholders’ power, corporate characteristics, and social and environmental disclosure: Evidence from China. J. Clean Prod. 2014, 64, 426–436. [Google Scholar] [CrossRef] [Green Version]
  19. Zeng, S.X.; Xu, X.D.; Dong, Z.Y.; Tam, V.W. Towards corporate environmental information disclosure: An empirical study in China. J. Clean Prod. 2010, 18, 1142–1148. [Google Scholar] [CrossRef]
  20. Pejić Bach, M.; Krstić, Ž.; Seljan, S.; Turulja, L. Text mining for extensive data analysis in financial sector: A literature review. Sustainability 2019, 11, 1277. [Google Scholar] [CrossRef] [Green Version]
  21. Wiseman, J. An evaluation of environmental disclosures made in corporate annual reports. Account. Organ. Soc. 1982, 7, 53–63. [Google Scholar] [CrossRef]
  22. Al-Tuwaijri, S.A.; Christensen, T.E.; Hughes Ii, K. The relations among environmental disclosure, environmental performance, and economic performance: A simultaneous equations approach. Account. Organ. Soc. 2004, 29, 447–471. [Google Scholar] [CrossRef]
  23. Aerts, W.; Cormier, D. Media legitimacy and corporate environmental communication. Account. Organ. Soc. 2009, 34, 1–27. [Google Scholar] [CrossRef]
  24. De Villiers, C.; Van Staden, C.J. Can less environmental disclosure have a legitimizing effect? Evidence from Africa. Account. Organ. Soc. 2006, 31, 763–781. [Google Scholar] [CrossRef]
  25. Cho, C.H.; Patten, D.M. The role of environmental disclosures as tools of legitimacy: A research note. Account. Organ. Soc. 2007, 32, 639–647. [Google Scholar] [CrossRef]
  26. Neu, D.; Warsame, H.; Pedwell, K. Managing public impressions: Environmental disclosures in annual reports. Account. Organ. Soc. 1998, 23, 265–282. [Google Scholar] [CrossRef]
  27. Rhodes, S.; Kartell, B.; Palmer, C.; Blazek, M. Standardization of the life cycle environmental performance in the energy sector: ASTM draft standard: E067110 quantifying and reporting the environmental performance of electric power generation facilities and infrastructure; Implications to the electronics sector. In Proceedings of the 2006 IEEE International Symposium on Electronics & the Environment, Scottsdale, AZ, USA, 8–11 May 2006; Conference Record. IEEE: New York, NY, USA, 2006; p. 61. [Google Scholar]
  28. Aerts, W.; Cormier, D.; Magnan, M. Corporate environmental disclosure, financial markets, and the media: An international perspective. Ecol. Econ. 2008, 64, 643–659. [Google Scholar] [CrossRef]
  29. Hasseldine, J.; Salama, A.I.; Toms, J.S. Quantity versus quality: The impact of environmental disclosures on the reputations of UK Plcs. Br. Account. Rev. 2005, 37, 231–248. [Google Scholar] [CrossRef] [Green Version]
  30. Beck, A.C.; Campbell, D.; Shrives, P.J. Content analysis in environmental reporting research: Enrichment and rehearsal of the method in a British–German context. Br. Account. Rev. 2010, 42, 207–222. [Google Scholar] [CrossRef]
  31. Rupley, K.H.; Brown, D.; Marshall, R.S. Governance, media and the quality of environmental disclosure. J. Account. Public Policy 2012, 31, 610–640. [Google Scholar] [CrossRef]
  32. O’donovan, G. Environmental disclosures in the annual report. Account. Audit. Account. J. 2002. [Google Scholar] [CrossRef]
  33. Gray, R.; Milne, M.J. It’s not what you do; it’s the way that you do it? Of method and madness. Crit. Perspect. Account. 2015, 32, 51–66. [Google Scholar] [CrossRef] [Green Version]
  34. Neuman, S.P. Maximum likelihood Bayesian averaging uncertain model predictions. Stoch. Environ. Res. Risk Assess. 2003, 17, 291–305. [Google Scholar] [CrossRef]
  35. Feldman, R.; Sanger, J. The Text Mining Handbook: Advanced Approaches in Analyzing Unstructured Data; Cambridge University Press: Cambridge, UK, 2007. [Google Scholar]
  36. Milne, M.J.; Adler, R.W. Exploring the reliability of social and environmental disclosures content analysis. Account. Audit. Account. J. 1999. [Google Scholar] [CrossRef] [Green Version]
  37. Aureli, S. A comparison of content analysis usage and text mining in CSR corporate disclosure. Int. J. Digit. Account. Res. 2017, 17. [Google Scholar] [CrossRef] [Green Version]
  38. Sebestyén, V.; Domokos, E.; Abonyi, J. Focal points for sustainable development strategies—Text mining-based comparative analysis of voluntary national reviews. J. Environ. Manage. 2020. [Google Scholar] [CrossRef]
  39. Yang, H.-C.; Lee, C.-H. Semantics-Based Image Retrieval by Text Mining on Environmental Texts; Document Recognition and Retrieval X, 2003; International Society for Optics and Photonics: Bellingham, WA, USA, 2003; pp. 266–277. [Google Scholar]
  40. Modapothala, J.R.; Issac, B. Assessing corporate environmental and sustainability reports using text mining and bayesian estimate. In Software Technology and Engineering; World Scientific: Singapore, 2009; pp. 151–155. [Google Scholar]
  41. Huang, A.H.; Zang, A.Y.; Zheng, R. Evidence on the information content of text in analyst reports. Account. Rev. 2014, 89, 2151–2180. [Google Scholar] [CrossRef] [Green Version]
  42. Riffe, D.; Lacy, S.; Fico, F.; Watson, B. Analyzing Media Messages: Using Quantitative Content Analysis in Research; Routledge: Abingdon, UK, 2019. [Google Scholar]
  43. Bonzanini, M. Mastering Social Media Mining with Python; Packt Publishing Ltd.: Birmingham, UK, 2016. [Google Scholar]
  44. Lee, J.; Lee, M.J. Measuring Contribution of Spatial Information to Environmental Research Using Text Mining Techniques. In Proceedings of the IGARSS 2018—2018 IEEE International Geoscience and Remote Sensing Symposium, Valencia, Spain, 22–27 July 2018; IEEE: New York, NY, USA, 2018; pp. 5289–5291. [Google Scholar]
  45. Maeda, T.; Chujo, Y.; Park, E. Text Mining Analysis on Determinants of Environmental Costs Expenditure as Time Series Data. In Proceedings of the 3rd Technology Innovation Management and Engineering Science International Conference (TIMES-iCON), Bangkok, Thailand, 12–14 December 2018; IEEE: New York, NY, USA, 2018; pp. 1–5. [Google Scholar]
  46. Lock, I.; Seele, P. Quantitative content analysis as a method for business ethics research. Bus. Ethics Eur. Rev. 2015, 24, S24–S40. [Google Scholar] [CrossRef]
  47. Park, K.; Kremer, G.E.O. Text mining-based categorization and user perspective analysis of environmental sustainability indicators for manufacturing and service systems. Ecol. Indic. 2017, 72, 803–820. [Google Scholar] [CrossRef]
  48. Rabiei, M.; Hosseini-Motlagh, S.-M.; Haeri, A. Using text mining techniques for identifying research gaps and priorities: A case study of the environmental science in Iran. Scientometrics 2017, 110, 815–842. [Google Scholar] [CrossRef]
  49. Villeneuve, H.; O’Brien, W.J.B. Environment, Listen to the guests: Text-mining Airbnb reviews to explore indoor environmental quality. Build. Environ. 2020, 169, 106555. [Google Scholar] [CrossRef]
  50. Wang, F.; Peng, X.; Qin, Y.; Wang, C. What can the news tell us about the environmental performance of tourist areas? A text mining approach to China’s National 5A Tourist Areas. Sustain. Cities Soc. 2020, 52, 101818. [Google Scholar] [CrossRef]
  51. Prihatini, P.M.; Suryawan, I.K.; Mandia, I.N. Feature extraction for document text using Latent Dirichlet Allocation. J. Phys. Conf. Ser. 2018, 953, 12047. [Google Scholar] [CrossRef]
  52. Alhawarat, M.; Hegazi, M. Revisiting K-Means and Topic Modeling. a Comparison Study to Cluster Arabic Documents. IEEE Access 2018, 6, 42740–42749. [Google Scholar] [CrossRef]
  53. Bui, Q.V.; Sayadi, K.; Amor, S.B.; Bui, M. Combining Latent Dirichlet Allocation and K-Means for documents Clustering; Effect of Probabilistic Based Distance Measures. In Proceedings of the Asian Conference on Intelligent Information and Database Systems, Kanazawa, Japan, 3–5 April 2017; pp. 212–232. [Google Scholar]
  54. Salton, G.; Allan, J.; Buckley, C.; Singhal, A. Automatic analysis, theme generation, and summarization of machine-readable texts. Science 1994, 264, 1421–1426. [Google Scholar] [CrossRef] [PubMed]
  55. Mikolov, T.; Chen, K.; Corrado, G.; Dean, J. Efficient Estimation of Word Representations in Vector Space. arXiv 2013, arXiv:1301.3781. Available online: https://arxiv.org/abs/1301.3781 (accessed on 4 July 2020).
  56. McCormick, C. Word2vec Tutorial-the Skip-Gram Model. In Retrieved: 2016. Available online: http://mccormickml.com/2016/04/19/word2vec-tutorial-the-skip-gram-model (accessed on 8 March 2020).
  57. Salton, G.; Yang, C.-S.; Yu, C.T. A theory of term importance in automatic text analysis. J. Am. Soc. Inf. Sci. 1975, 26, 33–44. [Google Scholar] [CrossRef] [Green Version]
  58. Christian, H.; Agus, M.P.; Suhartono, D. Single document automatic text summarization using term frequency-inverse document frequency (TF-IDF). ComTech Comput. Math. Eng. Appl. 2016, 7, 285–294. [Google Scholar] [CrossRef]
  59. Aizawa, A. An information-theoretic perspective of tf–idf measures. Inf. Process. Manag. 2003, 39, 45–65. [Google Scholar] [CrossRef]
  60. Liew, W.T.; Adhitya, A.; Srinivasan, R. Sustainability trends in the process industries: A text mining-based analysis. Comput. Ind. 2014, 65, 393–400. [Google Scholar] [CrossRef]
  61. Liu, F.; Liu, F.; Liu, Y. Automatic keyword extraction for the meeting corpus using supervised approach and bigram expansion. In Proceedings of the 2008 IEEE Spoken Language Technology Workshop, Goa, India, 15–19 December 2008; IEEE: New York, NY, USA, 2008; pp. 181–184. [Google Scholar]
  62. Tsai, M.-F.; Wang, C.-J. Financial keyword expansion via continuous word vector representations. In Proceedings of the 2014 Conference on Empirical Methods in Natural Language Processing (EMNLP), Doha, Qatar, 25–29 October 2014; pp. 1453–1458. [Google Scholar]
  63. Ruiz Estrada, M.A. The Policy Modeling Research Consistency Index (PMC-Index); Available at SSRN 1689475; Social Science Electronic Publishing: Rochester, NY, USA, 2010. [Google Scholar]
  64. Estrada, M.A.R. Policy modeling: Definition, classification, and evaluation. J. Policy Modeling 2011, 33, 523–536. [Google Scholar] [CrossRef]
  65. Zhang, X.; Ma, M.; Cheng, J. Regulation effect of external pressure to the enterprise environment disclosure. Soft Sci. 2016, 30, 74–78. [Google Scholar]
  66. Mandelbrot, B. New methods in statistical economics. J. Political Econ. 1963, 71, 421–440. [Google Scholar] [CrossRef]
  67. Donohue, J.C. Understanding Scientific Literature: A Bibliometric Approach; Back to cited text 12; The Massachusetts Institute of Technology Press: Cambridge, MA, USA, 1974; p. 101. [Google Scholar]
  68. Drake, L. The non-market value of the Swedish agricultural landscape. Eur. Rev. Agric. Econ. 1992, 19, 351–364. [Google Scholar] [CrossRef]
  69. Costas, R.; Bordons, M. Is g-index better than h-index? An exploratory study at the individual level. Scientometrics 2008, 77, 267–288. [Google Scholar] [CrossRef] [Green Version]
  70. Woolson, R. Wilcoxon signed-rank test. In Wiley Encyclopedia of Clinical Trials; John Wiley & Sons, Inc.: Hoboken, NJ, USA, 2007; pp. 1–3. [Google Scholar]
Figure 1. Flow chart of the analysis procedure.
Sustainability 13 05415 g001
Figure 2. Automatic EID quality evaluation framework.
Sustainability 13 05415 g002
Figure 3. Construction of the EID index system.
Sustainability 13 05415 g003
Figure 4. Extended word similarity calculation.
Sustainability 13 05415 g004
Figure 5. Automatic scoring of the EID quality.
Sustainability 13 05415 g005
Figure 6. The choice of K-means clustering is based on the LDA topic model.
Sustainability 13 05415 g006
Figure 7. Clustering results graph.
Sustainability 13 05415 g007
Figure 8. Distribution map of the EID quality score for China’s heavily polluting industries in 2013–2017.
Sustainability 13 05415 g008
Figure 9. (a) C31 ferrous metal smelting and rolling processing industry EID-Surface and (b) B07 oil and gas extraction industry EID-Surface.
Sustainability 13 05415 g009
Figure 10. (a) C17 textile industry EID-Surface and (b) C27 pharmaceutical manufacturing industry EID-Surface.
Sustainability 13 05415 g010
Table 1. High-frequency vocabulary statistics table.
High-Frequency WordsFrequencyHigh-Frequency WordsFrequency High-Frequency WordsFrequency
Environment511,1060.011119 Construction66,3050.001442 Industry24,7780.000539
Protection510,0090.011095 Service61,8090.001345 Energy24,3960.000531
Cost-effective497,9840.010834 Invention60,0130.001306 Funds21,4120.000466
Investment487,2380.010600 Science59,5440.001295 Improvement21,1160.000459
Project452,8140.009851 Investment58,5480.001274 Operation17,8290.000388
Cost188,5220.004101 Economy55,9600.001217 Reduction15,7300.000342
Pollution163,8310.003564 Responsibility55,2750.001203 Safeguard15,7270.000342
Development137,7240.002996 Chemistry54,8050.001192 Manufacture13,9610.000304
Management136,6660.002973 Society53,0200.001153 Power10,3380.000225
Production134,8630.002934 Accomplishment51,7530.001126 Patent10,0910.000220
Reduction
2/5000
reduce
109,3700.002379 Execution50,2660.001094 Equipment84310.000183
Matters109,2370.002376 System50,0700.001089 Retrofit83930.000183
Emission103,1760.002245 Conservation46,9190.001021 Engineering79930.000174
Technology102,8480.002237 Safety46,1660.001004 Operation71990.000157
Production98,7630.002149 Governance42,8690.000933 Green71460.000155
Information98,7150.002148 Development28,6050.000622 Decrease70670.000154
Policy97,3510.002118 Enhancement28,3790.000617 Operations63820.000139
Research70,5530.001535 Resources26,6340.000579 Cycle62730.000136
Implement66,8730.001455 Quality26,1310.000568 Waste54370.000118
Fulfillment66,4380.001445 Organization26,0450.000567 Surroundings53210.000116
Table 2. Matrix of co-occurrence words.
EnvironmentProtectionCost-Effective InvestmentProjectCostPollutionDevelopmentManagementProduction
Environment0
Protection3380
Cost-effective391460
Investment8482638120
Project4552140
Cost7216198210
Pollution72278286310
Development211512040
Management6432157100
Production237401721130
Table 3. The set threshold method.
NumberThreshold Definition MethHigh-Frequency ThresholdNumber of High-Frequency Words Extracted
1Pareto’s law selection method [66] 1030
2Donohue method [67]503
3Drake Price method [68]834
4g-index method [69]1026
Table 4. K-means clustering based on LDA topic model clustering results.
Cluster1Cluster2Cluster3Cluster4Cluster5Cluster6Cluster7Cluster8Cluster9
PolicyConsumeWastewaterWaste materialsResearchEnvironmentalSewageTaxReward
SystemEnergyEmissionWaste productProtectionFineGreeningExemptionIncome
DepartmentLossTrashCastoffExpenditureExpenditureServiceFinancialBenefit
ManagementConsumptionPoisonousRecycleEnergy savingCostGovernanceSubsidyUtilization
AimsExpenditureNoiseDisposeSurroundingsPayCleanDiscountExploitation
MeasuresDustEngineeringPunishmentReturnOperations
SystematismGovernance
StandardEquipment
AccidentDetect
Education
Construction
Production
Table 5. EID System for heavily polluting industries.
Thematic LayerIndex LayerConnotation
Corporate
Governance
Structure
(X1)
Environmental protection concept (X11)It mainly refers to the EID management mechanism principles and components. The relevant information reflects the importance of environmental protection by listed companies and their intention to release environmental information. Includes information regarding environmental standards used by listed companies, preparations for environmental management systems, and managers’ attitudes towards ecological management
Environmental management organization (X12)
Environmental goals (X13)
ISO14001 standard (X14)
Environmental accident (X15)
Environmental education and training (X16)
Implement the “Three Simultaneous System” (X17)
Environmental Responsibility
(X2)
Total resource consumption (X21)Shows the specific energy consumption of the company. The company’s total energy consumption can directly reflect its actual performance in energy conservation. Relevant information can be used to assess the managers’ expectations for environmental protection contributions
Environmental Pollution Discharge
(X3)
Wastewater disposal (X31)Describes the company’s specific quantities of waste gas, wastewater, industrial waste, emission noise, and dust. Related information refers to the impacts of the company’s production and operation activities on the natural environment. Relevant information can be used to evaluate the achievements of listed companies in treating environmental pollution.
Stable waste discharge (X32)
Toxic emissions (X33)
Noise emission (X34)
Dust emissions (X35)
Waste Disposal (X4)Waste disposal (X41)Shows the disposal of waste products and waste by listed companies.
Waste recycling (X42)
Environmental Governance Expenditure (X5)Environmental research expenditure (X51)Records the company’s expenditure on environmental management research and development. Reflect the company’s work in environmental protection for some time, including environmental research expenditures, environmental protection governance expenditures, and environmental equipment expenditures. It can prompt companies to take more significant measures in environmental management.
Environmental protection expenditure (X52)
Environmental equipment expenditure (X53)
Environmental Fine Expenditure (X6)Environmental acceptable payment (X61)Companies’ fines for environmental protection
Environmental Protection Expenditure
(X7)
Pollution discharge fee, greening fee, environmental protection fee (X71)Shows the company’s pollution discharge, greening, and environmental protection fees.
Environmental Protection Tax Relief (X8)Tax deduction (X81)Explains the environmental protection tax reduction and exemption of listed companies.
Environmental Rewards (X9)Environmental rewards (X91)
Environmental income (X92)
Waste utilization income (X93)
Explains the companies’ incentive income for environmental protection.
Table 6. The EID index layer weight value.
Thematic LayerIndex LayerIndex Layer Weight Value
Corporate Governance Structure (X1)Environmental protection concept (X11)0.4415
Environmental management organization (X12)0.4899
Environmental goals (X13)0.5394
ISO14001 standard (X14)0.4600
Environmental accident (X15)0.5487
Environmental education and training (X16)0.3706
Implement the “Three Simultaneous System” (X17)0.5476
Environmental Responsibility (X2)Total resource consumption (X21)0.6859
Environmental Pollution Discharge (X3)Wastewater disposal (X31)0.6851
Stable waste discharge (X32)0.2859
Toxic emissions (X33)0.4415
Noise emission (X34)0.4899
Dust emissions (X35)0.4600
Waste Disposal (X4)Waste disposal (X41)0.3706
Waste recycling (X42)0.4899
Environmental Governance Expenditure (X5)Environmental research expenditure (X51)0.5476
Environmental protection expenditure (X52)0.4394
Environmental equipment expenditure (X53)0.5394
Environmental Fine Expenditure (X6)Environmental acceptable payment (X61)0.5476
Environmental Protection Expenditure (X7)Pollution discharge fee, greening fee, environmental protection fee (X71)0.4415
Environmental Protection Tax Relief (X8)Tax deduction (X81)0.4899
Environmental Rewards (X9)Environmental rewards (X91)0.3859
Environmental income (X92)0.4899
Waste utilization income (X93)0.4600
Table 7. EID quality score for China’s heavily polluting industries in 2013–2017.
Industry CodeHeavily Polluting IndustrySamplesEID Quality Scores
20132014201520162017Average
B06Coal mining and washing 2310.97 10.93 11.00 11.34 11.72 11.20
B07Oil and gas extraction311.16 10.52 11.35 11.29 12.59 11.38
B08Ferrous metal mining and dressing 57.86 8.88 9.51 10.16 10.51 9.38
B09Non-ferrous metal mining and dressing1811.28 10.75 11.26 11.27 11.75 11.26
C17Textile 317.117.488.009.219.498.26
C19Manufacturing of leather, fur, feathers 129.20 9.80 9.52 9.89 10.19 9.72
C22Paper and paper products 228.03 8.30 8.70 10.29 10.92 9.25
C25Petroleum processing, coking and nuclear fuel1011.49 10.67 10.73 11.49 11.53 11.18
C26Chemical raw materials and chemical products19810.32 10.65 10.76 11.15 11.42 10.86
C27Pharmaceutical Manufacturing1916.75 7.20 7.95 8.90 10.86 8.33
C28Chemical fibre manufacturing1510.05 10.23 10.33 11.22 11.37 10.64
C30Non-metallic mineral products 7310.21 10.84 10.45 10.75 11.03 10.66
C31Ferrous metal smelting and rolling processing2511.07 11.49 11.56 11.80 12.13 11.61
C32Non-ferrous metal smelting and rolling 5810.60 10.85 10.73 11.01 11.29 10.89
C33Metal products546.03 9.67 9.75 10.30 10.62 10.19
D44Electricity and thermal power production 6310.16 10.36 10.59 10.86 10.94 10.58
Total801
Table 8. The descriptive statistics of EID quality evaluation indices.
IndustryObservationsEnvironmental Information Disclosure Quality Evaluation Index (%)
20132014201520162017MinMaxAVGSD
B062345.708345.541745.833347.250048.833345.541648.833346.63331.5098
B07346.500043.833347.291747.041752.458343.833352.458347.42503.5677
B08532.750037.000039.625042.333343.791732.750043.791639.10003.0040
B091847.000044.791746.916746.958348.958344.791648.958346.92501.7015
C173129.625031.166733.333338.375039.541729.625039.541634.40834.0012
C191238.333340.833339.666741.208342.458338.333342.458340.50001.1502
C222233.458334.583336.250042.875045.500033.458345.500038.53335.2205
C251047.875044.458344.708347.875048.041744.458348.041646.59161.9524
C2619843.000044.375044.833346.458347.583343.000047.583345.25001.4808
C2719128.125030.000033.125037.083345.250028.125045.250034.71676.5947
C281541.875042.625043.041746.750047.375041.875047.375044.33332.4609
C307342.541745.166743.541744.791745.958342.541645.958344.40001.0071
C312546.125047.875048.166749.166750.541746.125050.541648.37501.2040
C325844.166745.208344.708345.875047.041744.166647.041645.40001.0092
C335425.125040.291740.625042.916744.250025.125044.250038.64161.8895
D446342.333343.166744.125045.250045.583342.333345.583344.09161.1031
Table 9. Results of the rank tests.
Text20152016
z-Statistics−0.205−0.012
p-value0.8370.921
Publisher’s Note: MDPI stays neutral with regard to jurisdictional claims in published maps and institutional affiliations.

